Article

Novel Insight into the Role of Squalene Epoxidase (SQLE) Gene in Determining Milk Production Traits in Buffalo

1
National Center for International Research on Animal Genetics, Breeding and Reproduction (NCIRAGBR), College of Animal Science and Technology, Huazhong Agricultural University, Wuhan 430070, China
2
Hubei Province’s Engineering Research Center in Buffalo Breeding and Products, Wuhan 430070, China
*
Author to whom correspondence should be addressed.
These authors contributed equally to this work.
Int. J. Mol. Sci. 2023, 24(3), 2436; https://doi.org/10.3390/ijms24032436
Submission received: 19 December 2022 / Revised: 13 January 2023 / Accepted: 17 January 2023 / Published: 26 January 2023
(This article belongs to the Collection Feature Papers in “Molecular Biology”)

Abstract

:
Understanding the genetic mechanisms underlying milk production traits contribute to improving the production potential of dairy animals. Squalene epoxidase (SQLE) is one of the rate-limiting enzymes for cholesterol biosynthesis and was highly expressed in the buffalo mammary. The objectives of the present study were to detect the polymorphisms within SQLE in buffalo, the genetic effects of these mutations on milk production traits, and to understand the gene regulatory effects on buffalo mammary epithelial cells (BuMECs). A total of five SNPs were identified by sequencing, g.18858G > A loci were significantly associated with fat yield, and g.22834C > T loci were significantly associated with peak milk yield, milk yield, fat yield, and protein yield. Notably, linkage disequilibrium analysis indicated that 2 SNPs (g.18858G > A and g.22834C > T) formed one haplotype block, which was found to be significantly associated with milk fat yield, fat percentage, and protein yield. Furthermore, expression of SQLE was measured in different tissues of buffalo and was found to be higher in the mammary. Knockdown of SQLE gene expression significantly affected the growth of BuMECs, including proliferation, cell cycle, and apoptosis, and significantly downregulated the expression of related genes MYC, PCNA, and P21. In addition, knockdown of the SQLE gene significantly reduces triglyceride concentrations and the signal intensity of oil red O staining. In addition, silencing of SQLE was also found to regulate the synthesis and secretion of β-casein and κ-casein negatively. Furthermore, SQLE knockdown is accompanied by the downregulation of critical genes (RPS6KB1, JAK2, eIF4E, and SREBP1) related to milk fat and protein synthesis. The current study showed the potential of the SQLE gene as a candidate for buffalo milk production traits. It provides a new understanding of the physiological mechanisms underlying buffalo milk production regulation.

1. Introduction

Buffalo milk represents an indispensable source of nourishment in many parts of the world and it is the second most consumed milk worldwide [1,2]. Buffalo has important economic and biological significance for tropical and subtropical regions due to characteristics of good adaptability and stress resistance [3]. So, livestock herders in Pakistan consider buffalo as a “black gold” [4]. Buffalo milk has a higher nutritional value in fat, protein, and iron, and less cholesterol than dairy cow milk [5]. The high-fat content of buffalo milk makes it also highly suitable for processing, and in developed countries it is mainly used for the production of a variety of foodstuffs, such as butter oil, cheeses, and ice cream. In addition, the highly popular buffalo Mozzarella is obtained under the European Union’s protected designation of origin scheme in Italy [6,7]. However, the low milk yield has been limiting the buffalo industry’s progress. Therefore, improving the buffalo milk yield while maintaining its high milk quality is the major challenge for modern buffalo breeding.
The continued advancement of high-throughput genotyping and sequencing technologies allowed the discovery of hundreds of thousands of genetic markers in the genomes of animals, such as single-nucleotide polymorphisms (SNPs) [8]. Genomic selection mainly depends on the linkage disequilibrium (LD) among genetic markers and loci associated with the trait variation to create the prediction equation [9,10]. Candidate gene approaches and genome-wide association studies can be used to identify these genetic loci [11]. The candidate gene approach has been established as an effective way to choose the candidate genes affecting milk production traits [12,13].
Squalene epoxidase (SQLE) is a microsomal flavin monooxygenase that catalyzes the first oxygenation step in cholesterol synthesis, the conversion of squalene into the nonsterol precursor for lanosterol, 2,3-(S)-monooxidosqualene (MOS), and is one of the rate-limiting enzymes for cholesterol biosynthesis [14,15,16]. Recently, studies have reported that the SNP in the SQLE gene was associated with several meat quality traits including back-fat thickness, carcass weight, meat color (yellowness), fat composition, and water-holding capacity [17]. Subsequently, knockdown of SQLE expression in 3T3-L1 pre-adipocytes was found to significantly inhibit adipogenesis [17]. In addition, previous studies have demonstrated the association of SQLE with cholesterol metabolism and adipogenesis [18,19,20].
As the individual mammary gland matures, the epithelial cells of the mammary gland begin to develop under hormonal control and participate in the production and secretion of milk [21,22]. It has been found that apoptosis and a decrease in mammary epithelial cells during lactation lead to a decrease in lactation [23]. So, the study of mammary epithelial cells is essential to improve milk quality and milk production. Numerous studies have established that SQLE genes are involved in the proliferation and migration of many types of cancer cells (lung squamous cell carcinoma cells and hepatocellular carcinoma cells) [24,25,26]. Moreover, SQLE copy number has been reported to decrease cell viability and increase replication time in breast cancer cell lines [27].
Therefore, the objectives of this study were to identify genetic mutations of the SQLE gene in buffalo, and detect the association between these genetic markers and milk production traits in the tested populations. Furthermore, we tried to explore the regulatory role of SQLE on buffalo mammary epithelial cells (BuMECs) proliferation, triglycerides, and lipid distribution, as well as casein synthesis.

2. Results

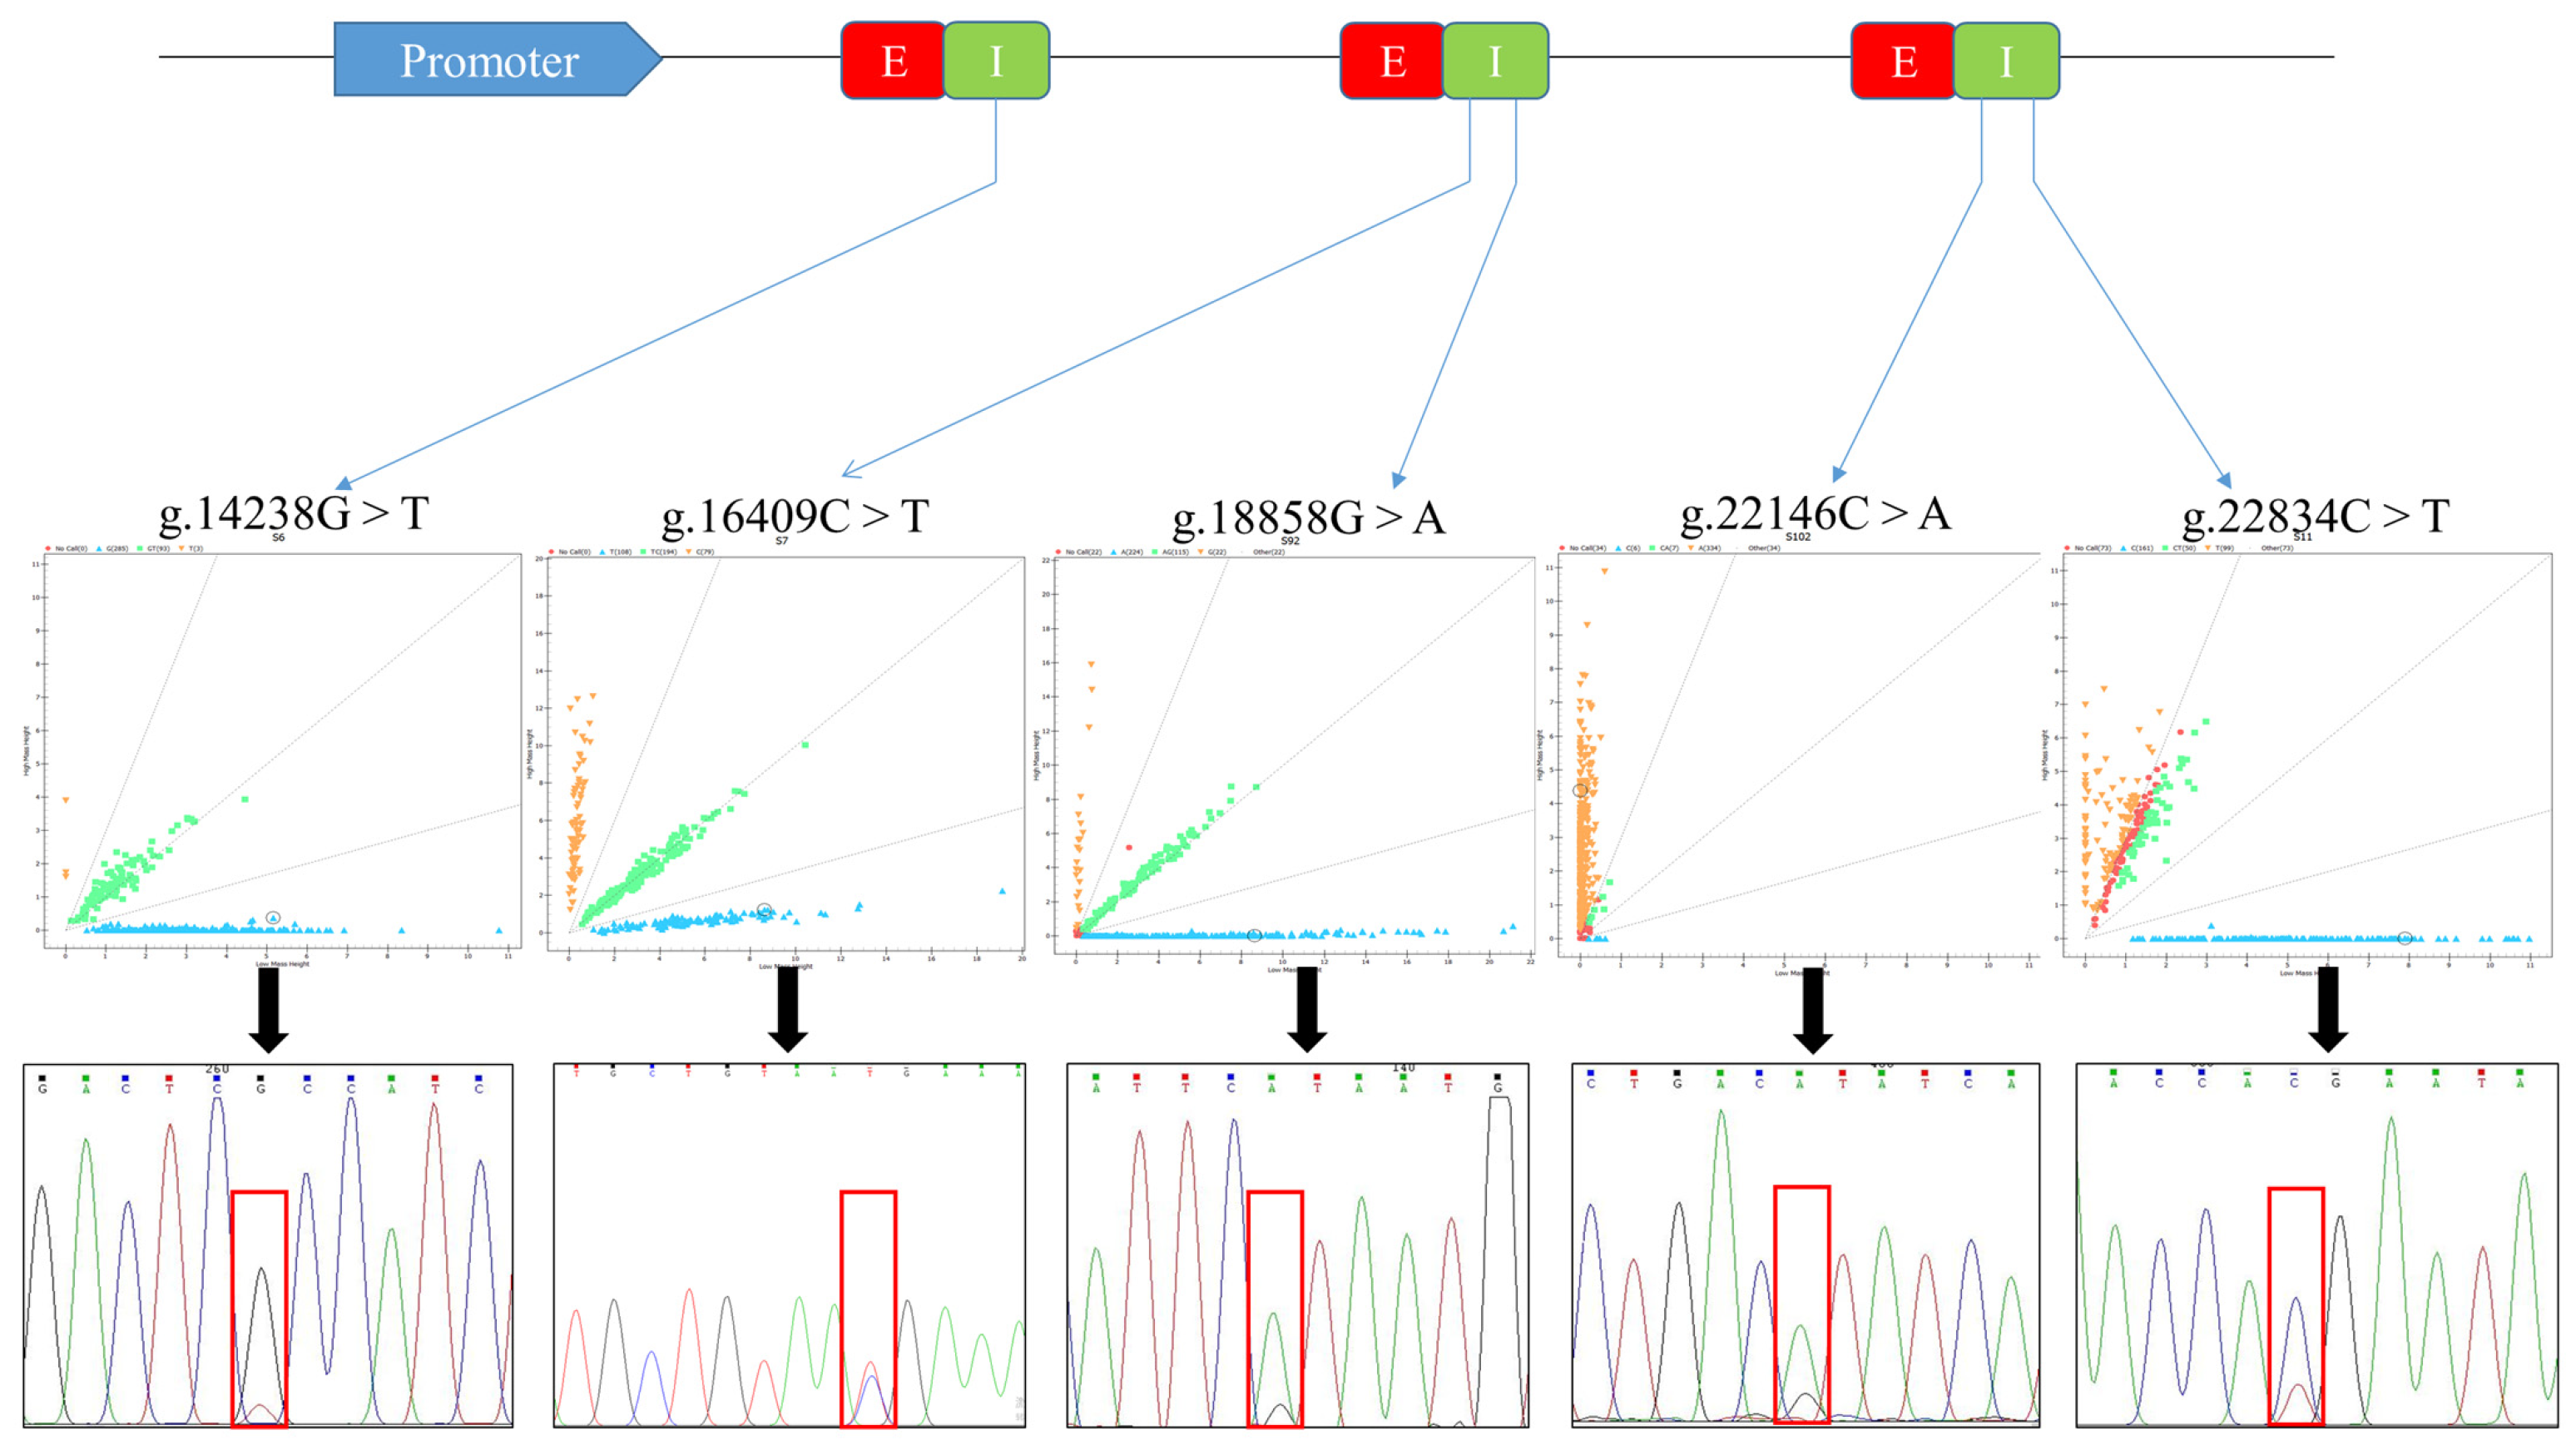
2.1. SNP Polymorphic Loci Identification and Genotyping of SQLE Gene

Five potential SNPs (g.14238G > T, g.16409C > T, g.18858G > A, g.22146C > A, and g.22834C > T) were identified in the buffalo DNA pool sequencing data from the tested samples (Figure 1). All SNPs are located within the intron region, g.14238G > T in the sixth, g.16409T > C and g.18858A > G in the seventh, g.22146A > C and g.22834T > C in the ninth. MALDI-TOF-MS genotyping detected SNPs in 331 of the Italian Mediterranean buffalo sample. The genetic diversity of the studied population for these five SNPs was discovered by estimating the genotype frequencies, allele frequencies, polymorphism information content (PIC), and heterozygosity (Table 1).

2.2. Association of SQLE Genotype with Milk Production Traits

To know whether identified SNPs of the SQLE gene in Italian Mediterranean buffaloes are associated with milk production traits (peak milk yield, milk yield, fat yield, fat percentage, protein yield, and protein percentage), an association analysis was performed using a Mixed Linear Model and results were given (Table 2). The SNPs at g.18858G > A loci were significantly associated with fat yield (FY), with higher FY in the AG genotype (235.45 ± 3.67 kg) compared to the AA genotype (225.47 ± 2.93 kg, p < 0.05). The SNPs at g.22834C > T had a significant association with the following milk production traits. Compared to the CC genotype, the TT genotype showed significant increases in peak milk yield (PM), milk yield (MY), and FY of 0.61 kg, 130.67 kg, and 13.06 kg, respectively (p < 0.05). Additionally, there was a significantly higher protein yield (PY) in the TT genotype (134.53 ± 2.22 kg) compared to the CC genotype (128.07 ± 1.90 kg, p < 0.05). However, the SNPs at g.14238G > T, g.16409C > T and g.22146C > A loci were not significantly associated with buffalo milk production traits (p > 0.05).

2.3. Linkage Disequilibrium and Haplotypes Analysis

We further performed linkage disequilibrium (LD) and haplotype analysis for the five detected SNPs, and one haplotype block was identified (Figure 2). This haplotype block was composed of three haplotype combinations, H1H1: CA/CA, H1H3: CA/TG, and H2H3: TA/TG with frequencies of 56.50%, 20.24%, and 16.01%, respectively. In addition, we observed that individuals with the haplotype combination H1H1 (235.78 ± 3.44 kg) had significantly higher FY than those with H2H3 (225.02 ± 3.09 kg, p < 0.05). Compared to individuals with haplotype combination H1H3, individuals with haplotype combination H1H1 had a significant increase in FP of 0.30% (p < 0.05). Furthermore, individuals with haplotype combination H1H1 had significantly higher PY than individuals with haplotype combination H2H3 (p < 0.05). However, different haplotype combinations had no significant effect on PM, MY, and PP (p > 0.05, Table 3).

2.4. Identification of BuMECs, Interference Efficiency, and Expression Profile of SQLE

The SQLE gene was found to be constitutively expressed at different levels in all investigated tissues (mammary, lymph, liver, hypothalamus, stomach, intestine, cerebrum, pituitarium, lung, spleen, ovary, uterus, fallopian tube, kidney, and heart) in buffalo. The mRNA expression of SQLE was highest in the mammary and lowest in heart (Figure 3A). Meanwhile, the isolated BuMECs were identified using immunofluorescence detection of cytokeratin 18 (CK18), a marker protein of epithelial cells (Figure 3B) [28]. To uncover the biological function of SQLE in BuMECs, four different siRNAs were designed and synthesized: siSQLE (2031), siSQLE (1843), siSQLE (1103), and siSQLE (1960). The knockdown efficiency of SQLE mRNA level by siSQLE (1960) transfection reached 95.19%, compared to control siRNA-transfected cells (p < 0.001, Figure 3C). We selected siSQLE (1960) for subsequent experiments because it was the most effective siRNA. In addition, compared with the siNC group, the SQLE protein relative expression of the siSQLE group was significantly lower (p < 0.001, Figure 3D,E).

2.5. SQLE Regulates the BuMECs Proliferation, Cell Cycle, and Apoptosis

Flow cytometry analysis for the cell cycle indicated that the cell cycle was arrested in siSQLE-treated cells compared to the control, as there was a significant decrease in the G2 (3.53%, p < 0.05) and increase in the G1 (6.42%, p < 0.05) phase (Figure 4A–C). Furthermore, the apoptosis rate was determined by transfecting BuMECs for 48 h with siSQLE or siNC. The results showed that siSQLE-treated BuMECs had a significantly higher early (5.47 ± 0.72), late (6.66 ± 0.23), and total apoptosis rate (12.13 ± 0.49) compared to the siNC (early apoptosis rate: 0.29 ± 0.09; late apoptosis rate: 1.19 ± 0.25; total apoptosis rate: 1.48 ± 0.26), respectively (p < 0.01, Figure 4D–F). Meanwhile, to confirm the SQLE role in cell proliferation, we performed CCK-8 assays to examine the effect of SQLE on the viability of BuMECs. The results demonstrated that cell viability was significantly reduced by SQLE knockdown (p < 0.001, Figure 4G). In addition, the cell counts were measured with an automatic cell counter, and the results revealed a significant decrease in the number of cells in SQLE knockdown cells (p < 0.001, Figure 4H). Consistently, SQLE gene knockdown inhibits the cell cycle, proliferation, and apoptosis-related gene (PCNA, MYC, and P21) expression (p < 0.05, Figure 4I).

2.6. SQLE Regulates BuMECs Lipogenesis and Casein Synthesis

To make a thorough exploration of SQLE function in mammary epithelial cells, we detected the effect of SQLE on milk fat and milk protein synthesis. The secretory effect of SQLE on the triglyceride (TG) level, a major lipid milk fat, was examined. The results showed that SQLE knockdown significantly reduced the secretion of TG from BuMECs (p < 0.01, Figure 5A). The oil red O staining of neutral lipid accumulation confirms the reduction of lipid droplets in SQLE knockdown cells (p < 0.01, Figure 5B–D). Our previous association study revealed that SQLE mutation affected the milk protein yield (Table 2). We further performed the ELISA assay to detect the α-casein, β-casein, and κ-casein levels in the culture medium of the BuMECs after SQLE silencing. The results showed that the concentrations of β-casein and κ-casein were significantly lower in siSQLE-treated BuMECs culture medium compared to siNC (p < 0.05), but there was no significant difference in α-casein (p > 0.05, Figure 5E). Furthermore, we examined the expression of genes related to milk fat and protein synthesis in siSQLE-treated BuMECs. Consistently, SQLE gene knockdown significantly inhibits the expression of the milk fat and protein synthesis-related genes RPS6KB1, JAK2, eIF4E, and SREBP1 (p < 0.05, Figure 5F).

3. Discussion

Milk yield and quality have been the primary selection criteria for genetic improvements in livestock species, which are complex quantitative traits regulated by different genes [29]. Thus, identifying candidate genes associated with milk production traits may provide information that can be used to enhance the accuracy of animal selection for moderately heritable traits, such as milk production [30]. In addition, 19 candidate genes associated with milk production traits in buffalo were reported, including ADRA1A, A2M, BTN1A1, DGAT1, CSN1S1, GHRL, INSIG2, LALBA, LEP, MC4R, MTNR1A, OXT, PRL, SCD, SPP1, SREBF1, STAT1, STAT5A, and TG genes [11]. Previous studies have shown that SNPs in the SQLE gene are significantly associated with several meat quality traits in pigs [17]. However, no literature has been reported on SNPs in the SQLE gene affecting milk production traits in buffalo. Milk production is a polygenic trait, regulated by several genes [31,32]. Thus, animal producers desire to know the genetic changes encoding the preferred phenotypes.
In our study, the associations of SNPs in the SQLE gene with milk production traits in buffaloes were analyzed for the first time. Although the SNPs identified in the current study were all located in the intron region, some studies have reported that introns can affect gene transcription initiation and elongation, mRNA transport out of the nucleus, mRNA stability, and ultimately mRNA translation efficiency [33,34]. Our results show that SNPs in the SQLE gene have a significant effect on the buffalo milk fat and protein yield. In addition, we found a haplotype block formed by the SNPs identified in the SQLE gene. A “haplotype” refers to a group of alleles inherited on a single chromosome containing DNA sequences with multiple SNPs [35,36]. Haplotype can distinguish the genetic information of different parental chromosomes, and reveals the combination and inheritance of different genetic sites on a single chromosome or a specific single chromosome region, which is helpful to explore the heterosis in animals [37]. Our results demonstrate that this haplotype block significantly affects fat yield, fat percentage, and protein yield in buffalo milk. It can be inferred that the SQLE gene may play an essential role in milk lipid metabolism and protein synthesis in buffalo.
To further reveal the effects of the SQLE gene on milk lipid metabolism and protein synthesis in buffalo milk, we examined the impacts of knockdown of the SQLE gene on BuMECs, including proliferation, apoptosis, cell cycle, and milk fat and milk protein synthesis. It is well known that the mammary gland synthesizes and secretes milk composition. Mammary epithelial cells (MECs) are an important component of the mammary gland. Most milk compositions, including milk protein and milk fat, are synthesized and secreted by MECs [38], which are widely used over the recent years as a model to understand the physiological function of the mammary gland, which offers an effective tool for the study of cell proliferation, apoptosis, lipogenesis, and casein synthesis [39,40]. The current siSQLE-induced arrest of cell cycle with an increase in G1 phase and a decrease in G2 phase of BuMECs is consistent with He et al. and You et al.’s previous studies that silencing the expression of the SQLE gene can inhibit the proliferation of tumor cells [41,42]. However, the effect of SQLE genes on the proliferation of BuMECs has not been reported. To further elucidate the mechanism of SQLE gene regulation of BuMECs proliferation, we examined the expression of proliferation-related genes PCNA, P21, and MYC, and the results showed that they were significantly downregulated (p < 0.05). Numerous studies have demonstrated that the absence of MYC inhibits cell growth [43,44,45]. In addition, Ushmorov, A., K.M. Debatin et al. found that overexpression of MYC leads to an increase in G2 stage cells [46]. Our results show that MYC was downregulated and significantly decreased in G2 phase cells, which is consistent. PCNA is crucially regulated by the tumor suppressor protein p21 (WAF1) [47], which was initially identified as a potent inhibitor of cell-division cycle kinases (CDKs). PCNA binding is mediated by a PIP box located in p21’s C-terminal tail [48,49]. PCNA downregulation is demonstrated to inhibit cell proliferation [50], and P21 downregulation can promote apoptosis [51]. In the present study, our data indicated that SQLE knockdown significantly (p < 0.05) inhibited the expression of PCNA, MYC, and P21, which further supported that SQLE might regulate BuMECs proliferation and apoptosis. Moreover, previous studies reported that the quantity and milk performance of MECs determined the milk production and quality of bovines [52]. This suggested that the role of SQLE to promote cell growth might be positively correlated with increased milk production.
More than 95% of milk fat is composed of triglycerides (TGs), which are synthesized in the endoplasmic reticulum and play a key role in the taste of milk, and are one of the most important factors in determining milk quality [53]. Previous study results showed that lipid droplet accumulation in adipocytes was significantly decreased by SQLE knockdown [17]. Overexpression of SQLE significantly increases TG levels in chicken hepatoma cells [54]. In the current study, oil Red O results show a significant reduction in lipid droplet aggregation in BuMECs after knockdown of SQLE gene expression (p < 0.01). Moreover, silencing of SQLE leads to a significant decrease in TG levels (p < 0.01). In these findings, SQLE may affect the milk fat rate of buffalo milk by influencing lipid synthesis in epithelial cells. SREBP1 has been identified as a major transcription factor that activates genes regulating lipid and triglyceride synthesis, which can regulate the expression of milk fat synthesis-related enzymes and proteins, such as fatty acid binding protein 3 (FABP3), and proliferation of activated receptor gamma (PPARγ), thereby affecting the synthesis and transport of fatty acids [55,56]. Recent studies have demonstrated that silencing SREBP1 expression inhibits the expression of milk fat synthesis-related genes in BuMECs [38]. In our study, SQLE knockdown significantly inhibited milk fat synthesis-related gene SREBP1 mRNA expression (p < 0.01). Therefore, it is suggested that SQLE may affect milk fat secretion by affecting the SREBP1 gene.
Casein content in milk is approximately 80% milk protein and mainly consists of α-, β-, and κ- casein, which are an important factors in determining milk quality [57,58]. In the present study, the knockdown of SQLE gene expression resulted in a significant decrease in the concentrations of β- and κ- casein, but no significant difference in the concentration of α-casein. PI3K-AKT-mTOR and JAK2-STAT5 pathways have been the major signaling pathways in milk protein synthesis [59]. mTOR regulates protein translation through its signaling pathway downstream of 4EBP1 and RPS6K1 [60]. Activated 4EBP1 is phosphorylated and separated from elF4E, which binds to the translation initiation factor to initiate translation of the mRNA into a protein [61]. In the JAK2/STAT5 signaling pathway, activated JAK2 phosphorylates STAT5, which activates the transcription of genes involved in the synthesis of milk proteins, thereby regulating the synthesis of milk proteins [62]. Our results show that knockdown of SQLE leads to significant downregulation of elF4E, RPS6K1, and JAK2 expression in BuMECs. It was conjectured that SQLE may affect milk protein secretion by affecting JAK2-STAT5 and PI3K-AKT-mTOR pathways.

4. Materials and Methods

4.1. Samples Collection

A total of 331 buffalo blood DNA samples and relevant milk production records were derived from our previous studies [40,63]. All the milk production records (peak milk yield, milk yield, fat yield, fat percentage, protein yield, and protein percentage) were adjusted to 270 days [64]. The Italian Buffalo Breeders Association (ANASB) collected and provided the records. All experimental designs and animal treatment protocols were approved by the Ethical Animal Care and Use Committee of Federico II University of Naples (Italy), as previously described [65]. We extracted genomic DNA from the whole-blood samples of buffalo by using a kit method (QIAamp DNA Blood kit; Qiagen, Milan, Italy) following the instructions provided by the manufacturer. The Nanodrop 2000 spectrophotometer (Thermo-Fisher Scientific, Wilmington, DE, USA) and 1.5% agarose gel were used to determine the concentration and quality of extracted DNA.

4.2. SNP Identification, Genotyping, and Linkage Disequilibrium Analysis

Fifty buffalo samples were randomly selected to identify the variants of the SQLE gene by pooled DNA sequencing. A total of 12 pairs of SNP primers (Supplementary Table S1) based on the GenBank sequence (GenBank accession number: NC_059171.1) of the SQLE gene were designed (premier 5.0 software, Premier Biosoft, Palo Alto, CA, USA) and synthesized by Tsingke Biological Technology, Wuhan, China. PCR products were sequenced by the company (Tianyi Huiyuan, Inc, Wuhan, China), and the SeqMan software (DNASTAR Inc., Madison, WI, USA) was used to search the sequence mutations. Genotyping was performed by matrix-assisted laser desorption by Compass Biotechnology Co., Ltd. (Beijing, China).
Allelic frequencies, genotypic frequencies, polymorphism information content (PIC), and Hardy–Weinberg equilibrium (HWE) were calculated for each locus using PowerMarker Version 3.25. Phased genotypes were partitioned into haplotype blocks using Haploview version 4.2 (Broad Institute, Cambridge, MA, USA). Haploview 4.2 was also used to estimate the LD of all SNPs. The haplotype structure of each buffalo was inferred by the software Phase 2.1.

4.3. Association Analysis

Association analysis of SQLE polymorphisms and milk production traits was performed with the PROC MIXED procedure of SAS9.4 using the following mixed linear model:
Yijklm= μ + Gi + Pj + Sk + Fl + am(i) + eijklm
where Yijklm = phenotype observations; μ = overall mean; Gi = the fixed-effect of the ith genotype or haplotype combination; Pj = the fixed-effect of the jth parity (1, 2, 3, 4, and >4); Sk = the fixed-effect of the kth season (spring is from March to May, summer is from June to August, autumn is from September to November, and winter is from December to January and February of the following year); Fl = the fixed-effect of the lth farm (four different farms); am(i) = the random effects of the mth individual buffalo nested within SQLE genotype or haplotype combination ith; and eijklm = the random residual. The least-square means with standard error for multiple comparisons between different genotypes and haplotypes were performed using Tukey correction.

4.4. Cell Culture and Transfection

The buffalo mammary gland was obtained from a local slaughterhouse in Wuhan, China. The buffalo mammary epithelial cells (BuMECs) isolation and culture were followed with brief modifications as reference [66]. The BuMECs cells were cultured in DMEM/F12 medium (HyClone, Logan, UT, USA) containing 10% fetal bovine serum (Gibco, Gaithersburg, MD, USA) and 1% penicillin–streptomycin (HyClone, Logan, UT, USA) in a 37 °C incubator with 5% CO2. BuMECs cells were cultured into six-well plates overnight. Then, both SQLE-siRNA and NC-siRNA were purchased from Shanghai GenePharma Co., Ltd. (Shanghai, China). The cells were transfected with 100 nM of siRNA compared to NC using the Lipofectamine RNAiMAX reagent in Opti-MEM medium (Life Technology, Inc., Carlsbad, CA, USA) instructions. Cells were harvested 48 h after transfection for mRNA and protein expression. Small RNA interference sequences specific to SQLE (siSQLE) used in this study are given in Supplementary Table S2.

4.5. RNA Extraction and Quantitative Real-Time PCR (qRT-PCR)

Cells were lysed 48 h after transfection to extract total RNA using a kit method (Total RNA Kit I (200); R6834-02; Omega Bio-Tek, Norcross, GA, USA) following the manufacturer’s instructions for subsequent cDNA synthesis. The qRT-PCR was conducted using SYBR Green Master Mix (QIAGEN, Hilden, Germany) to determine the mRNA expression of the target genes using gene-specific primers (Supplementary Table S2). The GAPDH was used as a reference gene, and relative expression was measured using the 2−ΔΔCt method [67].

4.6. Western Blotting and Cellular Immunofluorescence

BuMECs transfected with si-SQLE and si-NC in a 6-well plate were placed on ice, washed with PBS, followed by cell lysis using a lysis buffer RIPA (Servicebio, Wuhan, China) augmented with phosphorylase inhibitor (1 mM) and phenylmethanesulphonyl fluoride (PMSF). Proteins were isolated by SDS-PAGE (12%) and subsequently transferred to polyvinylidene difluoride membranes (PVDF; Immobilon-P, Millipore, Burlington, MA, USA) via electrophoresis. Preliminarily, the membranes were incubated with 5% skimmed milk diluted in TBS for 2 h, and subsequently incubated (4 °C, overnight) with these primary antibodies: SQLE (1:1000, ER1917-17; HUABIO, Inc., Hangzhou, China), GAPDH (1:1000, B1034; Beijing Biodragon Immunotechnologies Co., Ltd., Beijing, China) as a control. Target proteins in each sample were determined using enhanced chemiluminescence (NCI5079; Bio-Rad Laboratories, Hercules, CA, USA). WB images were captured by Gel-pro analyzer version 4 (Media Cybernetics, Rockville, MD, USA), and Image J software (National Institutes of Health, Bethesda, MD, USA) was used to determine bands, respectively. The data were normalized to GAPDH. Cellular immunofluorescence was based on a protocol established in our laboratory [68]. Zeiss LSM Image Browser and Adobe Photoshop were used to process the confocal images (Adobe Systems Inc., San Jose, CA, USA).

4.7. Cell Counts and Proliferation Assay

The cells were harvested 48 h after transfection of si-SQLE and si-NC for the determination of cell viability or cell numbers. The trypsin-lysed cells were counted using an automated cell counter (BIO-RAD Laboratories, Inc., TC20TM, Hercules, CA, USA). The cell counting kit-8 reagent (Dojindo, Kumamoto, Japan) was supplemented in each well of the experimental group according to the manufacturer’s instructions, and the cells were incubated for 1.5 h at 37 °C with 5% CO2. Next, cells were loaded onto a multimode plate reader (PerkinElmer, EnSpire, Waltham, MA, USA) to determine each experimental group’s absorbance at 450 nm.

4.8. Cell Cycle and Apoptosis Assay

Cell cycle and apoptosis assay was performed based on a protocol established in our laboratory [69]. Briefly, the cells were pretreated, and the cell cycle was detected by using the cell cycle detection kit (KeyGEN Biotech, Nanjing, China) according to the manufacturer’s instructions. Apoptosis was analyzed by using the Annexin V-FITC/PI Apoptosis Detection Kit (KeyGEN Biotech, Nanjing, China). Finally, according to the manufacturer’s protocol, flow cytometry was used to determine the cell proportions using the FACSVerse Calibur (BD Biosciences, San Jose, CA, USA).

4.9. Enzyme-Linked Immunosorbent Assay Were Used to Detect Concentrations of α-, β-, and κ-Casein

Culture media were collected from si-SQLE and si-NC, transfected BuMECs at 48 h, centrifuged at 1000× g for 20 min and the supernatant was taken to measure the concentration. ELISA Kit (MLBIO Biotechnology Co., Ltd.; Shanghai, China) was used to measure α-casein (ml572830-1), β-casein (ml572830-2), and κ-casein (ml572830-3) concentrations. The intra- and inter-assay coefficients of variation were less than 10.0% and 10.0% for α-casein, β-casein, and κ-casein.

4.10. Triglyceride Content Detection and Oil Red O Staining

A triglyceride enzyme assay kit (Jiancheng Bioengineering Institute, Nanjing, China) was used to determine the triglyceride contents in the BuMECs lysate. The cells were transfected with si-SQLE for 48 h, and 100 μL cell lysate was mixed with the working solution. The absorbance was measured at 510 nm using a microplate reader (PerkinElmer Enspire, Shanghai, China). Cells were stained with oil red O stain kit (G1262; Solarbio, Beijing, China) following the manufacturer’s instructions, operation methods refer to previous studies [70].

4.11. Statistical Analysis

The statistical analyses of gene functional studies were conducted with SPSS 19.0 software (SPSS Inc., Chicago, IL, USA) and graphing with GraphPad Prism 8 (GraphPad Software, Inc., La Jolla, CA, USA). The results are expressed as means ± standard error of the mean (Mean ± SEM). Significant differences between the two groups were compared using Student’s t-test, and comparisons among multiple groups were performed with a one-way analysis of variance followed by Tukey test. p-value < 0.05 was considered statistically significant. All experiments were conducted at least three times.

5. Conclusions

This study identified five SNPs and one haplotype block for the SQLE gene and found that these mutations were significantly associated with milk composition traits. Furthermore, SQLE was found to dramatically affect BuMECs growth (proliferation, cell cycle, and apoptosis) by regulating marker genes (MYC, P21 and PCNA) and decreasing the bio-synthesis and secretion of milk triglycerides, lipids, and casein in BuMECs by suppressing their regulatory genes (RPS6KB1, JAK2, eIF4E, and SREBP1). These findings prove that the buffalo SQLE gene may be a potential candidate gene for marker-assisted selection in the buffalo breeding program.

Supplementary Materials

The following supporting information can be downloaded at: https://www.mdpi.com/article/10.3390/ijms24032436/s1.

Author Contributions

Original draft preparation, C.C.; conceived and designed the experiment data curation, C.C., X.H. and T.Y.; mammary gland collection, X.H. and K.N.; review and editing the manuscript, A.L., M.J.A. and L.Y.; supervision project, administration, funding acquisition, L.Y. All authors have read and agreed to the published version of the manuscript.

Funding

This research was supported by the earmarked fund for CARS36.

Institutional Review Board Statement

The study was conducted according to the guidelines of Huazhong Agricultural University Animal Care and Use Committee (Approval ID: HZAUBU-2018-002).

Informed Consent Statement

Not applicable.

Data Availability Statement

The authors confirm that the data supporting the findings of this study are available within the article.

Conflicts of Interest

The authors declare no conflict of interest.

References

  1. Arora, S.; Sindhu, J.S.; Khetra, Y. Buffalo milk. In Reference Module in Food Science; Elsevier: Amsterdam, The Netherlands, 2022. [Google Scholar]
  2. Nasr, M.A.F.; Awad, A.; El Araby, I.E. Associations of Leptin and Pituitary-Specific Transcription Factor Genes’ Polymorphisms with Reproduction and Production Traits in Dairy Buffalo. Reprod. Domest. Anim. 2016, 51, 597–603. [Google Scholar] [CrossRef]
  3. Hegde, N.G. Buffalo Husbandry for Sustainable Development of Small Farmers in India and other Developing Countries. Asian J. Res. Anim. Vet. Sci. 2019, 3, 1–20. [Google Scholar]
  4. Bhutto, B.; Arijo, A.; Phullan, M.S.; Rind, R. Prevalence of Fascioliasis in Buffaloes under Different Agro-Climatic Areas of Sindh Province of Pakistan. Int. J. Agric. Biol. 2012, 14, 241–245. [Google Scholar]
  5. Barłowska, J.; Szwajkowska, M.; Litwińczuk, Z.; Król, J. Nutritional Value and Technological Suitability of Milk from Various Animal Species Used for Dairy Production. Compr. Rev. Food Sci. Food Saf. 2011, 10, 291–302. [Google Scholar] [CrossRef]
  6. Jana, A.H.; Mandal, P.K. Manufacturing and quality of mozzarella cheese: A review. Int. J. Dairy Sci. 2011, 6, 199–226. [Google Scholar] [CrossRef]
  7. Pegolo, S.; Stocco, G.; Mele, M.; Schiavon, S.; Bittante, G.; Cecchinato, A. Factors affecting variations in the detailed fatty acid profile of Mediterranean buffalo milk determined by 2-dimensional gas chromatography. J. Dairy Sci. 2017, 100, 2564–2576. [Google Scholar] [CrossRef] [Green Version]
  8. De los Campos, G.; Hickey, J.M.; Pong-Wong, R.; Daetwyler, H.D.; Calus, M.P.L. Whole-Genome Regression and Prediction Methods Applied to Plant and Animal Breeding. Genetics 2013, 193, 327–345. [Google Scholar] [CrossRef] [Green Version]
  9. Goddard, M.E.; Hayes, B.J.; Meuwissen, T.H.E. Using the genomic relationship matrix to predict the accuracy of genomic selection. J. Anim. Breed. Genet. 2011, 128, 409–421. [Google Scholar] [CrossRef]
  10. Wang, R.J.; Gao, X.F.; Yang, J.; Kong, X.R. Genome-Wide Association Study to Identify Favorable SNP Allelic Variations and Candidate Genes That Control the Timing of Spring Bud Flush of Tea (Camellia sinensis) Using SLAF-seq. J. Agric. Food Chem. 2019, 67, 10380–10391. [Google Scholar] [CrossRef]
  11. Du, C.; Deng, T.; Zhou, Y.; Ye, T.; Zhou, Z.; Zhang, S.; Shao, B.; Wei, P.; Sun, H.; Khan, F.A.; et al. Systematic analyses for candidate genes of milk production traits in water buffalo (Bubalus bubalis). Anim. Genet. 2019, 50, 207–216. [Google Scholar] [CrossRef]
  12. Deng, T.; Pang, C.; Ma, X.; Duan, A.; Liang, S.; Lu, X.; Liang, X. Buffalo SREBP1: Molecular cloning, expression and association analysis with milk production traits. Anim. Genet. 2017, 48, 720–721. [Google Scholar] [CrossRef]
  13. Freitas, A.C.; de Camargo, G.M.F.; Aspilcueta-Borquis, R.R.; Stafuzza, N.B.; Venturini, G.C.; Tanamati, F.; Hurtado-Lugo, N.A.; Barros, C.C.; Tonhati, H. Polymorphism in the A2M gene associated with high-quality milk in Murrah buffaloes (Bubalus bubalis). Genet. Mol. Res. 2016, 15, gmr.15027637. [Google Scholar] [CrossRef]
  14. Houten, S.M.; Schneiders, M.S.; Wanders, R.; Waterham, H.R. Regulation of Isoprenoid/Cholesterol Biosynthesis in Cells from Mevalonate Kinase-deficient Patients. J. Biol. Chem. 2003, 278, 5736–5743. [Google Scholar] [CrossRef] [Green Version]
  15. Gill, S.; Stevenson, J.; Kristiana, I.; Brown, A.J. Cholesterol-Dependent Degradation of Squalene Monooxygenase, a Control Point in Cholesterol Synthesis beyond HMG-CoA Reductase. Cell Metab. 2011, 13, 260–273. [Google Scholar] [CrossRef] [Green Version]
  16. Yamamoto, S.; Bloch, K. Studies on Squalene Expoxidase of Rat Liver. J. Biol. Chem. 1970, 245, 1670–1674. [Google Scholar] [CrossRef] [PubMed]
  17. Ha, J.; Kwon, S.; Hwang, J.H.; Park, D.H.; Kim, T.W.; Kang, D.G.; Yu, G.E.; Park, H.C.; An, S.M.; Kim, C.W. Squalene epoxidase plays a critical role in determining pig meat quality by regulating adipogenesis, myogenesis, and ROS scavengers. Sci. Rep. 2017, 7, 16740. [Google Scholar] [CrossRef] [PubMed] [Green Version]
  18. Stopsack, K.H.; Gerke, T.A.; Sinnott, J.A.; Penney, K.L.; Tyekucheva, S.; Sesso, H.D.; Andersson, S.-O.; Andren, O.; Cerhan, J.R.; Giovannucci, E.L.; et al. Cholesterol Metabolism and Prostate Cancer Lethality. Cancer Res. 2016, 76, 4785–4790. [Google Scholar] [CrossRef] [Green Version]
  19. Yang, F.; Kou, J.; Liu, Z.; Li, W.; Du, W. MYC Enhances Cholesterol Biosynthesis and Supports Cell Proliferation through SQLE. Front. Cell Dev. Biol. 2021, 9, 655889. [Google Scholar] [CrossRef] [PubMed]
  20. Xiong, L.; Pei, J.; Wu, X.; Kalwar, Q.; Yan, P.; Guo, X. Effect of Gender to Fat Deposition in Yaks Based on Transcriptomic and Metabolomics Analysis. Front. Cell Dev. Biol. 2021, 9, 653188. [Google Scholar] [CrossRef] [PubMed]
  21. Capuco, A.V.; Wood, D.L.; Baldwin, R.; McLeod, K.; Paape, M.J. Mammary cell number, proliferation, and apoptosis during a bovine lactation: Relation to milk production and effect of bST. J. Dairy Sci. 2001, 84, 2177–2187. [Google Scholar] [CrossRef] [PubMed]
  22. Inman, J.L.; Robertson, C.; Mott, J.D.; Bissell, M.J. Mammary gland development: Cell fate specification, stem cells and the microenvironment. Development 2015, 142, 1028–1042. [Google Scholar] [CrossRef] [PubMed] [Green Version]
  23. Boutinaud, M.; Guinard-Flament, J.; Jammes, H. The number and activity of mammary epithelial cells, determining factors for milk production. Reprod. Nutr. Dev. 2004, 44, 499–508. [Google Scholar] [CrossRef] [PubMed] [Green Version]
  24. Ge, H.; Zhao, Y.; Shi, X.; Tan, Z.; Chi, X.; He, M.; Jiang, G.; Ji, L.; Li, H. Squalene epoxidase promotes the proliferation and metastasis of lung squamous cell carcinoma cells though extracellular signal-regulated kinase signaling. Thorac. Cancer 2019, 10, 428–436. [Google Scholar] [CrossRef] [PubMed]
  25. Li, C.; Wang, Y.; Liu, D.; Wong, C.C.; Coker, O.O.; Zhang, X.; Liu, C.; Zhou, Y.; Liu, Y.; Kang, W.; et al. Squalene epoxidase drives cancer cell proliferation and promotes gut dysbiosis to accelerate colorectal carcinogenesis. Gut 2022, 71, 2253–2265. [Google Scholar] [CrossRef] [PubMed]
  26. Sui, Z.; Zhou, J.; Cheng, Z.; Lu, P. Squalene epoxidase (SQLE) promotes the growth and migration of the hepatocellular carcinoma cells. Tumor Biol. 2015, 36, 6173–6179. [Google Scholar] [CrossRef]
  27. Brown, D.N.; Caffa, I.; Cirmena, G.; Piras, D.; Garuti, A.; Gallo, M.; Alberti, S.; Nencioni, A.; Ballestrero, A.; Zoppoli, G. Squalene epoxidase is a bona fide oncogene by amplification with clinical relevance in breast cancer. Sci. Rep. 2016, 6, 19435. [Google Scholar] [CrossRef] [Green Version]
  28. Tong, H.-L.; Li, Q.-Z.; Gao, X.-J.; Yin, D.-Y. Establishment and characterization of a lactating dairy goat mammary gland epithelial cell line. Vitr. Cell. Dev. Biol. Anim. 2012, 48, 149–155. [Google Scholar] [CrossRef]
  29. Nadeem, A.; Maryam, J. Genetic and genomic dissection of Prolactin revealed potential association with milk production traits in riverine buffalo. Trop. Anim. Health Prod. 2016, 48, 1261–1268. [Google Scholar] [CrossRef]
  30. Ma, Y.; Khan, M.Z.; Xiao, J.; Alugongo, G.M.; Chen, X.; Chen, T.; Liu, S.; He, Z.; Wang, J.; Shah, M.K.; et al. Genetic markers associated with milk production traits in dairy cattle. Agriculture 2021, 11, 1018. [Google Scholar] [CrossRef]
  31. Han, B.; Yuan, Y.; Shi, L.; Li, Y.; Liu, L.; Sun, D. Identification of single nucleotide polymorphisms of PIK3R1 and DUSP1 genes and their genetic associations with milk production traits in dairy cows. J. Anim. Sci. Biotechnol. 2019, 10, 81. [Google Scholar] [CrossRef] [Green Version]
  32. Thawee, L.; Elzo, M.A.; Skorn, K.; Thanathip, S.; Danai, J. Genomic-polygenic and polygenic predictions for milk yield, fat yield, and age at first calving in Thai multibreed dairy population using genic and functional sets of genotypes. Livest. Sci. 2019, 219, 17–24. [Google Scholar] [CrossRef]
  33. Le Hir, H.; Nott, A.; Moore, M.J. How introns influence and enhance eukaryotic gene expression. Trends Biochem. Sci. 2003, 28, 215–220. [Google Scholar] [CrossRef] [PubMed]
  34. Wang, H.-F.; Feng, L.; Niu, D.-K. Relationship between mRNA stability and intron presence. Biochem. Biophys. Res. Commun. 2007, 354, 203–208. [Google Scholar] [CrossRef] [PubMed]
  35. Larson, A. Book review: Molecular Markers, Natural-History and Evolution, by Avise, J.C. Science 1995, 267, 115–116. [Google Scholar] [CrossRef]
  36. Slatkin, M. Linkage disequilibrium—Understanding the evolutionary past and mapping the medical future. Nat. Rev. Genet. 2008, 9, 477–485. [Google Scholar] [CrossRef] [PubMed] [Green Version]
  37. Ma, L.; Li, W.; Song, Q. Chromosome-range whole-genome high-throughput experimental haplotyping by single-chromosome microdissection. In Haplotyping: Methods and Protocols; Tiemann-Boege, I., Betancourt, A., Eds.; Springer: New York, NY, USA, 2017; Volume 1551, pp. 161–169. [Google Scholar]
  38. Xu, W.; Chen, Q.; Jia, Y.; Deng, J.; Jiang, S.; Qin, G.; Qiu, Q.; Wang, X.; Yang, X.; Jiang, H. Isolation, characterization, and SREBP1 functional analysis of mammary epithelial cell in buffalo. J. Food Biochem. 2019, 43, e12997. [Google Scholar] [CrossRef]
  39. Suzuki, Y.; Chiba, S.; Nishihara, K.; Nakajima, K.; Hagino, A.; Kim, W.-S.; Lee, H.-G.; Nochi, T.; Suzuki, T.; Roh, S.-G. Chemerin Regulates Epithelial Barrier Function of Mammary Glands in Dairy Cows. Animals 2021, 11, 3194. [Google Scholar] [CrossRef]
  40. Lin, Y.; Sun, H.; Shaukat, A.; Deng, T.; Abdel-Shafy, H.; Che, Z.; Zhou, Y.; Hu, C.; Li, H.; Wu, Q.; et al. Novel Insight Into the Role of ACSL1 Gene in Milk Production Traits in Buffalo. Front. Genet. 2022, 13, 896910. [Google Scholar] [CrossRef]
  41. He, L.; Li, H.; Pan, C.; Hua, Y.; Peng, J.; Zhou, Z.; Zhao, Y.; Lin, M. Squalene epoxidase promotes colorectal cancer cell proliferation through accumulating calcitriol and activating CYP24A1-mediated MAPK signaling. Cancer Commun. 2021, 41, 726–746. [Google Scholar] [CrossRef]
  42. You, W.; Ke, J.; Chen, Y.; Cai, Z.; Huang, Z.-P.; Hu, P.; Wu, X. SQLE, A Key Enzyme in Cholesterol Metabolism, Correlates with Tumor Immune Infiltration and Immunotherapy Outcome of Pancreatic Adenocarcinoma. Front. Immunol. 2022, 13, 864244. [Google Scholar] [CrossRef]
  43. Liu, H.; Ai, J.; Shen, A.; Chen, Y.; Wang, X.; Peng, X.; Chen, H.; Shen, Y.; Huang, M.; Ding, J.; et al. c-Myc Alteration Determines the Therapeutic Response to FGFR Inhibitors. Clin. Cancer Res. 2017, 23, 974–984. [Google Scholar] [CrossRef] [PubMed] [Green Version]
  44. Soucek, L.; Whitfield, J.; Martins, C.P.; Finch, A.J.; Murphy, D.J.; Sodir, N.M.; Karnezis, A.N.; Swigart, L.B.; Nasi, S.; Evan, G.I. Modelling Myc inhibition as a cancer therapy. Nature 2008, 455, 679–683. [Google Scholar] [CrossRef] [PubMed] [Green Version]
  45. Sun, K.; Atoyan, R.; Borek, M.A.; Dellarocca, S.; Samson, M.E.S.; Ma, A.W.; Xu, G.-X.; Patterson, T.; Tuck, D.P.; Viner, J.L.; et al. Dual HDAC and PI3K Inhibitor CUDC-907 Downregulates MYC and Suppresses Growth of MYC-dependent Cancers. Mol. Cancer Ther. 2017, 16, 285–299. [Google Scholar] [CrossRef] [Green Version]
  46. Ushmorov, A.; Debatin, K.M.; Beltinger, C. Growth inhibition of murine neuroblastoma cells by c-myc with cell cycle arrest in G(2)/M. Cancer Biol. Ther. 2005, 4, 181–186. [Google Scholar] [CrossRef] [PubMed] [Green Version]
  47. Dotto, G.P. p21(WAF1/Cip1): More than a break to the cell cycle? Biochim. Biophys. Acta Rev. Cancer 2000, 1471, M43–M56. [Google Scholar] [CrossRef]
  48. Warbrick, E.; Lane, D.P.; Glover, D.M.; Cox, L.S. A small peptide inhibitor of dna-replication defines the site of interaction between the cyclin-dependent kinase inhibitor p21(waf1) and proliferating cell nuclear antigen. Curr. Biol. 1995, 5, 275–282. [Google Scholar] [CrossRef] [Green Version]
  49. Moldovan, G.-L.; Pfander, B.; Jentsch, S. PCNA, the maestro of the replication fork. Cell 2007, 129, 665–679. [Google Scholar] [CrossRef] [Green Version]
  50. Liu, K.; Zhang, Q.; Lan, H.; Wang, L.; Mou, P.; Shao, W.; Liu, D.; Yang, W.; Lin, Z.; Lin, Q.; et al. GCN5 Potentiates Glioma Proliferation and Invasion via STAT3 and AKT Signaling Pathways. Int. J. Mol. Sci. 2015, 16, 21897–21910. [Google Scholar] [CrossRef] [Green Version]
  51. Sun, C.-Y.; Zhang, X.-P.; Wang, W. Coordination of miR-192 and miR-22 in p53-Mediated Cell Fate Decision. Int. J. Mol. Sci. 2019, 20, 4768. [Google Scholar] [CrossRef] [Green Version]
  52. Miller, N.; Delbecchi, L.; Petitclerc, D.; Wagner, G.F.; Talbot, B.G.; Lacasse, P. Effect of stage of lactation and parity on mammary gland cell renewal. J. Dairy Sci. 2006, 89, 4669–4677. [Google Scholar] [CrossRef] [Green Version]
  53. Zhichen, T.; Yuanyuan, Z.; Huiming, Z.; Yujia, S.; Yongjiang, M.; Zhangping, Y.; Mingxun, L. Transcriptional regulation of milk fat synthesis in dairy cattle. J. Funct. Foods 2022, 96, 105208. [Google Scholar] [CrossRef]
  54. Zhang, D.-D.; Wang, D.-D.; Wang, Z.; Wang, Y.-B.; Li, G.-X.; Sun, G.-R.; Tian, Y.-D.; Han, R.-L.; Li, Z.-J.; Jiang, R.-R.; et al. Estrogen Abolishes the Repression Role of gga-miR-221-5p Targeting ELOVL6 and SQLE to Promote Lipid Synthesis in Chicken Liver. Int. J. Mol. Sci. 2020, 21, 1624. [Google Scholar] [CrossRef] [PubMed] [Green Version]
  55. Anderson, S.M.; Rudolph, M.C.; Mcmanaman, J.L.; Neville, M.C. Secretory activation in the mammary gland: It’s not just about milk protein synthesis! Breast Cancer Res. 2007, 9, 1–14. [Google Scholar] [CrossRef] [PubMed]
  56. Li, N.; Zhao, F.; Wei, C.; Liang, M.; Zhang, N.; Wang, C.; Li, Q.-Z.; Gao, X.-J. Function of SREBP1 in the Milk Fat Synthesis of Dairy Cow Mammary Epithelial Cells. Int. J. Mol. Sci. 2014, 15, 16998–17013. [Google Scholar] [CrossRef] [PubMed] [Green Version]
  57. St-Gelais, D.; Hache, S. Effect of β-casein concentration in cheese milk on rennet coagulation properties, cheese composition and cheese ripening. Food Res. Int. 2005, 38, 523–531. [Google Scholar] [CrossRef]
  58. Farrell, H.M.J.R.; Jimenez-Flores, R.; Bleck, G.T.; Brown, E.M.; Swaisgood, H.E. Nomenclature of the Proteins of Cows’ Milk—Sixth Revision. J. Dairy Sci. 2004, 87, 1641–1674. [Google Scholar] [CrossRef] [PubMed] [Green Version]
  59. Zhang, M.C.; Zhao, S.G.; Wang, S.S.; Luo, C.C.; Gao, H.N.; Zheng, N.; Wang, J.Q. d-Glucose and amino acid deficiency inhibits casein synthesis through JAK2/STAT5 and AMPK/mTOR signaling pathways in mammary epithelial cells of dairy cows. J. Dairy Sci. 2018, 101, 1737–1746. [Google Scholar] [CrossRef]
  60. Rius, A.G.; Appuhamy, J.A.D.R.N.; Cyriac, J.; Kirovski, D.; Becvar, O.; Escobar, J.; McGilliard, M.L.; Bequette, B.J.; Akers, R.M.; Hanigan, M.D. Regulation of protein synthesis in mammary glands of lactating dairy cows by starch and amino acids. J. Dairy Sci. 2010, 93, 3114–3127. [Google Scholar] [CrossRef] [Green Version]
  61. Burnett, P.E.; Barrow, R.K.; Cohen, N.A.; Snyder, S.H.; Sabatini, D.M. RAFT1 phosphorylation of the translational regulators p70 S6 kinase and 4E-BP1. Proc. Natl. Acad. Sci. USA 1998, 95, 1432–1437. [Google Scholar] [CrossRef] [Green Version]
  62. Schindler, C.; Levy, D.E.; Decker, T. JAK-STAT signaling: From interferons to cytokines. J. Biol. Chem. 2007, 282, 20059–20063. [Google Scholar] [CrossRef] [Green Version]
  63. Ye, T.; Deng, T.; Hosseini, S.M.; Raza, S.H.A.; Du, C.; Chen, C.; Zhang, X.; Hu, X.; Yang, L. Association analysis between FASN genotype and milk traits in Mediterranean buffalo and its expression among different buffalo tissues. Trop. Anim. Health Prod. 2021, 53, 366. [Google Scholar] [CrossRef] [PubMed]
  64. Baldi, F.; Massolini Laureano, M.M.; Mansan Gordo, D.G.; Bignardi, A.B.; Aspilcueta Borquis, R.R.; de Albuquerque, L.G.; Tonhati, H. Effect of lactation length adjustment procedures on genetic parameter estimates for buffalo milk yield. Genet. Mol. Biol. 2011, 34, 62–67. [Google Scholar] [CrossRef] [PubMed]
  65. Li, J.; Liu, J.; Liu, S.; Campanile, G.; Salzano, A.; Gasparrini, B.; Plastow, G.; Zhang, C.; Wang, Z.; Liang, A.; et al. Genome-wide association study for buffalo mammary gland morphology. J. Dairy Res. 2020, 87, 27–31. [Google Scholar] [CrossRef]
  66. Anand, V.; Dogra, N.; Singh, S.; Kumar, S.N.; Jena, M.K.; Malakar, D.; Dang, A.K.; Mishra, B.P.; Mukhopadhyay, T.K.; Kaushik, J.K.; et al. Establishment and Characterization of a Buffalo (Bubalus bubalis) Mammary Epithelial Cell Line. PLoS ONE 2012, 7, e40469. [Google Scholar] [CrossRef] [Green Version]
  67. Schmittgen, T.D.; Livak, K.J. Analyzing real-time PCR data by the comparative C(T) method. Nat. Protoc. 2008, 3, 1101–1108. [Google Scholar] [CrossRef] [PubMed]
  68. Liu, S.; Deng, T.; Hua, L.; Zhao, X.; Wu, H.; Sun, P.; Liu, M.; Zhang, S.; Yang, L.; Liang, A. Novel functional mutation of the PDIA3 gene affects milk composition traits in Chinese Holstein cattle. J. Dairy Sci. 2022, 105, 5153–5166. [Google Scholar] [CrossRef] [PubMed]
  69. Chen, C.; Ahmad, M.J.; Ye, T.; Du, C.; Zhang, X.; Liang, A.; Yang, L. Cathepsin B Regulates Mice Granulosa Cells’ Apoptosis and Proliferation In Vitro. Int. J. Mol. Sci. 2021, 22, 11827. [Google Scholar] [CrossRef] [PubMed]
  70. Li, Y.; Xu, W.; Zhang, F.; Zhong, S.; Sun, Y.; Huo, J.; Zhu, J.; Wu, C. The Gut Microbiota-Produced Indole-3-Propionic Acid Confers the Antihyperlipidemic Effect of Mulberry-Derived 1-Deoxynojirimycin. Msystems 2020, 5, e00313-20. [Google Scholar] [CrossRef] [PubMed]
Figure 1. Schematic representation of buffalo SQLE gene with the localization of five identified SNPs and their SNP genotyping plots. E: exon region; I: intron region. Red squares represent mutant loci, different colored lines represent different bases.
Ijms 24 02436 g001
Figure 2. Linkage disequilibrium among the five SNPs of the SQLE gene. The “Block 1 (3 kb)” indicates haplotype block, and the text above the horizontal number is the SNP name. The red squares represent high pairwise linkage disequilibrium, coloring down to white squares of low pairwise linkage disequilibrium.
Ijms 24 02436 g002
Figure 3. SQLE gene expression profile and interference efficiency. (A) mRNA expression profile of SQLE in different tissues of buffalo by quantitative real-time PCR method; (B) immunofluorescence identification of BuMECs with cytokeratin 18; (C) BuMECs were transfected with siSQLE, and fluorescence quantitative qPCR was used to detect the SQLE mRNA levels; (D,E) Western Blot detected the protein expression of SQLE. n = 3 biological replicates. * p < 0.05, ** p < 0.01, *** p < 0.001, compared with control group. Error bars represent SEM.
Ijms 24 02436 g003
Figure 4. Effect of knockdown SQLE gene on BuMECs proliferation and apoptosis. (A) (si-NC) and (B) (si-SQLE) cell cycle distribution; (C) flow cytometry was used to detect cell cycle progression; (D) (si-NC) and (E) (si-SQLE) cell apoptosis distribution; (F) the rates of early, late, and total apoptosis were assessed. (G) The CCK-8 assay showed that SQLE knockdown resulted in a significant decrease in cell viability; (H) the cell counting test showed that BuMECs were significantly decreased after SQLE knockdown; (I) mRNA expression of cell cycle, proliferation, and apoptosis–related genes. n = 3 biological replicates. * p < 0.05, ** p < 0.01, *** p < 0.001, ns: nonsignificant difference, compared with control group. Error bars represent SEM.
Ijms 24 02436 g004
Figure 5. SQLE regulate lipogenesis and casein synthesis in BuMECs. (A) Triglyceride concentration was detected in the cell lysate. Triglyceride concentration was normalized by control; (BD) Oil red O staining was used to indicate the lipid droplet secretion of BufMECs (Scare bars: 100 μm); (E) content of α-casein, β-casein, and κ-casein in the BuMECs culture supernatant was determined by ELISA. (F) mRNA expression of milk fat and protein synthesis-related genes after SQLE knockdown, and GAPDH was used as the inner control. n = 3 biological replicates. * p < 0.05, ** p < 0.01, ns: nonsignificant difference, compared with control group. Error bars represent SEM.
Ijms 24 02436 g005
Table 1. Genetic information about five SNPs identified in the buffalo SQLE gene.
SnpsLocationGenotypesGenotype FrequencyAlleleAllele FrequenciesHeterozygosityPIC
g.14238G > Tintron6GT0.244G0.8700.2260.201
GG0.748T0.130
TT0.008
g.16409C > Tintron7CC0.207C0.4620.4970.374
TT0.283T0.538
TC0.509
g.18858G > AIntron7GG0.061G0.2200.3430.284
AA0.620A0.780
GA0.319
g.22146C > AIntron9CA0.020A0.9730.0530.052
AA0.963C0.027
CC0.017
g.22834C > TIntron9CC0.518C0.5100.4800.365
TT0.318T0.490
CT0.163987
Table 2. Association of SQLE gene polymorphisms and milk production traits in Italian Mediterranean buffaloes.
SNPsGenotypePM (kg)MY (kg)FY (kg)FP (%)PY (kg)PP (%)
g.14238G > TGG14.55 ± 0.0.352792.28 ± 77.98214.44 ± 7.007.69 ± 0.15125.74 ± 3.574.53 ± 0.04
GT14.78 ± 0.382855.74 ± 83.00218.69 ± 7.357.68 ± 0.15128.01 ± 3.824.51 ± 0.04
TT14.36 ± 1.162763.13 ± 249.56205.24 ± 21.047.44 ± 0.42128.04 ± 11.714.65 ± 0.12
p-value0.600.440.530.810.630.39
g.16409C > TCC15.03 ± 0.242896.56 ± 51.01228.32 ± 4.297.89 ± 0.09131.17 ± 2.404.56 ± 0.03
TC15.01 ± 0.172898.93 ± 35.63229.30 ± 3.017.95 ± 0.06131.88 ± 1.674.57 ± 0.02
TT14.85 ± 0.232865.60 ± 48.61228.47 ± 4.098.03 ± 0.08129.69 ± 2.284.56 ± 0.02
p-value0.770.810.970.390.680.86
g.18858G > AAA14.89 ± 0.162861.68 ± 35.11 225.47 ± 2.93 a 7.89 ± 0.06 129.75 ± 1.65 4.57 ± 0.02
AG15.20 ± 0.202929.74 ± 44.07 235.45 ± 3.67 b 8.01 ± 0.07 133.35 ± 2.07 4.57 ± 0.02
GG15.23 ± 0.482924.20 ± 105.49 233.81 ± 8.73 ab8.00 ± 0.18 133.14 ± 4.95 4.58 ± 0.05
p-value0.360.370.040.350.280.98
g.22146C > AAA15.03 ± 0.142894.36 ± 30.88228.22 ± 2.617.91 ± 0.05131.15 ± 1.454.56 ± 0.02
CA15.46 ± 0.843016.19 ± 182.20234.68 ± 15.387.86 ± 0.31137.92 ± 8.544.59 ± 0.09
CC15.12 ± 0.802924.92 ± 171.91233.06 ± 14.337.93 ± 0.28132.17 ± 8.094.53 ± 0.09
p-value0.870.790.870.980.730.90
g.22834C > TCC14.70 ± 0.19 a 2821.10 ± 40.20 a 222.50 ± 3.36 a 7.92 ± 0.07128.07 ± 1.90 a 4.56 ± 0.02
CT15.23 ± 0.30 ab 2939.96 ± 64.98 ab 227.13 ± 5.41 ab 7.75 ± 0.11132.27 ± 3.08 ab 4.53 ± 0.03
TT15.31 ± 0.22 b 2951.77 ± 46.75 b 235.56 ± 3.86 b 8.01 ± 0.08134.53 ± 2.22 b 4.57 ± 0.02
p-value0.040.030.020.110.040.46
Note: The values of milk production traits in each genotype are represented as Least squares mean (LSM) ± standard errors (SE). Different superscripts in the same column indicate a significant difference between various groups (a,b p < 0.05). MY = milk yield; FY = fat yield; FP = fat percentage; PY = protein yield; PP = protein percentage.
Table 3. Association of haplotype combinations of SQLE with milk production traits in Italian Mediterranean buffaloes.
BlockH1H1H1H3H2H3p-Value
SequenceCA/CACA/TGTA/TG
Number1876753
Frequencies (%)56.5020.2416.01
PM (kg)15.22 ± 0.1915.07 ± 0.2814.76 ± 0.170.13
MY (kg)2933.75 ± 41.552923.90 ± 60.252842.81 ± 37.150.15
FY (kg)235.78 ± 3.44 a226.97 ± 5.00 ab225.02 ± 3.09 b0.03
FP (%)8.03 ± 0.07 a7.73 ± 0.10 b7.94 ± 0.06 ab0.04
PY (kg)133.33 ± 1.88 a131.63 ± 2.73 ab127.80 ± 1.69 b0.04
PP (%)4.57 ± 0.024.53 ± 0.034.57 ± 0.020.44
Note: The values of milk production traits in each genotype are represented as Least squares mean (LSM) ±standard errors (SE). Different superscripts in the same row indicate a significant difference between various groups (a,b p < 0.05). PM = peak milk yield; MY = milk yield; FY = fat yield; FP = fat percentage; PY = protein yield; PP = protein percentage.
Disclaimer/Publisher’s Note: The statements, opinions and data contained in all publications are solely those of the individual author(s) and contributor(s) and not of MDPI and/or the editor(s). MDPI and/or the editor(s) disclaim responsibility for any injury to people or property resulting from any ideas, methods, instructions or products referred to in the content.

