
The Masticatory Activity Interference in Quantitative Estimation of CA1, CA3 and Dentate Gyrus Hippocampal Astrocytes of Aged Murine Models and under Environmental Stimulation

 , , ,
, , ,
Abstract
:
1. Introduction
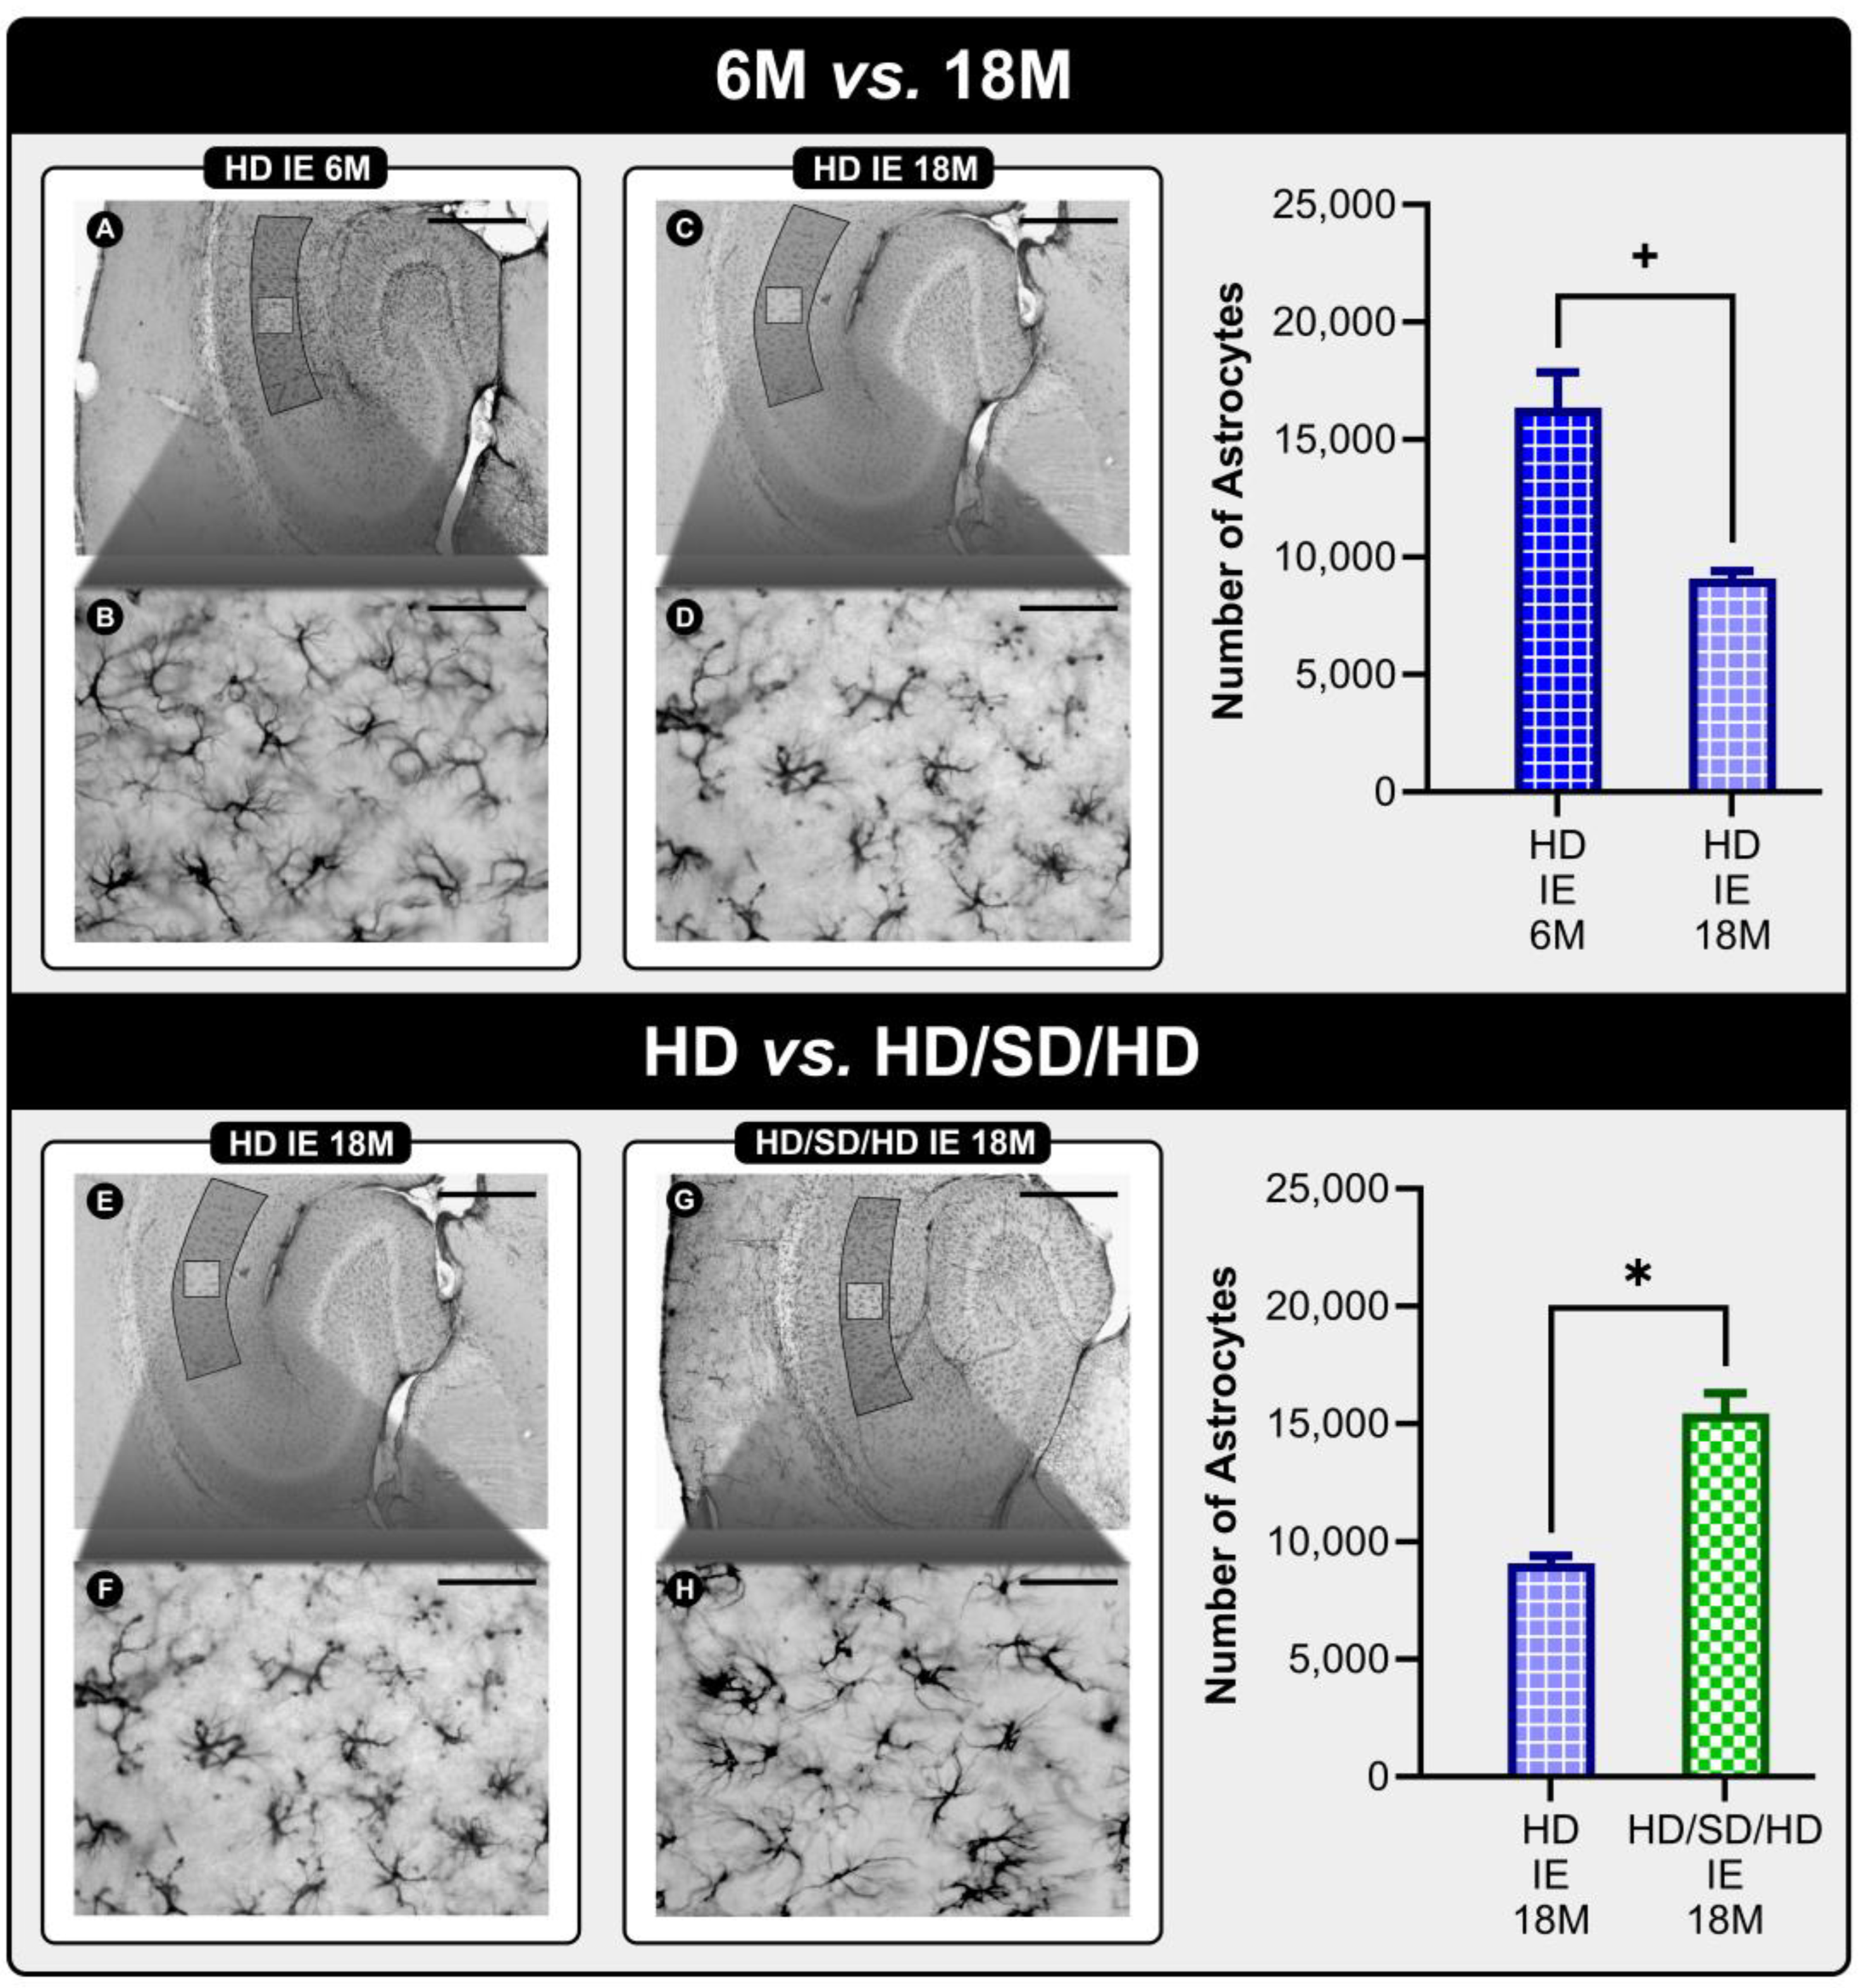
2. Results
3. Discussion
4. Materials and Methods
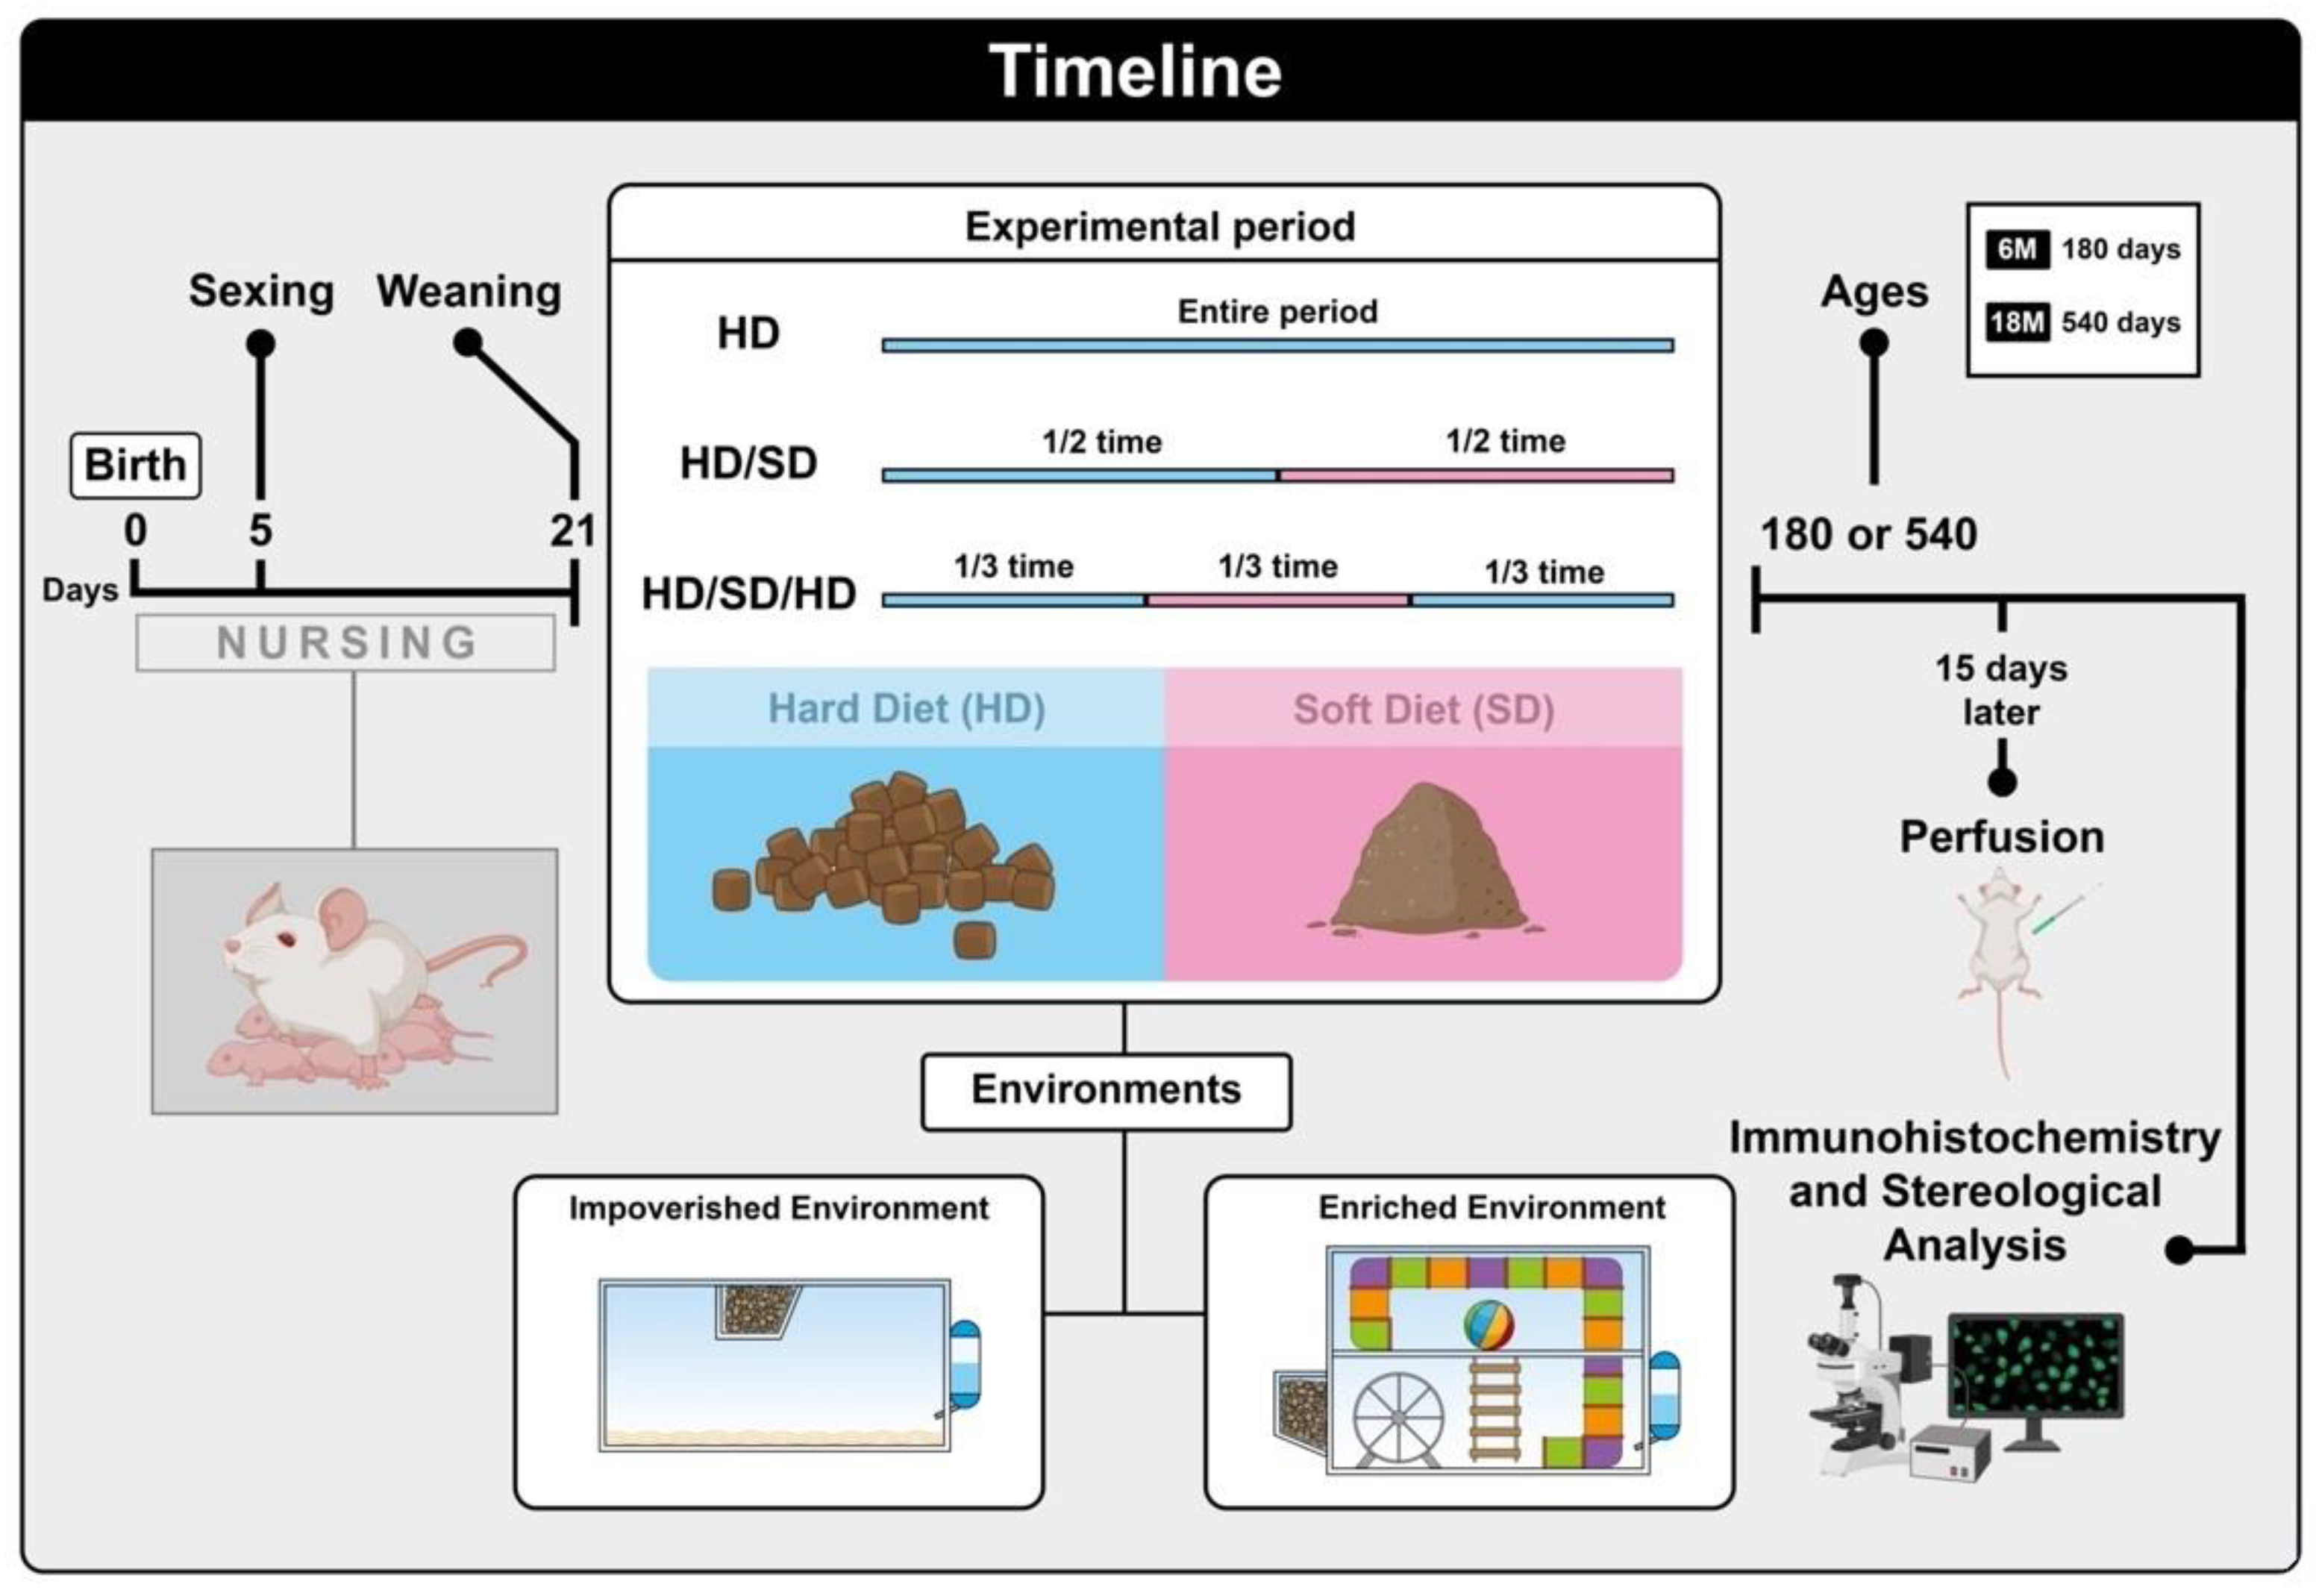
4.1. Animals and Experimental Groups
4.2. Feeding and Experimental Timeline
4.3. Housing Conditions
4.4. Body Weight
4.5. Perfusion and Histology Procedures
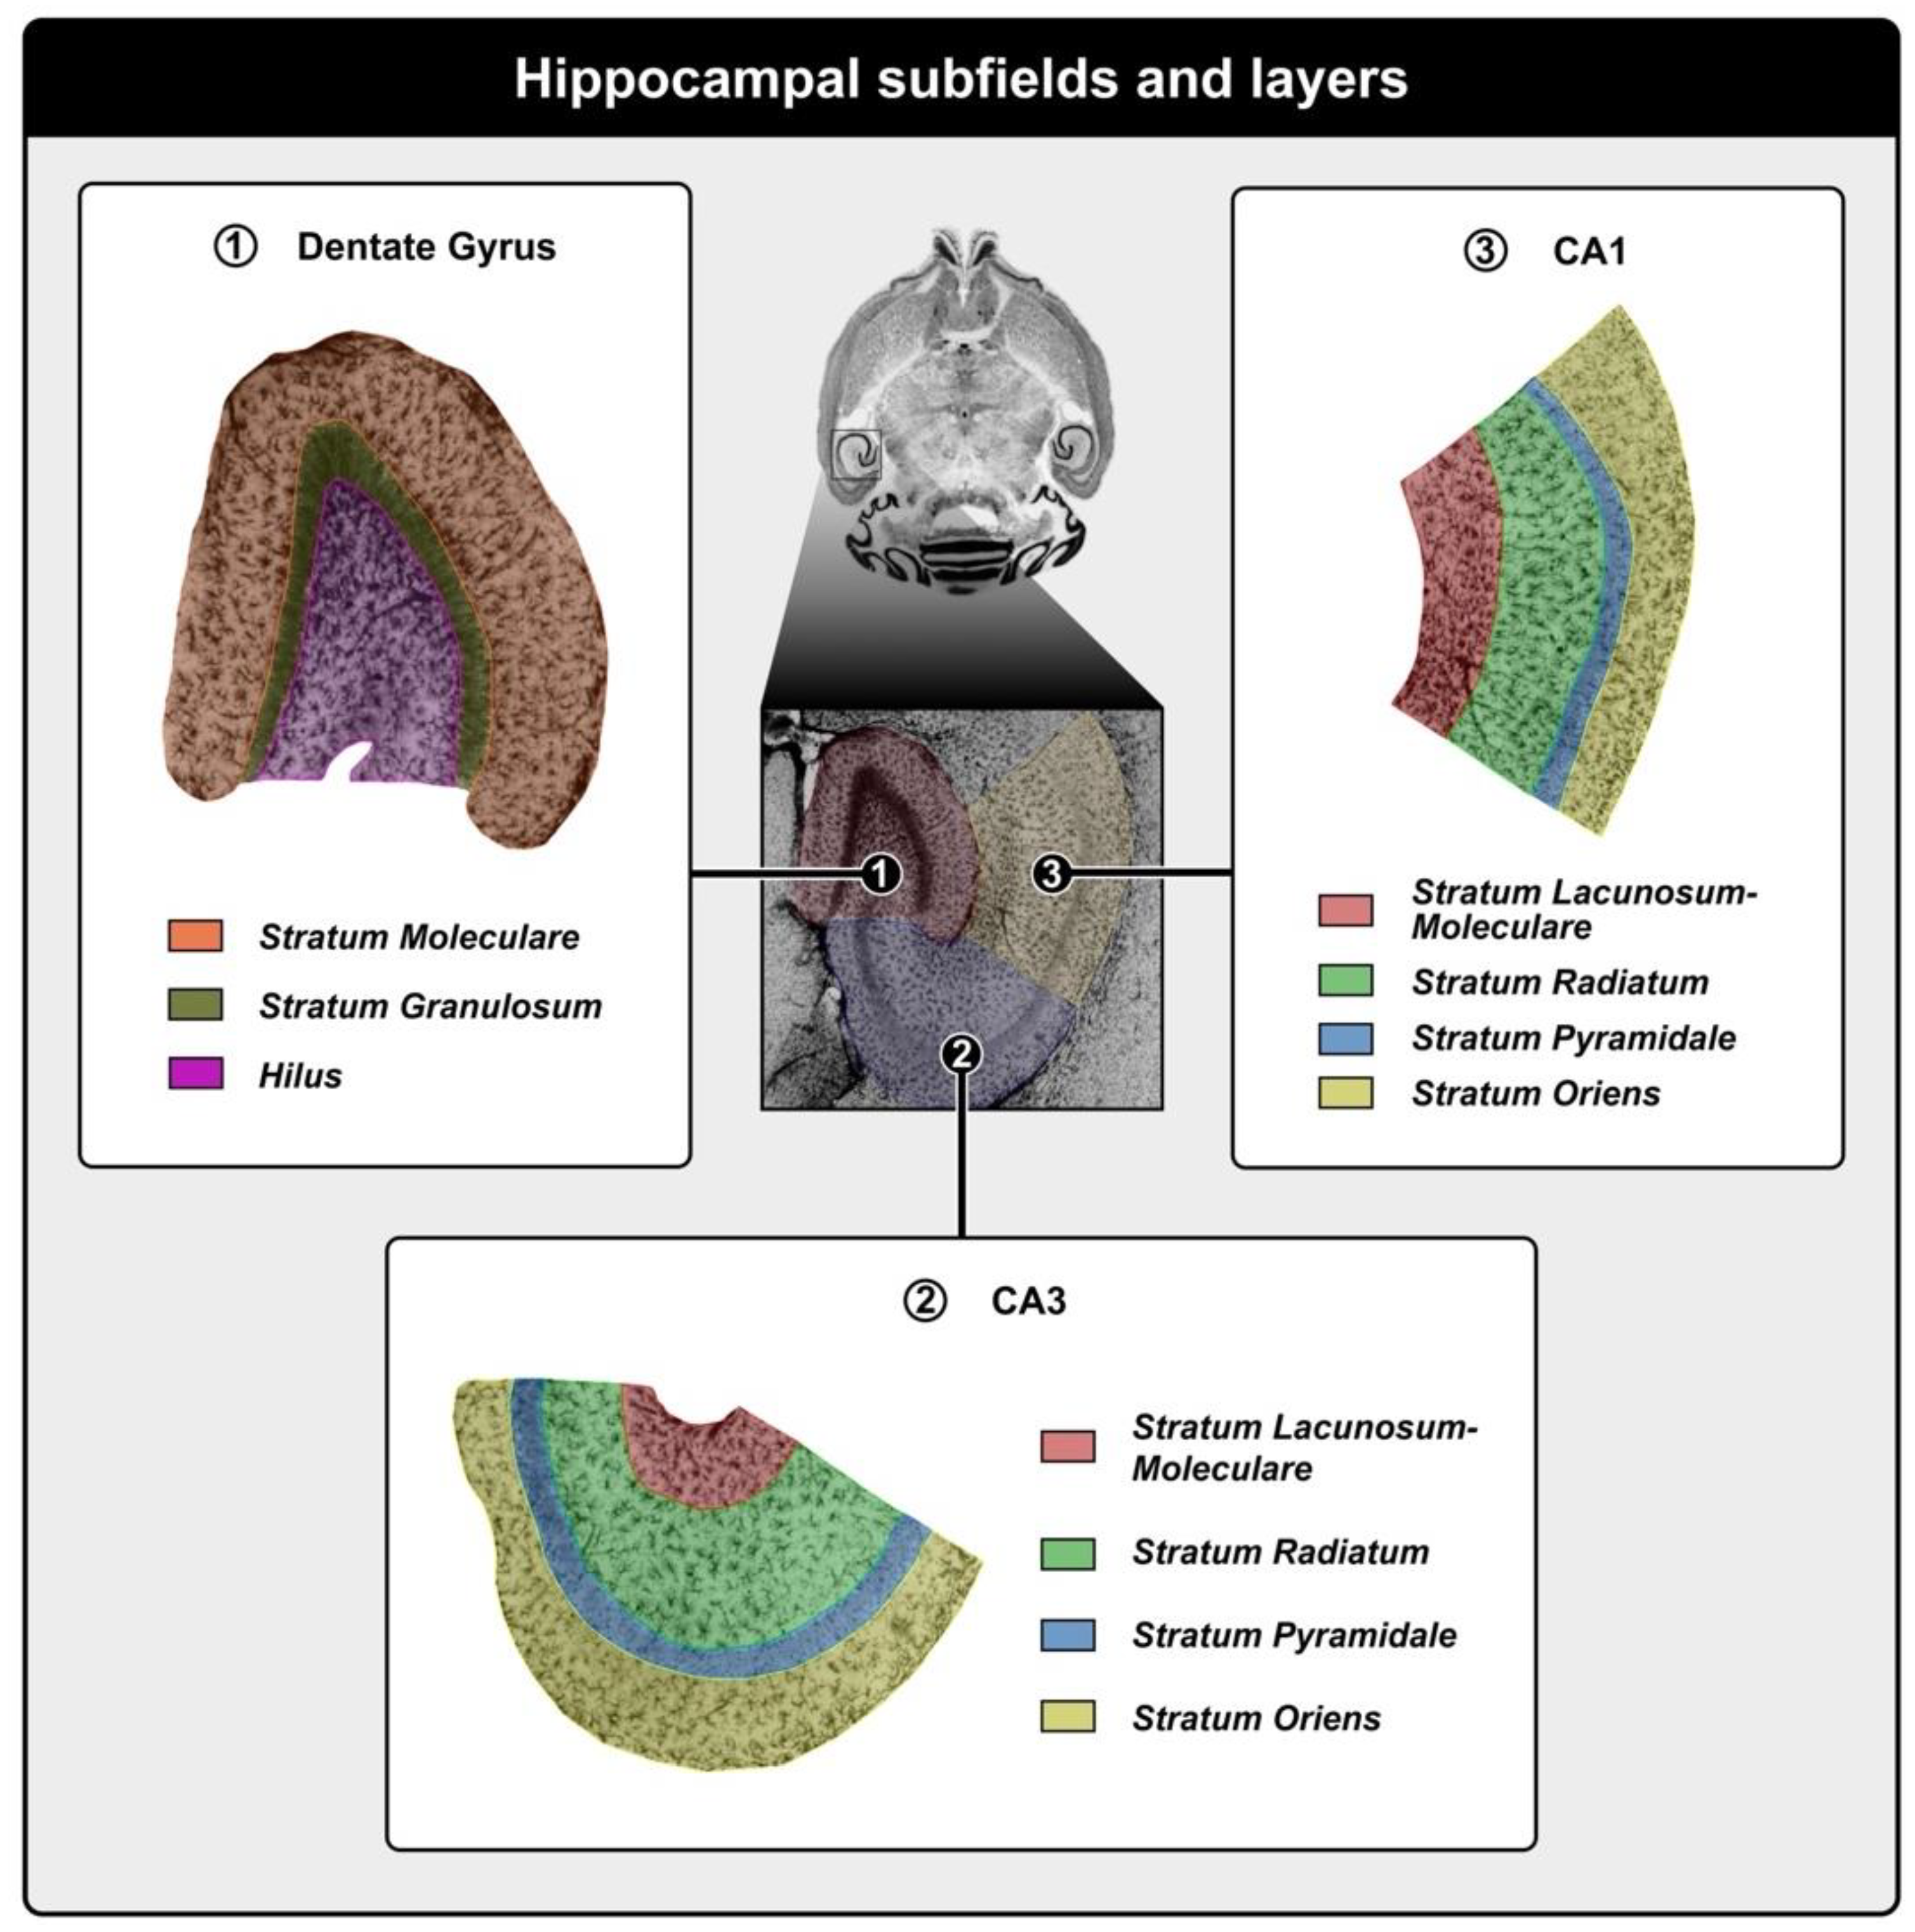
4.6. Microscopy and Optical Fractionator
4.7. Photomicrographic Documentation
4.8. Statistical Analysis
5. Conclusions
Supplementary Materials
Author Contributions
Funding
Institutional Review Board Statement
Informed Consent Statement
Data Availability Statement
Acknowledgments
Conflicts of Interest
References
- Alvarenga, M.O.P.; Ferreira, R.O.; Magno, M.B.; Fagundes, N.C.F.; Maia, L.C.; Lima, R.R. Masticatory dysfunction by extensive tooth loss as a risk factor for cognitive deficit: A systematic review and meta-analysis. Front. Physiol. 2019, 10, 832. [Google Scholar] [CrossRef] [PubMed] [Green Version]
- Chen, H.; Iinuma, M.; Onozuka, M.; Kubo, K.Y. Chewing maintains hippocampus-dependent cognitive function. Int. J. Med. Sci. 2015, 12, 502–509. [Google Scholar] [CrossRef] [PubMed] [Green Version]
- Petousi, V.G.; Proios, H.; Triarhou, L.C. The physiological experiments of constantin von economo on the central pathways of mastication and deglutition. Rev. Neurol. 2019, 175, 506–518. [Google Scholar] [CrossRef] [PubMed]
- Montalant, A.; Carlsen, E.M.M.; Perrier, J.F. Role of astrocytes in rhythmic motor activity. Physiol. Rep. 2021, 9, e15029. [Google Scholar] [CrossRef]
- Turk, A.Z.; Bishop, M.; Adeck, A.; SheikhBahaei, S. Astrocytic modulation of central pattern generating motor circuits. Glia 2022, 70, 1506–1519. [Google Scholar] [CrossRef] [PubMed]
- Cardoso, M.G.; Diniz-Freitas, M.; Vázquez, P.; Cerqueiro, S.; Diz, P.; Limeres, J. Relationship between functional masticatory units and cognitive impairment in elderly persons. J. Oral Rehabil. 2019, 46, 417–423. [Google Scholar] [CrossRef]
- Cerutti-Kopplin, D.; Feine, J.; Padilha, D.M.; de Souza, R.F.; Ahmadi, M.; Rompré, P.; Booij, L.; Emami, E. Tooth loss increases the risk of diminished cognitive function: A systematic review and meta-analysis. JDR Clin. Transl. Res. 2016, 1, 10–19. [Google Scholar] [CrossRef]
- Choi, S.E.; Mo, E.; Palmer, N.; Fox, K.; Da Silva, J.D.; Nagai, S.; Barrow, J.R. Cognitive impairment and edentulism among older adults: An observational study using claims data. BMC Geriatr. 2022, 22, 278. [Google Scholar] [CrossRef]
- Delwel, S.; Scherder, E.J.A.; Perez, R.; Hertogh, C.; Maier, A.B.; Lobbezoo, F. Oral function of older people with mild cognitive impairment or dementia. J. Oral Rehabil. 2018, 45, 990–997. [Google Scholar] [CrossRef] [Green Version]
- Jung, Y.S.; Park, T.; Kim, E.K.; Jeong, S.H.; Lee, Y.E.; Cho, M.J.; Song, K.B.; Choi, Y.H. Influence of chewing ability on elderly adults’ cognitive functioning: The mediating effects of the ability to perform daily life activities and nutritional status. Int. J. Environ. Res. Public Health 2022, 19, 1236. [Google Scholar] [CrossRef]
- Kim, M.S.; Oh, B.; Yoo, J.W.; Han, D.H. The association between mastication and mild cognitive impairment in Korean adults. Medicine 2020, 99, e20653. [Google Scholar] [CrossRef] [PubMed]
- Ahmed, S.E.; Mohan, J.; Kalaignan, P.; Kandasamy, S.; Raju, R.; Champakesan, B. Influence of dental prostheses on cognitive functioning in elderly population: A systematic review. J. Pharm. Bioallied Sci. 2021, 13 (Suppl. 1), S788–S794. [Google Scholar] [CrossRef] [PubMed]
- Tada, A.; Miura, H. Association between mastication and cognitive status: A systematic review. Arch. Gerontol. Geriatr. 2017, 70, 44–53. [Google Scholar] [CrossRef]
- Galindo-Moreno, P.; Lopez-Chaichio, L.; Padial-Molina, M.; Avila-Ortiz, G.; O’Valle, F.; Ravida, A.; Catena, A. The impact of tooth loss on cognitive function. Clin. Oral Investig. 2022, 26, 3493–3500. [Google Scholar] [CrossRef]
- Beker, N.; van der Maarel-Wierink, C.D.; de Baat, C.; Holstege, H. Self-reported oral health in the Dutch 100-plus study of cognitively healthy centenarians: An observational cohort study. BMC Geriatr. 2019, 19, 355. [Google Scholar] [CrossRef] [PubMed] [Green Version]
- Kubo, K.Y.; Murabayashi, C.; Kotachi, M.; Suzuki, A.; Mori, D.; Sato, Y.; Onozuka, M.; Azuma, K.; Iinuma, M. Tooth loss early in life suppresses neurogenesis and synaptophysin expression in the hippocampus and impairs learning in mice. Arch. Oral Biol. 2017, 74, 21–27. [Google Scholar] [CrossRef]
- Mendes, F.D.C.C.D.S.; de Almeida, M.N.F.; Felício, A.P.G.; Fadel, A.C.; Silva, D.D.J.; Borralho, T.G.; da Silva, R.P.; Bento-Torres, J.; Vasconcelos, P.F.D.C.; Perry, V.H.; et al. Enriched environment and masticatory activity rehabilitation recover spatial memory decline in aged mice. BMC Neurosci. 2013, 14, 63. [Google Scholar] [CrossRef] [Green Version]
- Mendes, F.D.C.C.D.S.; de Almeida, M.N.F.; Falsoni, M.; Andrade, M.L.F.; Felício, A.P.G.; da Paixão, L.T.V.B.; Júnior, F.L.D.A.; Anthony, D.C.; Brites, D.; Diniz, C.W.P.; et al. The sedentary lifestyle and masticatory dysfunction: Time to review the contribution to age-associated cognitive decline and astrocyte morphotypes in the dentate gyrus. Int. J. Mol. Sci. 2022, 23, 6342. [Google Scholar] [CrossRef]
- Chuhuaicura, P.; Dias, F.J.; Arias, A.; Lezcano, M.F.; Fuentes, R. Mastication as a protective factor of the cognitive decline in adults: A qualitative systematic review. Int. Dent. J. 2019, 69, 334–340. [Google Scholar] [CrossRef] [Green Version]
- Wang, X.; Hu, J.; Jiang, Q. Tooth loss-associated mechanisms that negatively affect cognitive function: A systematic review of animal experiments based on occlusal support loss and cognitive impairment. Front. Neurosci. 2022, 16, 811335. [Google Scholar] [CrossRef]
- Piancino, M.G.; Tortarolo, A.; Polimeni, A.; Bramanti, E.; Bramanti, P. Altered mastication adversely impacts morpho-functional features of the hippocampus: A systematic review on animal studies in three different experimental conditions involving the masticatory function. PLoS ONE 2020, 15, e0237872. [Google Scholar] [CrossRef] [PubMed]
- Miyake, S.; Wada-Takahashi, S.; Honda, H.; Takahashi, S.S.; Sasaguri, K.; Sato, S.; Lee, M.C. Stress and chewing affect blood flow and oxygen levels in the rat brain. Arch. Oral Biol. 2012, 57, 1491–1497. [Google Scholar] [CrossRef]
- Lopez-Chaichio, L.; Padial-Molina, M.; O’Valle, F.; Gil-Montoya, J.A.; Catena, A.; Galindo-Moreno, P. Oral health and healthy chewing for healthy cognitive ageing: A comprehensive narrative review. Gerodontology 2021, 38, 126–135. [Google Scholar] [CrossRef]
- Furukawa, M.; Tada, H.; Wang, J.; Yamada, M.; Kurosawa, M.; Satoh, A.; Ogiso, N.; Shikama, Y.; Matsushita, K. Molar loss induces hypothalamic and hippocampal astrogliosis in aged mice. Sci. Rep. 2022, 12, 6409, Erratum in: Sci Rep. 2022, 38, 12668. [Google Scholar] [CrossRef] [PubMed]
- Salas, I.H.; Burgado, J.; Allen, N.J. Glia: Victims or villains of the aging brain? Neurobiol. Dis. 2020, 143, 105008. [Google Scholar] [CrossRef] [PubMed]
- Taslima, F.; Abdelhamid, M.; Zhou, C.; Chen, Y.; Jung, C.-G.; Michikawa, M. Tooth loss induces memory impairment and glial activation in young wild-type mice. J. Alzheimer’s Dis. Rep. 2022, 6, 663–675. [Google Scholar] [CrossRef]
- Lin, C.S.; Lin, H.H.; Fann, S.W.; Lee, W.J.; Hsu, M.L.; Wang, S.J.; Fuh, J.L. Association between tooth loss and gray matter volume in cognitive impairment. Brain Imaging Behav. 2020, 14, 396–407. [Google Scholar] [CrossRef]
- Frota de Almeida, M.N.; de Siqueira Mendes Fde, C.; Gurgel Felício, A.P.; Falsoni, M.; Ferreira de Andrade, M.L.; Bento-Torres, J.; da Costa Vasconcelos, P.F.; Perry, V.H.; Picanço-Diniz, C.W.; Kronka Sosthenes, M.C. Spatial memory decline after masticatory deprivation and aging is associated with altered laminar distribution of CA1 astrocytes. BMC Neurosci. 2012, 13, 23. [Google Scholar] [CrossRef] [Green Version]
- Bellaver, B.; Souza, D.G.; Souza, D.O.; Quincozes-Santos, A. Hippocampal astrocyte cultures from adult and aged rats reproduce changes in glial functionality observed in the aging brain. Mol. Neurobiol. 2017, 54, 2969–2985. [Google Scholar] [CrossRef]
- Osborn, L.M.; Kamphuis, W.; Wadman, W.J.; Hol, E.M. Astrogliosis: An integral player in the pathogenesis of alzheimer’s disease. Prog. Neurobiol. 2016, 144, 121–141. [Google Scholar] [CrossRef]
- Santello, M.; Toni, N.; Volterra, A. Astrocyte function from information processing to cognition and cognitive impairment. Nat. Neurosci. 2019, 22, 154–166. [Google Scholar] [CrossRef] [PubMed] [Green Version]
- Escartin, C.; Guillemaud, O.; Carrillo-de Sauvage, M.A. Questions and (some) answers on reactive astrocytes. Glia 2019, 67, 2221–2247. [Google Scholar] [CrossRef] [PubMed]
- Escartin, C.; Galea, E.; Lakatos, A.; O’Callaghan, J.P.; Petzold, G.C.; Serrano-Pozo, A.; Steinhäuser, C.; Volterra, A.; Carmignoto, G.; Agarwal, A.; et al. Reactive astrocyte nomenclature, definitions, and future directions. Nat. Neurosci. 2021, 24, 312–325. [Google Scholar] [CrossRef]
- Price, B.R.; Johnson, L.A.; Norris, C.M. Reactive astrocytes: The nexus of pathological and clinical hallmarks of Alzheimer’s disease. Ageing Res. Rev. 2021, 68, 101335. [Google Scholar] [CrossRef]
- Rampon, C.; Jiang, C.H.; Dong, H.; Tang, Y.P.; Lockhart, D.J.; Schultz, P.G.; Tsien, J.Z.; Hu, Y. Effects of environmental enrichment on gene expression in the brain. Proc. Natl. Acad. Sci. USA 2000, 97, 12880–12884. [Google Scholar] [CrossRef] [Green Version]
- Sampedro-Piquero, P.; De Bartolo, P.; Petrosini, L.; Zancada-Menendez, C.; Arias, J.L.; Begega, A. Astrocytic plasticity as a possible mediator of the cognitive improvements after environmental enrichment in aged rats. Neurobiol. Learn. Mem. 2014, 114, 16–25. [Google Scholar] [CrossRef] [PubMed]
- Singhal, G.; Jaehne, E.J.; Corrigan, F.; Baune, B.T. Cellular and molecular mechanisms of immunomodulation in the brain through environmental enrichment. Front. Cell. Neurosci. 2014, 8, 97. [Google Scholar] [CrossRef] [Green Version]
- Diniz, D.G.; de Oliveira, M.A.; de Lima, C.M.; Fôro, C.A.; Sosthenes, M.C.; Bento-Torres, J.; da Costa Vasconcelos, P.F.; Anthony, D.C.; Diniz, C.W. Age, environment, object recognition and morphological diversity of GFAP-immunolabeled astrocytes. Behav. Brain Funct. BBF 2016, 12, 28. [Google Scholar] [CrossRef] [Green Version]
- de Siqueira Mendes, F.C.C.; Paixão, L.; Diniz, D.G.; Anthony, D.C.; Brites, D.; Diniz, C.W.P.; Sosthenes, M.C.K. Sedentary life and reduced mastication impair spatial learning and memory and differentially affect dentate gyrus astrocyte subtypes in the aged mice. Front. Neurosci. 2021, 15, 632216. [Google Scholar] [CrossRef]
- Griñán-Ferré, C.; Izquierdo, V.; Otero, E.; Puigoriol-Illamola, D.; Corpas, R.; Sanfeliu, C.; Ortuño-Sahagún, D.; Pallàs, M. Environmental enrichment improves cognitive deficits, AD hallmarks and epigenetic alterations presented in 5xFAD mouse model. Front. Cell. Neurosci. 2018, 12, 224. [Google Scholar] [CrossRef] [Green Version]
- Lalo, U.; Bogdanov, A.; Moss, G.W.; Pankratov, Y. Astroglia-derived BDNF and MSK-1 mediate experience- and diet-dependent synaptic plasticity. Brain Sci. 2020, 10, 462. [Google Scholar] [CrossRef]
- Mora, F.; Segovia, G.; del Arco, A. Aging, plasticity and environmental enrichment: Structural changes and neurotransmitter dynamics in several areas of the brain. Brain Res. Rev. 2007, 55, 78–88. [Google Scholar] [CrossRef] [PubMed]
- Singhal, G.; Morgan, J.; Jawahar, M.C.; Corrigan, F.; Jaehne, E.J.; Toben, C.; Manavis, J.; Hannan, A.J.; Baune, B.T. Duration of environmental enrichment determines astrocyte number and cervical lymph node T lymphocyte proportions but not the microglial number in middle-aged C57BL/6 mice. Front. Cell. Neurosci. 2020, 14, 57. [Google Scholar] [CrossRef] [PubMed] [Green Version]
- Gonzalez-Rodriguez, M.; Villar-Conde, S.; Astillero-Lopez, V.; Villanueva-Anguita, P.; Ubeda-Banon, I.; Flores-Cuadrado, A.; Martinez-Marcos, A.; Saiz-Sanchez, D. Neurodegeneration and astrogliosis in the human CA1 hippocampal subfield are related to hsp90ab1 and bag3 in alzheimer’s disease. Int. J. Mol. Sci. 2021, 23, 165. [Google Scholar] [CrossRef] [PubMed]
- Kim, J.W.; Nam, S.M.; Yoo, D.Y.; Jung, H.Y.; Hwang, I.K.; Seong, J.K.; Yoon, Y.S. Strain-specific differential expression of astrocytes and microglia in the mouse hippocampus. Brain Behav. 2018, 8, e00961. [Google Scholar] [CrossRef] [PubMed]
- Cerbai, F.; Lana, D.; Nosi, D.; Petkova-Kirova, P.; Zecchi, S.; Brothers, H.; Wenk, G.L.; Giovannini, M.G. The Neuron-Astrocyte-Microglia Triad in Normal Brain Ageing and in a Model of Neuroinflammation in the Rat Hippocampus. PLoS ONE 2012, 7, e45250. [Google Scholar] [CrossRef]
- Chun, H.; An, H.; Lim, J.; Woo, J.; Lee, J.; Ryu, H.; Lee, C.J. Astrocytic proBDNF and tonic GABA distinguish active versus reactive astrocytes in hippocampus. Exp. Neurobiol. 2018, 27, 155–170. [Google Scholar] [CrossRef]
- Aguirre, E.E.; Granados, S. The deterioration of spatial memory and the role of the masticatory function during aging: A brief literature review. Br. J. Med. Med. Res. 2015, 6, 1177–1185. [Google Scholar] [CrossRef]
- Kojo, A.; Yamada, K.; Kubo, K.-Y.; Yamashita, A.; Yamamoto, T. Occlusal disharmony in mice transiently activates microglia in hippocampal CA1 region but not in dentate gyrus. Tohoku J. Exp. Med. 2010, 221, 237–243. [Google Scholar] [CrossRef] [Green Version]
- Nakajima, K.; Kohsaka, S. Response of microglia to brain injury. In Neuroglia, 2nd ed.; Kettenmann, H., Ransom, B.R., Eds.; Oxford University Press: Oxford, UK, 2005; pp. 443–453. [Google Scholar]
- Ashton, R.S.; Conway, A.; Pangarkar, C.; Bergen, J.; Lim, K.-I.; Shah, P.; Bissell, M.; Schaffer, D.V. Astrocytes regulate adult hippocampal neurogenesis through ephrin-B signaling. Nat. Neurosci. 2012, 15, 1399–1406. [Google Scholar] [CrossRef] [Green Version]
- Ogawa, M.; Nagai, T.; Saito, Y.; Miyaguchi, H.; Kumakura, K.; Abe, K.; Asakura, T. Short-term mastication after weaning upregulates GABAergic signalling and reduces dendritic spine in thalamus. Biochem. Biophys. Res. Commun. 2018, 498, 621–626. [Google Scholar] [CrossRef] [PubMed]
- Kida, K.; Tsuji, T.; Tanaka, S.; Kogo, M. Zinc deficiency with reduced mastication impairs spatial memory in young adult mice. Physiol. Behav. 2015, 152 (Pt A), 231–237. [Google Scholar] [CrossRef] [PubMed] [Green Version]
- Morquette, P.; Verdier, D.; Kadala, A.; Féthière, J.; Philippe, A.G.; Robitaille, R.; Kolta, A. An astrocyte-dependent mechanism for neuronal rhythmogenesis. Nat. Neurosci. 2015, 18, 844–854. [Google Scholar] [CrossRef] [PubMed]
- Yasuoka, A.; Nagai, T.; Lee, S.; Miyaguchi, H.; Saito, Y.; Abe, K.; Asakura, T. Mastication stimuli enhance the learning ability of weaning-stage rats, altering the hippocampal neuron transcriptome and micromorphology. Front. Behav. Neurosci. 2022, 16, 1006359. [Google Scholar] [CrossRef] [PubMed]
- Scheel, N.; Wulff, P.; Malsen, J.G.M. Afferent connections of the thalamic nucleus reuniens in the mouse. J. Comp. Neurol. 2020, 528, 1189–1202. [Google Scholar] [CrossRef] [Green Version]
- Fujita, S.; Kaneko, M.; Nakamura, H.; Kobayashi, M. Spatiotemporal profiles of proprioception processed by the masseter muscle spindles in rat cerebral cortex: An optical imaging study. Front. Neural. Circuits 2017, 11, 4. [Google Scholar] [CrossRef] [Green Version]
- Mouton, P.R.; Long, J.M.; Lei, D.-L.; Howard, V.; Jucker, M.; Calhoun, M.E.; Ingram, D.K. Age and gender effects on microglia and astrocyte numbers in brains of mice. Brain Res. 2002, 956, 30–35. [Google Scholar] [CrossRef]
- Acaz-Fonseca, E.; Avila-Rodriguez, M.; Garcia-Segura, L.M.; Barreto, G.E. Regulation of astroglia by gonadal steroid hormones under physiological and pathological conditions. Prog Neurobiol. 2016, 144, 5–26. [Google Scholar] [CrossRef]
- Lei, D.-L.; Long, J.M.; Hengemihle, J.; O’Neill, J.; Manaye, K.F.; Ingram, D.K.; Mouton, P.R. Effects of estrogen and raloxifene on neuroglia number and morphology in the hippocampus of aged female mice. Neuroscience 2003, 121, 659–666. [Google Scholar] [CrossRef]
- West, M.J. Design-based stereological methods for counting neurons. Prog. Brain Res. 2002, 135, 43–51. [Google Scholar] [CrossRef]
- Bonthius, D.J.; McKim, R.; Koele, L.; Harb, H.; Karacay, B.; Mahoney, J.; Pantazis, N.J. Use of frozen sections to determine neuronal number in the murine hippocampus and neocortex using the optical disector and optical fractionator. Brain Res. Brain Res. Protoc. 2004, 14, 45–57. [Google Scholar] [CrossRef] [PubMed]
- Glaser, E.M.; Wilson, P.D. The coefficient of error of optical fractionator population size estimates: A computer simulation comparing three estimators. J. Microsc. 1998, 192 (Pt 2), 163–171. [Google Scholar] [CrossRef] [PubMed]
- Slomianka, L.; West, M.J. Estimators of the precision of stereological estimates: An example based on the CA1 pyramidal cell layer of rats. Neuroscience 2005, 136, 757–767. [Google Scholar] [CrossRef] [PubMed]
- Fileta, J.B.; Huang, W.; Kwon, G.P.; Filippopoulos, T.; Ben, Y.; Dobberfuhl, A.; Grosskreutz, C.L. Efficient estimation of retinal ganglion cell number: A stereological approach. J. Neurosci. Methods 2008, 170, 1–8. [Google Scholar] [CrossRef] [PubMed] [Green Version]


| Body Weight (g): Mean ± Standard Error | ||||
|---|---|---|---|---|
| Impoverished Environment (IE) | Enriched Environment (EE) | |||
| 6 Months | 18 Months | 6 Months | 18 Months | |
| HD | 75.96 ± 3.69 | 75.32 ± 1.45 | 50.94 ± 1.25 | 65.21 ± 4.41 |
| HD/SD | 55.04 ± 2.05 | 53.44 ± 3.61 | 44.32 ± 3.31 | 51.21 ± 2.67 |
| HD/SD/HD | 71.56 ± 2.93 | 57.65 ± 4.10 | 51.70 ± 5.27 | 54.85 ± 2.09 |
| Statistical Significance Values | ||||
|---|---|---|---|---|
| Impoverished Environment (IE) | Enriched Environment (EE) | |||
| 6 Months | 18 Months | 6 Months | 18 Months | |
| ANOVA-one way | F(2,12) = 13.83 p = 0.01 | F(2,12) = 12.63 p = 0.0014 | F(2,12) = 1.23 p = 0.328 | F(2,12) = 5.10 p = 0.025 |
| HD vs. HD/SD | t(8) = 4.99 p < 0.001 | t(8) = 4.74 p < 0.001 | - | t(8) = 3.08 p = 0.0095 |
| HD vs. HD/SD/HD | t(8) = 1.05 p > 0.05 | t(8) = 3.82 p = 0.0024 | - | t(8) = 2.28 p < 0.0418 |
| HD/SD vs. HD/SD/HD | t(8) = 3.94 p = 0.002 | t(8) = 0.91 p > 0.05 | - | t(8) = 0.80 p > 0.05 |
| Ages | Number of Animals | |||||
|---|---|---|---|---|---|---|
| Impoverished Environment (IE) | Enriched Environment (EE) | |||||
| HD | HD/SD | HD/SD/HD | HD | HD/SD | HD/SD/HD | |
| 6-month | 5 | 5 | 5 | 5 | 5 | 5 |
| 18-month | 5 | 5 | 5 | 5 | 5 | 5 |
| Region | Layer | Counting Frame Size (μm × μm) | Grid Size (μm × μm) | Guard Zone (μm) | Optical Dissector Height (μm) |
|---|---|---|---|---|---|
| CA1 | LM | 80 × 80 | 80 × 80 | 2 | 7 |
| RAD | 80 × 80 | 80 × 80 | |||
| OR | 80 × 80 | 80 × 80 | |||
| CA3 | LM | 40 × 40 | 50 × 50 | ||
| RAD | 80 × 80 | 80 × 80 | |||
| OR | 80 × 80 | 80 × 80 | |||
| Dentate Gyrus | MOL | 80 × 80 | 80 × 80 | ||
| HILUS | 80 × 80 | 80 × 80 |
Disclaimer/Publisher’s Note: The statements, opinions and data contained in all publications are solely those of the individual author(s) and contributor(s) and not of MDPI and/or the editor(s). MDPI and/or the editor(s) disclaim responsibility for any injury to people or property resulting from any ideas, methods, instructions or products referred to in the content. |
© 2023 by the authors. Licensee MDPI, Basel, Switzerland. This article is an open access article distributed under the terms and conditions of the Creative Commons Attribution (CC BY) license (https://creativecommons.org/licenses/by/4.0/).
Share and Cite
Cunha Feio Leal, M.d.; Amaral Junior, F.L.d.; Silva Arruda, B.F.d.; Kurosawa, J.A.A.; Vieira, A.A.; Maia, J.C.C.; Scalfoni, V.V.B.; Silveira Junior, A.M.d.; Feijó, M.O.; Albuquerque, F.B.A.d.; et al. The Masticatory Activity Interference in Quantitative Estimation of CA1, CA3 and Dentate Gyrus Hippocampal Astrocytes of Aged Murine Models and under Environmental Stimulation. Int. J. Mol. Sci. 2023, 24, 6529. https://doi.org/10.3390/ijms24076529
Cunha Feio Leal Md, Amaral Junior FLd, Silva Arruda BFd, Kurosawa JAA, Vieira AA, Maia JCC, Scalfoni VVB, Silveira Junior AMd, Feijó MO, Albuquerque FBAd, et al. The Masticatory Activity Interference in Quantitative Estimation of CA1, CA3 and Dentate Gyrus Hippocampal Astrocytes of Aged Murine Models and under Environmental Stimulation. International Journal of Molecular Sciences. 2023; 24(7):6529. https://doi.org/10.3390/ijms24076529
Chicago/Turabian StyleCunha Feio Leal, Marília da, Fabio Leite do Amaral Junior, Bernardo Freire da Silva Arruda, Juliana Ayumi Azevedo Kurosawa, Amanda Almeida Vieira, Júlia Corrêa Campos Maia, Viviana Virgínia Bezerra Scalfoni, Antonio Morais da Silveira Junior, Matheus Oliveira Feijó, Fernanda Beatriz Araújo de Albuquerque, and et al. 2023. "The Masticatory Activity Interference in Quantitative Estimation of CA1, CA3 and Dentate Gyrus Hippocampal Astrocytes of Aged Murine Models and under Environmental Stimulation" International Journal of Molecular Sciences 24, no. 7: 6529. https://doi.org/10.3390/ijms24076529