
Apelin as a Potential Regulator of Peak Athletic Performance

 , ,
, ,  ,
,
Abstract
: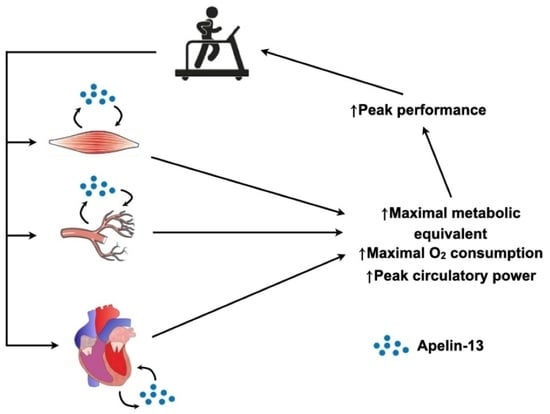
1. Introduction
2. Results
2.1. Response to a Single Bout of Exercise
2.2. Apelin-13 Response to a Single Bout of Exercise
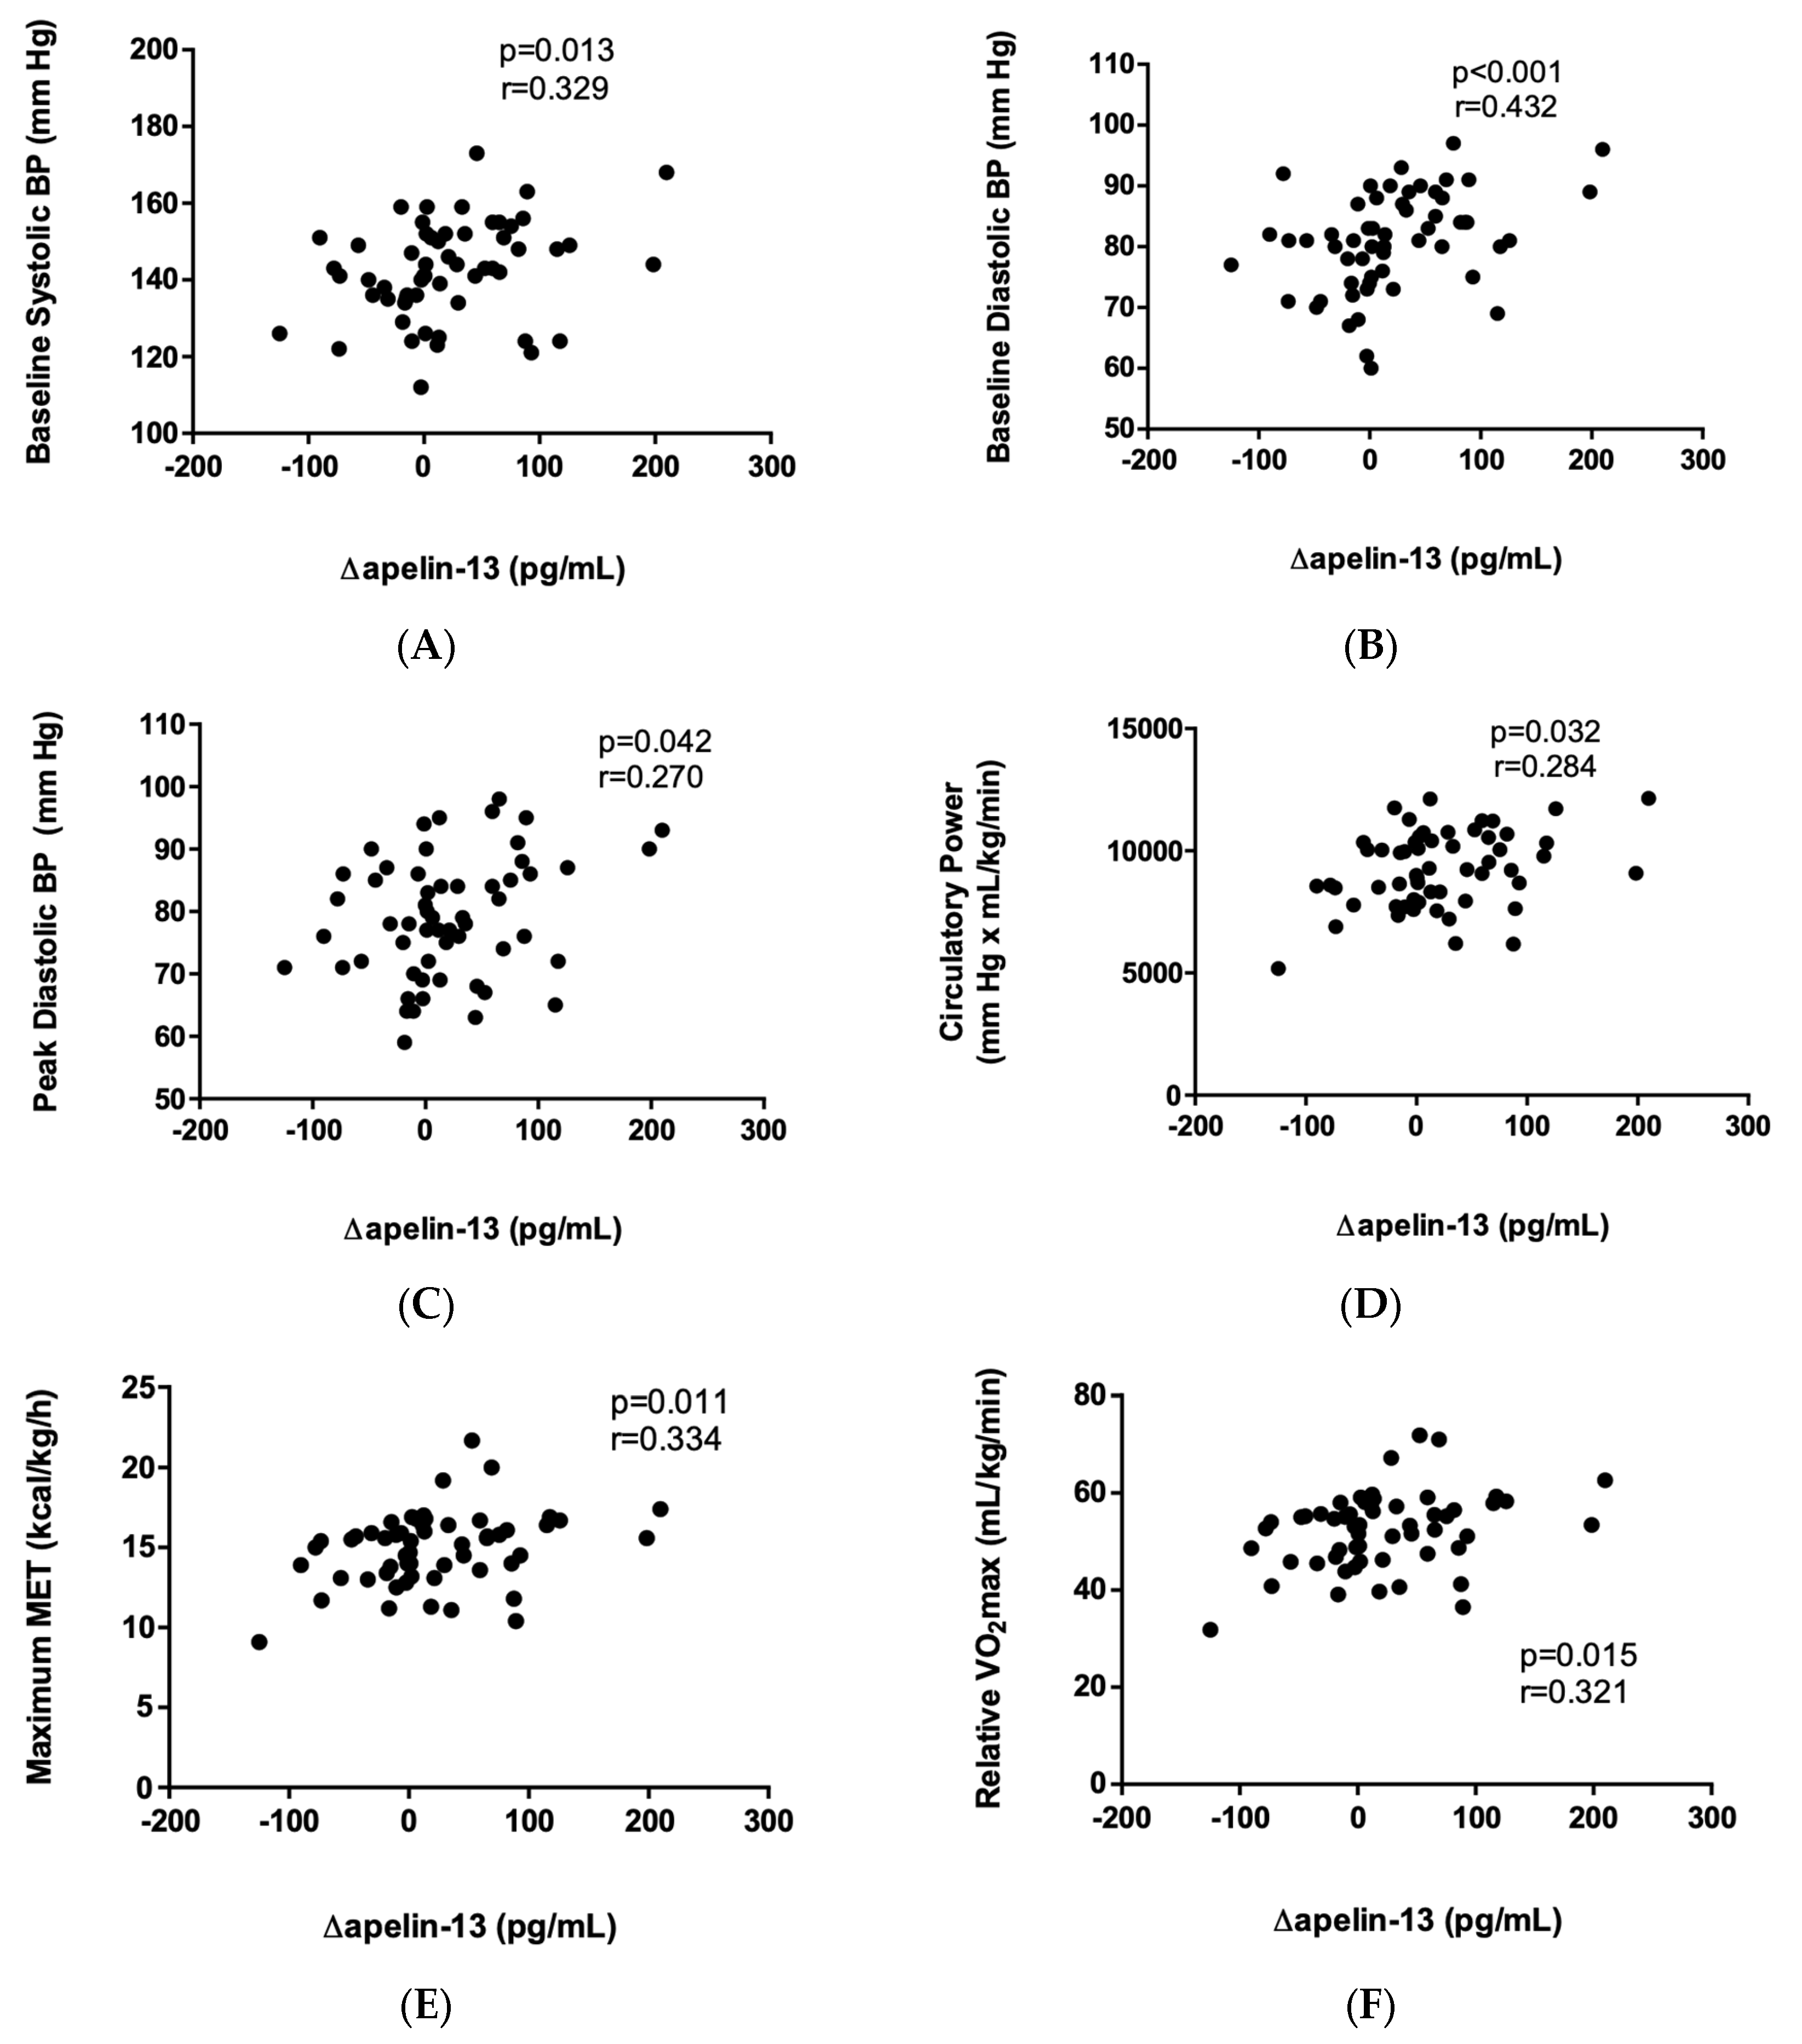
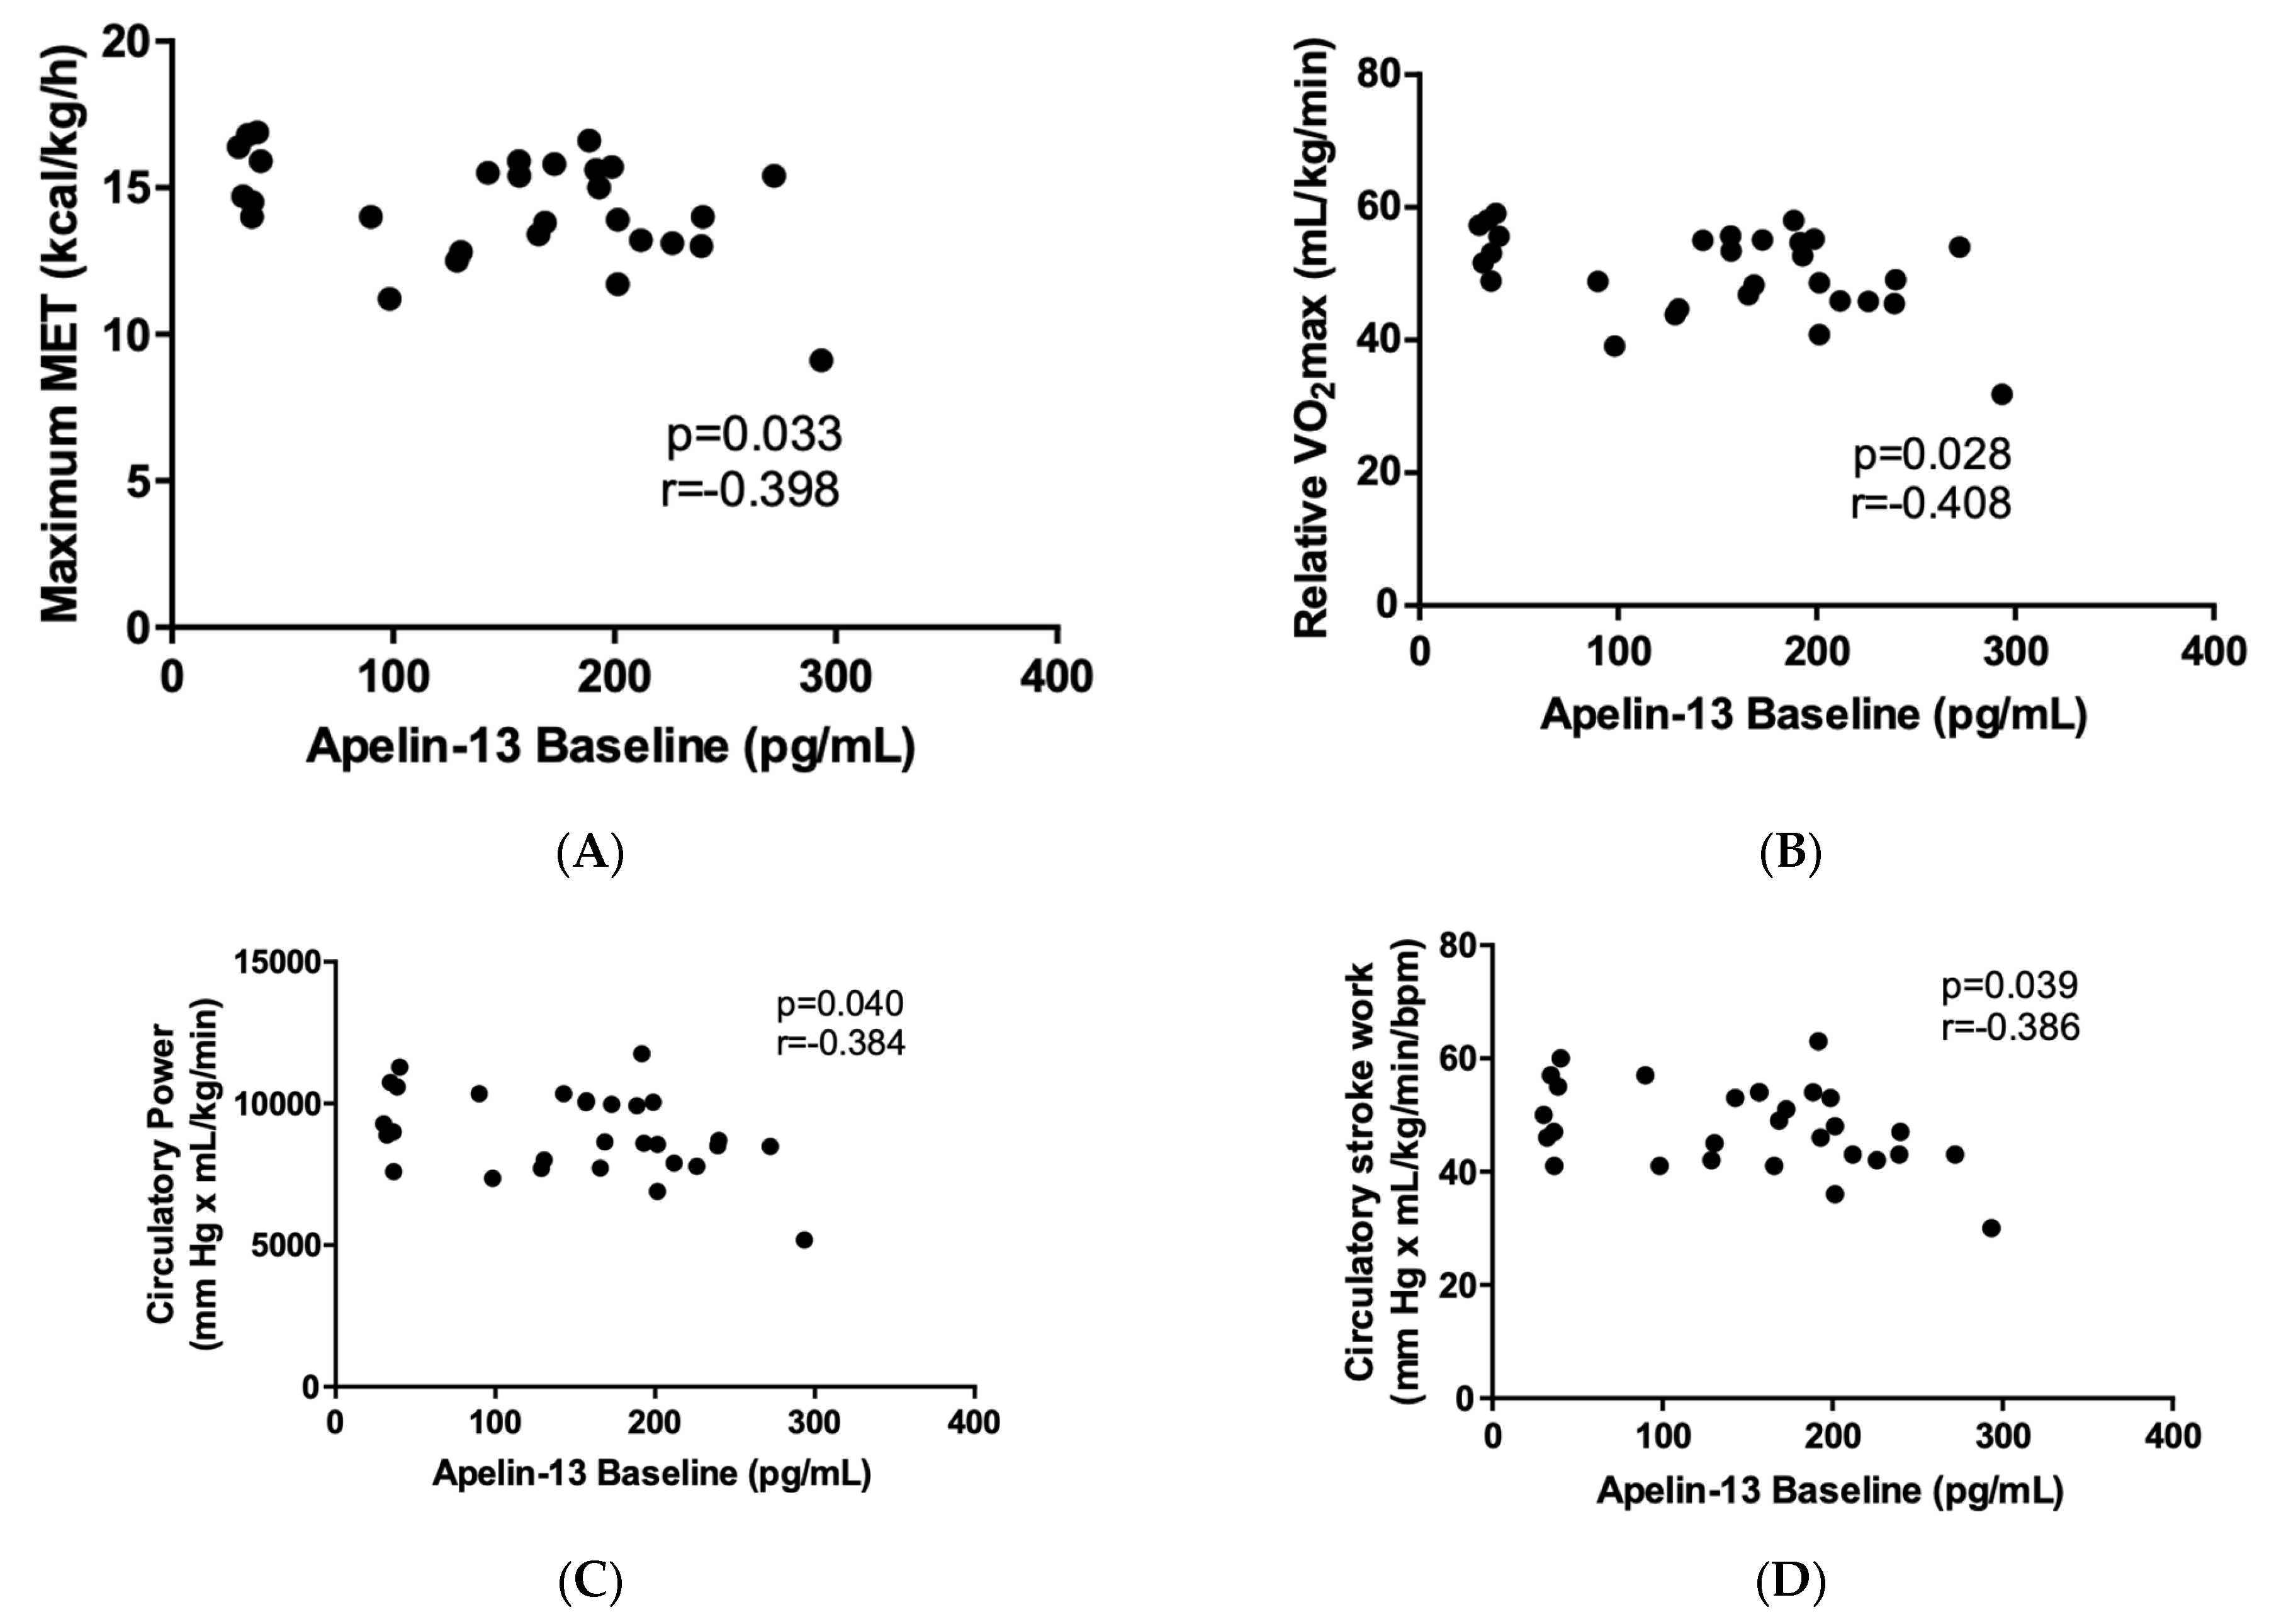
2.3. Correlation of Apelin-13 with Cardiopulmonary-Exercise-Derived Parameters
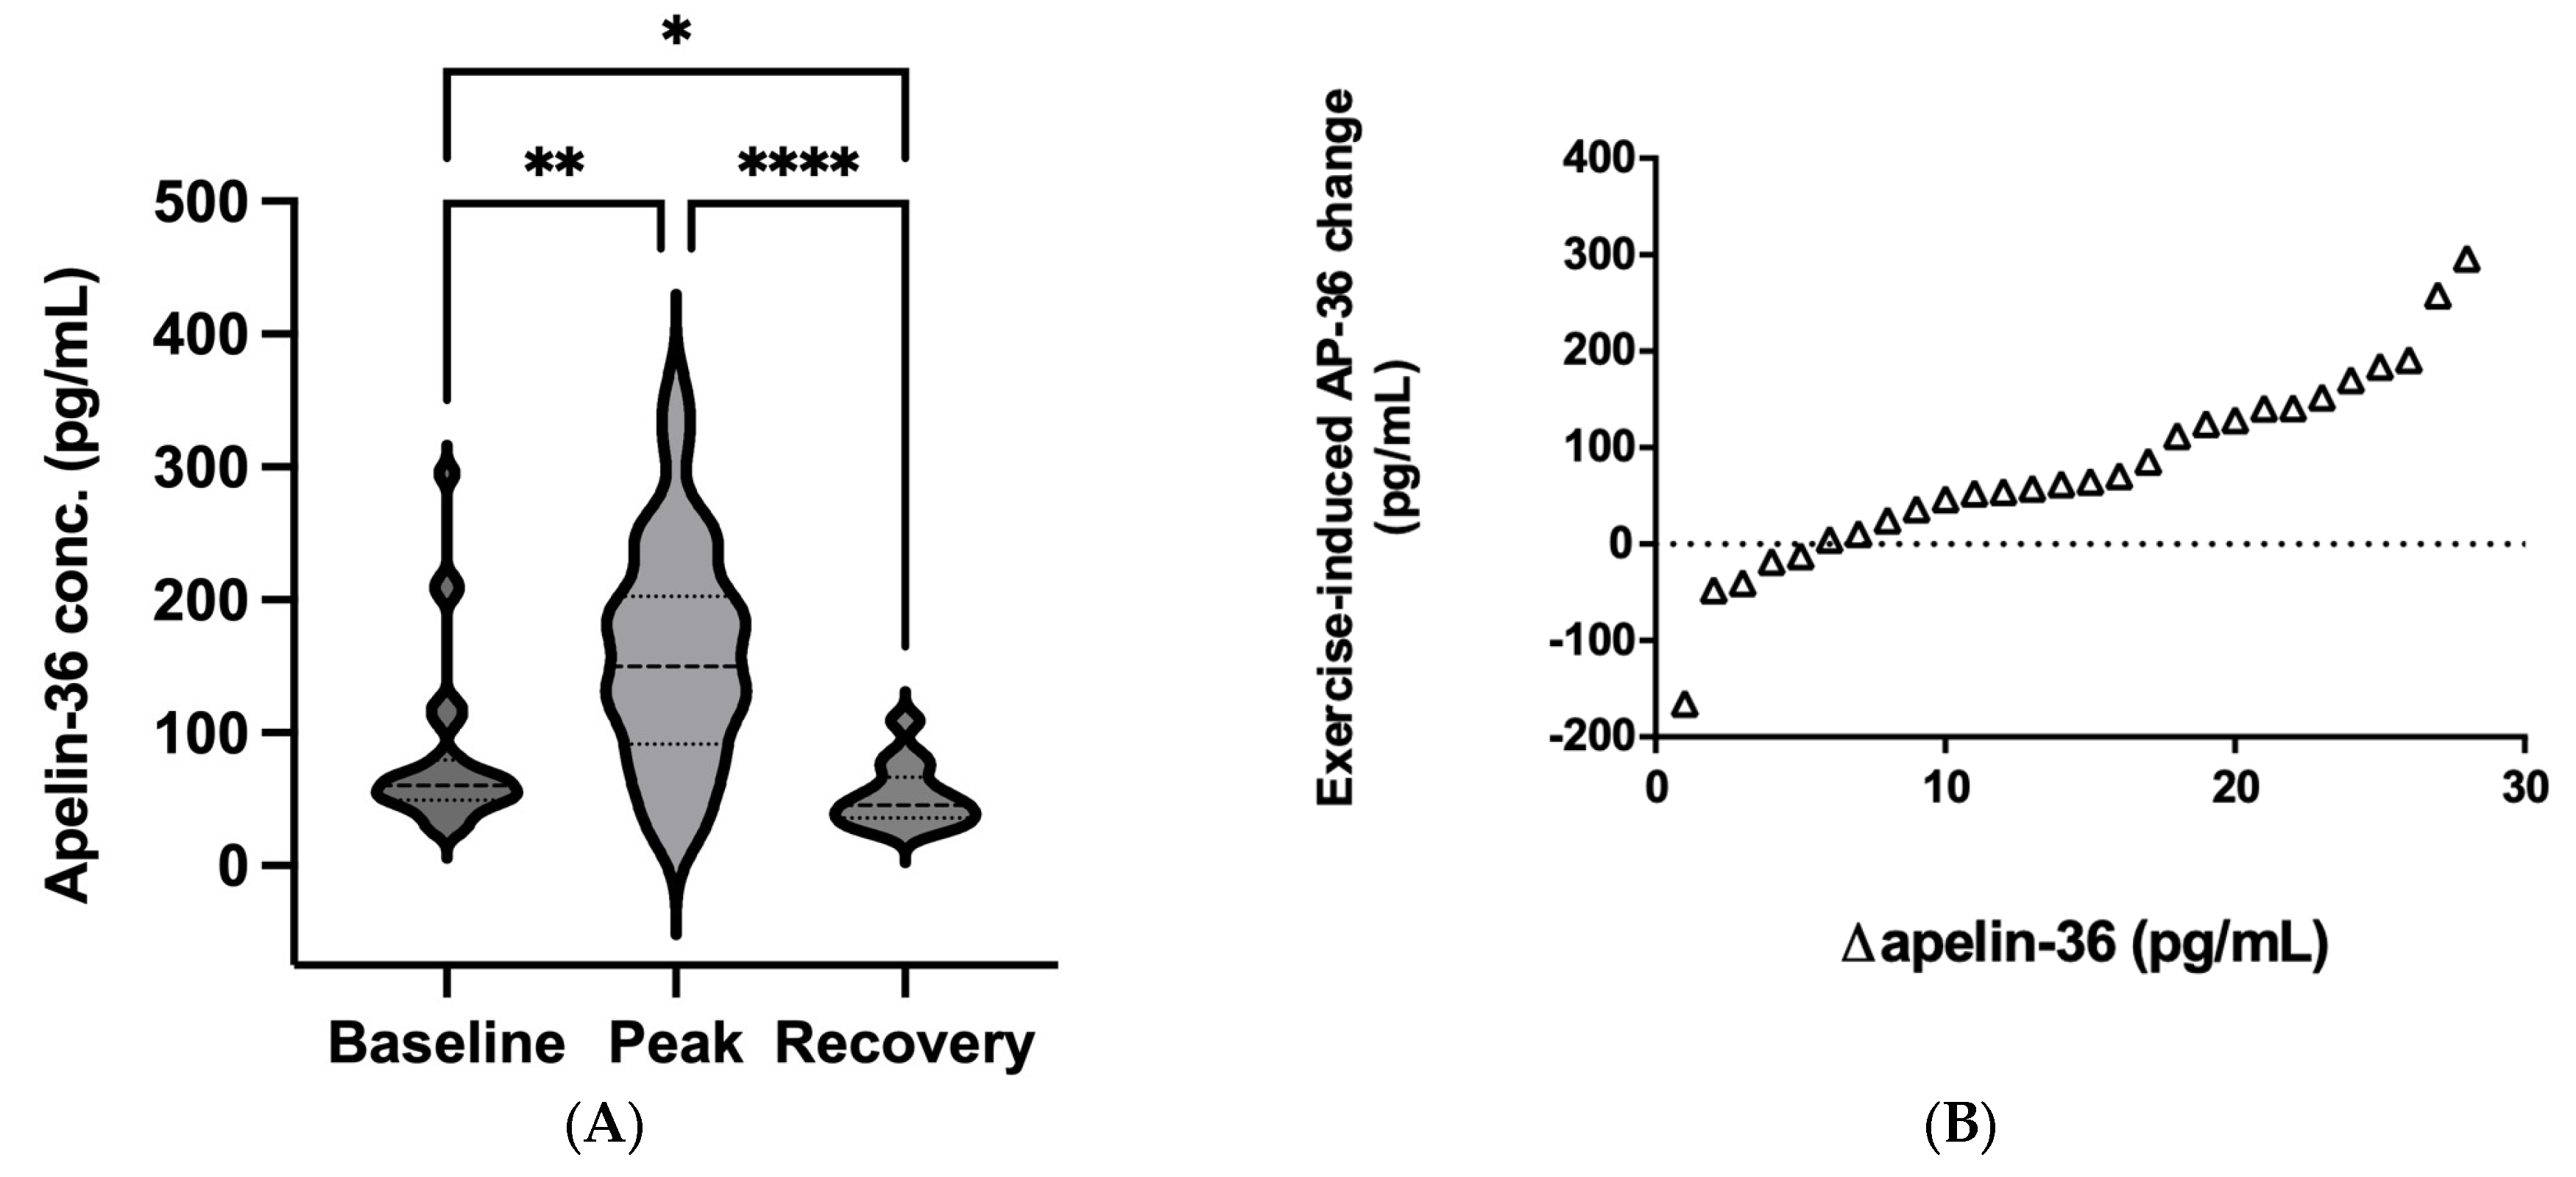
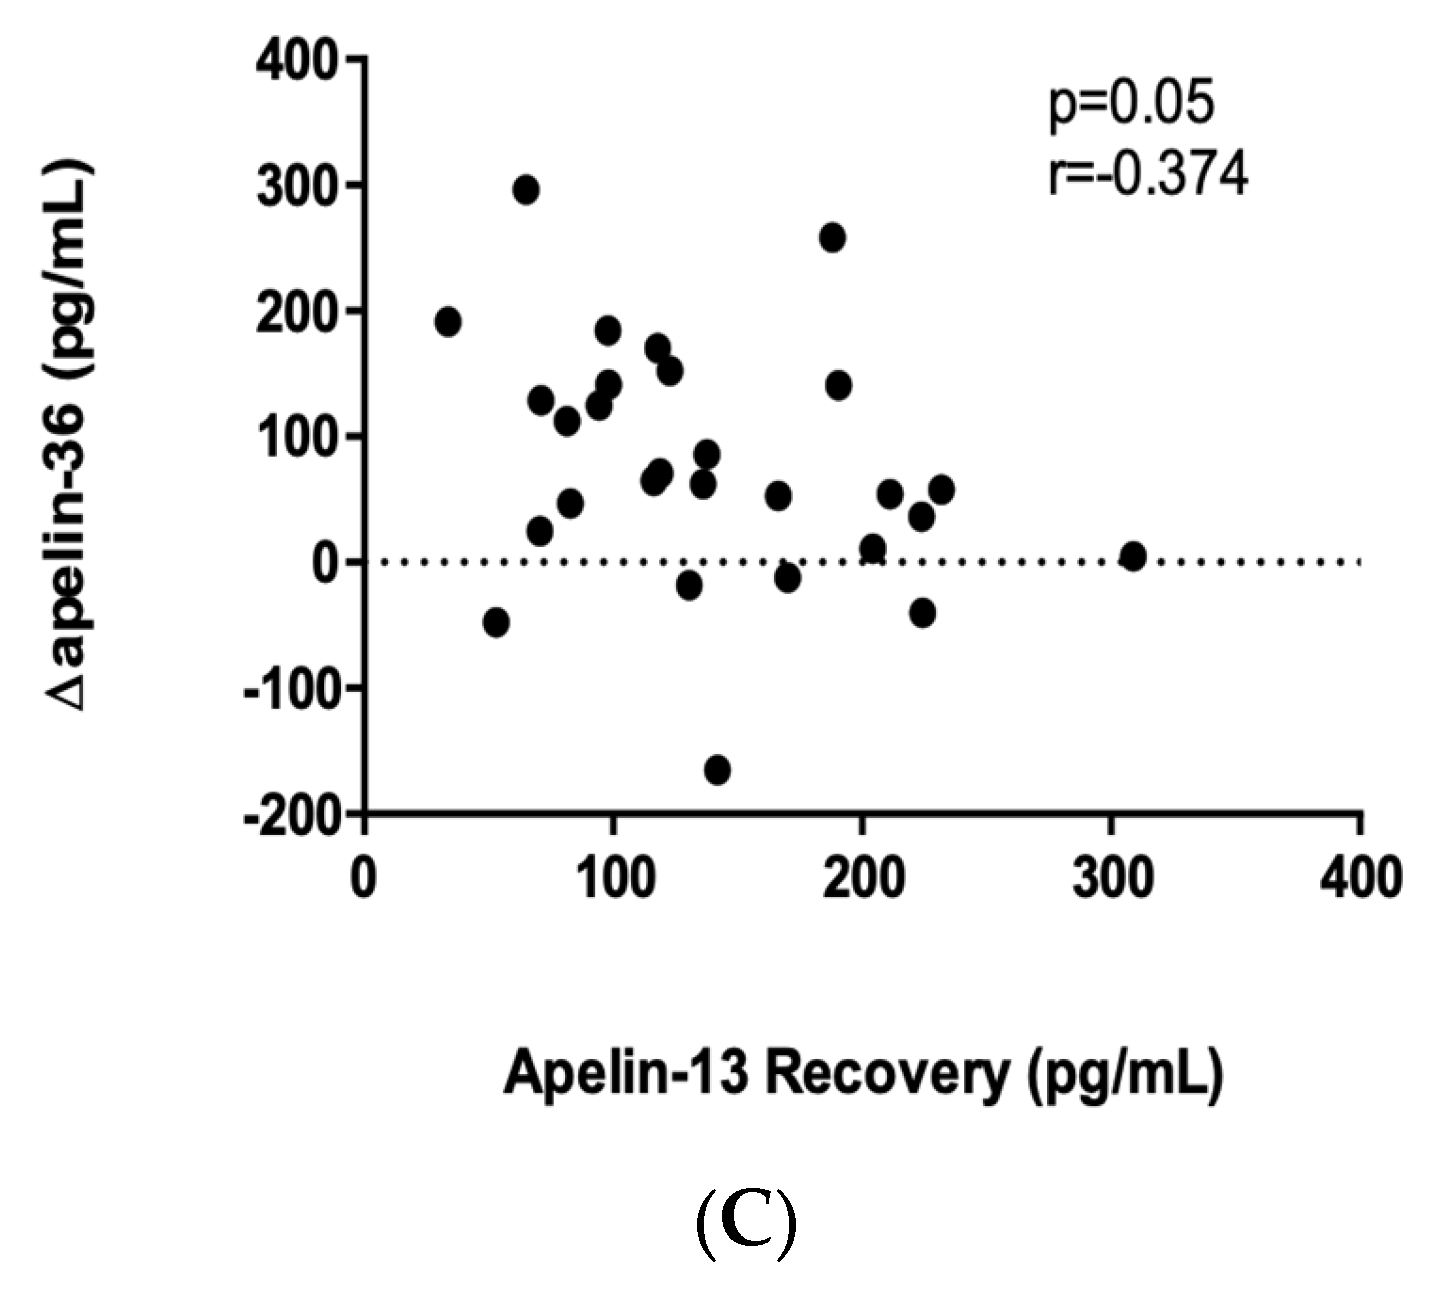
2.4. Apelin-36 Response to a Single Bout of Exercise
3. Discussion
4. Materials and Methods
4.1. Participants
4.2. Study Protocol
4.3. Blood Sampling and Analysis
4.4. Cardiopulmonary Exercise Parameters
4.5. Ethics
4.6. Statistical Analysis
Author Contributions
Funding
Institutional Review Board Statement
Informed Consent Statement
Data Availability Statement
Conflicts of Interest
References
- Bray, M.S.; Hagberg, J.M.; Pérusse, L.; Rankinen, T.; Roth, S.M.; Wolfarth, B.; Bouchard, C. The human gene map for performance and health-related fitness phenotypes: The 2006–2007 update. Med. Sci. Sport. Exerc. 2009, 41, 34–72. [Google Scholar] [CrossRef] [PubMed]
- Cannell, J.J.; Hollis, B.W.; Sorenson, M.B.; Taft, T.N.; Anderson, J.J. Athletic performance and vitamin D. Med. Sci. Sport. Exerc. 2009, 41, 1102–1110. [Google Scholar] [CrossRef] [PubMed]
- Hammermeister, J.; VonGuenthner, S. Sport psychology: Training the mind for competition. Curr. Sport. Med. Rep. 2005, 4, 160–164. [Google Scholar] [CrossRef]
- Joyner, M.J.; Coyle, E.F. Endurance exercise performance: The physiology of champions. J. Physiol. 2008, 586, 35–44. [Google Scholar] [CrossRef] [PubMed]
- Komka, Z.; Szilágyi, B.; Molnár, D.; Sipos, B.; Tóth, M.; Elek, J.; Szász, M. High-Resolution Dynamics of Hemodilution After Exercise-Related Hemoconcentration. Int. J. Sport. Physiol. Perform. 2022, 17, 576–585. [Google Scholar] [CrossRef]
- Holloszy, J.O. Biochemical adaptations in muscle. Effects of exercise on mitochondrial oxygen uptake and respiratory enzyme activity in skeletal muscle. J. Biol. Chem. 1967, 242, 2278–2282. [Google Scholar] [CrossRef] [PubMed]
- Bilski, J.; Jaworek, J.; Pokorski, J.; Nitecki, J.; Nitecka, E.; Pokorska, J.; Mazur-Bialy, A.; Szklarczyk, J. Effects of time of day and the wingate test on appetite perceptions, food intake and plasma levels of adipokines. J. Physiol. Pharmacol. 2016, 67, 667–676. [Google Scholar]
- Dundar, A.; Kocahan, S.; Arslan, C. Effects of different loading exercises on apelin levels and physical and hematologic parameters of swimmers. Horm. Mol. Biol. Clin. Investig. 2019, 384. [Google Scholar] [CrossRef]
- Kon, M.; Ebi, Y.; Nakagaki, K. Effects of acute sprint interval exercise on follistatin-like 1 and apelin secretions. Arch Physiol. Biochem. 2021, 127, 223–227. [Google Scholar] [CrossRef]
- Protzner, A.; Szmodis, M.; Udvardy, A.; Bosnyák, E.; Trájer, E.; Komka, Z.; Györe, I.; Toth, M. Hormonal Neuroendocrine and Vasoconstrictor Peptide Responses of Ball Game and Cyclic Sport Elite Athletes by Treadmill Test. PLoS ONE 2015, 10, e0144691. [Google Scholar] [CrossRef]
- Waller, J.D.; McNeill, E.H.; Zhong, F.; Vervaecke, L.S.; Goldfarb, A.H. Plasma Apelin Unchanged With Acute Exercise Insulin Sensitization. J. Sport. Sci. Med. 2019, 18, 537–543. [Google Scholar]
- Hearon, C.M., Jr.; Dinenno, F.A. Regulation of skeletal muscle blood flow during exercise in ageing humans. J. Physiol. 2016, 594, 2261–2273. [Google Scholar] [CrossRef] [PubMed]
- Lundby, C.; Montero, D.; Joyner, M. Biology of VO2 max: Looking under the physiology lamp. Acta Physiol. 2017, 220, 218–228. [Google Scholar] [CrossRef] [PubMed]
- Pedersen, B.K. Muscles and their myokines. J. Exp. Biol. 2011, 214 (Pt 2), 337–346. [Google Scholar] [CrossRef]
- Severinsen, M.C.K.; Pedersen, B.K. Muscle-Organ Crosstalk: The Emerging Roles of Myokines. Endocr. Rev. 2020, 41, 594–609. [Google Scholar] [CrossRef]
- Chow, L.S.; Gerszten, R.E.; Taylor, J.M.; Pedersen, B.K.; van Praag, H.; Trappe, S.; Febbraio, M.A.; Galis, Z.S.; Gao, Y.; Haus, J.M.; et al. Exerkines in health, resilience and disease. Nat. Rev. Endocrinol. 2022, 18, 273–289. [Google Scholar] [CrossRef]
- Tatemoto, K.; Hosoya, M.; Habata, Y.; Fujii, R.; Kakegawa, T.; Zou, M.-X.; Kawamata, Y.; Fukusumi, S.; Hinuma, S.; Kitada, C.; et al. Isolation and characterization of a novel endogenous peptide ligand for the human APJ receptor. Biochem Biophys Res Commun. 1998, 251, 471–476. [Google Scholar] [CrossRef]
- Read, C.; Nyimanu, D.; Williams, T.L.; Huggins, D.J.; Sulentic, P.; Macrae, R.G.C.; Yang, P.; Glen, R.C.; Maguire, J.J.; Davenport, A.P. International Union of Basic and Clinical Pharmacology. CVII. Structure and Pharmacology of the Apelin Receptor with a Recommendation that Elabela/Toddler Is a Second Endogenous Peptide Ligand. Pharmacol. Rev. 2019, 71, 467–502. [Google Scholar] [CrossRef]
- Szokodi, I.; Tavi, P.; Földes, G.; Voutilainen-Myllylä, S.; Ilves, M.; Tokola, H.; Pikkarainen, S.; Piuhola, J.; Rysä, J.; Toóth, M.; et al. Apelin, the novel endogenous ligand of the orphan receptor APJ, regulates cardiac contractility. Circ. Res. 2002, 91, 434–440. [Google Scholar] [CrossRef]
- Besse-Patin, A.; Montastier, E.; Vinel, C.; Castan-Laurell, I.; Louche, K.; Dray, C.; Daviaud, D.; Mir, L.; Marques, M.-A.; Thalamas, C.; et al. Effect of endurance training on skeletal muscle myokine expression in obese men: Identification of apelin as a novel myokine. Int. J. Obes. 2014, 38, 707–713. [Google Scholar] [CrossRef]
- Boucher, J.; Masri, B.; Daviaud, D.; Gesta, S.; Guigné, C.; Mazzucotelli, A.; Castan-Laurell, I.; Tack, I.; Knibiehler, B.; Carpeéneé, C.; et al. Apelin, a newly identified adipokine up-regulated by insulin and obesity. Endocrinology 2005, 146, 1764–1771. [Google Scholar] [CrossRef] [PubMed]
- Perjés, A.; Farkasfalvi, K.; Ruskoaho, H.; Szokodi, I. Apelin. In Handbook of Biologically Active Peptides; Kastin, A., Ed.; Academic Press: Cambridge, MA, USA, 2013; pp. 1377–1385. [Google Scholar]
- Segers, V.F.M.; Brutsaert, D.L.; De Keulenaer, G.W. Cardiac Remodeling: Endothelial Cells Have More to Say Than Just NO. Front. Physiol. 2019, 9, 382. [Google Scholar] [CrossRef] [PubMed]
- Parikh, V.N.; Liu, J.; Shang, C.; Woods, C.; Chang, A.C.Y.; Zhao, M.; Charo, D.N.; Grunwald, Z.; Huang, Y.; Seo, K.; et al. Apelin and APJ orchestrate complex tissue-specific control of cardiomyocyte hypertrophy and contractility in the hypertrophy-heart failure transition. Am. J. Physiol. Heart Circ. Physiol. 2018, 315, H348–H356. [Google Scholar] [CrossRef] [PubMed]
- Mughal, A.; Sun, C.; O’Rourke, S.T. Activation of large conductance, calcium-activated potassium channels by nitric oxide mediates apelin-induced relaxation of isolated rat coronary arteries. J. Pharmacol. Exp. Ther. 2018, 366, 265–273. [Google Scholar] [CrossRef]
- Maguire, J.J.; Kleinz, M.J.; Pitkin, S.L.; Davenport, A.P. [Pyr1]apelin-13 identified as the predominant apelin isoform in the human heart: Vasoactive mechanisms and inotropic action in disease. Hypertension 2009, 54, 598–604. [Google Scholar] [CrossRef]
- Jia, Y.X.; Lu, Z.F.; Zhang, J.; Pan, C.S.; Yang, J.H.; Zhao, J.; Yu, F.; Duan, X.H.; Tang, C.S.; Qi, Y.F. Apelin activates L-arginine/nitric oxide synthase/nitric oxide pathway in rat aortas. Peptides 2007, 28, 2023–2029. [Google Scholar] [CrossRef]
- Ishida, J.; Hashimoto, T.; Hashimoto, Y.; Nishiwaki, S.; Iguchi, T.; Harada, S.; Sugaya, T.; Matsuzaki, H.; Yamamoto, R.; Shiota, N.; et al. Regulatory roles for APJ, a seven-transmembrane receptor related to angiotensin-type 1 receptor in blood pressure in vivo. J. Biol. Chem. 2004, 279, 26274–26279. [Google Scholar] [CrossRef]
- Japp, A.G.; Cruden, N.; Barnes, G.; Van Gemeren, N.; Mathews, J.A.; Adamson, J.; Johnston, N.; Denvir, M.; Megson, I.; Flapan, A.D.; et al. Acute cardiovascular effects of apelin in humans: Potential role in patients with chronic heart failure. Circulation 2010, 121, 1818–1827. [Google Scholar] [CrossRef]
- Vinel, C.; Lukjanenko, L.; Batut, A.; Deleruyelle, S.; Pradère, J.-P.; Le Gonidec, S.; Dortignac, A.; Geoffre, N.; Pereira, O.; Karaz, S.; et al. The exerkine apelin reverses age-associated sarcopenia. Nat. Med. 2018, 24, 1360–1371. [Google Scholar] [CrossRef]
- Dray, C.; Knauf, C.; Daviaud, D.; Waget, A.; Boucher, J.; Buléon, M.; Cani, P.D.; Attané, C.; Guigné, C.; Carpéné, C.; et al. Apelin stimulates glucose utilization in normal and obese insulin-resistant mice. Cell Metab. 2008, 8, 437–445. [Google Scholar] [CrossRef]
- de Sousa, C.A.Z.; Sierra, A.P.R.; Galán, B.S.M.; Maciel, J.F.d.S.; Manoel, R.; Barbeiro, H.V.; de Souza, H.P.; Cury-Boaventura, M.F. Time Course and Role of Exercise-Induced Cytokines in Muscle Damage and Repair After a Marathon Race. Front. Physiol. 2021, 12, 752144. [Google Scholar] [CrossRef] [PubMed]
- Kadoglou, N.P.; Vrabas, I.S.; Kapelouzou, A.; Angelopoulou, N. The association of physical activity with novel adipokines in patients with type 2 diabetes. Eur. J. Intern. Med. 2012, 23, 137–142. [Google Scholar] [CrossRef] [PubMed]
- Romagnoli, M.; Alis, R.; Aloe, R.; Salvagno, G.L.; Basterra, J.; Pareja-Galeano, H.; Sanchis-Gomar, F.; Lippi, G. Influence of training and a maximal exercise test in analytical variability of muscular, hepatic, and cardiovascular biochemical variables. Scand. J. Clin. Lab. Investig. 2014, 74, 192–198. [Google Scholar] [CrossRef]
- Scharhag, J.; Herrmann, M.; Urhausen, A.; Haschke, M.; Herrmann, W.; Kindermann, W. Independent elevations of N-terminal pro-brain natriuretic peptide and cardiac troponins in endurance athletes after prolonged strenuous exercise. Am. Heart J. 2005, 150, 1128–1134. [Google Scholar] [CrossRef] [PubMed]
- Lee, U.; Stuelsatz, P.; Karaz, S.; McKellar, D.W.; Russeil, J.; Deak, M.; De Vlaminck, I.; Lepper, C.; Deplancke, B.; Cosgrove, B.D.; et al. A Tead1-Apelin axis directs paracrine communication from myogenic to endothelial cells in skeletal muscle. iScience 2022, 25, 104589. [Google Scholar] [CrossRef]
- Kleinz, M.J.; Davenport, A.P. Immunocytochemical localization of the endogenous vasoactive peptide apelin to human vascular and endocardial endothelial cells. Regul. Pept. 2004, 118, 119–125. [Google Scholar] [CrossRef] [PubMed]
- Busch, R.; Strohbach, A.; Pennewitz, M.; Lorenz, F.; Bahls, M.; Busch, M.C.; Felix, S.B. Regulation of the endothelial apelin/APJ system by hemodynamic fluid flow. Cell. Signal. 2015, 27, 1286–1296. [Google Scholar] [CrossRef] [PubMed]
- Everson, S.A.; Kaplan, G.A.; Goldberg, D.E.; Salonen, J.T. Anticipatory blood pressure response to exercise predicts future high blood pressure in middle-aged men. Hypertension 1996, 27, 1059–1064. [Google Scholar] [CrossRef]
- Singh, A.; Petrides, J.S.; Gold, P.W.; Chrousos, G.P.; Deuster, P.A. Differential hypothalamic-pituitary-adrenal axis reactivity to psychological and physical stress. J. Clin. Endocrinol. Metab. 1999, 84, 1944–1948. [Google Scholar] [CrossRef]
- Caselli, S.; Serdoz, A.; Mango, F.; Lemme, E.; Vaquer Seguì, A.; Milan, A.; Attenhofer Jost, C.; Schmied, C.; Spataro, A.; Pelliccia, A. High blood pressure response to exercise predicts future development of hypertension in young athletes. Eur. Heart J. 2019, 40, 62–68. [Google Scholar] [CrossRef]
- Dundar, A.; Kocahan, S.; Sahin, L. Associations of apelin, leptin, irisin, ghrelin, insulin, glucose levels, and lipid parameters with physical activity during eight weeks of regular exercise training. Arch. Physiol. Biochem. 2021, 127, 291–295. [Google Scholar] [CrossRef] [PubMed]
- Draper, N.; Marshall, H. Exercise Physiology for Health and Sports Performance; Pearson Education Limited: London, UK, 2013. [Google Scholar]
- Cohen-Solal, A.; Tabet, J.Y.; Logeart, D.; Bourgoin, P.; Tokmakova, M.; Dahan, M. A non-invasively determined surrogate of cardiac power (‘circulatory power’) at peak exercise is a powerful prognostic factor in chronic heart failure. Eur. Heart J. 2002, 23, 806–814. [Google Scholar] [CrossRef] [PubMed]
- Mezzani, A. Cardiopulmonary Exercise Testing: Basics of Methodology and Measurements. Ann. Am. Thorac. Soc. 2017, 14 (Suppl. 1), S3–S11. [Google Scholar] [CrossRef] [PubMed]
- Slimani, M.; Nikolaidis, P.T. Anthropometric and physiological characteristics of male soccer players according to their competitive level, playing position and age group: A systematic review. J. Sport. Med. Phys. Fitness. 2019, 59, 141–163. [Google Scholar] [CrossRef] [PubMed]
- Sanchis-Gomar, F.; Alis, R.; Rampinini, E.; Bosio, A.; Ferioli, D.; La Torre, A.; Xu, J.; Sansoni, V.; Perego, S.; Romagnoli, M.; et al. Adropin and apelin fluctuations throughout a season in professional soccer players: Are they related with performance? Peptides 2015, 70, 32–36. [Google Scholar] [CrossRef] [PubMed]
- Perjés, Á.; Skoumal, R.; Tenhunen, O.; Kónyi, A.; Simon, M.; Horváth, I.G.; Kerkelä, R.; Ruskoaho, H.; Szokodi, I. Apelin increases cardiac contractility via protein kinase Cε- and extracellular signal-regulated kinase-dependent mechanisms. PLoS ONE 2014, 9, e112456. [Google Scholar] [CrossRef]
- Peyronnet, R.; Bollensdorff, C.; Capel, R.A.; Rog-Zielinska, E.A.; Woods, C.E.; Charo, D.N.; Lookin, O.; Fajardo, G.; Ho, M.; Quertermous, T.; et al. Load-dependent effects of apelin on murine cardiomyocytes. Prog. Biophys. Mol. Biol. 2017, 130 (Pt B), 333–343. [Google Scholar] [CrossRef]
- Farkasfalvi, K.; Stagg, M.A.; Coppen, S.R.; Siedlecka, U.; Lee, J.; Soppa, G.K.; Marczin, N.; Szokodi, I.; Yacoub, M.H.; Terracciano, C.M. Direct effects of apelin on cardiomyocyte contractility and electrophysiology. Biochem. Biophys. Res. Commun. 2007, 357, 889–895. [Google Scholar] [CrossRef]
- Duncker, D.J.; Bache, R.J. Regulation of coronary blood flow during exercise. Physiol. Rev. 2008, 88, 1009–1086. [Google Scholar] [CrossRef]
- Kuba, K.; Zhang, L.; Imai, Y.; Arab, S.; Chen, M.; Maekawa, Y.; Leschnik, M.; Leibbrandt, A.; Markovic, M.; Schwaighofer, J.; et al. Impaired heart contractility in Apelin gene-deficient mice associated with aging and pressure overload. Circ. Res. 2007, 101, e32–e42. [Google Scholar] [CrossRef]
- Rai, R.; Ghosh, A.K.; Eren, M.; Mackie, A.R.; Levine, D.C.; Kim, S.-Y.; Cedernaes, J.; Ramirez, V.; Procissi, D.; Smith, L.H.; et al. Downregulation of the apelinergic axis accelerates aging, whereas its systemic restoration improves the mammalian healthspan. Cell Rep. 2017, 21, 1471–1480. [Google Scholar] [CrossRef] [PubMed]
- Poole, D.C.; Jones, A.M. Measurement of the maximum oxygen uptake Vo2max: Vo2peak is no longer acceptable. J. Appl. Physiol. 2017, 122, 997–1002. [Google Scholar] [CrossRef] [PubMed]


| All Participants (N = 58) | ΔApelin-13 | p-Value | ||
|---|---|---|---|---|
| Low Responders (n = 29) | High Responders (n = 29) | |||
| Baseline SBP (mm Hg) * | 143 ± 13 | 139 ± 12 | 147 ± 13 | p = 0.048 |
| Peak SBP (mm Hg) * | 177 ± 16 | 178 ± 15 | 176 ± 19 | p = 0.658 |
| Recovery SBP (mm Hg) † | 127 (120–132) | 127 (120–132) | 128 (120–133) | p = 0.715 |
| Baseline DBP (mm Hg) * | 81 ± 8 | 77 ± 8 | 85 ± 7 | p = 0.001 |
| Peak DBP (mm Hg) * | 79 ± 9 | 77 ± 9 | 81 ± 10 | p = 0.071 |
| Recovery DBP (mm Hg) * | 72 ± 7 | 72 ± 8 | 73 ± 8 | p = 0.557 |
| Baseline HR (bpm) † | 71 (61–80) | 68 (61–77) | 73 (63–80) | p = 0.512 |
| Peak HR (bpm) * | 189 ± 8 | 186 ± 6 | 190 ± 8 | p = 0.038 |
| Recovery HR (bpm) † | 86 (77–93) | 88 (77–91) | 86 (79–95 | p = 0.560 |
| Baseline RPP (mm Hg × bpm) * | 10,143 ± 2134 | 9637 ± 2071 | 10,506 ± 1749 | p = 0.135 |
| Peak RPP (mm Hg × bpm) * | 33,409 ± 3132 | 33,209 ± 3122 | 33,326 ± 3411 | p = 0.876 |
| RPP Reserve (mm Hg × bpm) * | 23,266 ± 3001 | 23,572 ± 3254 | 22,820 ± 3034 | p = 0.540 |
| Run time (min) * | 11.2 ± 1.5 | 10.9 ± 1.7 | 11.2 ± 1.4 | p = 0.285 |
| Max MET * | 14.9 ± 2.2 | 14.3 ± 1.8 | 15.5 ± 2.6 | p = 0.084 |
| Power output (Watt) * | 395 ± 43 | 394 ± 46 | 392 ± 43 | p = 0.950 |
| VO2max (L/min) * | 3.97 ± 0.57 | 3.85 ± 0.48 | 4.13 ± 0.67 | p = 0.132 |
| Relative VO2max (mL/kg/min) † | 52.7 (47–57.3) | 51.6 (45.9–55.2) | 55.4 (49.3–59) | p = 0.069 |
| Max VCO2 (L/min) † | 5.25 (5–5.78) | 5.21 (4.65–5.74) | 5.27 (5.17–5.9) | p = 0.313 |
| Max RQ * | 1.37 ± 0.10 | 1.38 ± 0.09 | 1.35 ± 0.09 | p = 0.346 |
| Max VE (L/min) † | 150 (136–162) | 142 (128–156) | 151 (140–163) | p = 0.179 |
| Max breathing/minute (breath/min) * | 53.4 ± 7.5 | 51.8 ± 7.5 | 53.2 ± 7.6 | p = 0.470 |
| VE/VO2* | 37.8 ± 6.2 | 36.9 ± 5.7 | 37.2 ± 6.3 | p = 0.889 |
| VE/VCO2* | 28.0 ± 3.3 | 27.4 ± 3.4 | 27.9 ± 3.3 | p = 0.597 |
| Circulatory power (mm Hg × mL/kg/min) † | 9141 (8054–10,335) | 8691 (7841–10,070) | 9661 (8317–10,734) | p = 0.220 |
| Circulatory stroke work (mm Hg × mL/kg/min/bpm) † | 49 (43–54.8) | 47 (42.5–54) | 51 (42.5–56.8) | p = 0.343 |
| Baseline lactate (mmol/L) † | 0.9 (0.7–1.2) | 0.9 (0.75–1.2) | 0.9 (0.73–1.3) | p = 0.526 |
| Peak lactate (mmol/L) * | 11.10 ± 2.21 | 10.90 ± 2.13 | 11.10 ± 2.44 | p = 0.977 |
| Recovery lactate (mmol/L) † | 4.52 (3.22–5.61) | 4.4 (3.41–6.21) | 4.04 (2.96–5.78) | p = 0.243 |
Disclaimer/Publisher’s Note: The statements, opinions and data contained in all publications are solely those of the individual author(s) and contributor(s) and not of MDPI and/or the editor(s). MDPI and/or the editor(s) disclaim responsibility for any injury to people or property resulting from any ideas, methods, instructions or products referred to in the content. |
© 2023 by the authors. Licensee MDPI, Basel, Switzerland. This article is an open access article distributed under the terms and conditions of the Creative Commons Attribution (CC BY) license (https://creativecommons.org/licenses/by/4.0/).
Share and Cite
Ligetvári, R.; Szokodi, I.; Far, G.; Csöndör, É.; Móra, Á.; Komka, Z.; Tóth, M.; Oláh, A.; Ács, P. Apelin as a Potential Regulator of Peak Athletic Performance. Int. J. Mol. Sci. 2023, 24, 8195. https://doi.org/10.3390/ijms24098195
Ligetvári R, Szokodi I, Far G, Csöndör É, Móra Á, Komka Z, Tóth M, Oláh A, Ács P. Apelin as a Potential Regulator of Peak Athletic Performance. International Journal of Molecular Sciences. 2023; 24(9):8195. https://doi.org/10.3390/ijms24098195
Chicago/Turabian StyleLigetvári, Roland, István Szokodi, Gabriella Far, Éva Csöndör, Ákos Móra, Zsolt Komka, Miklós Tóth, András Oláh, and Pongrác Ács. 2023. "Apelin as a Potential Regulator of Peak Athletic Performance" International Journal of Molecular Sciences 24, no. 9: 8195. https://doi.org/10.3390/ijms24098195