
MS Identification of Blood Plasma Proteins Concentrated on a Photocrosslinker-Modified Surface

 , , , , , ,
Abstract
:1. Introduction
2. Results
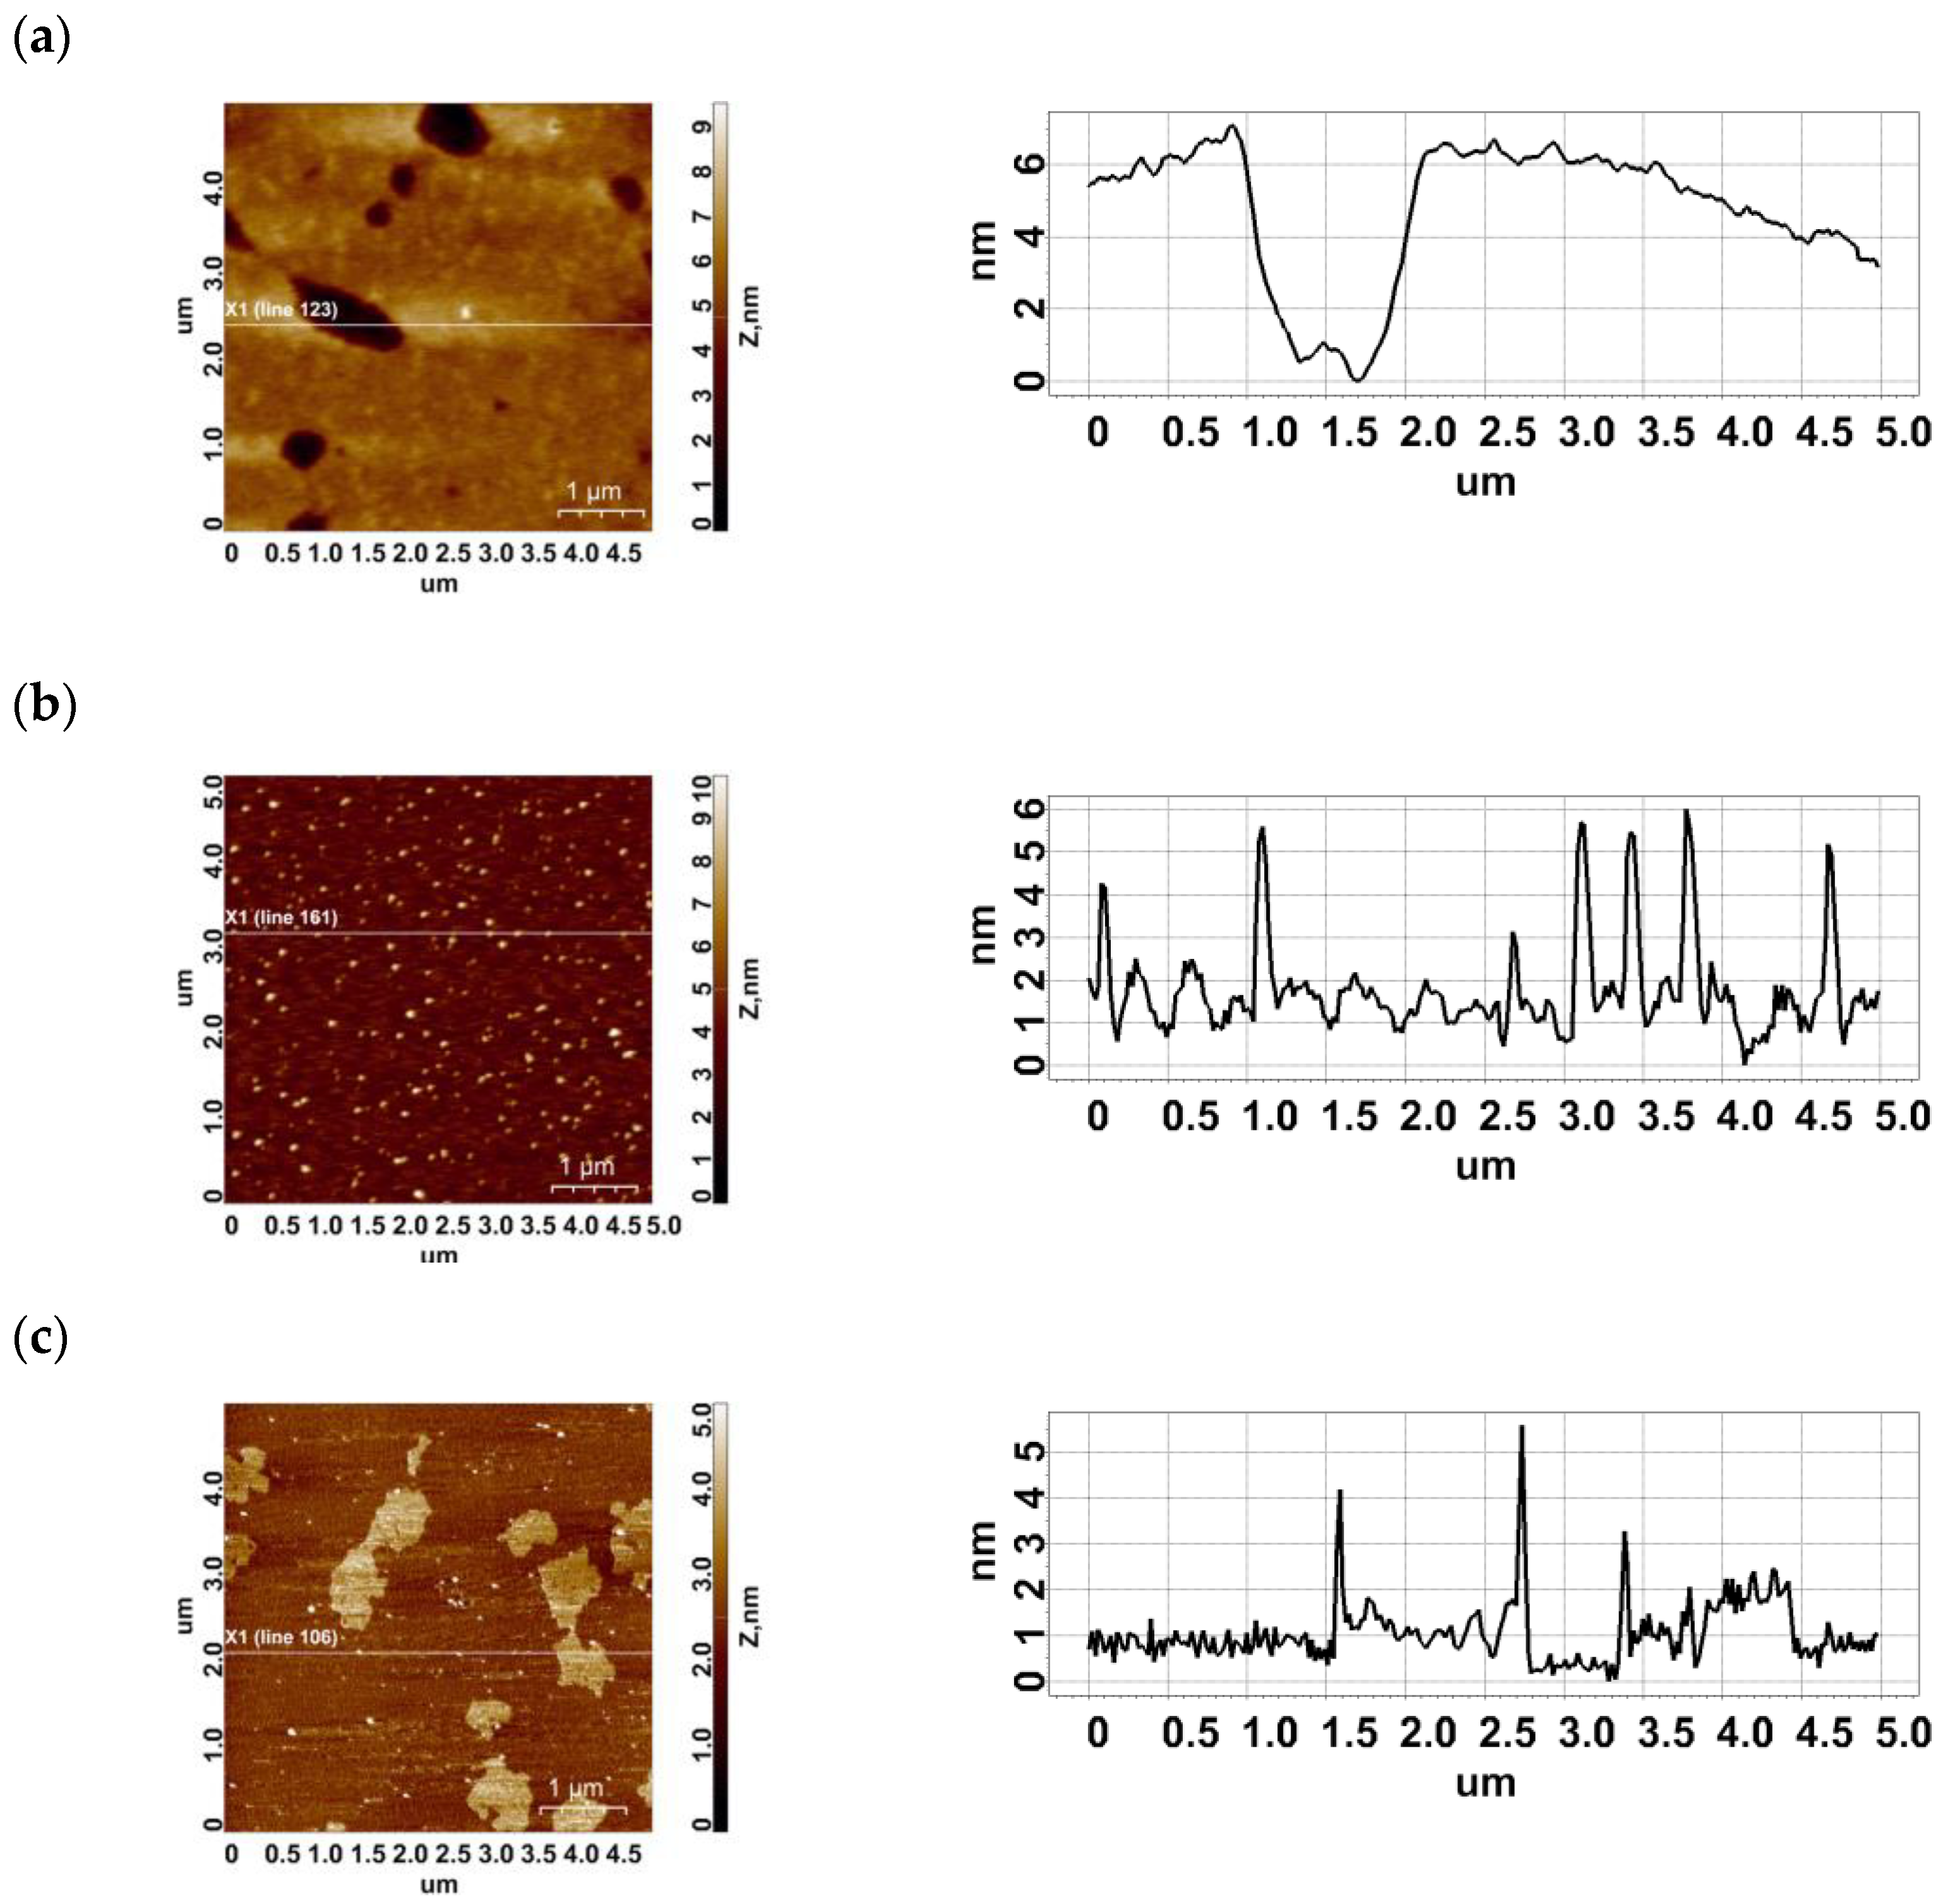
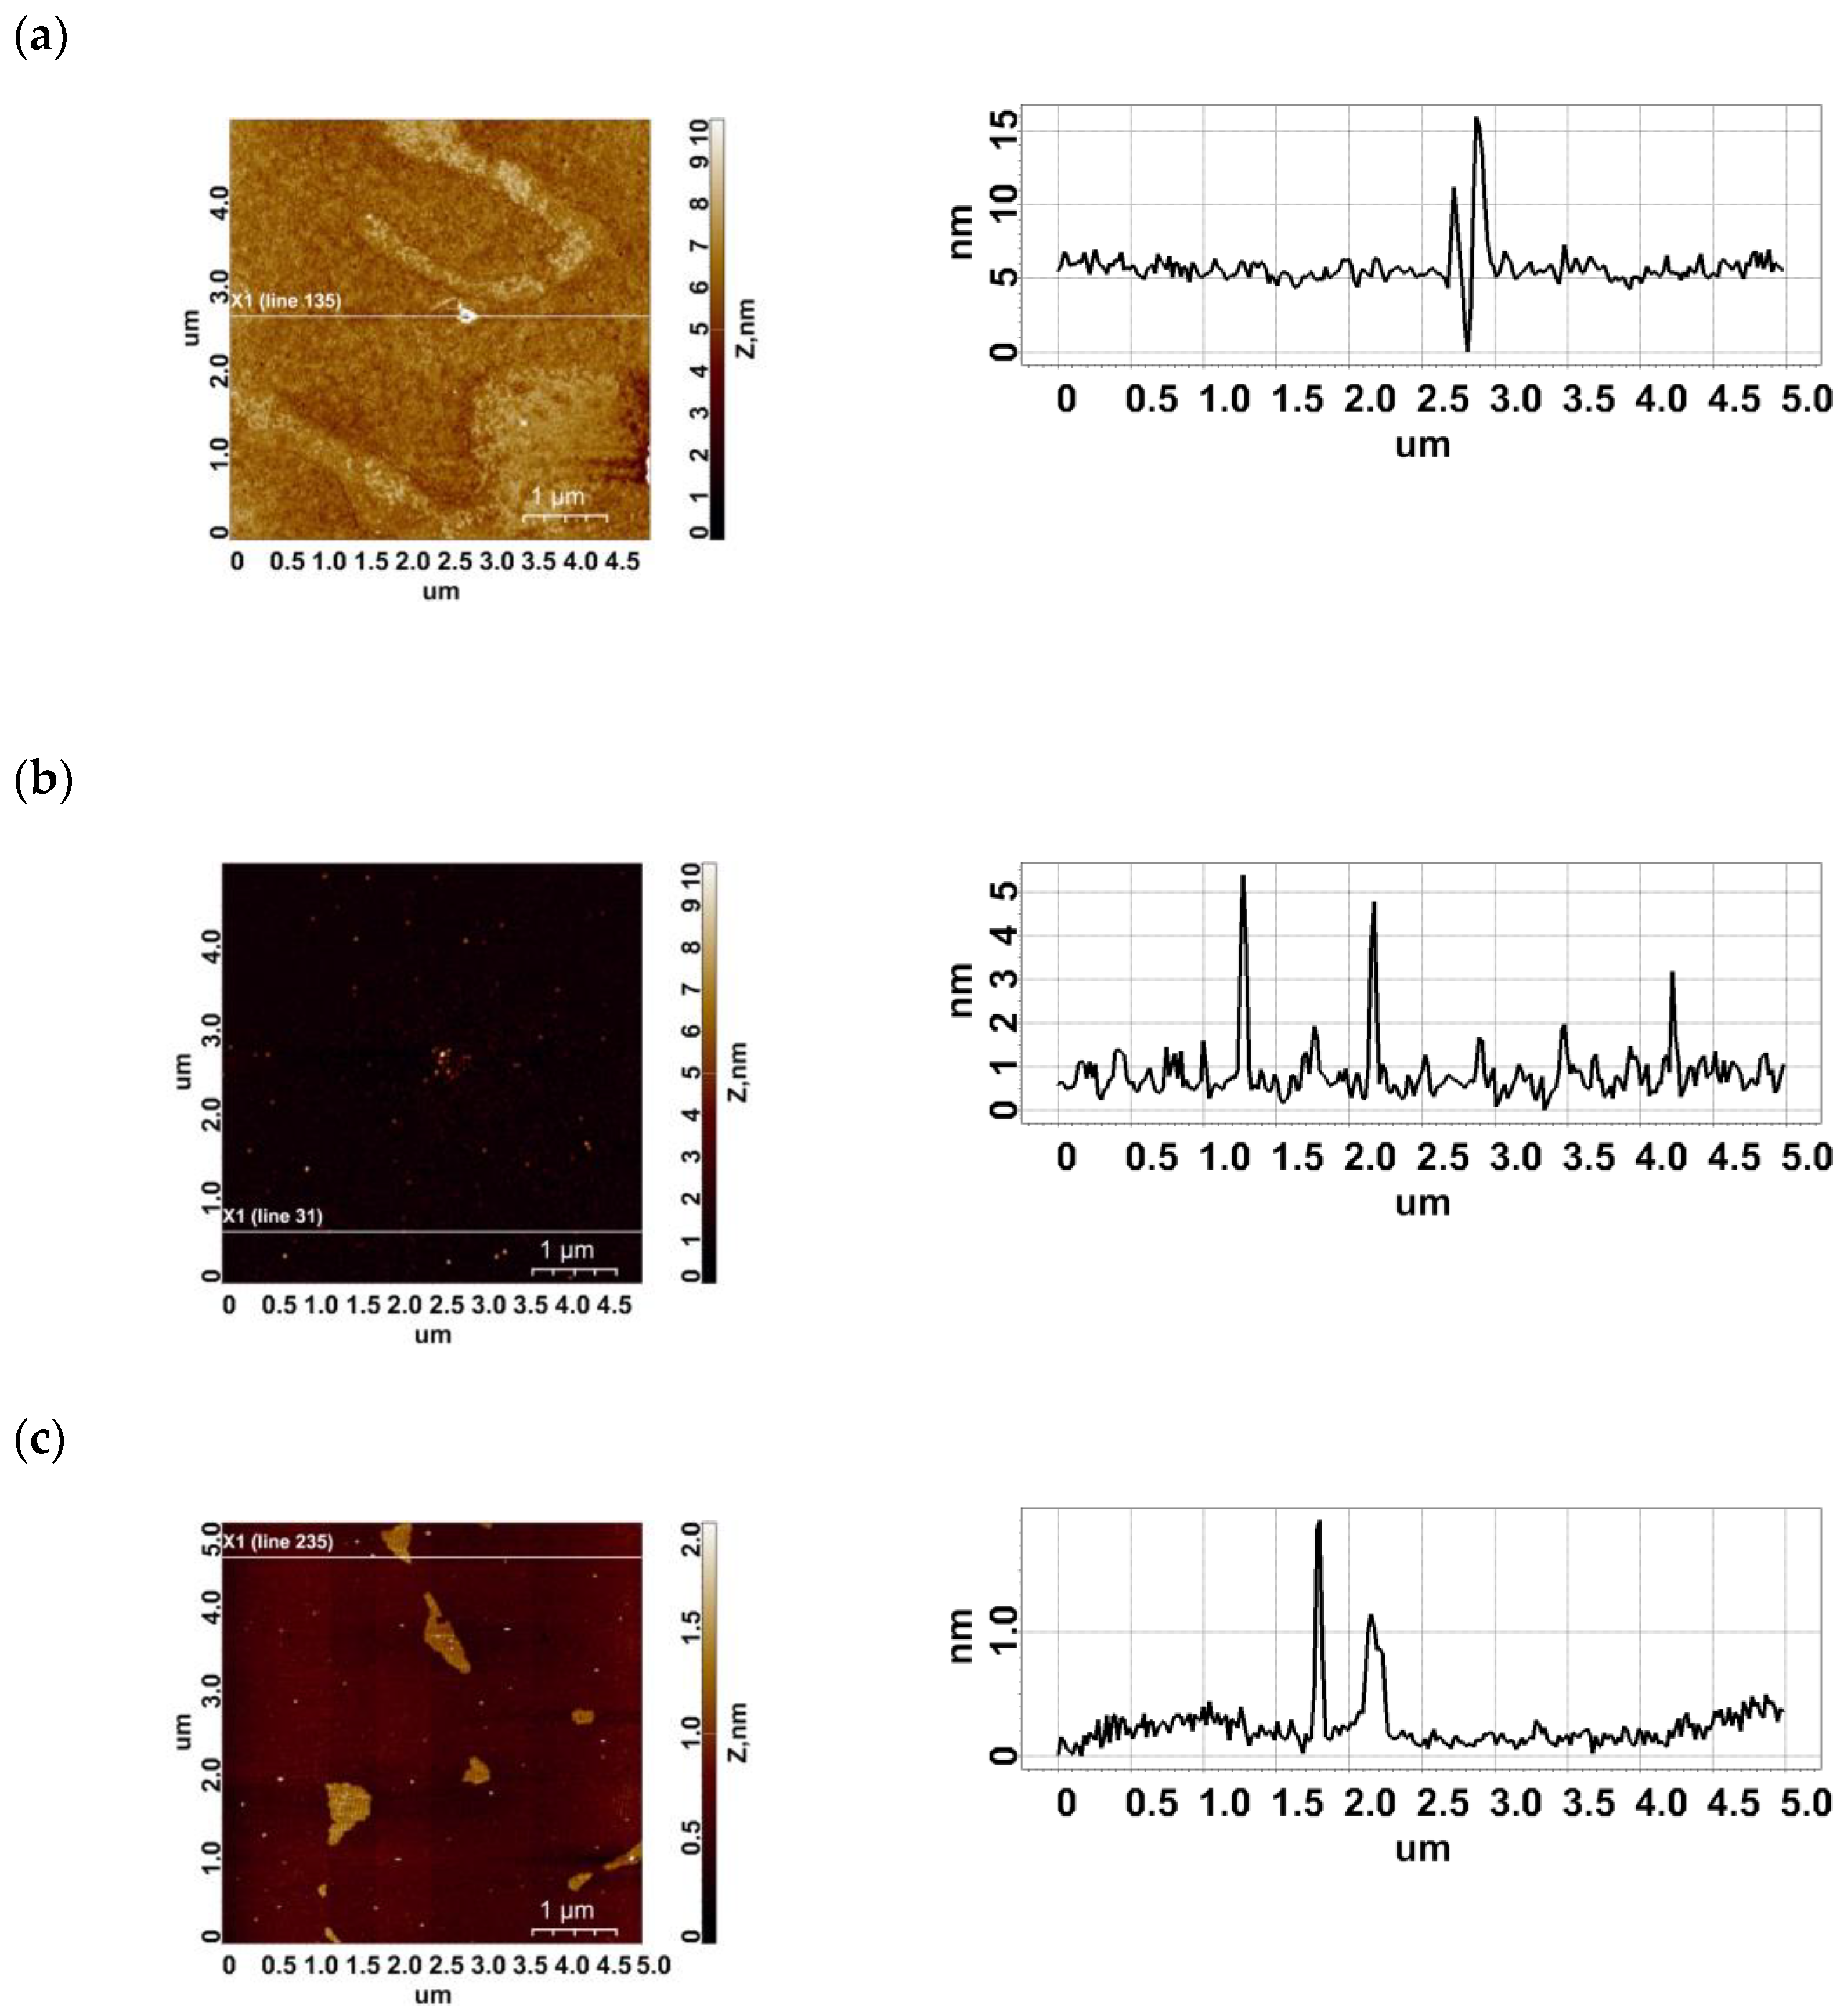
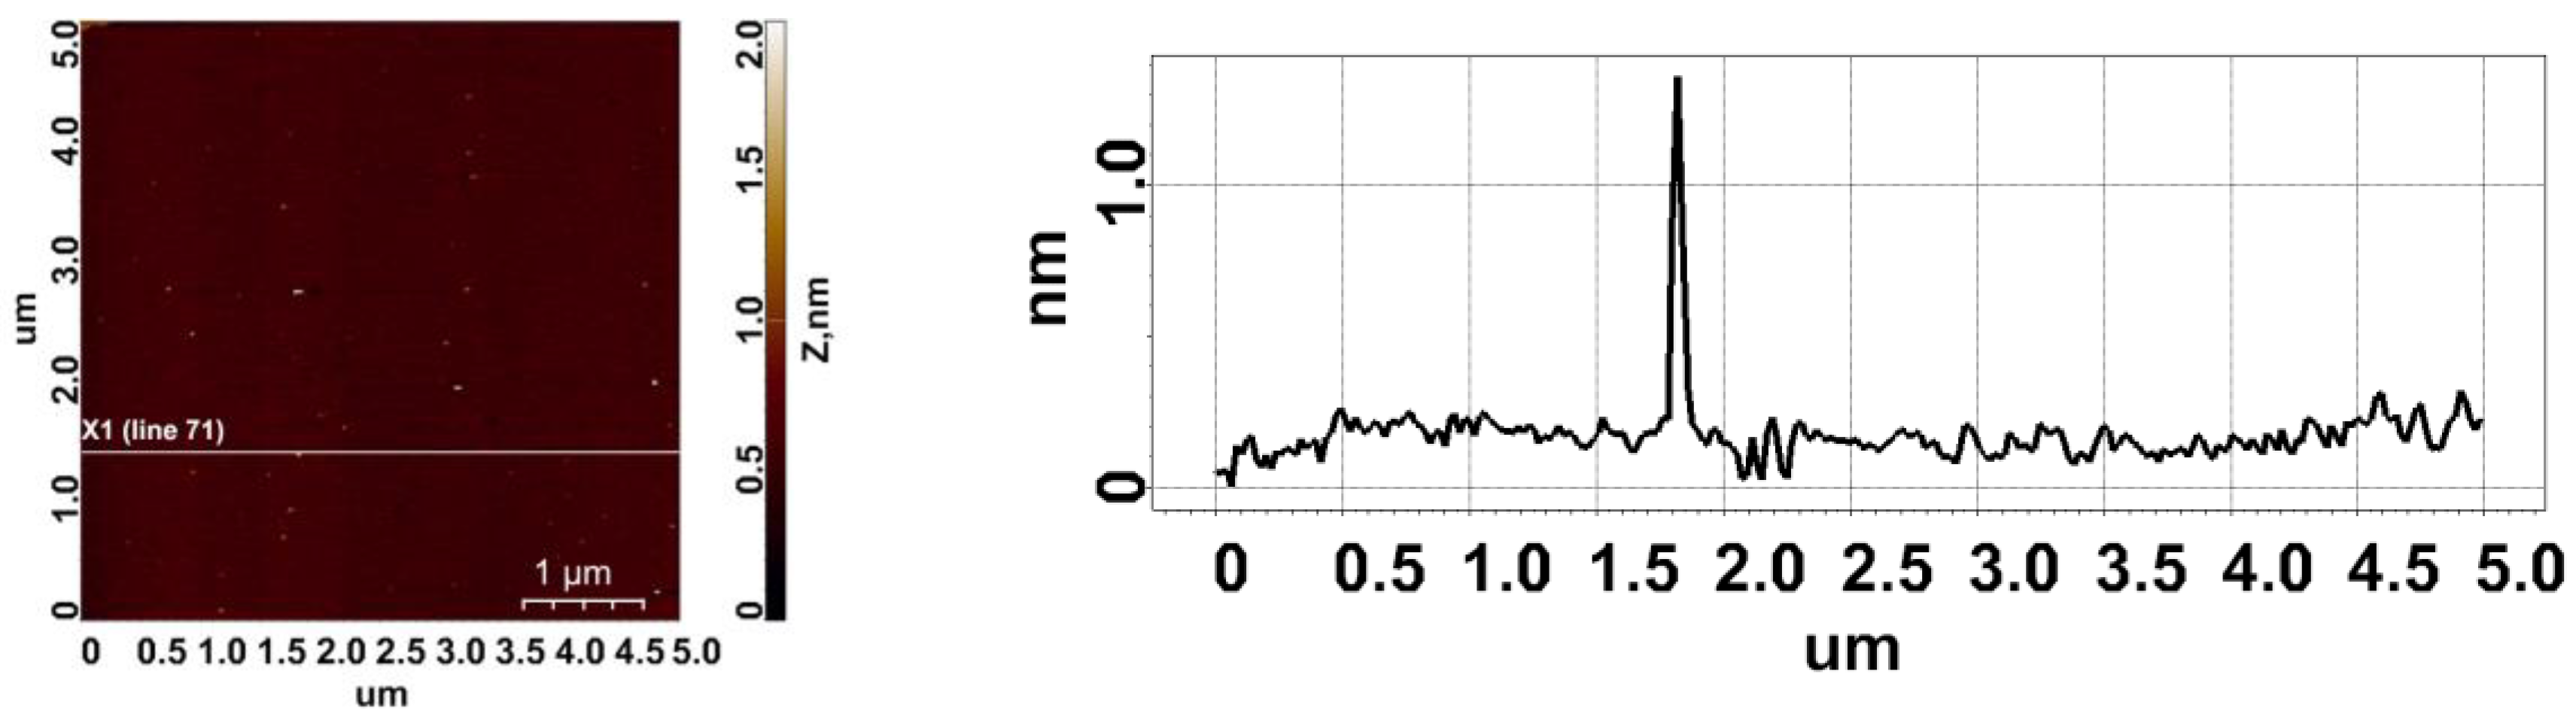
2.1. AFM Imaging
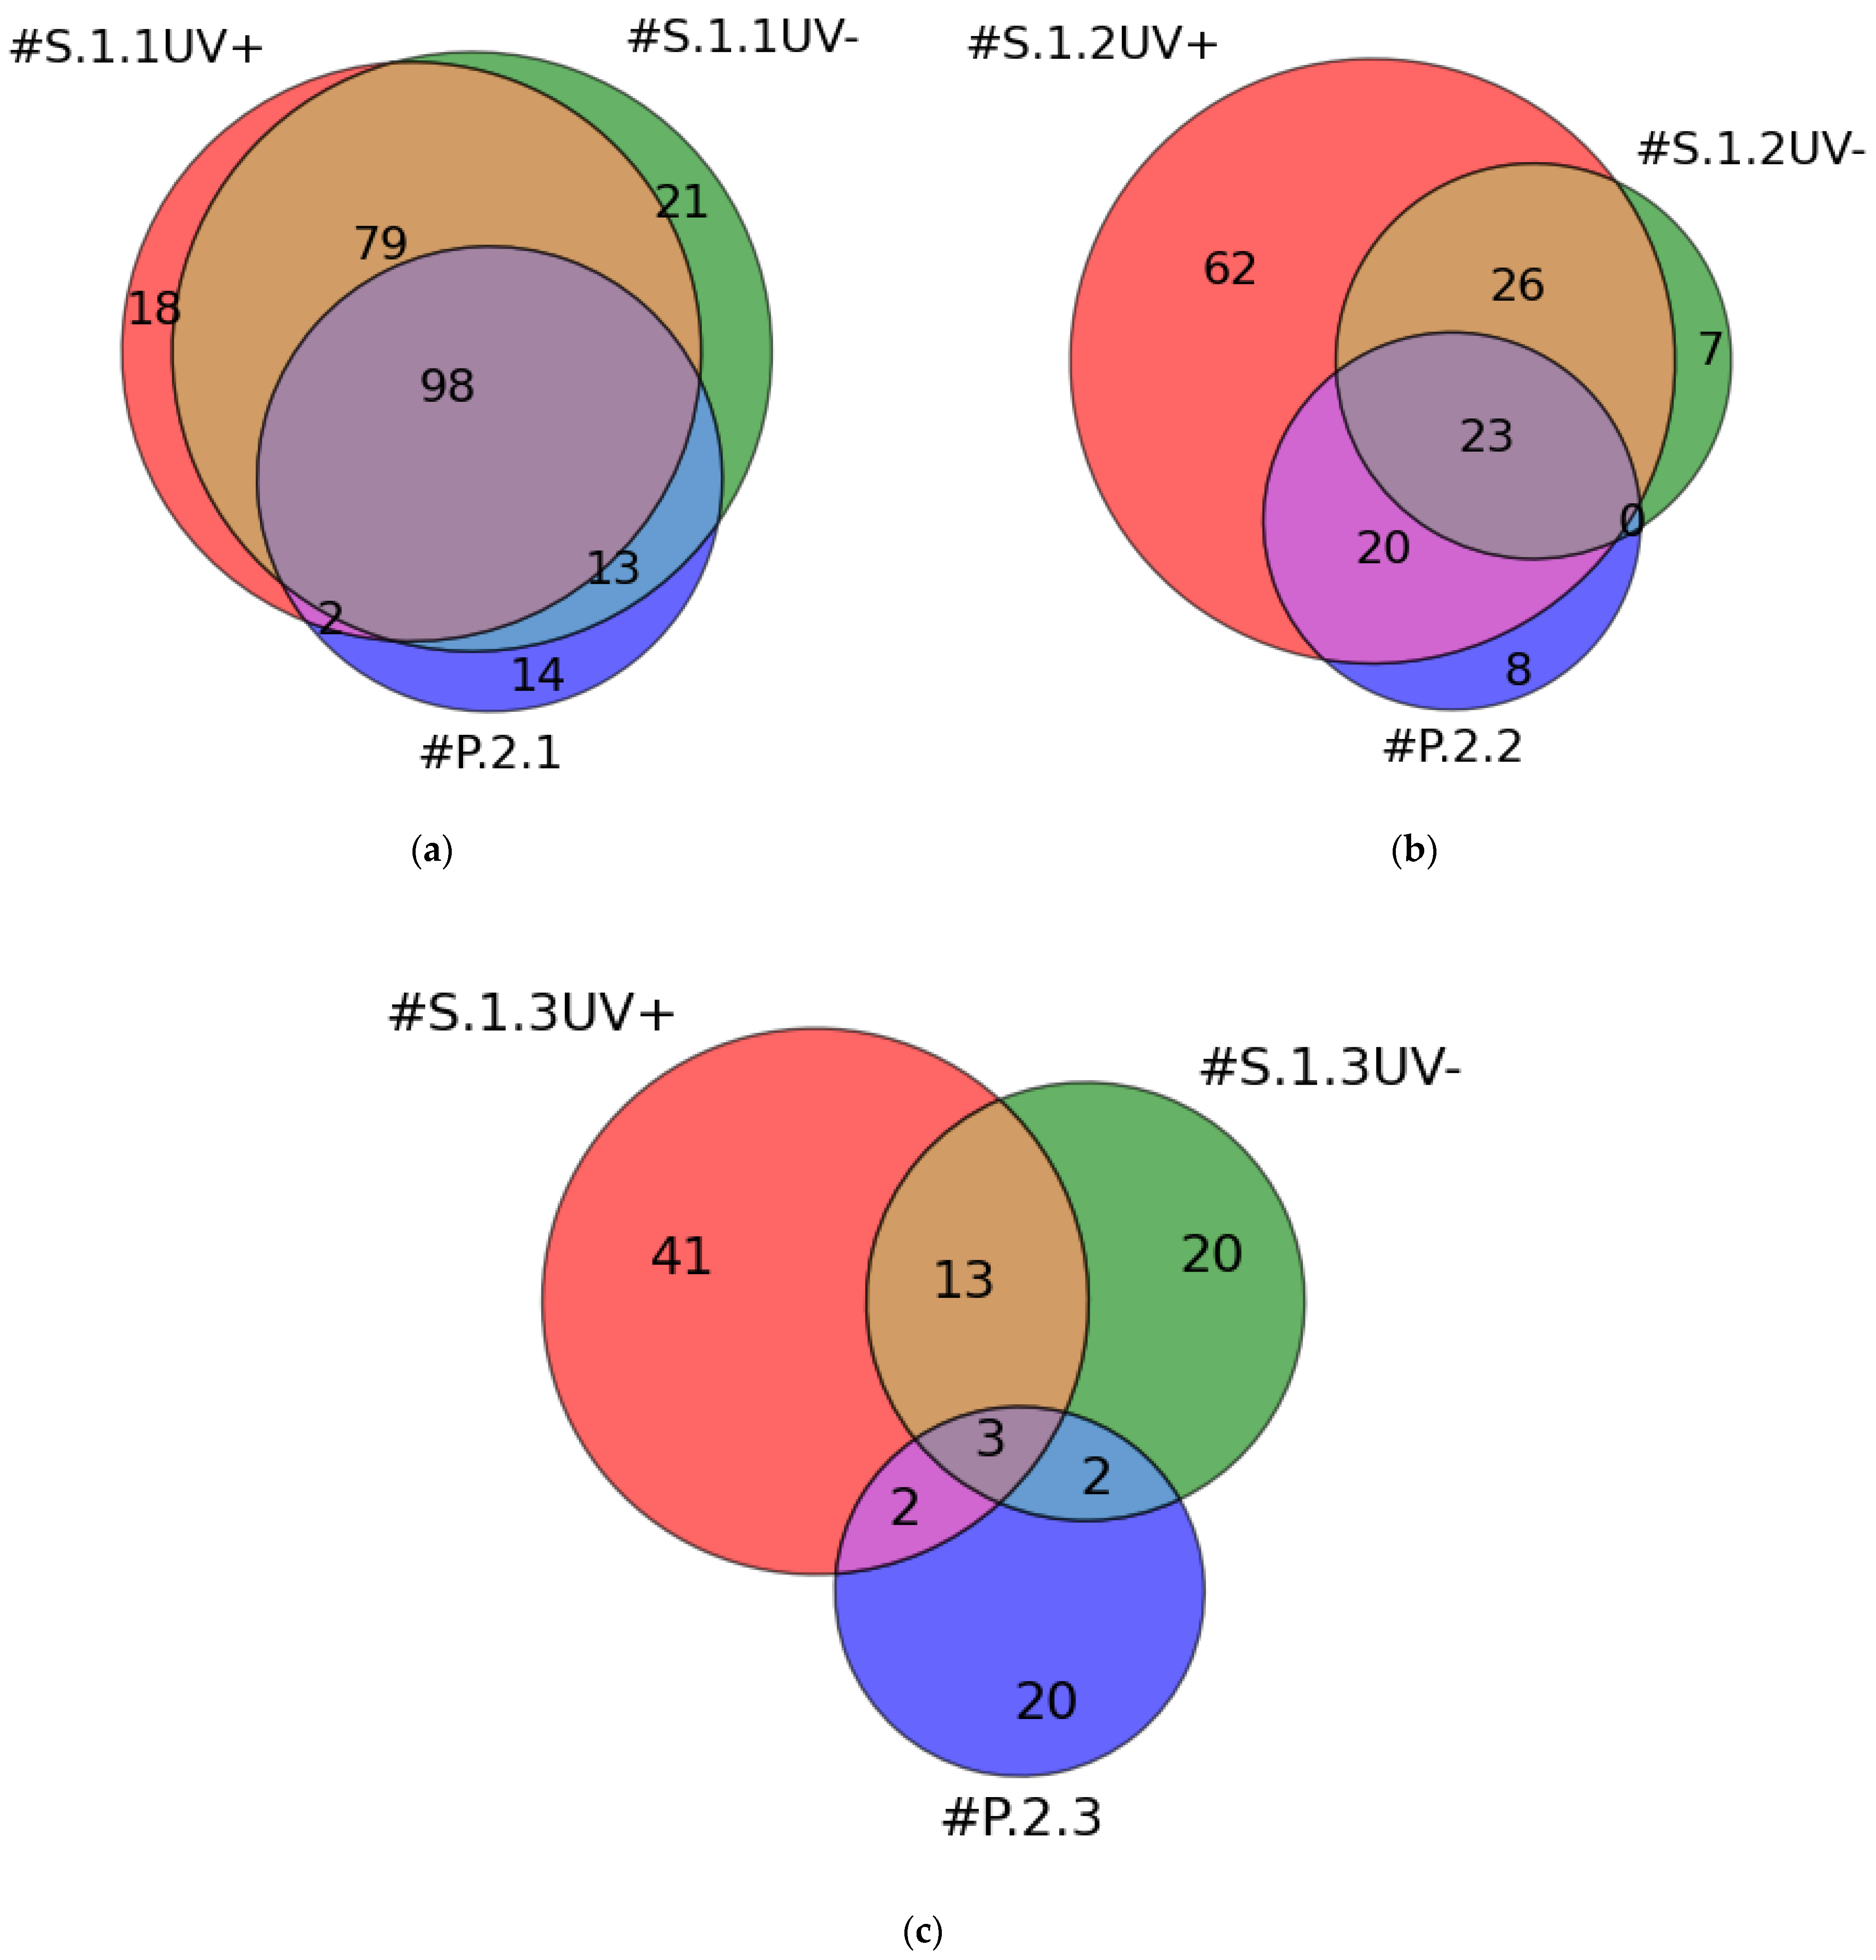
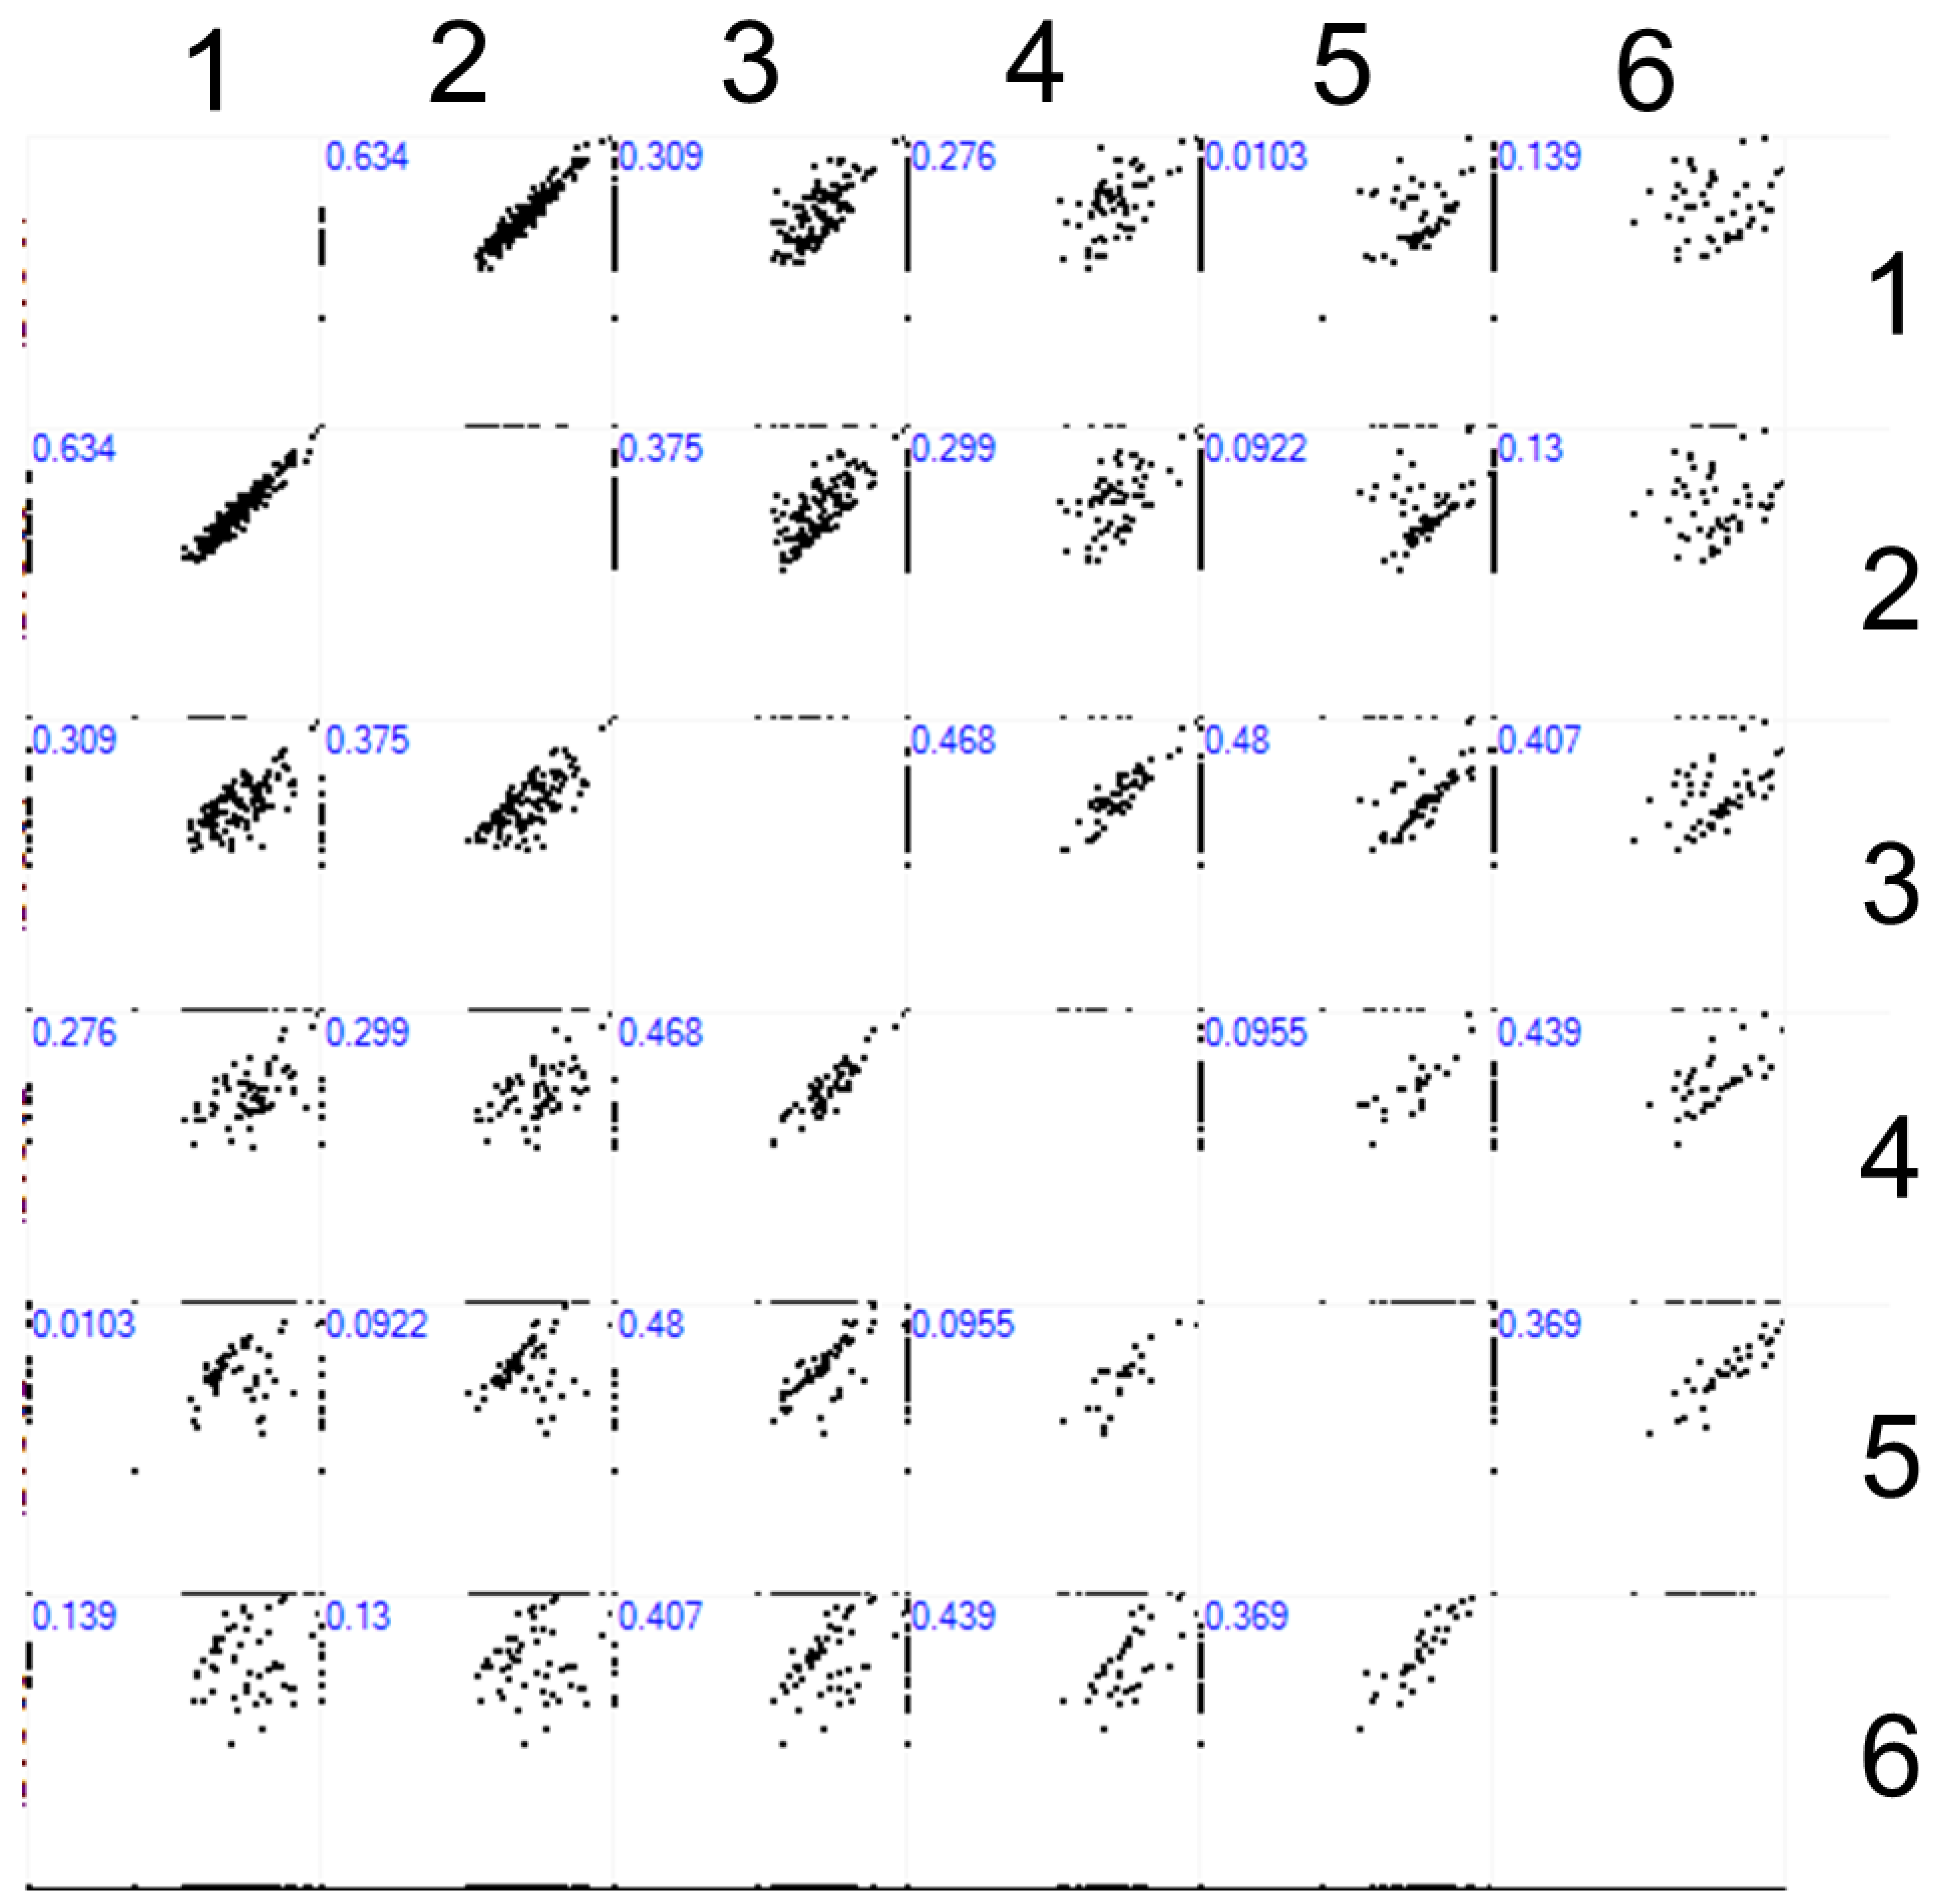
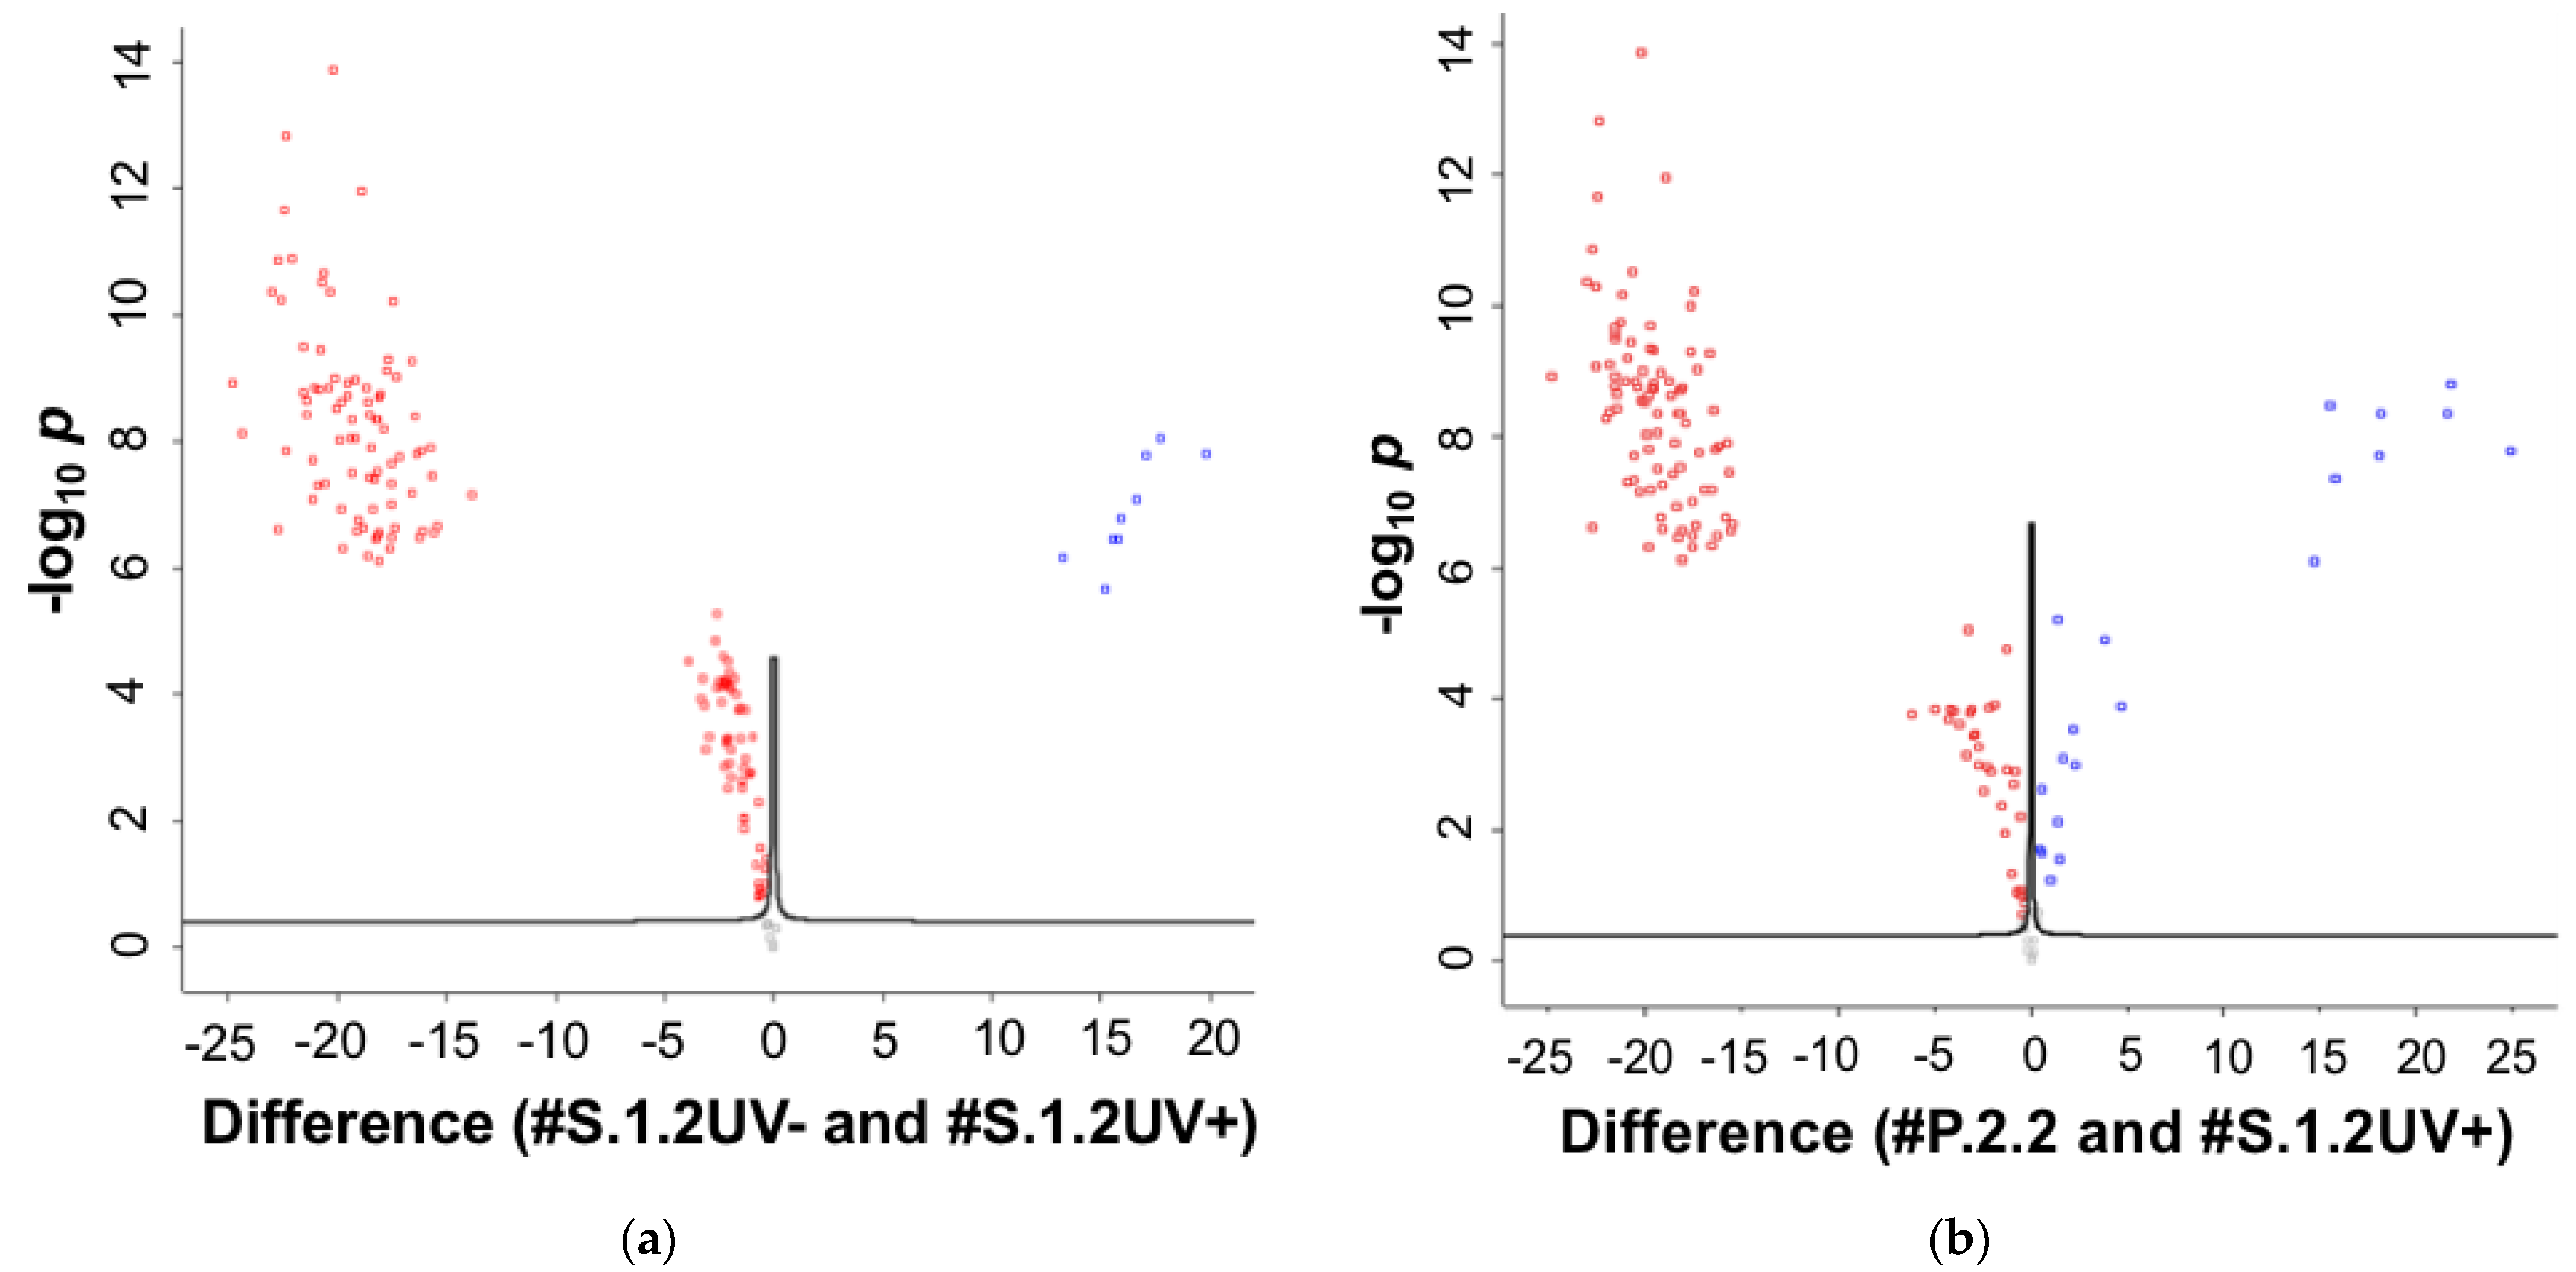
2.2. MS Identification of Proteins in Plasma Solution and Eluates from the AFM Chip Surface
3. Discussion
4. Materials and Methods
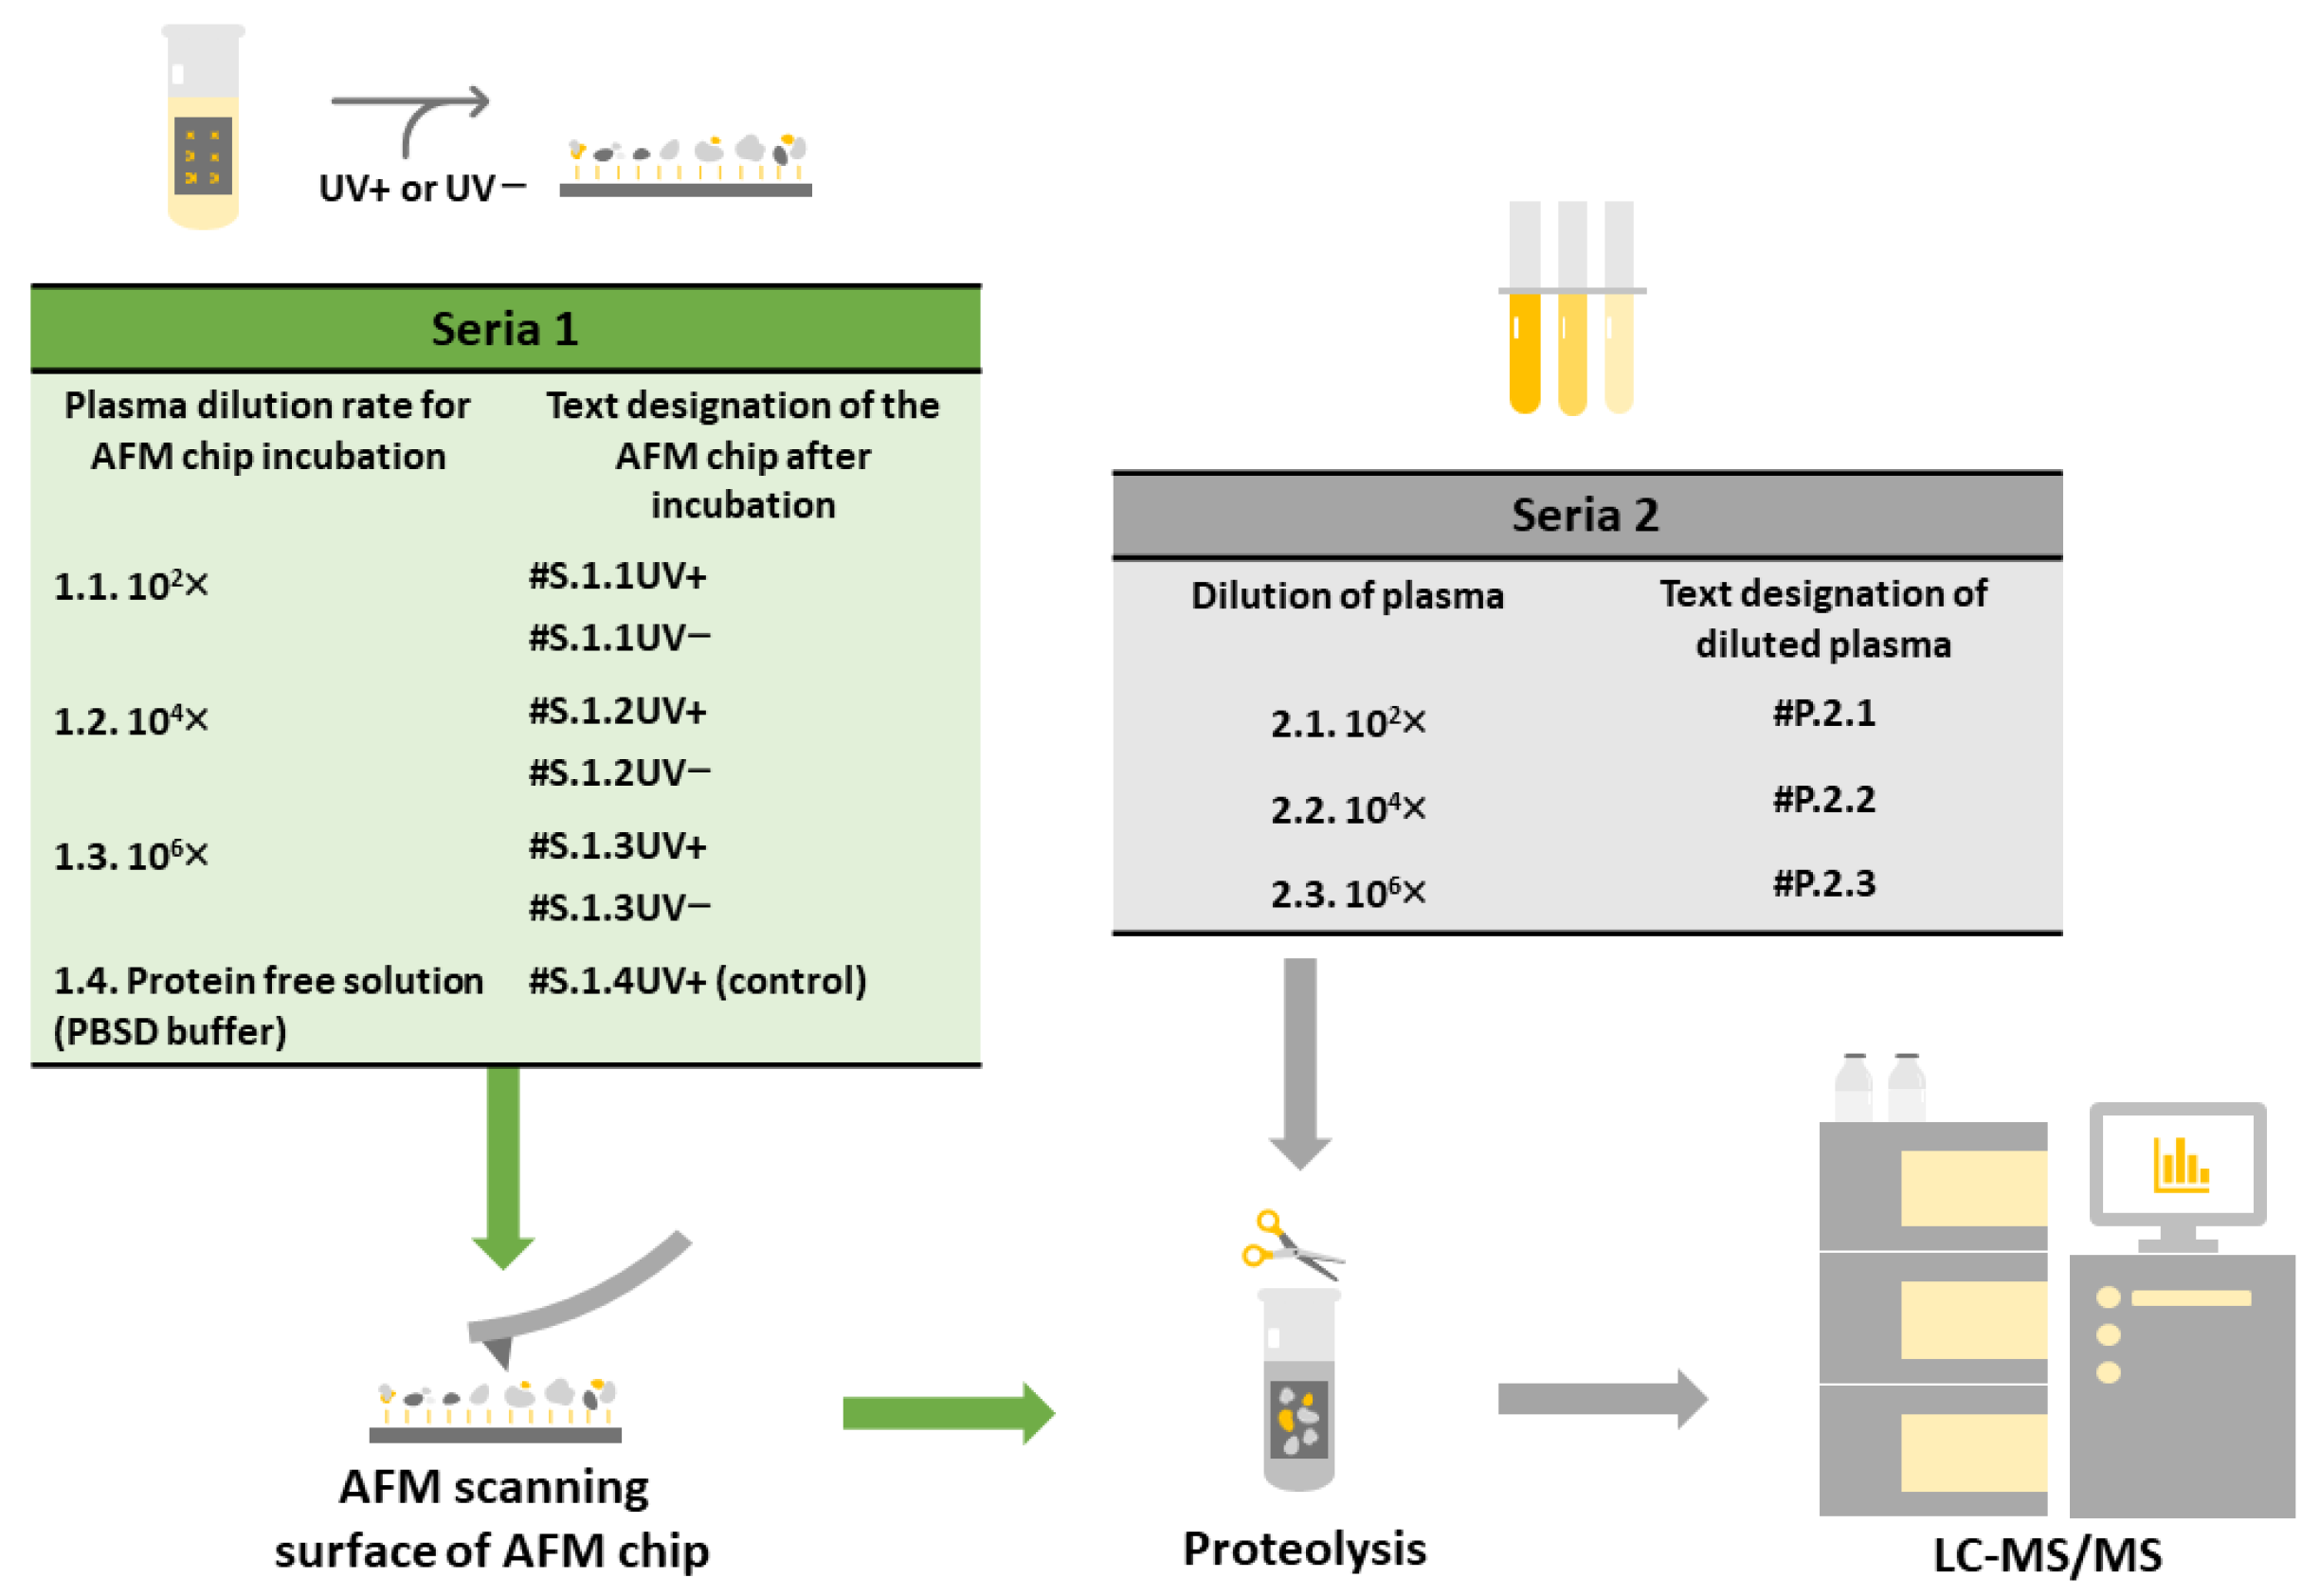
4.1. Experiment Setup
4.2. Proteins
4.3. Plasma Sample Preparation
4.4. Chemicals
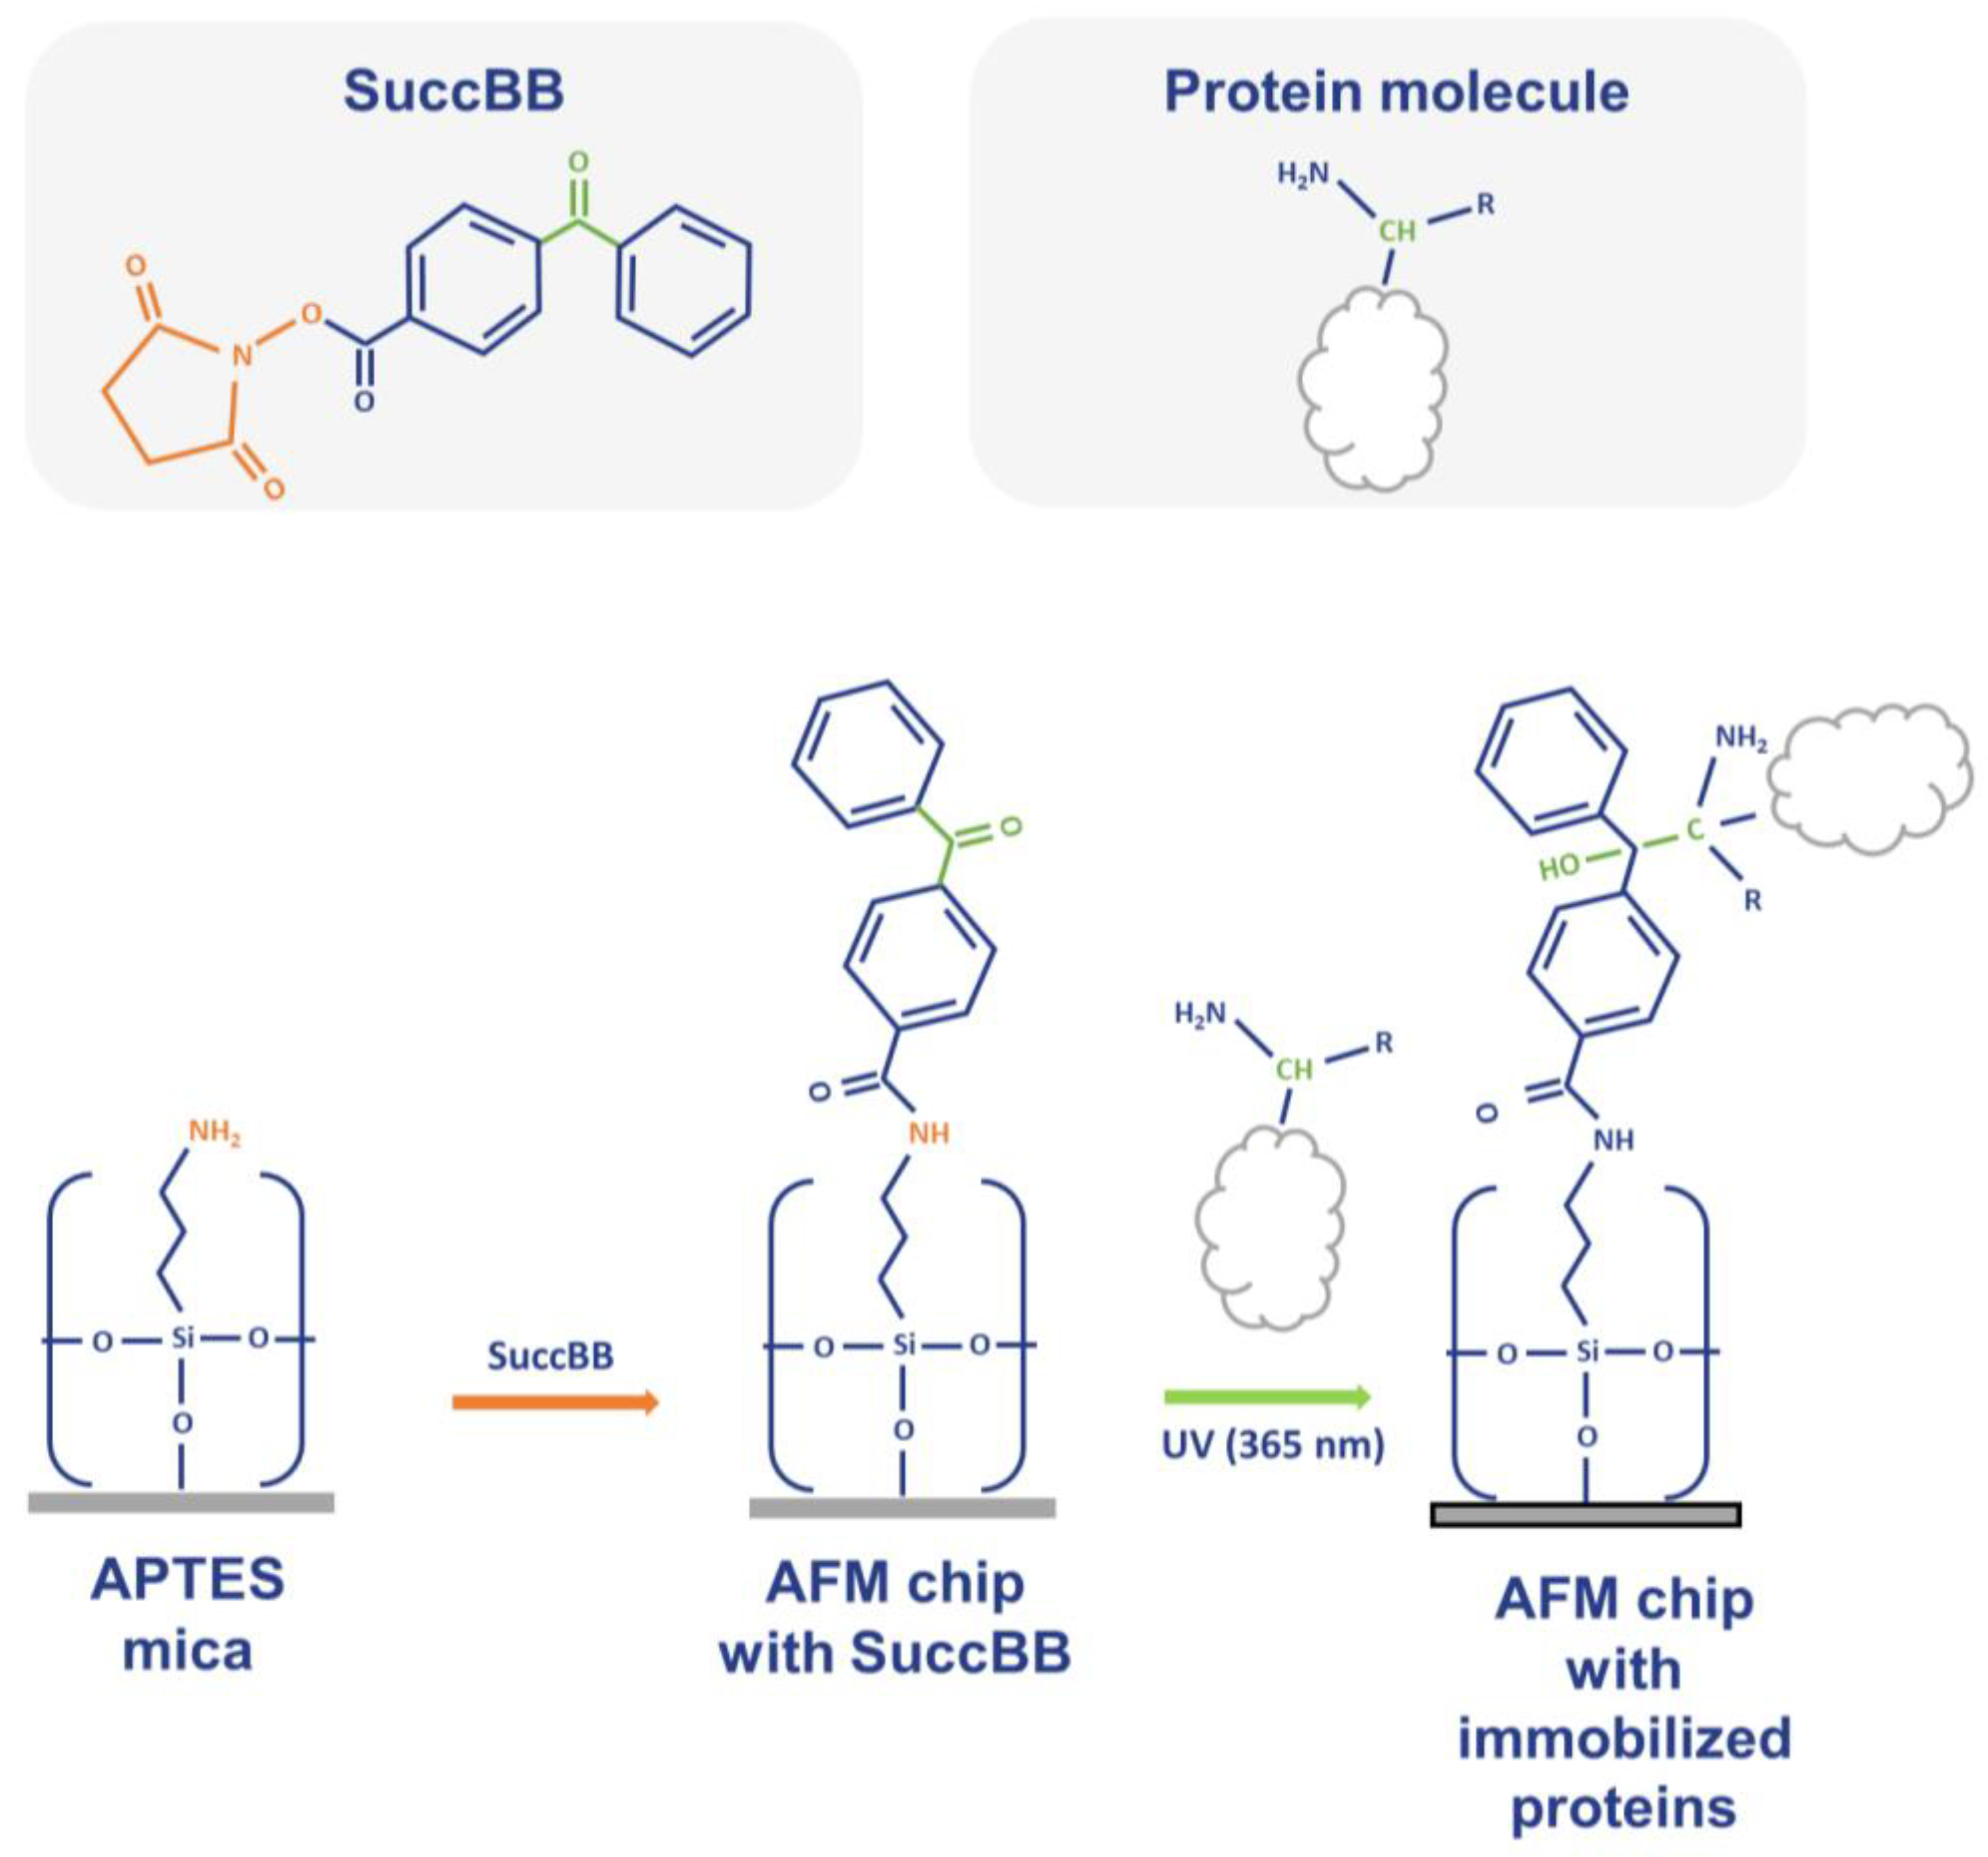
4.5. Modification and Activation of AFM Substrate Surface
4.6. Fishing the Plasma Proteins
4.7. AFM Scanning
4.8. Preparation of the AFM Substrate for Mass Spectrometry Measurements
4.9. MS Measurements
4.9.1. LC-MS Measurements
4.9.2. Acquisition of MS Data
4.9.3. MS Data Processing
5. Conclusions
Author Contributions
Funding
Institutional Review Board Statement
Informed Consent Statement
Data Availability Statement
Acknowledgments
Conflicts of Interest
Appendix A
References
- Pietrowska, M.; Wlosowicz, A.; Gawin, M.; Widlak, P. MS-Based Proteomic Analysis of Serum and Plasma: Problem of High Abundant Components and Lights and Shadows of Albumin Removal. Adv. Exp. Med. Biol. 2019, 1073, 57–76. [Google Scholar] [CrossRef] [PubMed]
- Anderson, N.L.; Anderson, N.G. The Human Plasma Proteome: History, Character, and Diagnostic Prospects. Mol. Cell Proteom. 2002, 1, 845–867. [Google Scholar] [CrossRef] [PubMed]
- Cloonan, M.J.; Bishop, G.A.; Wilton-Smith, P.D.; Carter, I.W.; Allan, R.M.; Wilcken, D.E. An Enzyme-Immunoassay for Myoglobin in Human Serum and Urine. Method Development, Normal Values and Application to Acute Myocardial Infarction. Pathology 1979, 11, 689–699. [Google Scholar] [CrossRef] [PubMed]
- Monastero, R.N.; Pentyala, S. Cytokines as Biomarkers and Their Respective Clinical Cutoff Levels. Int. J. Inflam. 2017, 2017, 4309485. [Google Scholar] [CrossRef] [PubMed]
- Boskabadi, H.; Maamouri, G.; Tavakol Afshari, J.; Mafinejad, S.; Hosseini, G.; Mostafavi-Toroghi, H.; Saber, H.; Ghayour-Mobarhan, M.; Ferns, G. Evaluation of Serum Interleukins-6, 8 and 10 Levels as Diagnostic Markers of Neonatal Infection and Possibility of Mortality. Iran. J. Basic. Med. Sci. 2013, 16, 1232–1237. [Google Scholar] [PubMed]
- Malsagova, K.A.; Pleshakova, T.O.; Galiullin, R.A.; Kaysheva, A.L.; Shumov, I.D.; Ilnitskii, M.A.; Popov, V.P.; Glukhov, A.V.; Archakov, A.I.; Ivanov, Y.D. Ultrasensitive Nanowire-Based Detection of HCVcoreAg in the Serum Using a Microwave Generator. Anal. Methods 2018, 10, 2740–2749. [Google Scholar] [CrossRef]
- Shi, T.; Zhou, J.-Y.; Gritsenko, M.A.; Hossain, M.; Camp, D.G.; Smith, R.D.; Qian, W.-J. IgY14 and SuperMix Immunoaffinity Separations Coupled with Liquid Chromatography-Mass Spectrometry for Human Plasma Proteomics Biomarker Discovery. Methods 2012, 56, 246–253. [Google Scholar] [CrossRef]
- Kovàcs, A.; Guttman, A. Medicinal Chemistry Meets Proteomics: Fractionation of the Human Plasma Proteome. Curr. Med. Chem. 2013, 20, 483–490. [Google Scholar] [CrossRef]
- Keilhauer, E.C.; Hein, M.Y.; Mann, M. Accurate Protein Complex Retrieval by Affinity Enrichment Mass Spectrometry (AE-MS) Rather than Affinity Purification Mass Spectrometry (AP-MS). Mol. Cell Proteom. 2015, 14, 120–135. [Google Scholar] [CrossRef]
- Monopoli, M.P.; Walczyk, D.; Campbell, A.; Elia, G.; Lynch, I.; Bombelli, F.B.; Dawson, K.A. Physical-Chemical Aspects of Protein Corona: Relevance to in Vitro and in Vivo Biological Impacts of Nanoparticles. J. Am. Chem. Soc. 2011, 133, 2525–2534. [Google Scholar] [CrossRef]
- Perona Martinez, F.; Nagl, A.; Guluzade, S.; Schirhagl, R. Nanodiamond for Sample Preparation in Proteomics. Anal. Chem. 2019, 91, 9800–9805. [Google Scholar] [CrossRef] [PubMed]
- Meng, Y.; Chen, J.; Liu, Y.; Zhu, Y.; Wong, Y.-K.; Lyu, H.; Shi, Q.; Xia, F.; Gu, L.; Zhang, X.; et al. A Highly Efficient Protein Corona-Based Proteomic Analysis Strategy for the Discovery of Pharmacodynamic Biomarkers. J. Pharm. Anal. 2022, 12, 879–888. [Google Scholar] [CrossRef] [PubMed]
- Blume, J.E.; Manning, W.C.; Troiano, G.; Hornburg, D.; Figa, M.; Hesterberg, L.; Platt, T.L.; Zhao, X.; Cuaresma, R.A.; Everley, P.A.; et al. Rapid, Deep and Precise Profiling of the Plasma Proteome with Multi-Nanoparticle Protein Corona. Nat. Commun. 2020, 11, 3662. [Google Scholar] [CrossRef] [PubMed]
- Ma, C.; Li, Y.; Li, J.; Song, L.; Chen, L.; Zhao, N.; Li, X.; Chen, N.; Long, L.; Zhao, J.; et al. Comprehensive and Deep Profiling of the Plasma Proteome with Protein Corona on Zeolite NaY. J. Pharm. Anal. 2023, 13, 503–513. [Google Scholar] [CrossRef] [PubMed]
- Archakov, A.; Ivanov, Y.; Lisitsa, A.; Zgoda, V. Biospecific Irreversible Fishing Coupled with Atomic Force Microscopy for Detection of Extremely Low-Abundant Proteins. Proteomics 2009, 9, 1326–1343. [Google Scholar] [CrossRef] [PubMed]
- Ivanov, Y.D.; Danichev, V.V.; Pleshakova, T.O.; Shumov, I.D.; Ziborov, V.S.; Krokhin, N.V.; Zagumenniy, M.N.; Ustinov, V.S.; Smirnov, L.P.; Shironin, A.V.; et al. Irreversible Chemical AFM-Based Fishing for Detection of Low-Copied Proteins. Biochem. (Moscow) Suppl. Ser. B Biomed. Chem. 2013, 7, 46–61. [Google Scholar] [CrossRef]
- Kaysheva, A.L.; Isaeva, A.I.; Pleshakova, T.O.; Shumov, I.D.; Valueva, A.A.; Ershova, M.O.; Ivanova, I.A.; Ziborov, V.S.; Iourov, I.Y.; Vorsanova, S.G.; et al. Detection of Circulating Serum microRNA/Protein Complexes in ASD Using Functionalized Chips for an Atomic Force Microscope. Molecules 2021, 26, 5979. [Google Scholar] [CrossRef]
- Pleshakova, T.; Kaysheva, A.; Shumov, I.; Ziborov, V.; Bayzyanova, J.; Konev, V.; Uchaikin, V.; Archakov, A.; Ivanov, Y. Detection of Hepatitis C Virus Core Protein in Serum Using Aptamer-Functionalized AFM Chips. Micromachines 2019, 10, 129. [Google Scholar] [CrossRef]
- Braga, P.C.; Ricci, D. (Eds.) Atomic Force Microscopy: Biomedical Methods and Applications; Humana Press: Totowa, NJ, USA, 2004. [Google Scholar]
- Roos, W.H.; Wuite, G.J.L. Nanoindentation Studies Reveal Material Properties of Viruses. Adv. Mater. 2009, 21, 1187–1192. [Google Scholar] [CrossRef]
- Gordeeva, A.I.; Valueva, A.A.; Ershova, M.O.; Rybakova, E.E.; Shumov, I.D.; Kozlov, A.F.; Ziborov, V.S.; Zavialova, M.G.; Zgoda, V.G.; Ivanov, Y.D.; et al. Mass Spectrometric Identification of BSA Covalently Captured onto a Chip for Atomic Force Microscopy. Int. J. Mol. Sci. 2023, 24, 8999. [Google Scholar] [CrossRef]
- Valueva, A.A.; Shumov, I.D.; Kaysheva, A.L.; Ivanova, I.A.; Ziborov, V.S.; Ivanov, Y.D.; Pleshakova, T.O. Covalent Protein Immobilization onto Muscovite Mica Surface with a Photocrosslinker. Minerals 2020, 10, 464. [Google Scholar] [CrossRef]
- Ivanov, A.S.; Medvedev, A.; Ershov, P.; Molnar, A.; Mezentsev, Y.; Yablokov, E.; Kaluzhsky, L.; Gnedenko, O.; Buneeva, O.; Haidukevich, I.; et al. Protein Interactomics Based on Direct Molecular Fishing on Paramagnetic Particles: Practical Realization and Further SPR Validation. Proteomics 2014, 14, 2261–2274. [Google Scholar] [CrossRef] [PubMed]
- Florinskaya, A.; Ershov, P.; Mezentsev, Y.; Kaluzhskiy, L.; Yablokov, E.; Medvedev, A.; Ivanov, A. SPR Biosensors in Direct Molecular Fishing: Implications for Protein Interactomics. Sensors 2018, 18, 1616. [Google Scholar] [CrossRef] [PubMed]
- Archakov, A.; Zgoda, V.; Kopylov, A.; Naryzhny, S.; Chernobrovkin, A.; Ponomarenko, E.; Lisitsa, A. Chromosome-Centric Approach to Overcoming Bottlenecks in the Human Proteome Project. Expert. Rev. Proteom. 2012, 9, 667–676. [Google Scholar] [CrossRef] [PubMed]
- Schwanhäusser, B.; Busse, D.; Li, N.; Dittmar, G.; Schuchhardt, J.; Wolf, J.; Chen, W.; Selbach, M. Global Quantification of Mammalian Gene Expression Control. Nature 2011, 473, 337–342. [Google Scholar] [CrossRef] [PubMed]
- Namekar, M.; Kumar, M.; O’Connell, M.; Nerurkar, V.R. Effect of Serum Heat-Inactivation and Dilution on Detection of Anti-WNV Antibodies in Mice by West Nile Virus E-Protein Microsphere Immunoassay. PLoS ONE 2012, 7, e45851. [Google Scholar] [CrossRef]
- Schnaidt, M.; Weinstock, C.; Jurisic, M.; Schmid-Horch, B.; Ender, A.; Wernet, D. HLA Antibody Specification Using Single-Antigen Beads—A Technical Solution for the Prozone Effect. Transplantation 2011, 92, 510–515. [Google Scholar] [CrossRef]
- Weber, T.H.; Käpyaho, K.I.; Tanner, P. Endogenous Interference in Immunoassays in Clinical Chemistry. A Review. Scand. J. Clin. Lab. Investig. Suppl. 1990, 201, 77–82. [Google Scholar] [CrossRef]
- Appler, K.K.; Brown, A.N.; Stewart, B.S.; Behr, M.J.; Demarest, V.L.; Wong, S.J.; Bernard, K.A. Persistence of West Nile Virus in the Central Nervous System and Periphery of Mice. PLoS ONE 2010, 5, e10649. [Google Scholar] [CrossRef]
- Martins, T.B.; Litwin, C.M.; Hill, H.R. Evaluation of a Multiplex Fluorescent Microsphere Immunoassay for the Determination of Epstein-Barr Virus Serologic Status. Am. J. Clin. Pathol. 2008, 129, 34–41. [Google Scholar] [CrossRef]
- Trilling, A.K.; Beekwilder, J.; Zuilhof, H. Antibody Orientation on Biosensor Surfaces: A Minireview. Analyst 2013, 138, 1619–1627. [Google Scholar] [CrossRef] [PubMed]
- Andrade, J.D.; Hlady, V.; Wei, A.P. Adsorption of complex proteins at interfaces. Pure Appl. Chem. 1992, 64, 1777–1781. [Google Scholar] [CrossRef]
- Ramsden, J.J. Puzzles and paradoxes in protein adsorption. Chem. Soc. Rev. 1995, 24, 73–78. [Google Scholar] [CrossRef]
- Roth, C.M.; Lenhoff, A.M. Electrostatic and van Der Waals Contributions to Protein Adsorption: Computation of Equilibrium Constants. Langmuir 1993, 9, 962–972. [Google Scholar] [CrossRef]
- Zhdanov, V.P.; Kasemo, B. Van der Waals Interaction during Protein Adsorption on a Solid Covered by a Thin Film. Langmuir 2001, 17, 5407–5409. [Google Scholar] [CrossRef]
- Prestwich, G.D.; Dormán, G.; Elliott, J.T.; Marecak, D.M.; Chaudhary, A. Benzophenone Photoprobes for Phosphoinositides, Peptides and Drugs. Photochem. Photobiol. 1997, 65, 222–234. [Google Scholar] [CrossRef]
- Chen, X.; Chen, J.; Huang, N. The Structure, Formation, and Effect of Plasma Protein Layer on the Blood Contact Materials: A Review. Biosurface Biotribology 2022, 8, 1–14. [Google Scholar] [CrossRef]
- Brash, J.L.; Horbett, T.A.; Latour, R.A.; Tengvall, P. The Blood Compatibility Challenge. Part 2: Protein Adsorption Phenomena Governing Blood Reactivity. Acta Biomater. 2019, 94, 11–24. [Google Scholar] [CrossRef]
- Arvidsson, S.; Askendal, A.; Tengvall, P. Blood Plasma Contact Activation on Silicon, Titanium and Aluminium. Biomaterials 2007, 28, 1346–1354. [Google Scholar] [CrossRef]
- Carter, D.C.; Ho, J.X. Structure of Serum Albumin. In Advances in Protein Chemistry; Elsevier: Amsterdam, The Netherlands, 1994; Volume 45. [Google Scholar] [CrossRef]
- Yamada, K.; Yoshii, S.; Kumagai, S.; Fujiwara, I.; Nishio, K.; Okuda, M.; Matsukawa, N.; Yamashita, I. High-Density and Highly Surface Selective Adsorption of Protein–Nanoparticle Complexes by Controlling Electrostatic Interaction. Jpn. J. Appl. Phys. 2006, 45, 4259. [Google Scholar] [CrossRef]
- Anselm, V.; Novikova, S.; Zgoda, V. Re-Adaption on Earth after Spaceflights Affects the Mouse Liver Proteome. Int. J. Mol. Sci. 2017, 18, 1763. [Google Scholar] [CrossRef] [PubMed]
- Cox, J.; Mann, M. MaxQuant Enables High Peptide Identification Rates, Individualized p.p.b.-Range Mass Accuracies and Proteome-Wide Protein Quantification. Nat. Biotechnol. 2008, 26, 1367–1372. [Google Scholar] [CrossRef] [PubMed]
- Cox, J.; Neuhauser, N.; Michalski, A.; Scheltema, R.A.; Olsen, J.V.; Mann, M. Andromeda: A Peptide Search Engine Integrated into the MaxQuant Environment. J. Proteome Res. 2011, 10, 1794–1805. [Google Scholar] [CrossRef] [PubMed]
- Deutsch, E.; Lane, L.; Overall, C.; Bandeira, N.; Baker, M.; Pineau, C.; Moritz, R.; Corrales, F.; Orchard, S.; Eyk, J.; et al. Human Proteome Project Mass Spectrometry Data Interpretation Guidelines 3.0. J. Proteome Res. 2019, 2019, 4108–4116. [Google Scholar] [CrossRef]


| #S.1.1UV+ | #S.1.2UV+ | #S.1.3UV+ |
|---|---|---|
| Fructose-1,6-bisphosphatase 1 | Centrosomal protein of 290 kDa | Plakophilin-1 |
| Myosin regulatory light chain 12A | Histidine ammonia-lyase | Corneodesmosin |
| Flavin reductase | Plakophilin-1 | Titin |
| Transgelin-2 | Calmodulin-like protein 5 | A-kinase anchor protein 9 |
| Ras-related protein Rab-7a | Glyoxylate reductase/hydroxypyruvate reductase | Calmodulin-like protein 5 |
| Mesencephalic astrocyte-derived neurotrophic factor | Glyoxylate reductase/hydroxypyruvate reductase | |
| Thymosin beta-4 | Fatty acid-binding protein 5 | |
| Septin-7 | ||
| Protein DBF4 homolog B | ||
| Titin | ||
| Glyoxylate reductase/hydroxypyruvate reductase | ||
| Myosin-2 | ||
| Coronin-1C | ||
| Polymeric immunoglobulin receptor |
Disclaimer/Publisher’s Note: The statements, opinions and data contained in all publications are solely those of the individual author(s) and contributor(s) and not of MDPI and/or the editor(s). MDPI and/or the editor(s) disclaim responsibility for any injury to people or property resulting from any ideas, methods, instructions or products referred to in the content. |
© 2023 by the authors. Licensee MDPI, Basel, Switzerland. This article is an open access article distributed under the terms and conditions of the Creative Commons Attribution (CC BY) license (https://creativecommons.org/licenses/by/4.0/).
Share and Cite
Gordeeva, A.I.; Valueva, A.A.; Rybakova, E.E.; Ershova, M.O.; Shumov, I.D.; Kozlov, A.F.; Ziborov, V.S.; Kozlova, A.S.; Zgoda, V.G.; Ivanov, Y.D.; et al. MS Identification of Blood Plasma Proteins Concentrated on a Photocrosslinker-Modified Surface. Int. J. Mol. Sci. 2024, 25, 409. https://doi.org/10.3390/ijms25010409
Gordeeva AI, Valueva AA, Rybakova EE, Ershova MO, Shumov ID, Kozlov AF, Ziborov VS, Kozlova AS, Zgoda VG, Ivanov YD, et al. MS Identification of Blood Plasma Proteins Concentrated on a Photocrosslinker-Modified Surface. International Journal of Molecular Sciences. 2024; 25(1):409. https://doi.org/10.3390/ijms25010409
Chicago/Turabian StyleGordeeva, Arina I., Anastasia A. Valueva, Elizaveta E. Rybakova, Maria O. Ershova, Ivan D. Shumov, Andrey F. Kozlov, Vadim S. Ziborov, Anna S. Kozlova, Victor G. Zgoda, Yuri D. Ivanov, and et al. 2024. "MS Identification of Blood Plasma Proteins Concentrated on a Photocrosslinker-Modified Surface" International Journal of Molecular Sciences 25, no. 1: 409. https://doi.org/10.3390/ijms25010409