Article

The Involvement of LAG-3positive Plasma Cells in the Development of Multiple Myeloma

1
The Division of Hematology, Bnai Zion Medical Center, Sderot Eliyahu Golomb 47, Haifa 3339419, Israel
2
The Ruth and Bruce Rappaport Faculty of Medicine, Technion, Efron St 1, Haifa 3525433, Israel
3
The Proteomic Unit, Bnai Zion Medical Center, Sderot Eliyahu Golomb 47, Haifa 3104802, Israel
4
The Division of Hematology, Galilee Medical Center, Nahariya-Cabri 89, Nahariyya 221001, Israel
5
Azrieli Faculty of Medicine, Bar-Ilan University, Henrietta Szold St 8, Safed 1311502, Israel
6
The Division of Hematology, Kaplan Medical Center, Derech Pasternak 1, Rehovot 7610001, Israel
*
Author to whom correspondence should be addressed.
These authors contributed equally to this work.
Int. J. Mol. Sci. 2024, 25(1), 549; https://doi.org/10.3390/ijms25010549
Submission received: 22 November 2023 / Revised: 24 December 2023 / Accepted: 27 December 2023 / Published: 31 December 2023

Abstract

:
The Lymphocyte-Activation Protein 3 (LAG-3) inhibitory receptor is expressed on regulatory plasma cells (PCs). Micro-environmental cells that express LAG-3 were found to be increased during the progression of smoldering multiple myeloma (SMM). To assess the possible role of LAG-3 expression on regulatory PCs in patients with plasma cell dyscrasia. Purified Cluster of Differentiation 138 (CD138+) PCs from patients with premalignant conditions, active multiple myeloma (MM), and controls were analyzed for the expression of LAG-3 by flow cytometry. Autologous CD8+T cells were incubated with sorted LAG-3pos or LAG-3neg PCs for 24 h. The expression of granzyme (Grz) in CD8+T cells was assessed by flow cytometry. LAG-3 expression on PCs in active MM (newly diagnosed and relapse refractory MM) was significantly increased compared to monoclonal gammopathy of undetermined significance (MGUS)/ SMM. Grz expression was significantly decreased in CD8+T cells incubated with CD138+LAG-3pos PCs, compared to CD138+LAG-3neg PCs in patients with plasma cell dyscrasia, n = 31, p = 0.0041. LAG-3 expression on malignant PCs can be involved in the development of MM from MGUS by decreasing the expression of Grz in CD8+T cells.

1. Introduction

Multiple myeloma (MM) is a clonal plasma cell malignancy characterized by the proliferation of antibody-producing plasma cells (PCs) within the bone marrow (BM), and the secretion of monoclonal immunoglobulins into the peripheral blood and the urine [1]. The increased proliferation of malignant PCs is frequently followed by excessive infiltration into the whole skeleton, causing bone lesions and the evolvement of renal failure, anemia, and hypercalcemia. In most cases, MM is preceded by an asymptomatic pre-malignant stage termed monoclonal gammopathy of undetermined significance (MGUS). This may then move into a more advanced but asymptomatic stage, defined as smoldering multiple myeloma (SMM) [2].
In clinical practice, three models are used to predict the progression of MGUS and SMM to MM: the Mayo Clinic, the Spanish Study group, and the IWMG 20/2/20 risk stratification systems [3,4,5]. These models include parameters of higher disease burden, such as a higher monoclonal protein level, a higher free light chain (FLC) ratio, and a greater percentage of monoclonal PCs in bone marrow (BM). In addition, these models include some biological markers of progression, such as the non-IGG type of M-protein in the Mayo Clinic model, the recognition of atypical PCs by flow cytometry, and the presence of immunoparesis, according to the Spanish model.
The prognosis of MM is defined by scoring systems, such as the International Staging System (ISS) and Revised ISS (R-ISS), which include B2-microglobulin, albumin, abnormal LDH, and high-risk genetic alterations [6,7]. Biological markers of MM progression are extensively studied but still have not found their place in clinical scoring models. One of the most investigated biological markers of progression in MM is PDL-1, which is also proposed as a potential therapeutic target [8,9]. CD200 is another surface molecule expressed on malignant PCs that was shown to have a prognostic significance in MM [10].
New treatment strategies, including different combinations of monoclonal antibodies, proteasome inhibitors, and immunomodulatory drugs, significantly improved the prognosis and survival of MM patients [11,12,13]. However, despite the progress that has been made in recent years in the treatment of MM, the disease remains incurable, and there is an unmet need for new therapies. The discovery of new therapeutical options in MM is directly related to gaining a better understanding of disease pathogenesis. From this point of view, the role of the immune system and the BM microenvironment in the development of MM has recently been emphasized, especially as a potential target for therapy.
Historically, IL-6 was one of the first immune molecules explored in the pathogenesis of MM. This soluble factor is secreted by plasma and bone marrow stromal cells, promoting the perfect microenvironment for MM development [14,15]. Unfortunately, early clinical trials of anti-IL-6 treatment failed to achieve a clinical response [16]. Similar to IL-6, TNF-α is one of the central cytokines that drive the proliferation and maintenance of tumor cells in MM [17]. Despite its important role in pathogenesis, there is no evidence of the effectiveness of anti-TNF-α antibodies in MM treatment; however, both IL-6 and TNF-α are correlated with disease activity in MM [17,18,19]. Another cytokine that was shown to be implicated in MM development is VEGF. The expression of VEGF by myeloma cell lines and PCs isolated from patients was demonstrated by S. Kumar [20]. Several antiangiogenic agents showed effectiveness in the preclinical phase but failed to achieve clinical response [21].
The recent discovery of anti-PD1 and anti-CTL4 antibodies started a revolution in the field of oncology. Unfortunately, these antibodies did not show efficiency in phase 3 clinical trials in MM and demonstrated a high level of toxicity [22,23]. One of the potential causes is the senescence of cytotoxic CD8+T cells in MM, which lack costimulatory receptors, such as CD28. The importance of cytotoxic CD8+T cells in the pathogenesis of MM is supported by the clinical effectiveness of CART cells and bispecific antibodies in MM. The failure of anti-PD1 therapy in MM encourages interest in researching other inhibitory checkpoints in MM, including LAG-3, TIM3, TIGIT, and BTLA [24]. These inhibitory proteins could be potential targets for immunotherapy in MM.
Recent attention has been focused on the LAG-3 molecule. While most studies are focused on the LAG-3 role in the microenvironment, less is known about LAG-3 expression on malignant PCs and its possible role in the progression of MM from MGUS and SMM [25,26]. A growing interest in LAG-3 was influenced by the recent discovery of a new subgroup of PCs in mice, called regulatory PCs, which express LAG-3 and secrete IL-10 [27,28,29]. These cells have not been studied in humans, and there is no data about their role in the pathogenesis of MM. Therefore, the aim of our study was to assess the possible role of LAG-3 expression on regulatory PCs in patients with plasma cell dyscrasia. We hypothesize that malignant PCs expressing LAG-3 are actively involved in the pathogenesis of MM progression from MGUS and SMM by impairing the function of effector immune cells.

2. Results

2.1. Demographic and Clinical Characteristics of Patients with Plasma Cell Dyscrasia

Eighty-one patients (44 males and 36 females) with a mean age of 70 ± 9 years were enrolled in this study. The patients were assigned by senior hematologists based on International Myeloma Working Group (IMWG) criteria to four subgroups: MGUS (n = 17), SMM (n = 20), active MM (n = 27), and RRMM (n = 5). Patients who were found to have normal bone marrow biopsies were defined as controls (n = 12).
Thirteen of the patients (19%) had high-risk FISH results (del(17p), t(4:14), and t(14:16)). A total of 34 of the patients (50%) had monoclonal IgG serum levels, 12 patients (17%) had monoclonal IgA serum levels, 3 patients (4%) had monoclonal IgM serum levels, and 12 patients (17%) had abnormal free light chain (FLC) levels.
In addition, 34 patients (49%) had immunoparesis (defined as a decrease in one or more of the uninvolved immunoglobulins below the normal range). (Table 1).

2.2. CD138+ Plasma Cell Characterization

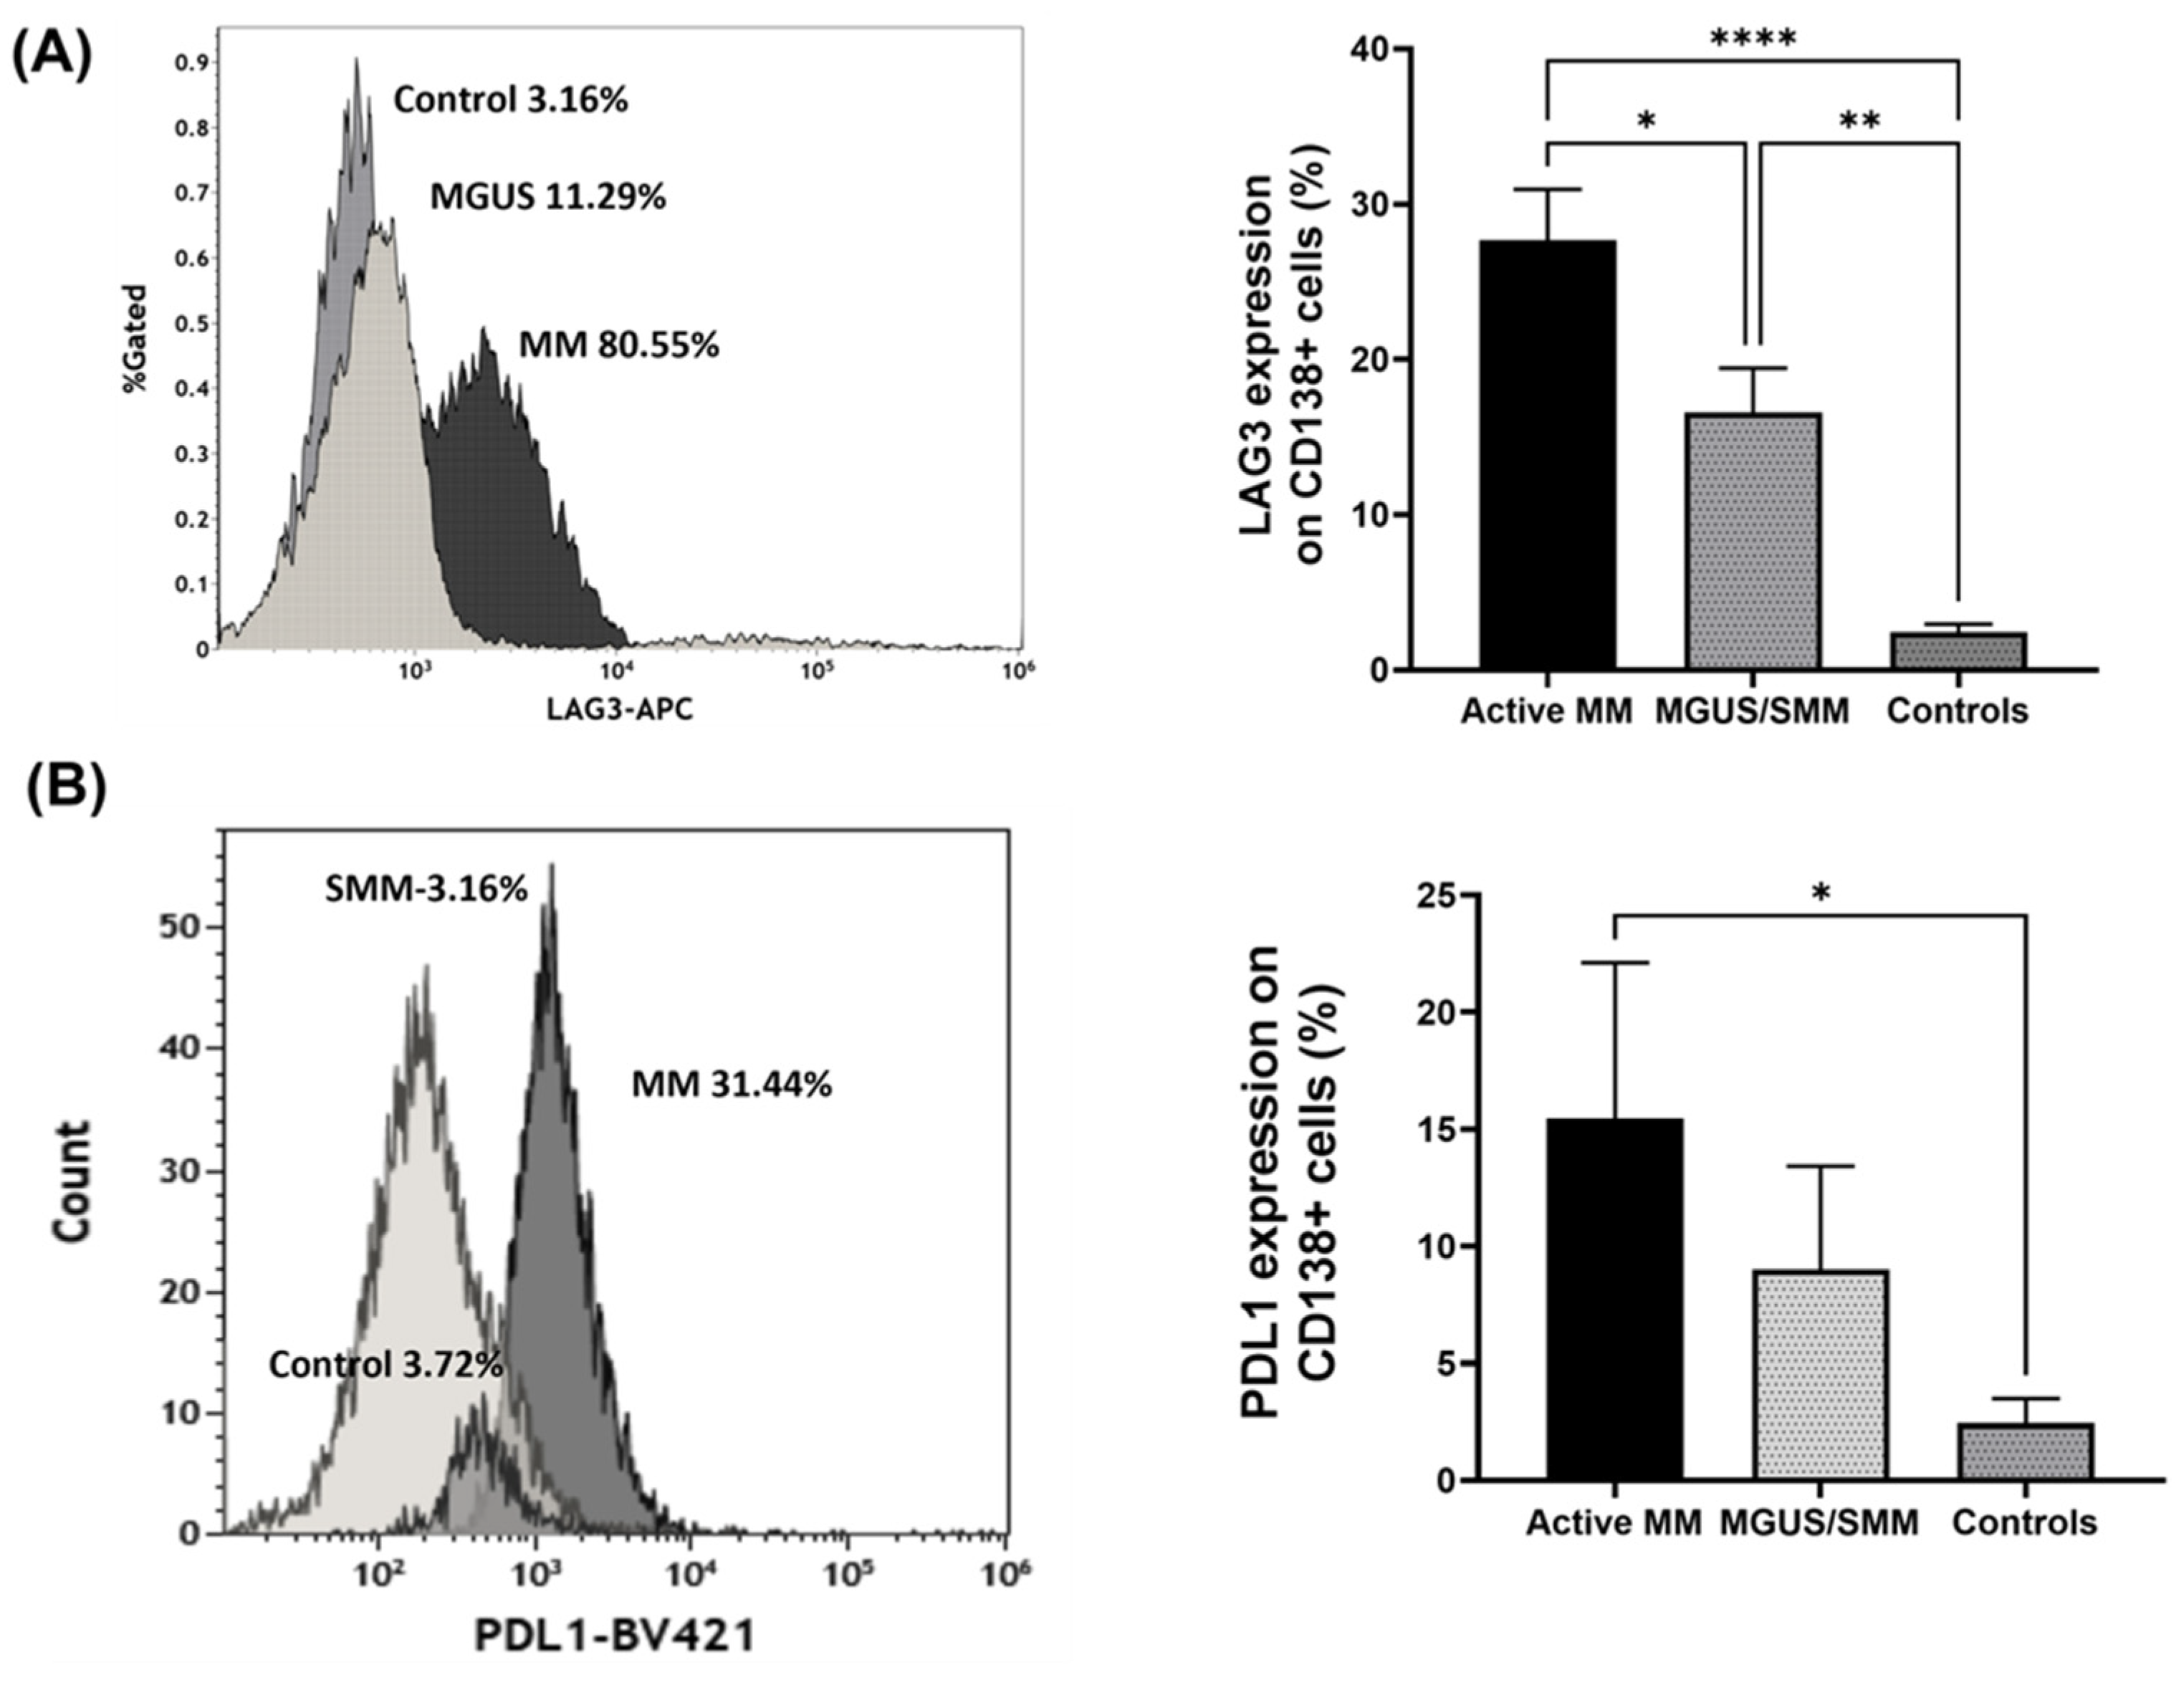
2.2.1. The Expression of Regulatory Receptors on CD138+ Plasma Cells

In order to characterize regulatory PCs in active MM patients and premalignant conditions (MGUS and SMM), the expression of LAG-3, PDL1, CD200, and PD1 receptors on purified PCs was assessed using flow cytometry.
The mean expression of LAG-3 in active MM patients was significantly higher compared to the control group (27.69 ± 3.27% vs. 2.441 ± 0.51%, mean ± SEM, p < 0.0001, respectively), and was also higher compared to premalignant conditions (16.58 ± 2.85%, mean ± SEM, p = 0.025), as shown in Figure 1A.
In addition, the mean expression of PDL1 in active MM patients was also significantly higher compared to the control group (15.46 ± 6.65% vs. 2.448 ± 1.05%, mean ± SEM, p = 0.33, respectively), as shown in Figure 1B.
The mean expression of PD1 and CD200 was not found to be significantly different among the study groups, as seen in Supplementary Figure S1.

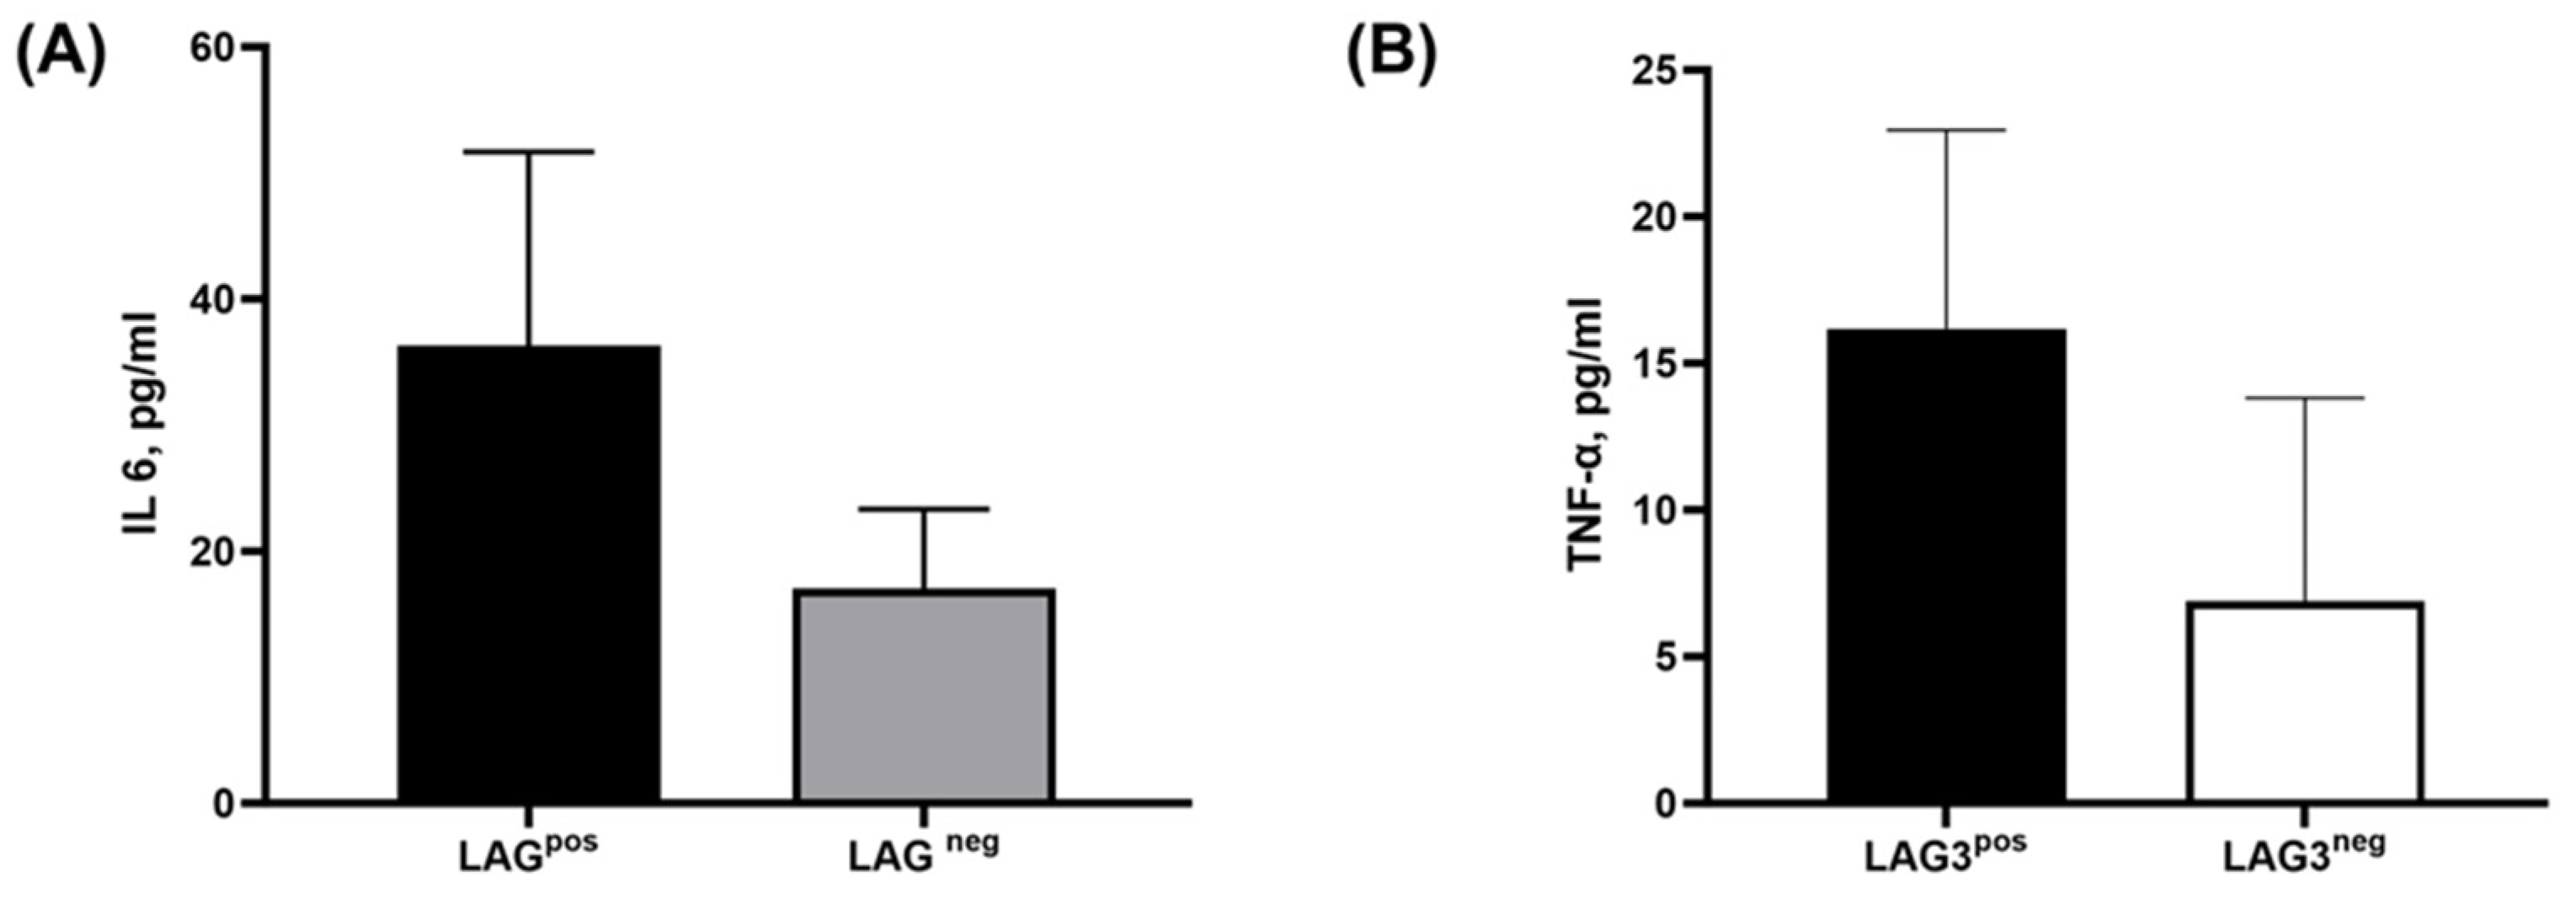
2.2.2. The Secretion of Tumor-Related Pro-Inflammatory Cytokines from CD138+ Plasma Cells

Pro-inflammatory cytokines IL-6 and TNF-α play essential roles in the pathogenesis of MM.
LAG-3pos PCs were purified and sorted, as described in Section 4. While using multiplex analysis of cytokines, following 24 h of incubation, we found that LAG-3pos PCs secreted higher levels of IL-6 compared to LAG-3neg PCs (36.29 ± 15.38 pg/mL vs. 17.01 ± 6.31 pg/mL, mean ± SEM, respectively), as seen in Figure 2A. Moreover, when we analyzed the secretion of TNF-α in these cells, we could also demonstrate an increased level of secretion in LAG-3pos PCs compared to LAG-3neg PCs (16.18 ± 6.77 pg/mL vs. 6.91 ± 6.91 pg/mL, mean ± SEM, respectively), as seen in Figure 2B.

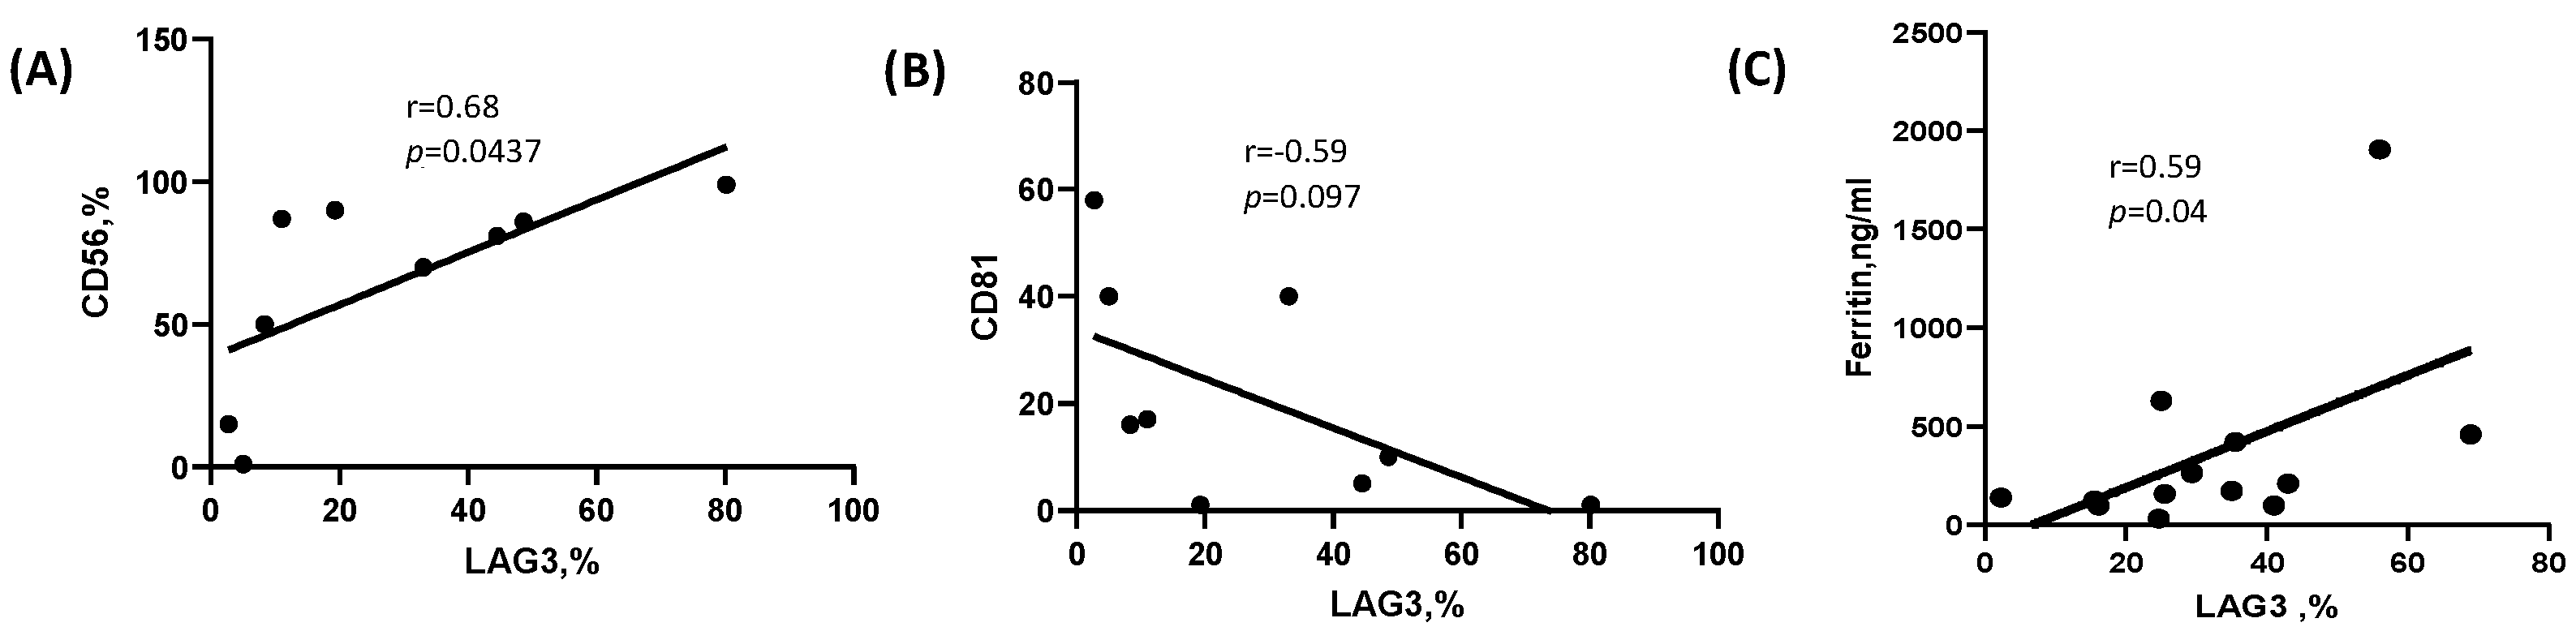
2.3. Correlation of LAG-3 Expression with Laboratory and Clinical Parameters

The expression of CD81 and CD56 on PCs using flow cytometry is considered routine immunophenotyping in the diagnosis and follow-up of patients with plasma cell dyscrasia.
These two markers were found to be correlated differently with LAG-3 expression on PCs from plasma cell dyscrasia patients. LAG-3 showed a positive correlation with CD56 (r = 0.680, p = 0.043) Figure 3A. However, CD81 only demonstrated a trend of negative correlation with LAG-3 (r = −0.59, p = 0.0973), as seen in Figure 3B.
Ferritin is a commonly used marker for iron storage assessment. In addition, ferritin is a marker of acute and chronic inflammation, which is associated with some cancers. High levels of ferritin have adverse prognostic significance in MM patients [30]. When we analyzed and correlated the serum ferritin level of patients with active MM, we found a positive correlation with LAG-3 expression (r = 0.59, p = 0.04): see Figure 3C.

2.4. The Biological Function of LAG-3pos Plasma Cells

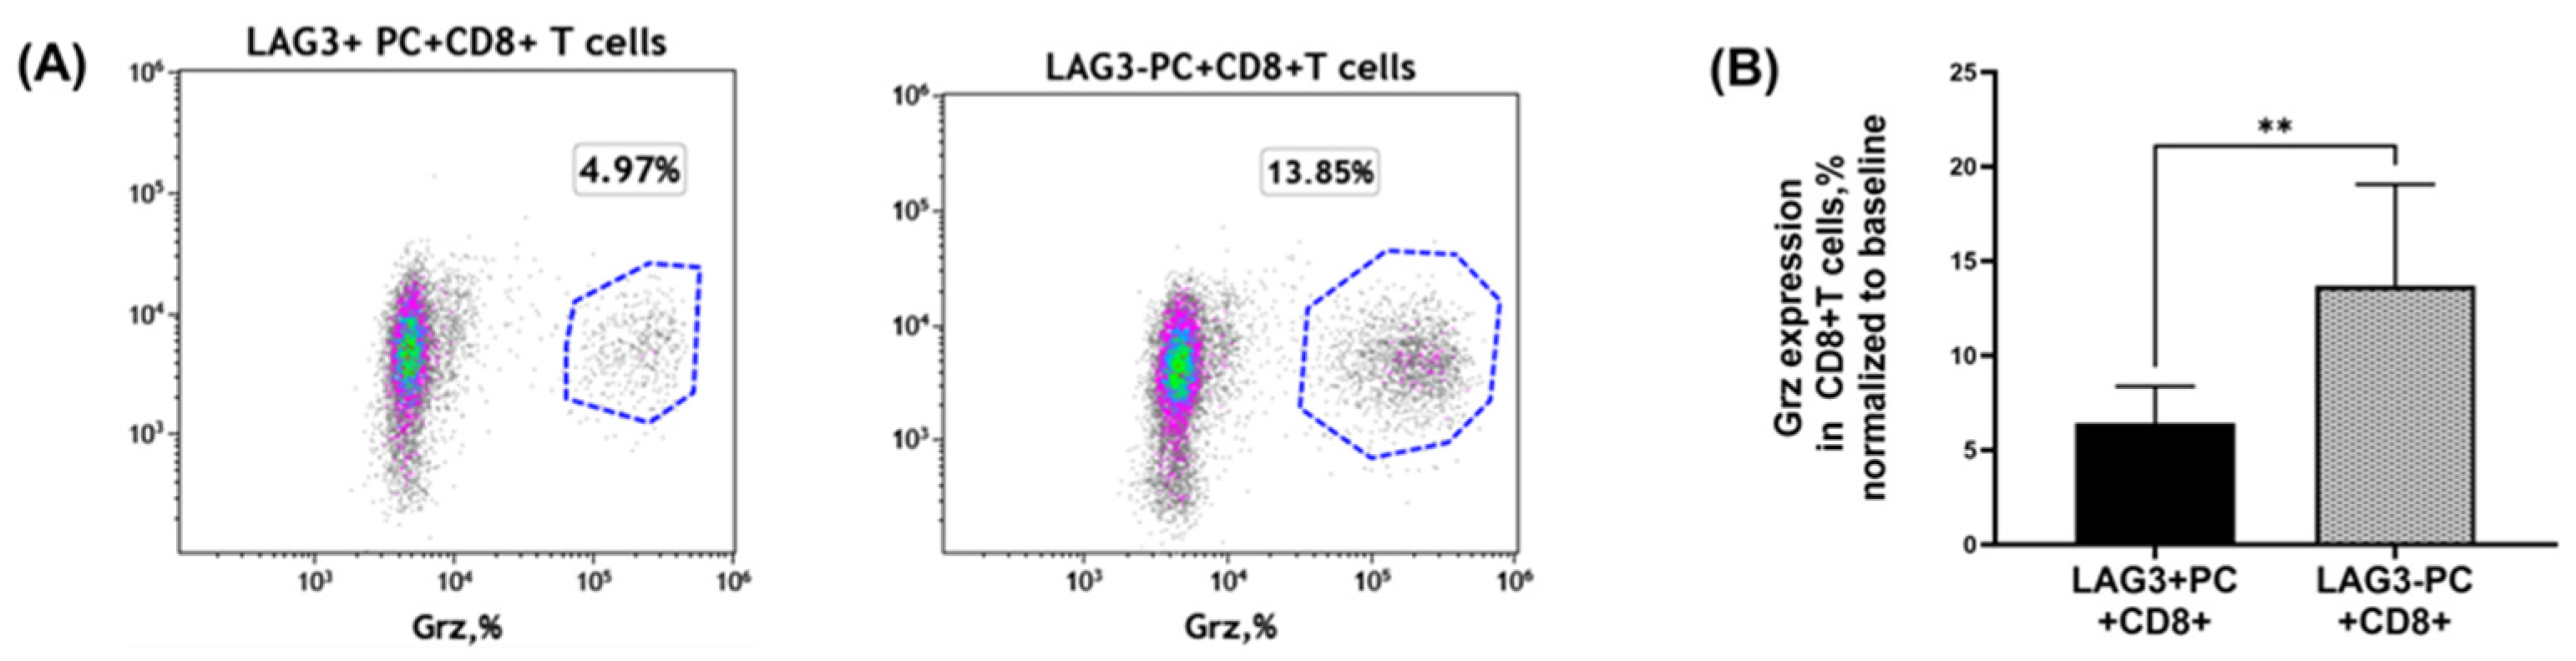
2.4.1. Granzyme Secretion from CD8+T Cells Co-Cultured with Plasma Cells

In order to examine the biological function and significance of LAG-3 expression, we assessed the cytotoxicity potential of autologous CD8+T cells following co-culture with PCs by measuring granzyme (Grz) expression; CD8+T cells co-cultured with LAG-3pos PCs showed a decrement in the expression of Grz compared to cells co-cultured with LAG-3neg PCs (13.68 ± 5.382% vs. 6.426 ± 1.953%, respectively, mean ± SEM, p = 0.0041). This result might point toward a reduction in CD8+T cell cytotoxicity potential as an effect of LAG-3pos PCs, as seen in Figure 4. Furthermore, in the sub-group analysis, this reduction in Grz expression on CD8+T cells was found to be more significant in patients with active MM.

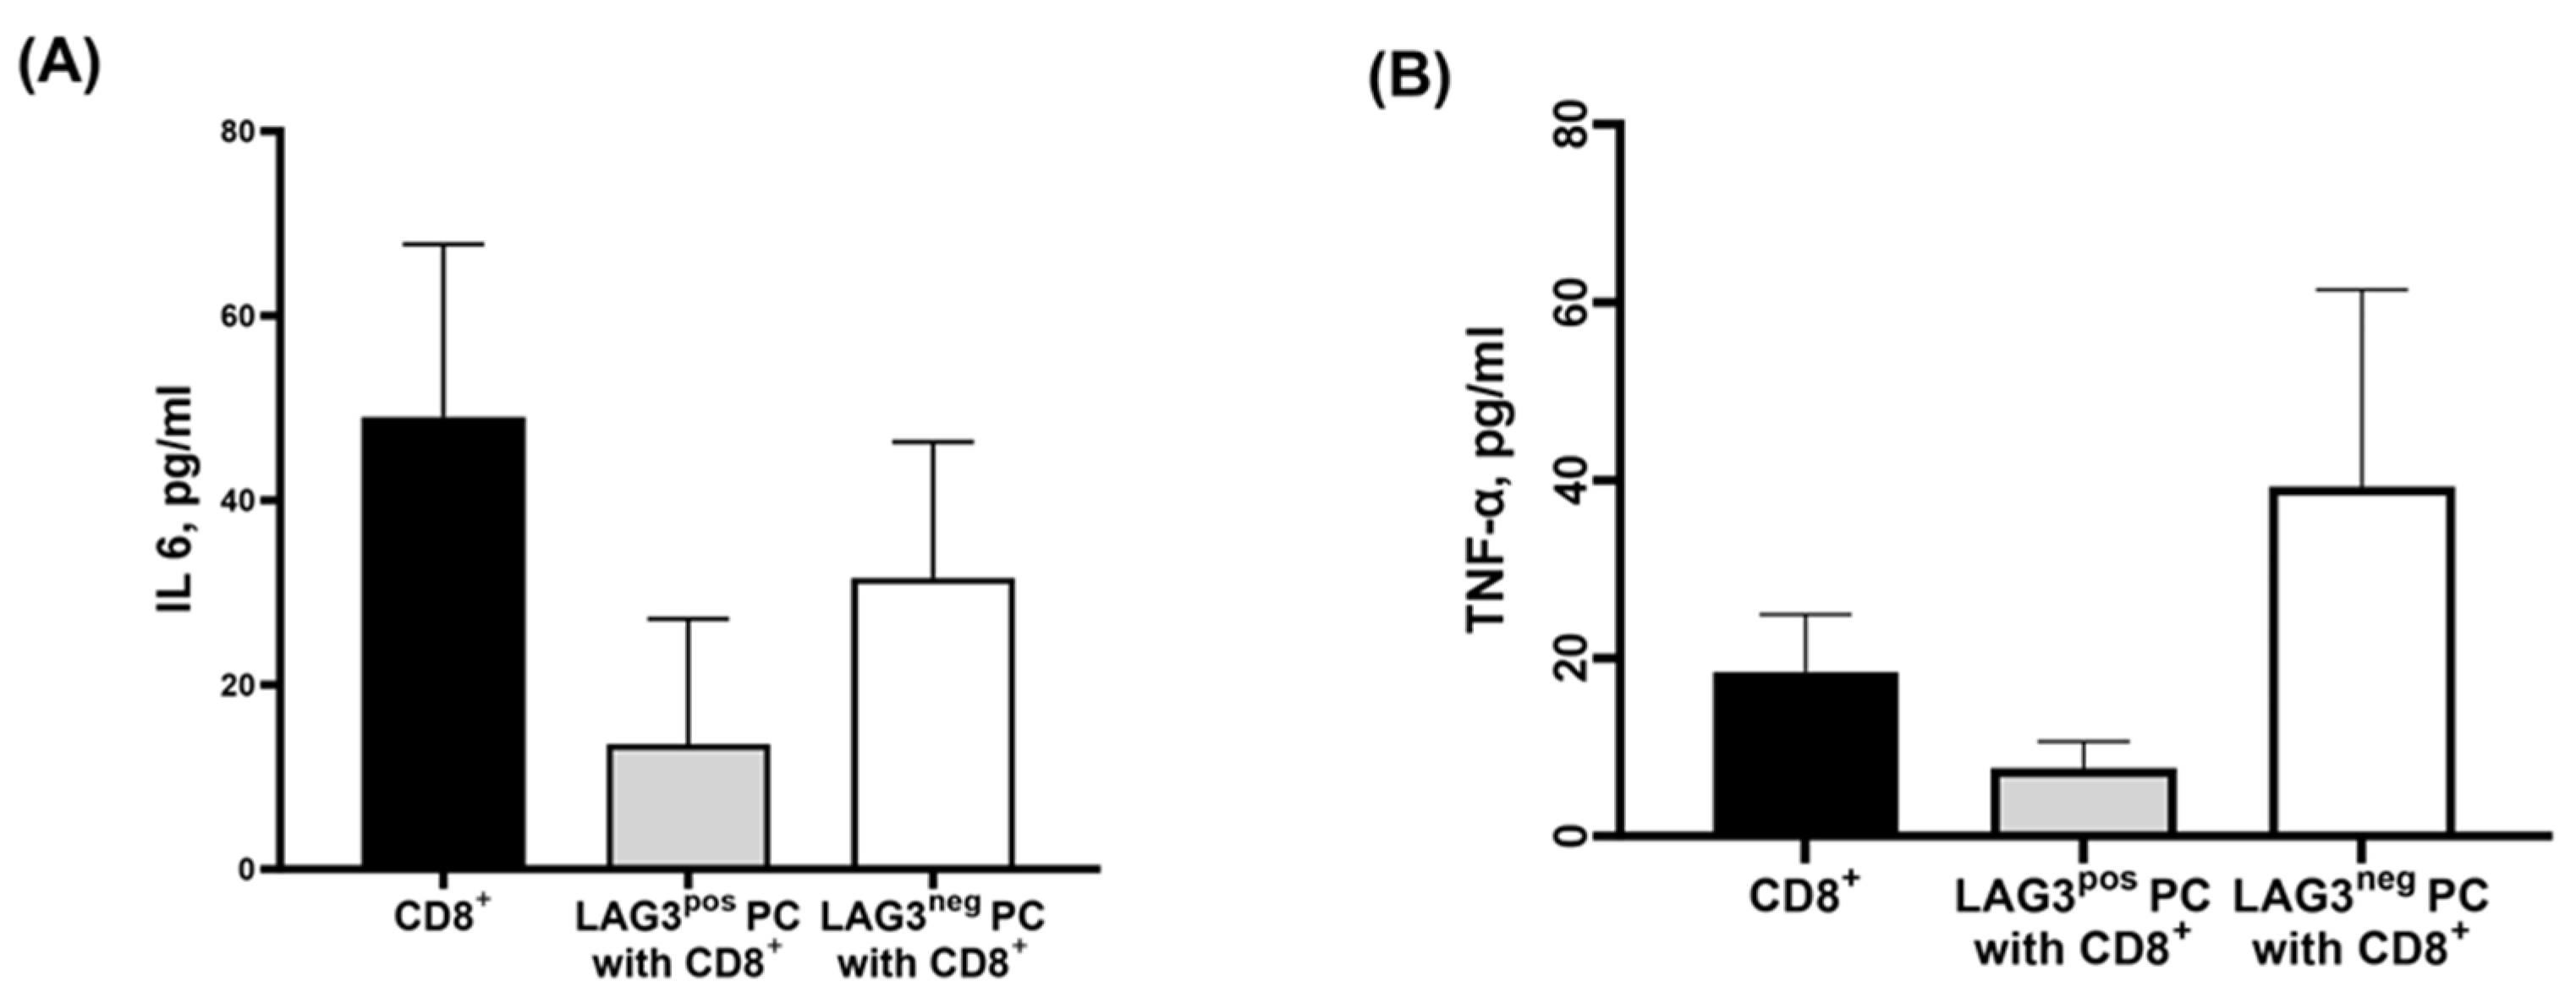
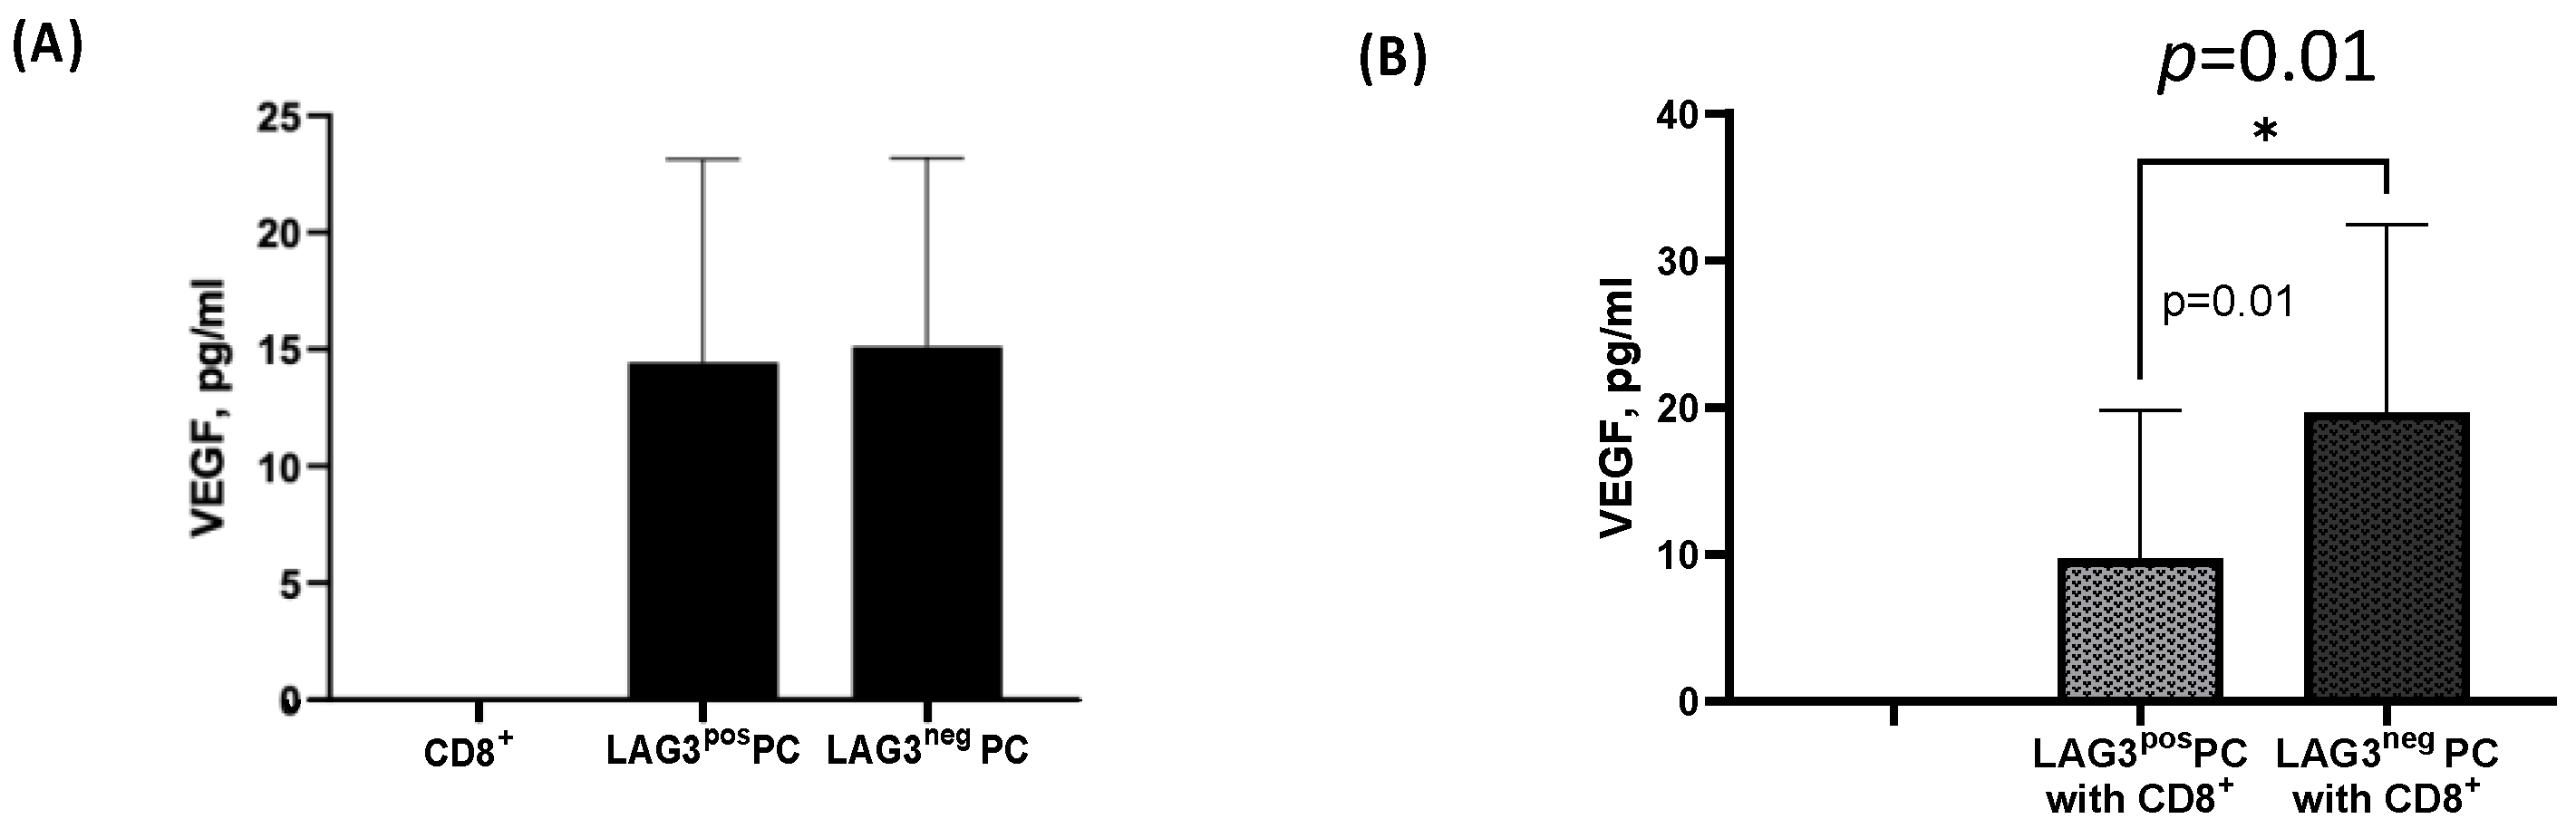
2.4.2. Cytokine Secretion Pattern of CD8+T Cells Cultured with Plasma Cells

In order to examine the secreted cytokines of CD8+T cells co-cultured with either LAG-3pos or LAG-3neg PCs, we analyzed the secretion of TNF-α and IL-6 from the supernatants. The reported cytokine levels reflect the combined activity of CD8+T and PCs since both cells secreted IL-6 and TNF-α differently.
We have found that CD8+T cells secrete high levels of IL-6 (49.04 ± 18.70 pg/mL mean ± SEM), and its secretion was reduced upon co-culturing with PCs. This reduction was more pronounced when CD8+T cells were co-cultured with LAG-3pos PCs compared to LAG-3neg PCs (13.58 ± 13.58 pg/mL vs. 31.56 ± 14.75 pg/mL, mean ± SEM, p = 0.09 respectively).
When we analyzed the secretion of TNF-α, another pro-inflammatory cytokine, we were able to demonstrate that CD8+T cells secrete a relatively high amount of TNF-α, and the addition of malignant LAG-3pos PCs cells reduced its secretion level (18.46 ± 6.45 pg/mL vs. 7.64 ± 2.96 pg/mL, p = 0.1, respectively), while the TNF-α levels were increased when CD8+T cells co-cultured with LAG-3neg PC, (39.24 ± 22.16 pg/mL): Figure 5.

2.4.3. CD8+T Cells Effect on Plasma Cells

VEGF is one of the angiogenic factors responsible for increasing the formation of new vessels in the bone marrow and stimulating the secretion of IL-6, which contributes significantly to the pathogenesis of MM [20]. Thus, we were interested in exploring the secretion pattern of this angiogenetic factor. The multiplex analysis results showed that CD8+T cells alone do not secrete VEGF, while it is secreted equally from both LAG-3pos and LAG-3neg PCs alone (14.45 ± 8.68 pg/mL vs. 15.12 ± 8.07 pg/mL, mean ± SEM, respectively), as seen in Figure 6A. Surprisingly, when we co-cultured CD8+T cells with LAG-3pos PCs, a reduction in the VEGF secretion level was shown, and the VEGF secretion level showed no effect following co-culture with LAG-3neg PCs (9.7 ± 3.567 pg/mL vs. 19.67 ± 4.524 pg/mL, mean ± SEM, p = 0.015), as seen in Figure 6B.

3. Discussion

B regulatory cells are front players in regulatory immune responses, the impaired function of which is followed by the failure to maintain self-tolerance and the development of autoimmunity [30]. In addition to their role in autoimmunity, they allow malignant cells to survive through their increased expansion and production of IL-10 and IL-35 inhibitory cytokines, which are suppressed by anti-tumor immune responses [31].The recent recognition of natural regulatory PCs, characterized by the increased expression of inhibitory receptors LAG-3, CD200, PD-L1, and PD-L2, revealed that they are significant source of B cell-derived IL-10, allowing for the suppression of anti-tumor immune responses and tumor cell spread [32].
LAG-3 protein is encoded by the LAG-3 gene located on human chromosome 12 [33] and is expressed on the membranes of B, NK, and dendritic cells [34]. LAG-3pos CD138+ regulatory PCs were shown to develop via antigen-specific mechanisms [32]. When stimulated via a Toll-like receptor-driven mechanism, they do not proliferate but they do increase their IL-10 expression and secretion [29]. Although it is poorly defined, the role of LAG-3 in hematological malignancies has been increasingly assessed. Therefore, LAG-3 was found to be expressed both on T and malignant B cells in diffuse large B cell lymphoma (DLBCL) and chronic lymphocytic leukemia (CLL), especially in Richter transformation (RT), and had a negative impact on progression-free survival (PFS) and overall survival (OS) in DLBC [35,36]. Increased micro-environmental cell LAG-3 expression in SMM contributed to the suppression of anti-tumor T-cell responses and the increased progression to symptomatic MM [26]. In the recent study by Jooeun Bae et al., treatment with anti-LAG-3 antibodies in vitro enhanced the anti-myeloma immune response by increasing the proliferation and functional capacity of cytotoxic T cells [25]. According to our knowledge, the current study is the first to show that LAG-3 expression is significantly increased on PCs obtained from the bone marrow of patients with symptomatic MM compared to MGUS/SMM and controls.
According to previous knowledge, PDL1 on plasma cells plays a role in the progression of MM from a premalignant state, and its high expression on plasma cells in active MM is associated with a poor prognosis [37]. For instance, Costa F et al. demonstrated higher expression of PDL1 in patients with MM than in healthy volunteers and MGUS, but not in SMM, proposing the possible benefit of therapeutic intervention by interrupting the PD1/PDL1 axis early at the MGUS stage [38]. Regarding its prognostic role in MM, PDL1 expression was associated with poor overall survival in active MM [8]. Our study showed a trend for higher PDL1 on PCs in active MM compared to MGUS/SMM, but this was not confirmed statistically. Regarding CD200, in the literature, this was steadily expressed on PCs in MM during the treatment process, making it a helpful follow-up marker [39]. In addition, it was found to have prognostic significance in MM patients [10,40].
Our finding of LAG-3 expression on malignant PCs strongly supports its possible role in predicting the progression of MGUS and SMM into symptomatic multiple myeloma. This conclusion is further supported by its positive correlation with CD56 in patients with PCD, and higher serum ferritin level in MM.
These results prompted us to explore the biological significance of LAG-3 expression on PCs in the development of MM. For this purpose, autologous CD8+T cells were co-cultured with LAG-3pos vs. LAG-3neg PCs purified from patients with MGUS, SMM, or active MM, and analyzed for Grz and Per expression. The supernatants of the co-cultures were evaluated for pro- and anti-inflammatory cytokines. The hypothesis was that LAG-3 on PCs suppresses the function of cytotoxic CD8+T cells by decreasing their expression of Grz, Per, and the secretion of pro-inflammatory cytokines. Cytotoxic CD8+T cells are important for immunosurveillance in cancer and in MM [41,42]. This statement is strongly supported by the clinical effectiveness of immunotherapy, designed to enhance the function of cytotoxic T cells either by blocking the checkpoint receptors on these cells or by constructing a chimeric antigen receptor T cell (CAR T) [43]. Cytotoxic T cell exhaustion and senescence were previously described in MM patients, especially at the tumor site [44], but the exact mechanism of CD8+T cell decline is not known. Our results from the experiment with co-cultures revealed that LAG-3 on PCs decreased the Grz expression in CD8+T cells in the entire study population, including patients with MGUS, SMM, and active MM. In the subgroup analysis, the decrease in Grz achieved statistical significance in patients with MM, but a clear tendency was also found in MGUS and SMM. This could be explained by the higher expression of LAG-3 on PCs in patients with active MM, caused by the effect of amplification. Next, we measured pro- and anti-inflammatory cytokines in the supernatants of CD138+LAG-3pos, CD138+LAG-3neg, CD8+T cells and co-cultures of CD8+T cells with LAG-3pos or LAG-3neg PCs.
The secretion of pro-inflammatory cytokines, such as TNF-α and IL-6, was higher in supernatants of LAG-3pos PCs, but in co-cultures, the results were contradictory. The results did not achieve statistical significance, probably due to the small sample size, but there was a clear trend. According to previous knowledge of MM, the secretion of TNF-α and IL-6 stimulates the survival of malignant PCs [14,45]. We cannot know precisely what happens during the interaction between T and PCs in co-cultures, but based on our findings, we can assume that analogous to the expression of Grz in our previous experiment, LAG-3 decreases the secretion of TNF-α and IL-6 by CD8+ CTLs. The limitation of the co-culture studies is that they do not represent the entire bone marrow microenvironment. We can conclude that LAG-3pos PCs possibly have a survival advantage over LAG-3neg PCs by secreting more TNF-α, but also have an immunosuppressive effect on CD8+ CTLs, by decreasing the secretion of the same cytokines from CD8+ CTLs.
In our study, there was a significant decrease in VEGF secretion in co-cultures of LAG-3pos PCs with CD8+ CTLs in patients with PCD. In MM, VEGF increases the formation of new vessels in the bone marrow and stimulates the secretion of IL-6, contributing significantly to the pathogenesis of the disease [20]. In addition, there is increasing evidence that VEGF plays different roles in immunology, both pro- and anti-inflammatory, but was shown to have primarily immunosuppressive effects in cancer [46,47]. Regarding the fact that VEGF was shown to have primarily immunosuppressive effects in cancer, we hypothesized that VEGF secretion would increase in co-cultures with LAG-3pos PCs. However, the opposite results occurred: there was a significant decrease in VEGF secretion in co-cultures of LAG-3pos PCs with CD8+ CTLs in patients with PCD. We are still unable to explain this phenomenon; however, one possibility is that more VEGF was bound to its receptor on CTLs in co-cultures with LAG-3pos PCs than with LAG-3 PCs. More studies are warranted in order to better clarify this phenomenon. This study is the first to describe the significance of the expression of LAG3 on plasma cells in the evolution of MM. The limitation of the study is its relatively small cohort. Future studies are needed in order to establish these important findings.

4. Materials and Methods

4.1. Patients

Bone marrow aspirates and peripheral blood samples were obtained from patients from three medical centers in Israel—Bnai Zion, Kaplan, and Galilee Medical. All participants signed the informed consent form, and each hospital’s ethics committee approved the study. The study was conducted in accordance with the Declaration of Helsinki, and approved by the Institutional Review Board of Bnai Zion medical center (0015-19-BNZ, date: 4 February 2019).
The study participants were assessed by senior hematologists and, based on the International Myeloma Working Group (IMWG) criteria, assigned to four subgroups: MGUS, SMM, active MM, and RRMM. Patients in whom bone marrow aspirates and biopsies were found normal were defined as controls.
Laboratory and clinical data were collected from the electronic data system (data shown in Table 1). These include FLC level; monoclonal immunoglobulin serum level; β2-microglobulin level; mcg/L; MM stages according to R-ISS criteria; C reactive protein (CRP); ferritin; FISH; and flow-cytometry results (CD20, CD19, CD81, CD56, CD38).

4.2. Cell Isolation

A total of 8 ml of fresh bone marrow aspirates (BMA) and 40 mL of fresh peripheral blood (PB) were drawn to heparin-washed tubes. BMA or PB were loaded on Lymphoprep (07851, STEMCELL Technology, Vancouver, BC, Canada) and centrifuged at 800× g at room temperature continuously for 35 min. After centrifugation, the BM mononuclear cells (BMMCs) were collected, and PCs were purified using anti-human CD138 magnetic microbeads (#130-051-301, MACS Miltenyi Biotec, Bergisch Gladbach, Germany). In addition, CD8+T cells were isolated from PB mononuclear cells (PBMCs) using anti-human CD8 magnetic beads (#130-045-201, MACS Miltenyi Biotec, Bergisch Gladbach, Germany) according to the manufacturer’s instructions.

4.3. Flow Cytometry

Cells were stained with specific monoclonal antibodies against extracellular markers for 30 min at room temperature, followed by a wash. For intracellular staining, the procedure was conducted using FIX and PERM kit (GAS004, Invitrogen, Waltham, MA, USA) according to the manufacturer’s instructions. The acquirement was performed using the Navios EX Flow Cytometer (Beckman Coulter, Inc., Brea, CA, USA), and the results were analyzed using Kaluza Analysis Flow Cytometry Software 2.1 and FlowJov10.8.1CL.

4.4. Flow Cytometry Antibodies

Flow cytometry antibodies were as follows: Anti-LAG-3-APC (369212, BioLegend, San Diego, CA, USA); anti-PDL1-BV421 (563738, BD Biosciences, Franklin Lakes, NJ, USA); anti-CD200-PE (B68126, Beckman Coulter, Inc., Brea, CA, USA); anti-PD1-PE-Cy7 (329918, BioLegend, San Diego, CA, USA); anti-CD138-PE-CY5 antibody (2109134, Beckman Coulter, Inc., Brea, CA, USA); anti-CD8-PC7 (6607102, Beckman Coulter, Inc., Brea, CA, USA); anti-granzyme B REAfinity™ FITC (130-118-341, Miltenyi Biotec, Bergisch Gladbach, Germany); and anti-Perforin-AF647 (563576, BD Biosciences, Franklin Lakes, NJ, USA).

4.5. Sorting of Plasma Cells

Purified PCs were resuspended at the concentration of 1 × 10⁶ cells per 200 µL PBSX1 and stained with anti-LAG-3 antibody. CD138+ LAG-3pos or LAG-3neg were sorted with a 100-micron nozzle size, and collected into tubes prefilled with RPMI 1640 medium enriched with 20% FCS (10270106, GibcoTM, Thermo Fisher Scientific, Waltham, MA, USA) and 20% Pyruvate (03-042, Biological Industries, Beit-haEmek, Israel). The sorting was done using the BD FACSMelody instrument and BD FACSChorus™ software version 9 (BD Biosciences, Franklin Lakes, NJ, USA). The cells were incubated overnight for recovery.

4.6. Co-Culturing of CD138+ Plasma Cells with Autologous CD8+T Cells

Autologous CD8+T cells were cultured alone, or with sorted LAG-3pos or LAG-PCs in the concentration of 2:3 and incubated at 37 °C for 24 h.

4.7. Luminex Performance Assay

Supernatants of cultured cells were assessed for IFN-γ; IL-10; IL-17/Il-17A; TNF-α; IL-6; IL-12p70; PD-L1/B7-H1; and VEGF (FCSTM18-08, R&D Systems, Minneapolis, MN, USA), using the Bio-Plex MAGPIX multiplex reader according to the manual’s instructions.

4.8. Statistical Analysis

The descriptive statistic was calculated, and a comparison among groups was performed using the Wilcoxon test (for two groups) or the Kruskal–Wallis test, followed by Dunn’s multiple comparisons test (for three groups). The correlations between different clinical and laboratory parameters were identified using the Pearson analysis for multiple correlations and Spearman analysis. The following designations were used in the figures: *: p < 0.05, **: p < 0.01, ***: p < 0.001, ****: p < 0.0001 and non-specific: ns. The calculations were made utilizing GraphPad Prism software, version 9.

5. Conclusions

LAG-3 expression on malignant plasma cells (PCs) may be involved in the development of MM from MGUS and SMM by decreasing the functional capacity of cytotoxic T cells.

Supplementary Materials

The supporting information can be downloaded at: https://www.mdpi.com/article/10.3390/ijms25010549/s1.

Author Contributions

Conceptualization: Z.V., N.E., N.K. and E.T.; methodology: Z.V., N.E., N.K. and E.T.; validation: Z.V., N.E., N.K. and E.T.; formal analysis: Z.V., N.E., N.K., E.T. and T.T.; investigation: Z.V., N.E., N.K. and E.T.; Resources and data curation: N.K., T.T., I.L.Y., S.M.G., A.S., R.M., C.S. and E.V.; writing—original draft preparation: Z.V., N.E., N.K. and E.T.; writing—review and editing: Z.V., N.E., N.K., E.T. and T.T.; visualization: Z.V., N.E., N.K. and E.T.; supervision: Z.V. All authors have read and agreed to the published version of the manuscript.

Funding

This research received no external funding.

Institutional Review Board Statement

The study was conducted in accordance with the Declaration of Helsinki, and approved by the Institutional Review Board of Bnai Zion medical center (0015-19-BNZ, date: 4 February 2019).

Informed Consent Statement

Informed consent was obtained from all subjects involved in the study.

Data Availability Statement

The data presented in this study are available on request from the corresponding author.

Conflicts of Interest

The authors declare no conflicts of interest.

References

  1. Kumar, S.K.; Rajkumar, V.; Kyle, R.A.; van Duin, M.; Sonneveld, P.; Mateos, M.-V.; Gay, F.; Anderson, K.C. Multiple myeloma. Nat. Rev. Dis. Primers 2017, 3, 17046. [Google Scholar] [CrossRef] [PubMed]
  2. Rajkumar, S.V. Multiple myeloma: 2020 update on diagnosis, risk-stratification and management. Am. J. Hematol. 2020, 95, 548–567. [Google Scholar] [CrossRef] [PubMed]
  3. Dispenzieri, A.; Kyle, R.A.; Katzmann, J.A.; Therneau, T.M.; Larson, D.; Benson, J.; Clark, R.J.; Melton, L.J., III; Gertz, M.A.; Kumar, S.K. Immunoglobulin free light chain ratio is an independent risk factor for progression of smoldering (asymptomatic) multiple myeloma. Blood J. Am. Soc. Hematol. 2008, 111, 785–789. [Google Scholar] [CrossRef] [PubMed]
  4. Pérez-Persona, E.; Vidriales, M.-B.; Mateo, G.; García-Sanz, R.; Mateos, M.-V.; de Coca, A.G.; Galende, J.; Martín-Nuñez, G.; Alonso, J.M.; de Las Heras, N. New criteria to identify risk of progression in monoclonal gammopathy of uncertain significance and smoldering multiple myeloma based on multiparameter flow cytometry analysis of bone marrow plasma cells. Blood J. Am. Soc. Hematol. 2007, 110, 2586–2592. [Google Scholar] [CrossRef]
  5. Gertz, M. Smoldering multiple myeloma: Reviewing the rationale for intervention. Leuk. Lymphoma 2022, 63, 2033–2040. [Google Scholar] [CrossRef]
  6. Palumbo, A.; Avet-Loiseau, H.; Oliva, S.; Lokhorst, H.M.; Goldschmidt, H.; Rosinol, L.; Richardson, P.; Caltagirone, S.; Lahuerta, J.J.; Facon, T. Revised international staging system for multiple myeloma: A report from International Myeloma Working Group. J. Clin. Oncol. 2015, 33, 2863. [Google Scholar] [CrossRef]
  7. D’agostino, M.; Cairns, D.A.; Lahuerta, J.J.; Wester, R.; Bertsch, U.; Waage, A.; Zamagni, E.; Mateos, M.-V.; Dall’Olio, D.; van de Donk, N.W. Second Revision of the International Staging System (R2-ISS) for Overall Survival in Multiple Myeloma: A European Myeloma Network (EMN) Report Within the HARMONY Project. J. Clin. Oncol. 2022, 40, 3406–3418. [Google Scholar] [CrossRef]
  8. Lee, B.-H.; Park, Y.; Kim, J.H.; Kang, K.-W.; Lee, S.J.; Kim, S.J.; Kim, B.S. PD-L1 expression in bone marrow plasma cells as a biomarker to predict multiple myeloma prognosis: Developing a nomogram-based prognostic model. Sci. Rep. 2020, 10, 12641. [Google Scholar] [CrossRef]
  9. Tremblay-LeMay, R.; Rastgoo, N.; Chang, H. Modulating PD-L1 expression in multiple myeloma: An alternative strategy to target the PD-1/PD-L1 pathway. J. Hematol. Oncol. 2018, 11, 46. [Google Scholar] [CrossRef]
  10. Moreaux, J.; Hose, D.; Rème, T.; Jourdan, E.; Hundemer, M.; Legouffe, E.; Moine, P.; Bourin, P.; Moos, M.; Corre, J. CD200 is a new prognostic factor in multiple myeloma. Blood 2006, 108, 4194–4197. [Google Scholar] [CrossRef]
  11. Ramasamy, K.; Gay, F.; Weisel, K.; Zweegman, S.; Mateos, M.V.; Richardson, P. Improving outcomes for patients with relapsed multiple myeloma: Challenges and considerations of current and emerging treatment options. Blood Rev. 2021, 49, 100808. [Google Scholar] [CrossRef] [PubMed]
  12. Ghandili, S.; Weisel, K.C.; Bokemeyer, C.; Leypoldt, L.B. Current treatment approaches to newly diagnosed multiple myeloma. Oncol. Res. Treat. 2021, 44, 690–699. [Google Scholar] [CrossRef]
  13. Sharma, P.; Kanapuru, B.; George, B.; Lin, X.; Xu, Z.; Bryan, W.W.; Pazdur, R.; Theoret, M.R. FDA Approval Summary: Idecabtagene Vicleucel for Relapsed or Refractory Multiple Myeloma. Clin. Cancer Res. 2022, 28, 1759–1764. [Google Scholar] [CrossRef] [PubMed]
  14. Gadó, K.; Domján, G.; Hegyesi, H.; Falus, A. Role of interleukin-6 in the pathogenesis of multiple myeloma. Cell Biol. Int. 2000, 24, 195–209. [Google Scholar] [CrossRef] [PubMed]
  15. Harmer, D.; Falank, C.; Reagan, M.R. Interleukin-6 interweaves the bone marrow microenvironment, bone loss, and multiple myeloma. Front. Endocrinol. 2019, 9, 788. [Google Scholar] [CrossRef] [PubMed]
  16. Matthes, T.; Manfroi, B.; Huard, B. Revisiting IL-6 antagonism in multiple myeloma. Crit. Rev. Oncol. Hematol. 2016, 105, 1–4. [Google Scholar] [CrossRef] [PubMed]
  17. Jourdan, M.; Tarte, K.; Legouffe, E.; Brochier, J.; Rossi, J.-F.; Klein, B. Tumor necrosis factor is a survival and proliferation factor for human myeloma cells. Eur. Cytokine Netw. 1999, 10, 65. [Google Scholar]
  18. Nachbaur, D.; Herold, M.; Maneschg, A.; Huber, H. Serum levels of interleukin-6 in multiple myeloma and other hematological disorders: Correlation with disease activity and other prognostic parameters. Ann. Hematol. 1991, 62, 54–58. [Google Scholar] [CrossRef]
  19. Jurišić, V.; Čolović, M. Correlation of sera TNF-α with percentage of bone marrow plasma cells, LDH, β2-microglobulin, and clinical stage in multiple myeloma. Med. Oncol. 2002, 19, 133–139. [Google Scholar] [CrossRef]
  20. Kumar, S.; Witzig, T.; Timm, M.; Haug, J.; Wellik, L.; Fonseca, R.; Greipp, P.; Rajkumar, S. Expression of VEGF and its receptors by myeloma cells. Leukemia 2003, 17, 2025–2031. [Google Scholar] [CrossRef]
  21. Ria, R.; Melaccio, A.; Racanelli, V.; Vacca, A. Anti-VEGF drugs in the treatment of multiple myeloma patients. J. Clin. Med. 2020, 9, 1765. [Google Scholar] [CrossRef] [PubMed]
  22. Palumbo, A.; Mateos, M.-V.; San Miguel, J.; Shah, J.; Thompson, S.; Marinello, P.; Jagannath, S. Pembrolizumab in combination with lenalidomide and low-dose dexamethasone in newly diagnosed and treatment-naive multiple myeloma (MM): Randomized, phase 3 KEYNOTE-185 study. Ann. Oncol. 2016, 27, vi324. [Google Scholar] [CrossRef]
  23. Mateos, M.-V.; Blacklock, H.; Schjesvold, F.; Oriol, A.; Simpson, D.; George, A.; Goldschmidt, H.; Larocca, A.; Chanan-Khan, A.; Sherbenou, D. Pembrolizumab plus pomalidomide and dexamethasone for patients with relapsed or refractory multiple myeloma (KEYNOTE-183): A randomised, open-label, phase 3 trial. Lancet Haematol. 2019, 6, e459–e469. [Google Scholar] [CrossRef] [PubMed]
  24. He, X.; Xu, C. Immune checkpoint signaling and cancer immunotherapy. Cell Res. 2020, 30, 660–669. [Google Scholar] [CrossRef] [PubMed]
  25. Bae, J.; Accardi, F.; Hideshima, T.; Tai, Y.-T.; Prabhala, R.; Shambley, A.; Wen, K.; Rowell, S.; Richardson, P.G.; Munshi, N.C. Targeting LAG3/GAL-3 to overcome immunosuppression and enhance anti-tumor immune responses in multiple myeloma. Leukemia 2022, 36, 138–154. [Google Scholar] [CrossRef] [PubMed]
  26. Mussetti, A.; Pellegrinelli, A.; Cieri, N.; Garzone, G.; Dominoni, F.; Cabras, A.; Montefusco, V. PD-L1, LAG3, and HLA-DR are increasingly expressed during smoldering myeloma progression. Ann. Hematol. 2019, 98, 1713–1720. [Google Scholar] [CrossRef] [PubMed]
  27. Lui, Y.; Davis, S.J. LAG-3: A very singular immune checkpoint. Nat. Immunol. 2018, 19, 1278–1279. [Google Scholar] [CrossRef] [PubMed]
  28. Fillatreau, S. Regulatory functions of B cells and regulatory plasma cells. Biomed. J. 2019, 42, 233–242. [Google Scholar] [CrossRef]
  29. Lino, A.C.; Lampropoulou, V.; Welle, A.; Joedicke, J.; Pohar, J.; Simon, Q.; Thalmensi, J.; Baures, A.; Flühler, V.; Sakwa, I. LAG-3 inhibitory receptor expression identifies immunosuppressive natural regulatory plasma cells. Immunity 2018, 49, 120–133.e129. [Google Scholar] [CrossRef]
  30. Yang, M.; Rui, K.; Wang, S.; Lu, L. Regulatory B cells in autoimmune diseases. Cell. Mol. Immunol. 2013, 10, 122–132. [Google Scholar] [CrossRef]
  31. He, Y.; Qian, H.; Liu, Y.; Duan, L.; Li, Y.; Shi, G. The roles of regulatory B cells in cancer. J. Immunol. Res. 2014, 2014, 215471. [Google Scholar] [CrossRef] [PubMed]
  32. Fillatreau, S. Natural regulatory plasma cells. Curr. Opin. Immunol. 2018, 55, 62–66. [Google Scholar] [CrossRef] [PubMed]
  33. Triebel, F. A novel lymphocyte activation gene closely related to CD4. J. Exp. Med. 1996, 171, 12. [Google Scholar] [CrossRef] [PubMed]
  34. He, Y.; Rivard, C.J.; Rozeboom, L.; Yu, H.; Ellison, K.; Kowalewski, A.; Zhou, C.; Hirsch, F.R. Lymphocyte-activation gene-3, an important immune checkpoint in cancer. Cancer Sci. 2016, 107, 1193–1197. [Google Scholar] [CrossRef] [PubMed]
  35. Keane, C.; Law, S.C.; Gould, C.; Birch, S.; Sabdia, M.B.; Merida de Long, L.; Thillaiyampalam, G.; Abro, E.; Tobin, J.W.; Tan, X. LAG3: A novel immune checkpoint expressed by multiple lymphocyte subsets in diffuse large B-cell lymphoma. Blood Adv. 2020, 4, 1367–1377. [Google Scholar] [CrossRef] [PubMed]
  36. Gould, C.; Lickiss, J.; Kankanige, Y.; Yerneni, S.; Lade, S.; Gandhi, M.K.; Chin, C.; Yannakou, C.K.; Villa, D.; Slack, G.W. Characterisation of immune checkpoints in Richter syndrome identifies LAG3 as a potential therapeutic target. Br. J. Haematol. 2021, 195, 113–118. [Google Scholar] [CrossRef] [PubMed]
  37. Bębnowska, D.; Hrynkiewicz, R.; Grywalska, E.; Pasiarski, M.; Sosnowska-Pasiarska, B.; Smarz-Widelska, I.; Góźdź, S.; Roliński, J.; Niedźwiedzka-Rystwej, P. Immunological prognostic factors in multiple myeloma. Int. J. Mol. Sci. 2021, 22, 3587. [Google Scholar] [CrossRef] [PubMed]
  38. Costa, F.; Vescovini, R.; Marchica, V.; Storti, P.; Notarfranchi, L.; Dalla Palma, B.; Toscani, D.; Burroughs-Garcia, J.; Catarozzo, M.T.; Sammarelli, G. PD-L1/PD-1 pattern of expression within the bone marrow immune microenvironment in smoldering myeloma and active multiple myeloma patients. Front. Immunol. 2021, 11, 613007. [Google Scholar] [CrossRef]
  39. Douds, J.J.; Long, D.J.; Kim, A.S.; Li, S. Diagnostic and prognostic significance of CD200 expression and its stability in plasma cell myeloma. J. Clin. Pathol. 2014, 67, 792–796. [Google Scholar] [CrossRef]
  40. Shi, Q.; Wu, C.; Han, W.; Zhao, S.; Wu, Y.; Jin, Y.; Qu, X.; Li, J.; Zhang, R.; Chen, L. Clinical significance of CD200 expression in newly diagnosed multiple myeloma patients and dynamic changing during treatment. Leuk. Lymphoma 2021, 62, 709–715. [Google Scholar] [CrossRef]
  41. Sze, D.M.; Brown, R.D.; Yuen, E.; Gibson, J.; Ho, J.; Raitakari, M.; Basten, A.; Joshua, D.E.; Fazekas de St Groth, B. Clonal cytotoxic T cells in myeloma. Leuk. Lymphoma 2003, 44, 1667–1674. [Google Scholar] [CrossRef] [PubMed]
  42. Crispin, J.C.; Tsokos, G.C. Cancer immunosurveillance by CD8 T cells. F1000Research 2020, 9. [Google Scholar] [CrossRef] [PubMed]
  43. Van der Leun, A.M.; Thommen, D.S.; Schumacher, T.N. CD8+ T cell states in human cancer: Insights from single-cell analysis. Nat. Rev. Cancer 2020, 20, 218–232. [Google Scholar] [CrossRef] [PubMed]
  44. Zelle-Rieser, C.; Thangavadivel, S.; Biedermann, R.; Brunner, A.; Stoitzner, P.; Willenbacher, E.; Greil, R.; Jöhrer, K. T cells in multiple myeloma display features of exhaustion and senescence at the tumor site. J. Hematol. Oncol. 2016, 9, 116. [Google Scholar] [CrossRef]
  45. Tian, T.; Wang, M.; Ma, D. TNF-α, a good or bad factor in hematological diseases? Stem Cell Investig. 2014, 1, 12. [Google Scholar]
  46. Reinders, M.E.; Sho, M.; Izawa, A.; Wang, P.; Mukhopadhyay, D.; Koss, K.E.; Geehan, C.S.; Luster, A.D.; Sayegh, M.H.; Briscoe, D.M. Proinflammatory functions of vascular endothelial growth factor in alloimmunity. J. Clin. Investig. 2003, 112, 1655–1665. [Google Scholar] [CrossRef]
  47. Basu, A.; Hoerning, A.; Datta, D.; Edelbauer, M.; Stack, M.P.; Calzadilla, K.; Pal, S.; Briscoe, D.M. Cutting edge: Vascular endothelial growth factor-mediated signaling in human CD45RO+ CD4+ T cells promotes Akt and ERK activation and costimulates IFN-γ production. J. Immunol. 2010, 184, 545–549. [Google Scholar] [CrossRef]
Figure 1. LAG-3 and PDL1 expression on CD138+ plasma cells. CD138+PCs were purified from fresh bone marrow aspirates from patients with plasma cell dyscrasia. The cells were stained with specific monoclonal antibodies and analyzed by flow cytometry for the expression of LAG-3 and PDL1. (A) Representative flow cytometry histograms of LAG-3 expression (%) on purified CD138+PCs from MGUS, MM patients vs. control (left), with the quantitative analysis of LAG-3 expression (%) on CD138+PC (right). (B) Representative flow cytometry histograms of PDL1 expression (%) on purified CD138+PCs from MGUS, MM patients vs. control (left); with the quantitative analysis of PDL1 expression (%) on CD138+PC (right). The following designations were used in the figures: *: p < 0.05, **: p < 0.01, ****: p < 0.0001.
Ijms 25 00549 g001
Figure 2. IL-6 and TNF-α secretion from CD138+ plasma cells. Purified CD138+PCs from bone marrow aspirates (from 8 patients with MGUS/SMM, and 4 patients with active MM), were sorted into LAG-3pos and LAG-3neg and incubated overnight for recovery. On the following day, the supernatants were collected and later analyzed for the secretion of IL-6 and TNF-α by multiplex ELISA. (A) The descriptive statistics of IL-6 secretion in supernatants of LAG-3pos vs. LAG-3neg plasma cells. (B) The descriptive statistics of TNF-α secretion in supernatants LAG-3pos vs. LAG-3neg plasma cells.
Ijms 25 00549 g002
Figure 3. Correlation between LAG-3 expression and diagnostics markers. (A) LAG-3 expression (%) on purified CD138+ plasma cells, showing correlation with CD56 expression on plasma cells from whole bone marrow evaluated by flow cytometry. (B) LAG-3 expression (%) on purified CD138+ plasma cells, showing correlation with CD81 expression on plasma cells from whole bone marrow evaluated by flow cytometry. (C) LAG-3 expression (%) on purified CD138+ plasma cells, showing correlation with ferritin serum levels.
Ijms 25 00549 g003
Figure 4. Granzyme expression on CD8+T cells. CD138+PCs were purified from fresh bone marrow aspirates from patients with plasma cell dyscrasia, and then sorted into LAG3pos and LAG3neg plasma cells. In parallel, autologous CD8+ T cells were purified from peripheral blood. On the following day, CD8+T cells were co-cultured with LAG3pos or LAG3neg plasma cells at a ratio of 2:3 and incubated for 24 h. On the third day, the cells were stained with antibodies directed against CD8 and granzyme (Grz), and analyzed by flow cytometry. (A) Representative flow cytometry density plot of Grz gated on CD8+ T cells, co-cultured with either LAG3pos or LAG3neg plasma cells. (B) Statistical analysis of Grz expression in CD8+ T cells co-cultured with either LAG3pos or LAG3neg plasma cells in 31 patients (17 patients with MGUS/SMM and 14 patients with active MM). Gating strategy after double discrimination: cells, CD8+ T cells, Grz on CD8+ T cells. The following designation was used in the figure: **: p < 0.01.
Ijms 25 00549 g004
Figure 5. IL-6 and TNF-α secretion from CD8+T cells. CD138+PCs were purified from fresh bone marrow aspirates from patients with plasma cell dyscrasia and then sorted into LAG3pos and LAG3neg plasma cells. In parallel, autologous CD8+ T cells were purified from peripheral blood. On the following day, CD8+T cells were co-cultured with LAG3pos or LAG3neg plasma cells at a ratio of 2:3 and incubated for 24 h. The next day, the supernatants were collected and further analyzed for the secretion of IL-6 and TNF- α by multiplex ELISA. (A) The descriptive statistics of IL-6 secretion in supernatants of CD8+T cells alone, CD8+T co-cultured with LAG-3pos vs. CD8+T co-cultured with LAG-3neg plasma cells. Krusakal–Wallis test with Dunn’s multiple comparisons test: mean secretion of IL6 by CD8+ T cells vs. CD8+ with Lag3posPC vs. CD8+LAG3negPC is 49.04 vs. 13.58 vs. 31.56 pg/mL p = 0.09. (B) The descriptive statistics of TNF-α secretion in supernatants of CD8+T cells alone, CD8+T co-cultured with LAG-3pos vs. CD8+T co-cultured with LAG-3neg plasma cells. Kruskal–Wallis test with Dunn’s multiple comparisons test for the mean of TNF-α secretion from CD8+ T cells vs. CD8+ T cells with LAG3pos PC vs. LAG3negPC: 18.46 vs. 7.64 vs. 39.24, p = 0.1.
Ijms 25 00549 g005
Figure 6. VEGF secretion from CD138+ plasma cells and CD8+T cells. CD138+PCs were purified from fresh bone marrow aspirates from patients with plasma cell dyscrasia and then were sorted into LAG3pos and LAG3neg plasma cells. In parallel, autologous CD8+ T cells were purified from peripheral blood. On the following day, CD8+T cells were co-cultured with LAG3pos or LAG3neg plasma cells a ratio of 2:3 and incubated for 24 h. The next day, the supernatants were collected and further analyzed for the secretion of VEGF by multiplex ELISA. (A) The descriptive statistics of VEGF secretion in supernatants LAG-3pos vs. LAG-3neg plasma cells. (B) The descriptive statistics of VEGF secretion in supernatants of CD8+T cells alone, and CD8+T co-cultured with LAG-3pos vs. CD8+T co-cultured with LAG-3neg plasma cells. The following designation was used in the figures: *: p = 0.01.
Ijms 25 00549 g006
Table 1. Clinical and demographic characteristics of patients with MGUS, SMM, NDMM, and RRMM. FISH-high risk was defined as del(17p), translocation t(4;14), translocation t(14;16).
MGUS
n = 17
SMM
n = 20
NDMM
n = 27
RRMM
n = 5
Age, mean ± SD (Year)69 ± 9 71 ± 1071 ± 9 63 ± 6
Sex, M/F (n)10/711/9 14/132/3
Fish high risk n, %1462
Monoclonal IgG, IgA, IgM, FLC (n)11,3,2,09,6,1,412,5,0,62,1,0,2
Immunoparesis n, %36205
Immunoparesis is the decrease in one or more uninvolved immunoglobulins below the normal range. MGUS: monoclonal gammopathy of undetermined significance. SMM: smoldering multiple myeloma. NDMM: newly diagnosed multiple myeloma. RRMM: relapsed refractory multiple myeloma.
Disclaimer/Publisher’s Note: The statements, opinions and data contained in all publications are solely those of the individual author(s) and contributor(s) and not of MDPI and/or the editor(s). MDPI and/or the editor(s) disclaim responsibility for any injury to people or property resulting from any ideas, methods, instructions or products referred to in the content.

