
Genome-Wide Association Study and Prediction of Tassel Weight of Tropical Maize Germplasm in Multi-Parent Population


 ,
,
Abstract
:1. Introduction
2. Results
2.1. Phenotypic Analysis of TW
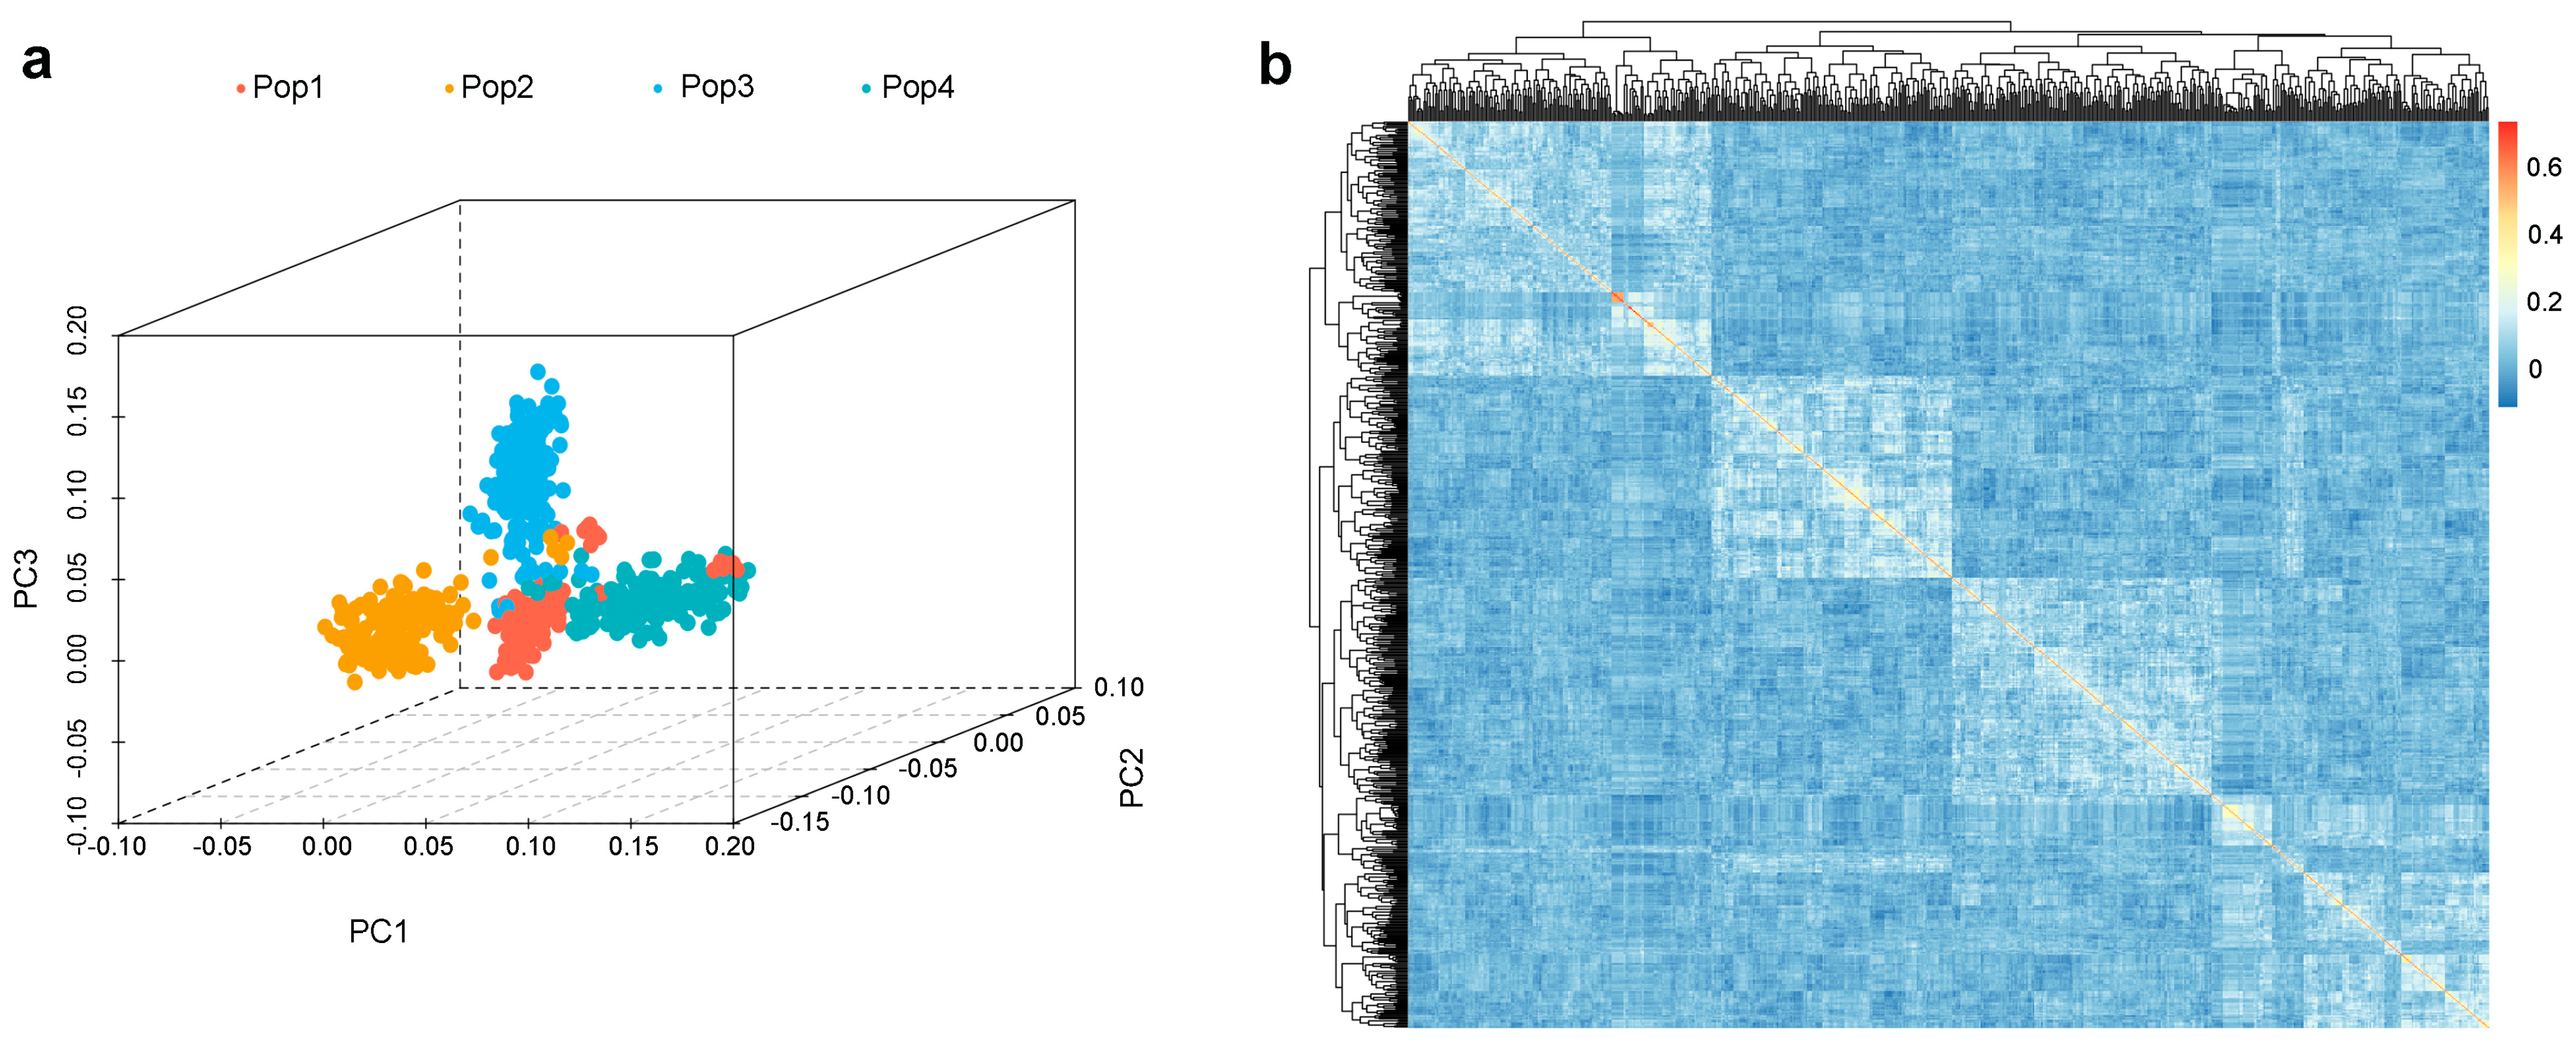
2.2. Analysis of Population Structure in the Multi-Parent Population
2.3. Genome-Wide Association Analysis of TW in Multi-Parent Population
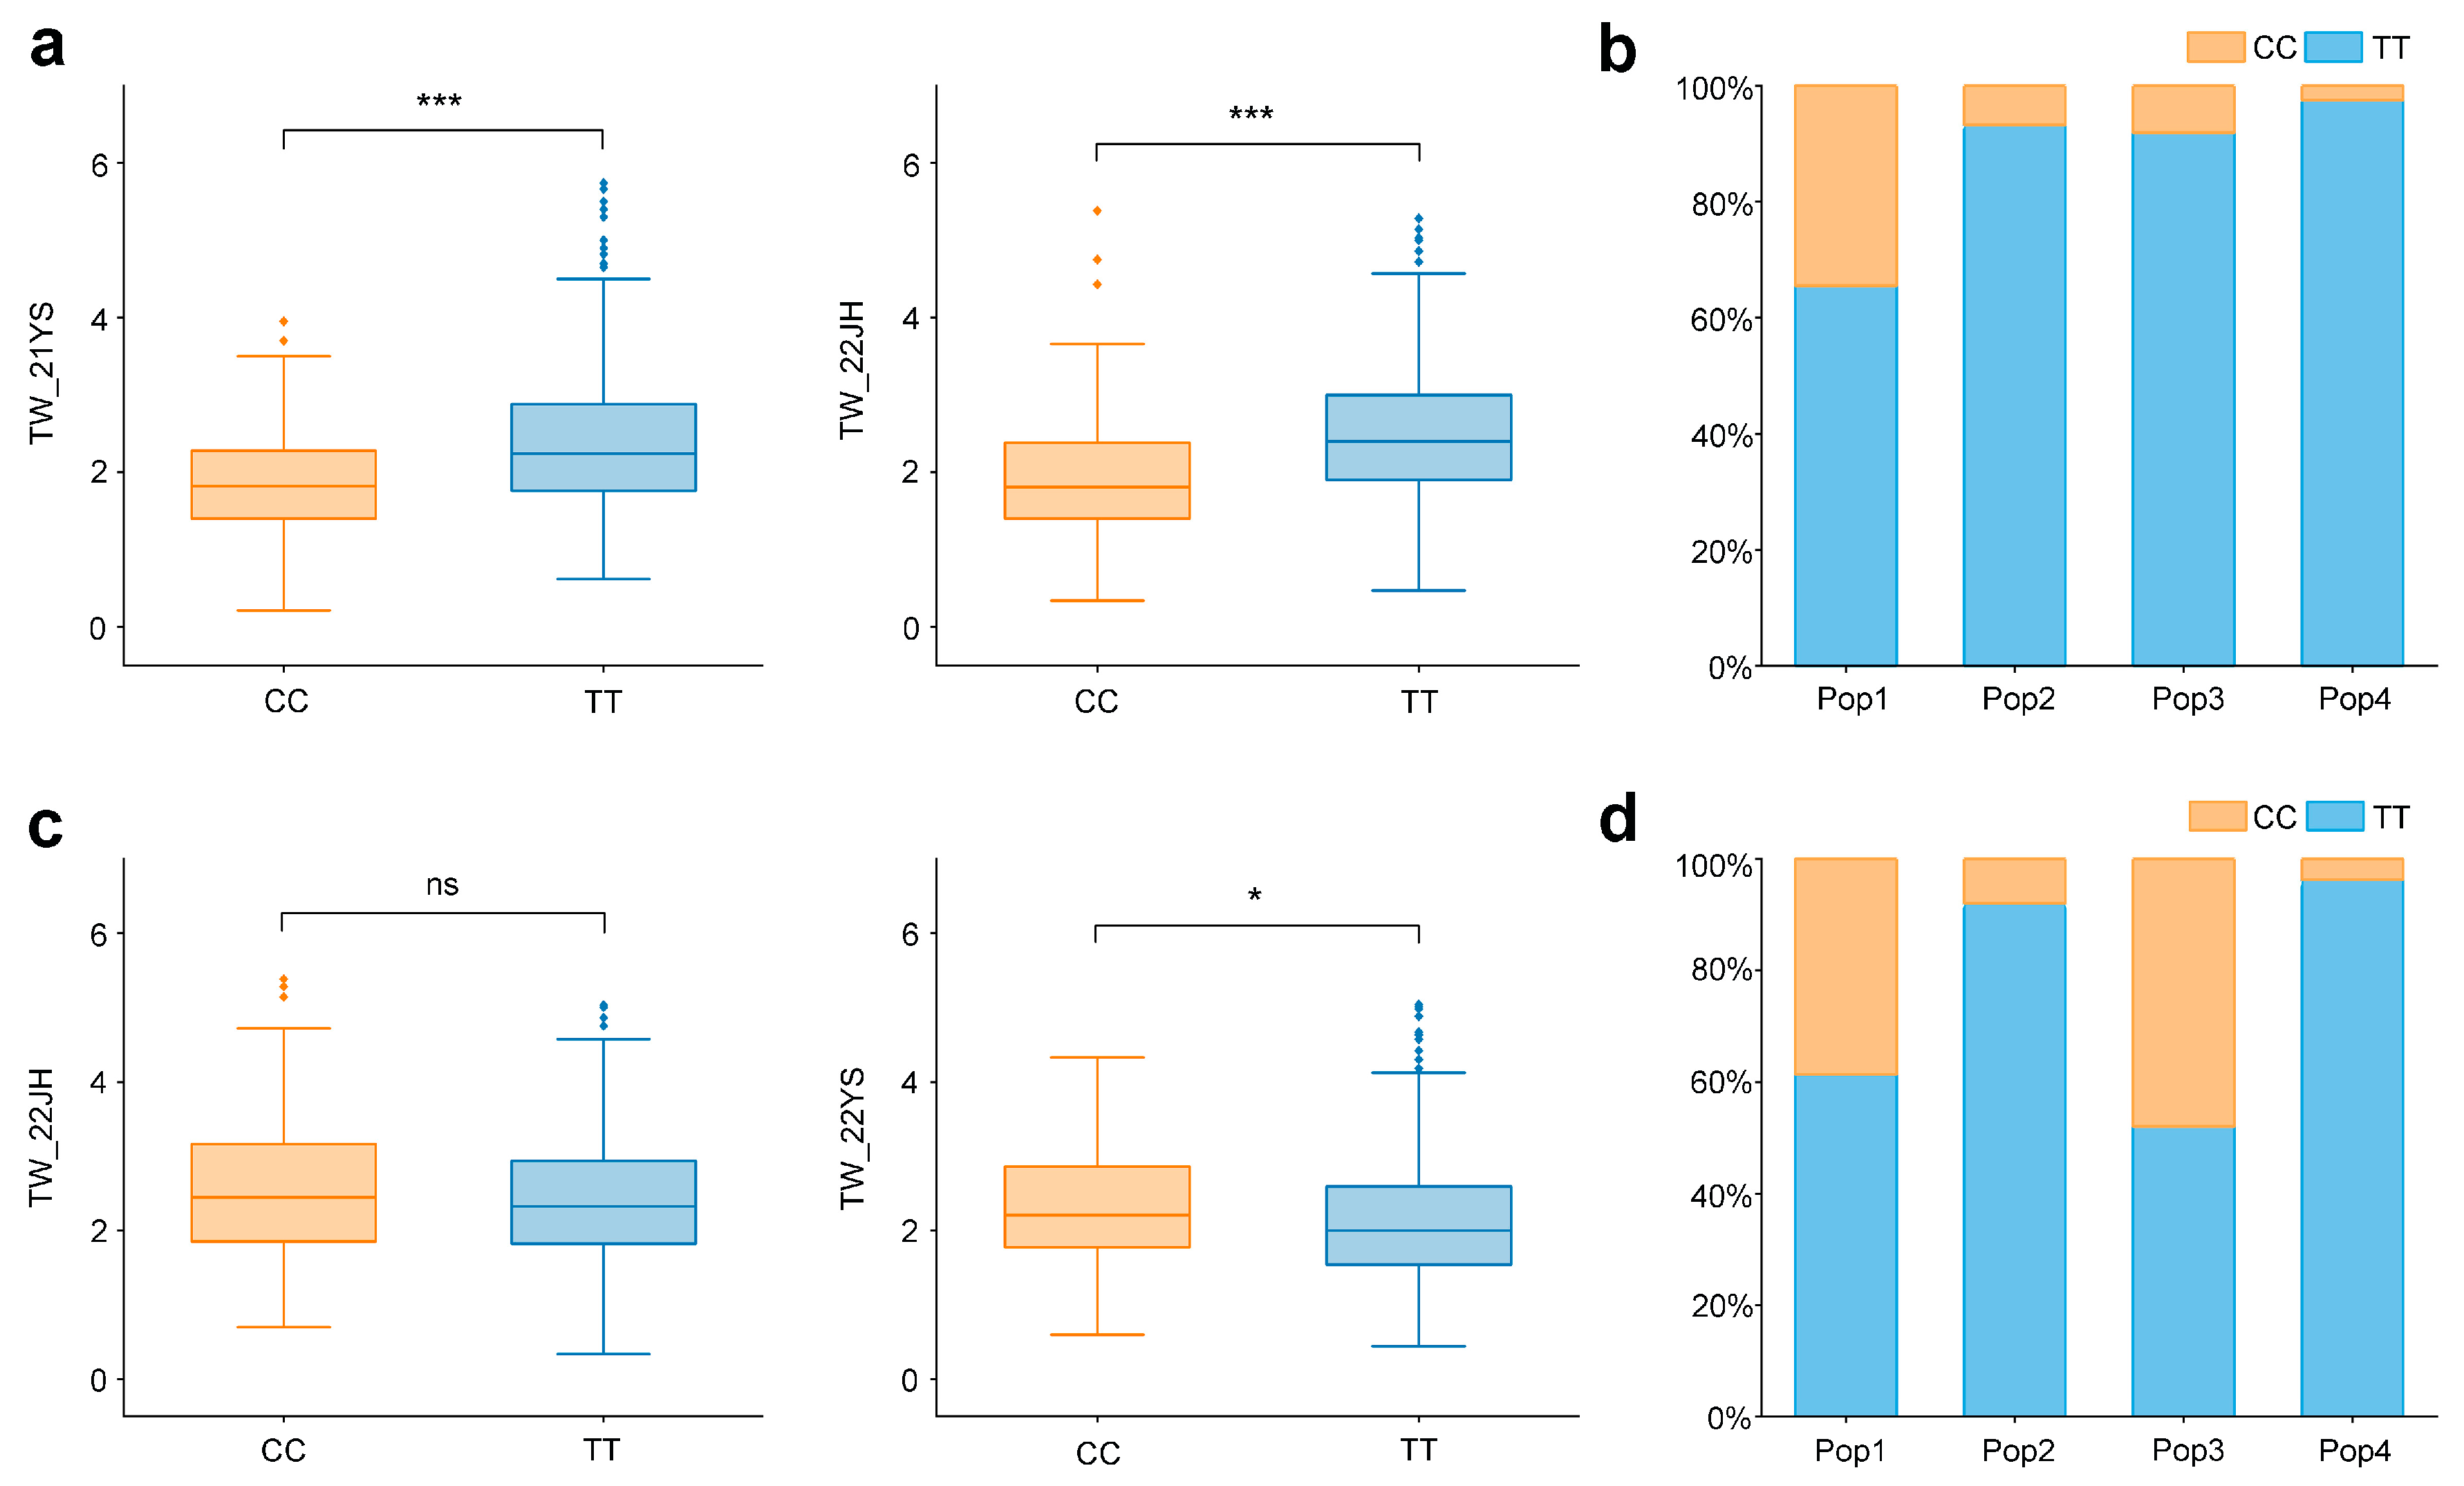
2.4. Genetic Effect Analysis of Co-Localized SNPs
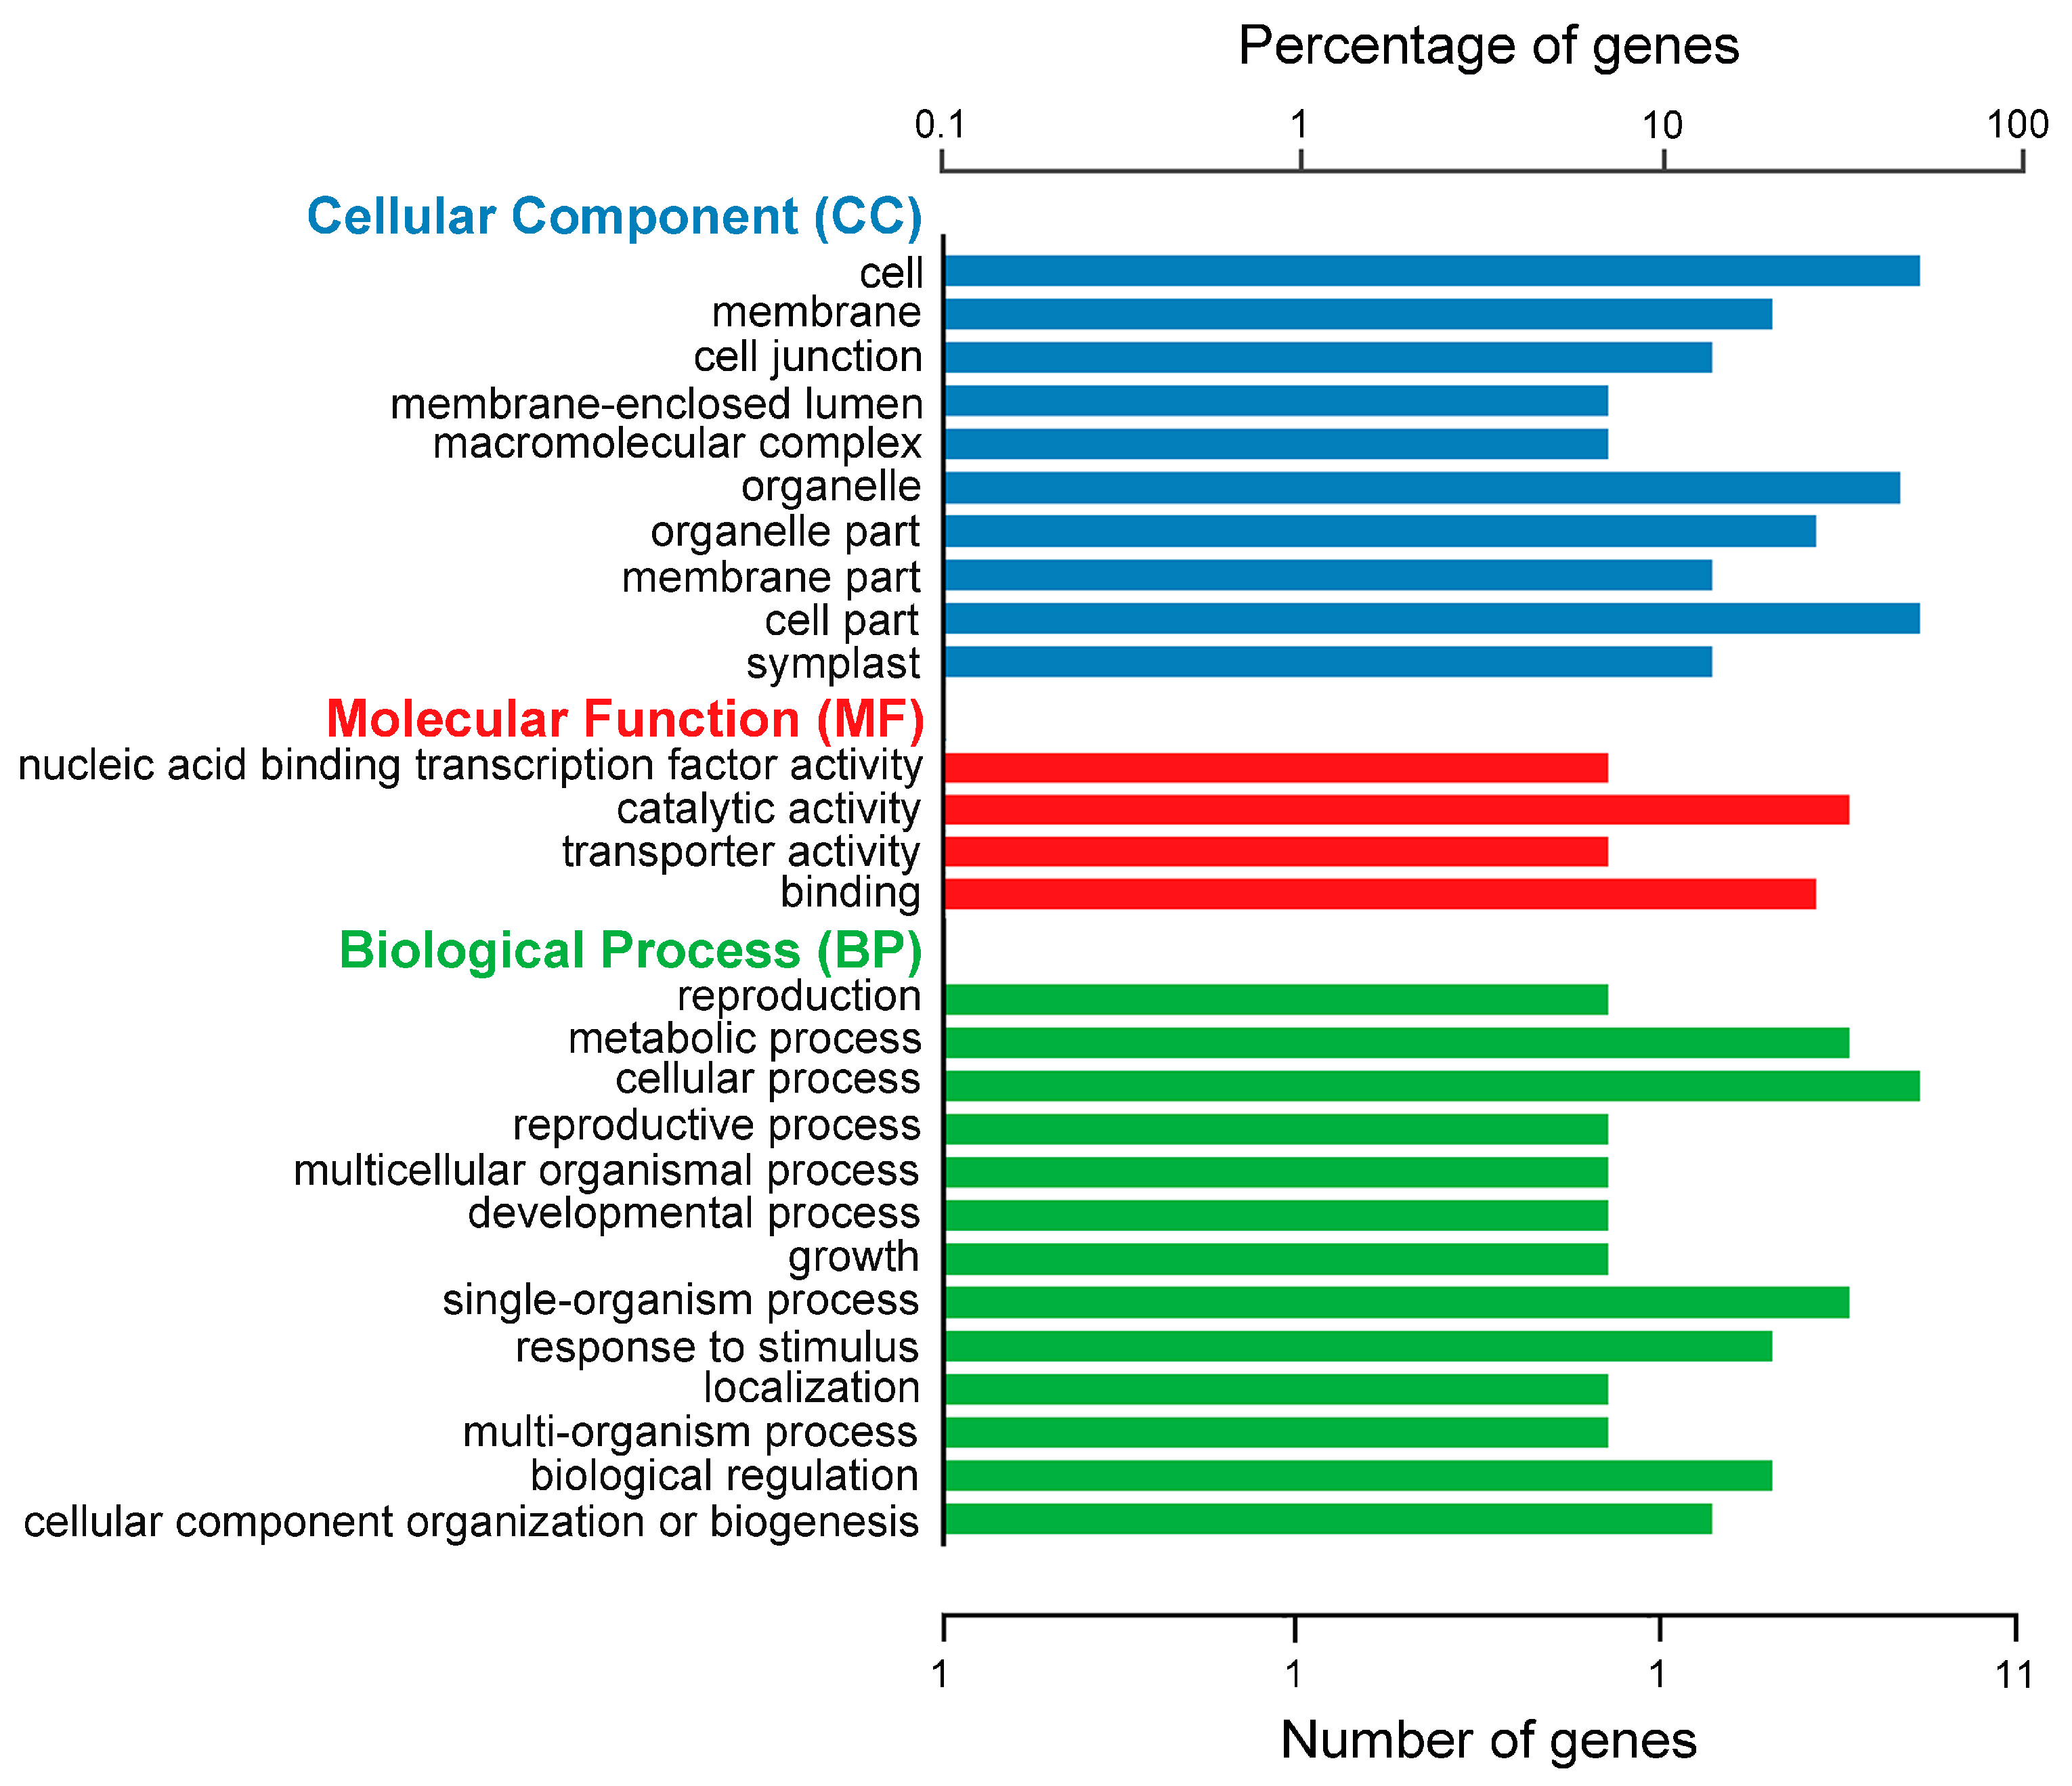
2.5. Functional Annotation and Enrichment Analysis of the Candidate Genes
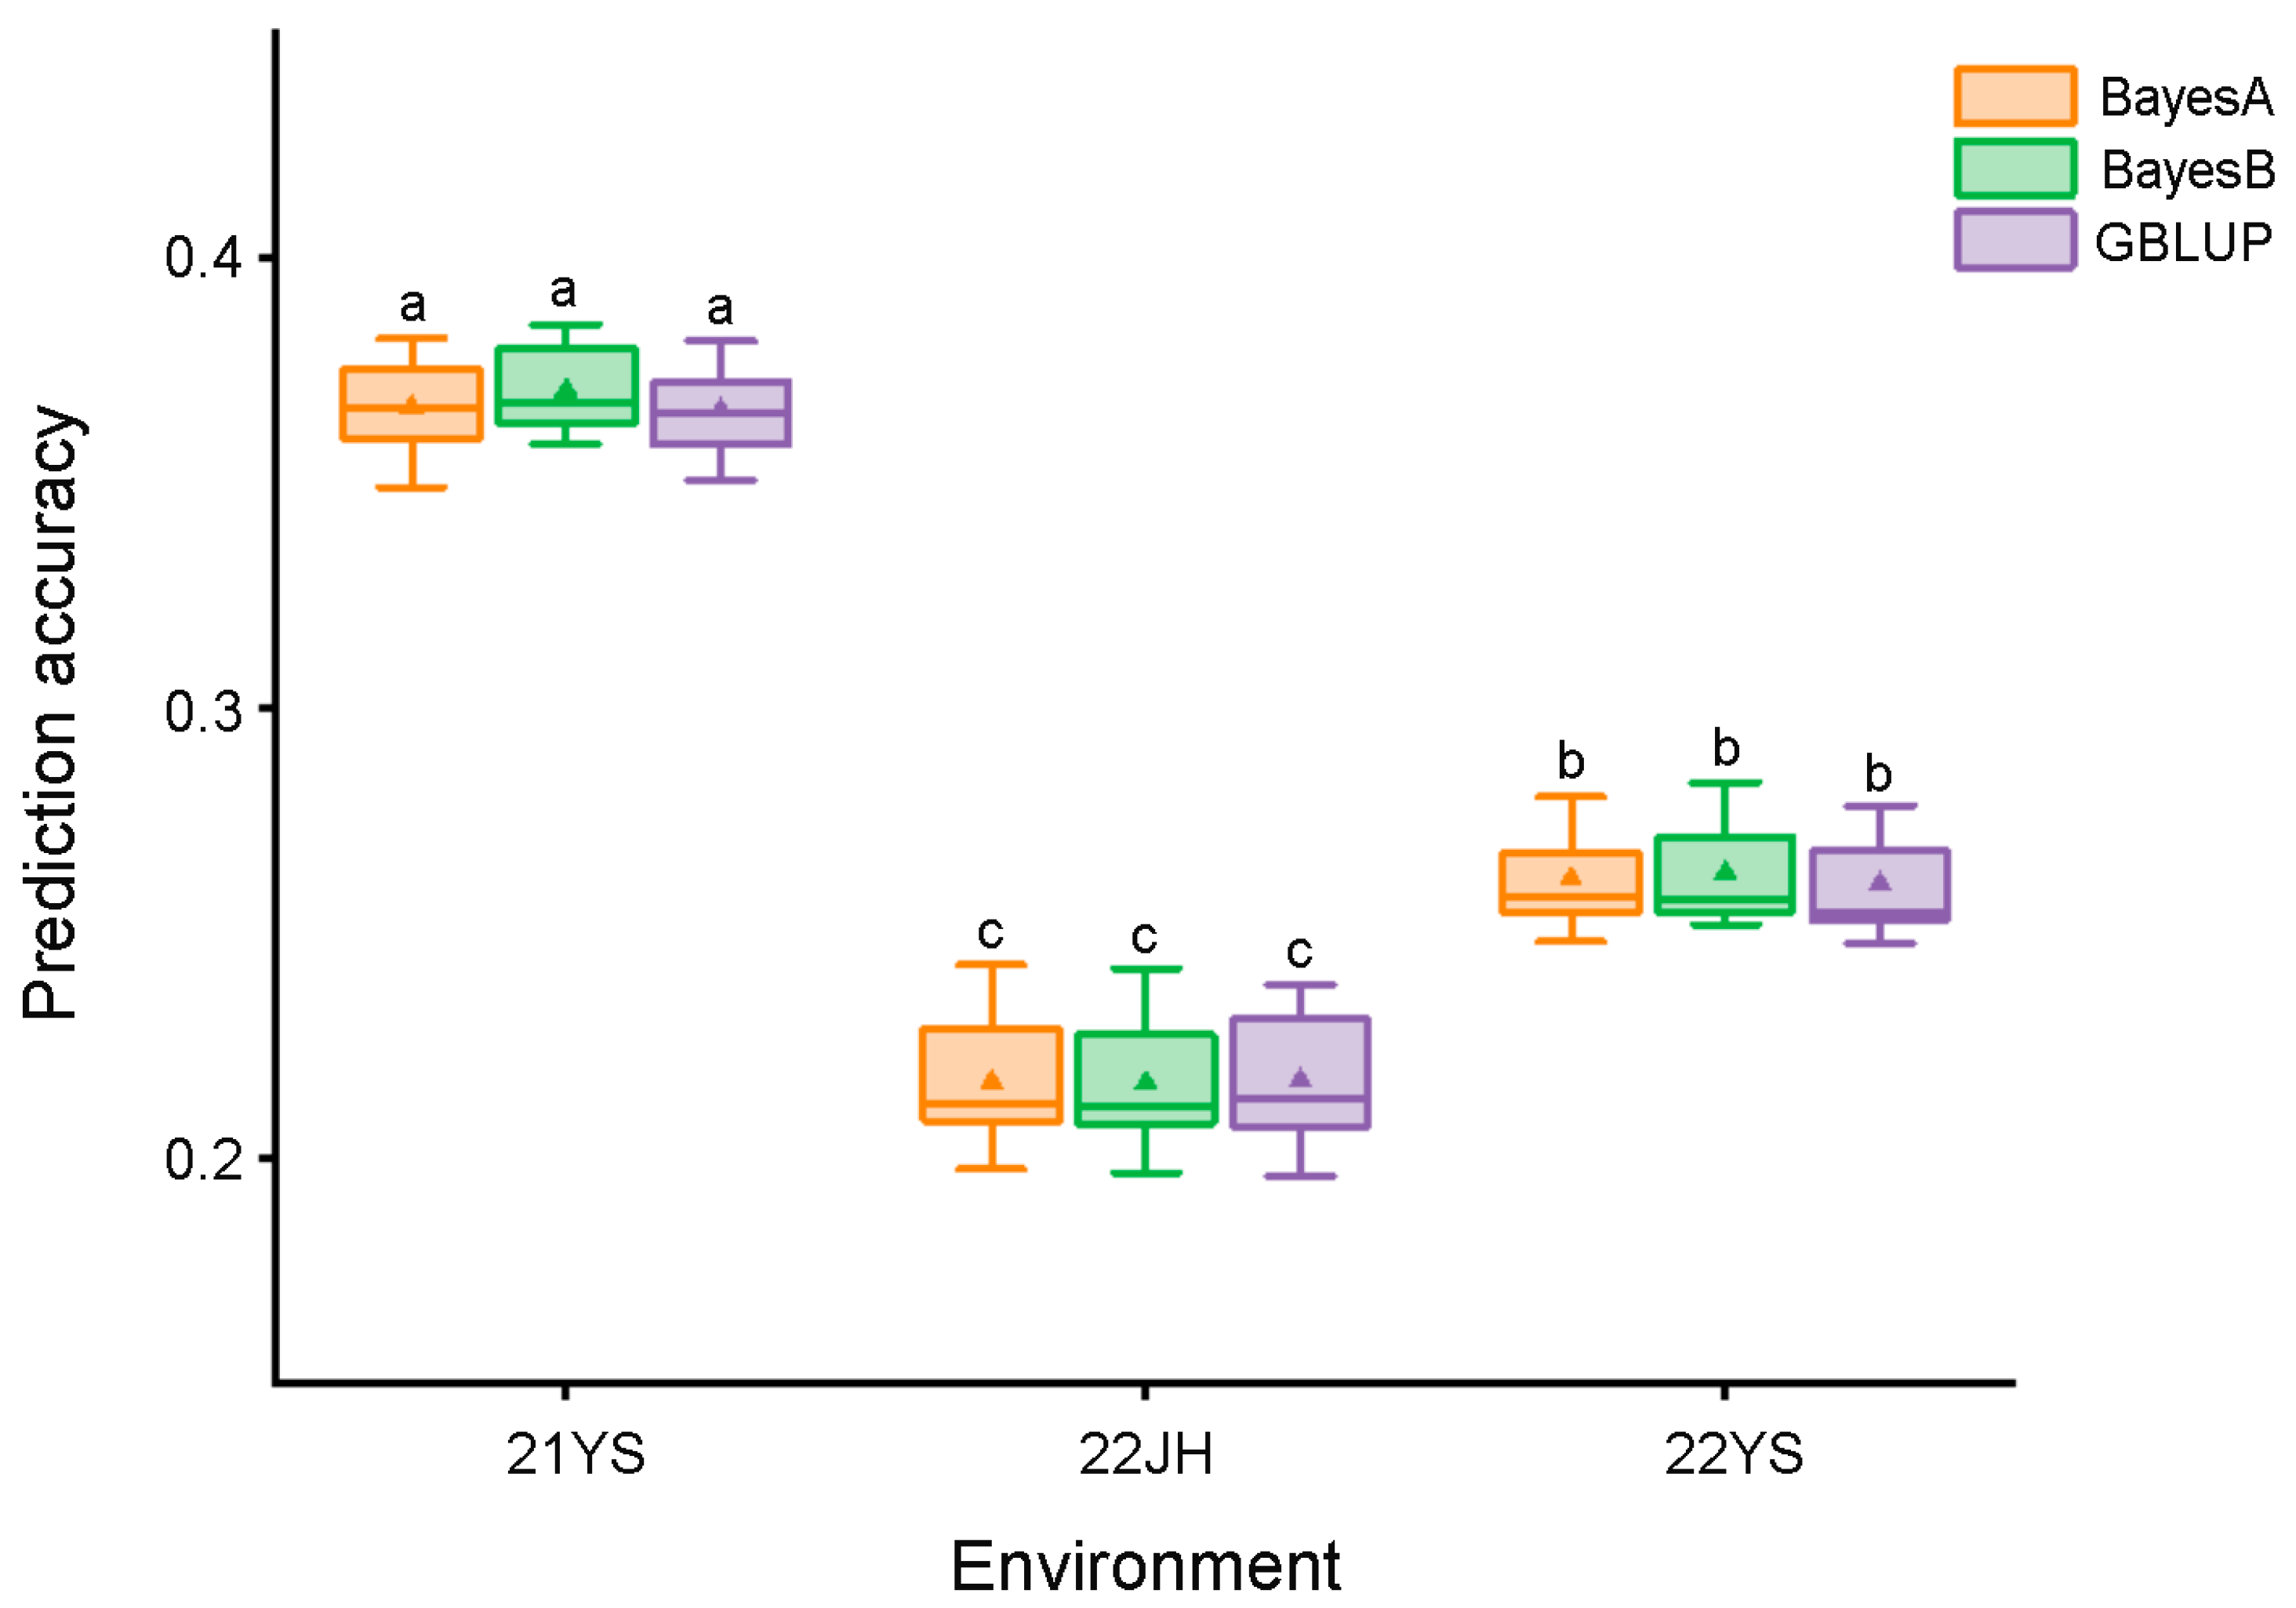
2.6. Genomic Selection Analysis
3. Discussion
3.1. Comparison of Significantly Associated Loci for TW with Previously Reported QTLs
3.2. Functional Analysis of Candidate Genes
3.3. Genome-Wide Selection Prediction
4. Materials and Methods
4.1. Test Materials and Field Experiment
4.2. Phenotypic Data Analysis
4.3. DNA Extraction and Genotyping-by-Sequencing (GBS)
4.4. Population Structure Analysis and Genome-Wide Association Study
4.5. Functional Annotation and GO Enrichment Analysis of Candidate Genes
4.6. Genomic Selection
5. Conclusions
Author Contributions
Funding
Institutional Review Board Statement
Informed Consent Statement
Data Availability Statement
Acknowledgments
Conflicts of Interest
References
- Guei, R.G.; Wassom, C.E. Genetic analysis of tassel size and leaf senescence and their relationships with yield in two tropical lowland maize populations. Afr. Crop Sci. J. 1996, 4, 275–281. [Google Scholar]
- Duvick, D.N.; Cassman, K.G. Post–Green Revolution Trends in Yield Potential of Temperate Maize in the North-Central United States. Crop Sci. 1999, 39, 1622–1630. [Google Scholar] [CrossRef]
- Duvick, D.N. Yields and Other Agronomic Characteristics of Cytoplasmically Pollen Sterile Corn Hybrids, Compared to Their Normal Counterparts 1. Agron. J. 1958, 50, 121–125. [Google Scholar] [CrossRef]
- Lambert, R.J.; Johnson, R.R. Leaf Angle, Tassel Morphology, and the Performance of Maize Hybrids 1. Crop Sci. 1978, 18, 499–502. [Google Scholar] [CrossRef]
- Upadyayula, N.; Da Silva, H.S.; Bohn, M.O.; Rocheford, T.R. Genetic and QTL analysis of maize tassel and ear inflorescence architecture. Theor. Appl. Genet. 2006, 112, 592–606. [Google Scholar] [CrossRef] [PubMed]
- Dai, Z.J.; Wang, X.T.; Yang, Q.; Wang, Y.; Zhang, Y.Y.; Xi, Z.Y.; Li, B.Q. Major quantitative trait loci mapping for tassel branch number and construction of qTBN5 near-isogenic lines in maize (Zea mays L.). Acta Agron. Sin. 2018, 44, 1127–1135. [Google Scholar] [CrossRef]
- Fischer, K.S.; Edmeades, G.O.; Johnson, E.C. Recurrent Selection for Reduced Tassel Branch Number and Reduced Leaf Area Density above the Ear in Tropical Maize Populations 1. Crop Sci. 1987, 27, 1150–1156. [Google Scholar] [CrossRef]
- Wu, B.; Ren, W.; Zhao, L.F.; Li, Q.; Sun, J.Z.; Chen, F.J.; Pan, Q.C. Genome-wide association study of root system architecture in maize. Genes 2022, 13, 181. [Google Scholar] [CrossRef]
- Yin, X.F.; Bi, Y.Q.; Jiang, F.Y.; Guo, R.J.; Zhang, Y.D.; Fan, J.; Kang, M.S.; Fan, X.M. Fine mapping of candidate quantitative trait loci for plant and ear height in a maize nested-association mapping population. Front. Plant Sci. 2022, 13, 963985. [Google Scholar] [CrossRef]
- Wang, Y.L.; Bi, Y.Q.; Jiang, F.Y.; Shaw, R.K.; Sun, J.C.; Hu, C.; Guo, R.J.; Fan, X.M. Mapping and Functional Analysis of QTL for Kernel Number per Row in Tropical and Temperate–Tropical Introgression Lines of Maize (Zea mays L.). Curr. Issues Mol. Biol. 2023, 45, 4416–4430. [Google Scholar] [CrossRef]
- Buckler, E.S.; Holland, J.B.; Bradbury, P.J.; Acharya, C.B.; Brown, P.J.; Browne, C.; Ersoz, E.; Flint-Garcia, S.; Garcia, A.; Glaubitz, J.C.; et al. The genetic architecture of maize flowering time. Science 2009, 325, 714–718. [Google Scholar] [CrossRef]
- Wang, M.; Yan, J.B.; Zhao, J.R.; Song, W.; Zhang, X.B.; Xiao, Y.N.; Zheng, Y.L. Genome-wide association study (GWAS) of resistance to head smut in maize. Plant Sci. 2012, 196, 125–131. [Google Scholar] [CrossRef]
- Poland, J.A.; Bradbury, P.J.; Buckler, E.S.; Nelson, R.J. Genome-wide nested association mapping of quantitative resistance to northern leaf blight in maize. Proc. Natl. Acad. Sci. USA 2011, 108, 6893–6898. [Google Scholar] [CrossRef]
- Wu, X.; Li, Y.X.; Shi, Y.S.; Song, Y.C.; Zhang, D.F.; Li, C.H.; Buckler, E.S.; Li, Y.; Zhang, Z.W.; Wang, T.Y. Joint-linkage mapping and GWAS reveal extensive genetic loci that regulate male inflorescence size in maize. Plant Biotechnol. J. 2016, 14, 1551–1562. [Google Scholar] [CrossRef] [PubMed]
- Qin, X.E.; Tian, S.K.; Zhang, W.L.; Dong, X.; Ma, C.X.; Wang, Y.; Yan, J.B.; Yue, B. Q Dtbn1, an F-box gene affecting maize tassel branch number by a dominant model. Plant Biotechnol. J. 2021, 19, 1183–1194. [Google Scholar] [CrossRef] [PubMed]
- Berke, T.G.; Rocheford, T.R. Quantitative trait loci for tassel traits in maize. Crop Sci. 1999, 39, 1439–1443. [Google Scholar] [CrossRef]
- Wang, D.; Li, Y.X.; Wang, Y.; Liu, C.; Liu, Z.Z.; Peng, B.; Tan, W.W.; Zhang, Y.; Sun, B.C.; Shi, Y.S.; et al. Major Quantitative Trait Loci Analysis of Tassel Primary Branch Number and Tassel Weight in Maize (Zea mays). Chin. Bull. Bot. 2011, 46, 11–20. [Google Scholar]
- Liu, X.Y.; Hao, L.Y.; Kou, S.R.; Su, E.H.; Zhou, Y.Q.; Wang, R.L.; Mohamed, A.; Gao, C.X.; Zhang, D.F.; Li, Y.X.; et al. High-density quantitative trait locus mapping revealed genetic architecture of leaf angle and tassel size in maize. Mol. Breed. 2019, 39, 7. [Google Scholar] [CrossRef]
- Xie, Y.N.; Wang, X.Q.; Ren, X.C.; Yang, X.Y.; Zhao, R.G. A SNP-based high-density genetic map reveals reproducible QTLs for tassel-related traits in maize (Zea mays L.). Trop. Plant Biol. 2019, 12, 244–254. [Google Scholar] [CrossRef]
- Meuwissen, T.H.E.; Hayes, B.J.; Goddard, M.E. Prediction of total genetic value using genome-wide dense marker maps. Genetics 2001, 157, 1819–1829. [Google Scholar] [CrossRef]
- Romero Navarro, J.A.; Willcox, M.; Burgueño, J.; Romay, C.; Swarts, K.; Trachsel, S.; Preciado, E.; Terron, A.; Delgado, H.V.; Vidal, V.; et al. A study of allelic diversity underlying flowering-time adaptation in maize landraces. Nat. Genet. 2017, 49, 476–480. [Google Scholar] [CrossRef] [PubMed]
- Riedelsheimer, C.; Czedik-Eysenberg, A.; Grieder, C.; Lisec, J.; Technow, F.; Sulpice, R.; Altmann, T.; Stitt, M.; Willmitzer, L.; Melchinger, A.E. Genomic and metabolic prediction of complex heterotic traits in hybrid maize. Nat. Genet. 2012, 44, 217–220. [Google Scholar] [CrossRef] [PubMed]
- Kadam, D.C.; Potts, S.M.; Bohn, M.O.; Lipka, A.E.; Lorenz, A.J. Genomic prediction of single crosses in the early stages of a maize hybrid breeding pipeline. G3 Genes Genomes Genet. 2016, 6, 3443–3453. [Google Scholar] [CrossRef] [PubMed]
- Liu, L.; Du, Y.F.; Huo, D.A.; Wang, M.; Shen, X.M.; Yue, B.; Qiu, F.Z.; Zheng, Y.L.; Yan, J.B.; Zhang, Z.X. Genetic architecture of maize kernel row number and whole genome prediction. Theor. Appl. Genet. 2015, 128, 2243–2254. [Google Scholar] [CrossRef] [PubMed]
- An, Y.X.; Chen, L.; Li, Y.X.; Li, C.H.; Shi, Y.S.; Zhang, D.F.; Li, Y.; Wang, T.Y. Genome-wide association studies and whole-genome prediction reveal the genetic architecture of KRN in maize. BMC Plant Biol. 2020, 20, 1–11. [Google Scholar] [CrossRef] [PubMed]
- Guo, Z.F.; Zou, C.; Liu, X.G.; Wang, S.H.; Li, W.X.; Jeffers, D.; Fan, X.M.; Xu, M.L.; Xu, Y.B. Complex genetic system involved in fusarium ear rot resistance in maize as revealed by GWAS, bulked sample analysis, and genomic prediction. Plant Dis. 2020, 104, 1725–1735. [Google Scholar] [CrossRef] [PubMed]
- Gaikpa, D.S.; Kessel, B.; Presterl, T.; Ouzunova, M.; Galiano-Carneiro, A.L.; Mayer, M.; Melchinger, A.E.; Schön, C.-C.; Miedaner, T. Exploiting genetic diversity in two European maize landraces for improving Gibberella ear rot resistance using genomic tools. Theor. Appl. Genet. 2021, 134, 793–805. [Google Scholar] [CrossRef]
- Liu, X.G.; Hu, X.J.; Li, K.; Liu, Z.F.; Wu, Y.J.; Wang, H.W.; Huang, C.L. Genetic mapping and genomic selection for maize stalk strength. BMC Plant Biol. 2020, 20, 1–16. [Google Scholar] [CrossRef]
- Xu, J.B.; Wu, P.H.; Huang, B.W.; Chen, Z.H.; Ma, Y.H.; Ren, J.J. QTL locating and genomic selection for tassel-related traits using F2:3 lineage haploids. Acta Agron. Sin. 2023, 49, 622–633. [Google Scholar]
- Dang, D.D.; Guan, Y.; Zheng, H.J.; Zhang, X.C.; Zhang, A.; Wang, H.; Ruan, Y.Y.; Qin, L. Genome-wide association study and genomic prediction on plant architecture traits in sweet corn and waxy corn. Plants 2023, 12, 303. [Google Scholar] [CrossRef]
- Fan, X.M.; Zhang, Y.D.; Yao, W.H.; Bi, Y.Q.; Liu, L.; Chen, H.M.; Kang, M.S. Reciprocal diallel crosses impact combining ability, variance estimation, and heterotic group classification. Crop Sci. 2014, 54, 89–97. [Google Scholar] [CrossRef]
- Jia, B.; Cui, M.; Xie, Q.C.; Yan, W.G.; Yin, Z.T. QTL Analysis of Tassel Traits Based on SNP Markers in Maize. Southwest. China J. Agric. Sci. 2019, 32, 1469–1473. [Google Scholar]
- Wang, Y.B.; Wei, J.; Long, Y.; Dong, Z.Y.; Wan, X.Y. Research Advances on Genetic Structure and Molecular Mechanism Underlying the Formation of Tassel Traits in Maize. China Biotechnol. 2021, 41, 88–102. [Google Scholar]
- Dornelas, M.C.; Wittich, P.; von Recklinghausen, I.; van Lammeren, A.; Kreis, M. Characterization of three novel members of the Arabidopsis SHAGGY-related protein kinase (ASK) multigene family. Plant Mol. Biol. 1999, 39, 137–147. [Google Scholar] [CrossRef] [PubMed]
- Pay, A.; Jonak, C.; Bögre, L.; Meskiene, I.; Mairinger, T.; Szalay, A.; Heberle-Bors, E.; Hirt, H. The MsK family of alfalfa protein kinase genes encodes homologues of shaggy/glycogen synthase kinase-3 and shows differential expression patterns in plant organs and development. Plant J. 1993, 3, 847–856. [Google Scholar] [CrossRef] [PubMed]
- Mao, J.; Li, W.X.; Liu, J.; Li, J.M. Versatile physiological functions of plant GSK3-like kinases. Genes 2021, 12, 697. [Google Scholar] [CrossRef]
- Youn, J.H.; Kim, T.W. Functional insights of plant GSK3-like kinases: Multi-taskers in diverse cellular signal transduction pathways. Mol. Plant. 2015, 8, 552–565. [Google Scholar] [CrossRef] [PubMed]
- Zolkiewicz, K.; Gruszka, D. Glycogen synthase kinases in model and crop plants—From negative regulators of brassinosteroid signaling to multifaceted hubs of various signaling pathways and modulators of plant reproduction and yield. Front. Plant Sci. 2022, 13, 939487. [Google Scholar] [CrossRef]
- Saidi, Y.; Hearn, T.J.; Coates, J.C. Function and evolution of ‘green’ GSK3/Shaggy-like kinases. Trends Plant Sci. 2012, 17, 39–46. [Google Scholar] [CrossRef]
- Li, J.M.; Nam, K.H. Regulation of brassinosteroid signaling by a GSK3/SHAGGY-like kinase. Science 2002, 295, 1299–1301. [Google Scholar] [CrossRef]
- Makarevitch, I.; Thompson, A.; Muehlbauer, G.J.; Springer, N.M. Brd1 gene in maize encodes a brassinosteroid C-6 oxidase. PLoS ONE 2012, 7, e30798. [Google Scholar] [CrossRef] [PubMed]
- Wang, Y.; Xu, J.H.; Yu, J.J.; Zhu, D.Y.; Zhao, Q. Maize GSK3-like kinase ZmSK2 is involved in embryonic development. Plant Sci. 2022, 318, 111221. [Google Scholar] [CrossRef] [PubMed]
- Claisse, G.; Charrier, B.; Kreis, M. The Arabidopsis thaliana GSK3/Shaggy like kinase AtSK3-2 modulates floral cell expansion. Plant Mol. Biol. 2007, 64, 113–124. [Google Scholar] [CrossRef] [PubMed]
- Dornelas, M.C.; Van Lammeren, A.A.M.; Kreis, M. Arabidopsis thaliana SHAGGY-related protein kinases (AtSK11 and 12) function in perianth and gynoecium development. Plant J. 2000, 21, 419–429. [Google Scholar] [CrossRef] [PubMed]
- Decroocq-Ferrant, V.; Van Went, J.; Bianchi, M.W.; de Vries, S.C.; Kreis, M. Petunia hybrida homologues of shaggy/zeste-white 3 expressed in female and male reproductive organs. Plant J. 1995, 7, 897–911. [Google Scholar] [CrossRef] [PubMed]
- Einzenberger, E.; Eller, N.; Heberle-Bors, E.; Vicente, O. Isolation and expression during pollen development of a tobacco cDNA clone encoding a protein kinase homologous to shaggy/glycogen synthase kinase-3. Biochim. Biophys. Acta Gene Struct. Expr. 1995, 1260, 315–319. [Google Scholar] [CrossRef] [PubMed]
- Schwartz, B.W.; Yeung, E.C.; Meinke, D.W. Disruption of morphogenesis and transformation of the suspensor in abnormal suspensor mutants of Arabidopsis. Development 1994, 120, 3235–3245. [Google Scholar] [CrossRef] [PubMed]
- Marquardt, S.; Raitskin, O.; Wu, Z.; Liu, F.Q.; Sun, Q.W.; Dean, C. Functional consequences of splicing of the antisense transcript COOLAIR on FLC transcription. Mol. Cell. 2014, 54, 156–165. [Google Scholar] [CrossRef]
- Kulichová, K.; Kumar, V.; Steinbachová, L.; Klodová, B.; Timofejeva, L.; Juříček, M.; Honys, D.; Hafidh, S.S. PRP8A and PRP8B spliceosome subunits act coordinately to control pollen tube attraction in Arabidopsis thaliana. Development 2020, 147, dev186742. [Google Scholar] [CrossRef]
- Llinas, R.J.; Xiong, J.Q.; Clark, N.M.; Burkhart, S.E.; Bartel, B. An Arabidopsis pre-RNA processing8a (prp8a) missense allele restores splicing of a subset of mis-spliced mRNAs. Plant Physiol. 2022, 189, 2175–2192. [Google Scholar] [CrossRef]
- Kaufmann, C.; Sauter, M. Sulfated plant peptide hormones. J. Exp. Bot. 2019, 70, 4267–4277. [Google Scholar] [CrossRef] [PubMed]
- Chakraborty, S.; Nguyen, B.; Wasti, S.D.; Xu, G.Z. Plant leucine-rich repeat receptor kinase (LRR-RK): Structure, ligand perception, and activation mechanism. Molecules 2019, 24, 3081. [Google Scholar] [CrossRef]
- Kang, J.; Yu, H.P.; Tian, C.H.; Zhou, W.K.; Li, C.Y.; Jiao, Y.L.; Liu, D. Suppression of photosynthetic gene expression in roots is required for sustained root growth under phosphate deficiency. Plant Physiol. 2014, 165, 1156–1170. [Google Scholar] [CrossRef] [PubMed]
- Chen, Y.F.; Matsubayashi, Y.; Sakagami, Y. Peptide growth factor phytosulfokine-α contributes to the pollen population effect. Planta 2000, 211, 752–755. [Google Scholar] [CrossRef] [PubMed]
- Stührwohldt, N.; Dahlke, R.I.; Kutschmar, A.; Peng, X.B.; Sun, M.X.; Sauter, M. Phytosulfokine peptide signaling controls pollen tube growth and funicular pollen tube guidance in Arabidopsis thaliana. Physiol. Plant. 2015, 153, 643–653. [Google Scholar] [CrossRef]
- Mosher, S.; Seybold, H.; Rodriguez, P.; Stahl, M.; Davies, K.A.; Dayaratne, S.; Morillo, S.A.; Wierzba, M.; Favery, B.; Keller, H.; et al. The tyrosine-sulfated peptide receptors PSKR1 and PSY1R modify the immunity of Arabidopsis to biotrophic and necrotrophic pathogens in an antagonistic manner. Plant J. 2013, 73, 469–482. [Google Scholar] [CrossRef] [PubMed]
- Rodiuc, N.; Barlet, X.; Hok, S.; Perfus-Barbeoch, L.; Allasia, V.; Engler, G.; Séassau, A.; Marteu, N.; de Almeida-Engler, J.; Panabières, F.; et al. Evolutionarily distant pathogens require the Arabidopsis phytosulfokine signalling pathway to establish disease. Plant Cell Environ. 2016, 39, 1396–1407. [Google Scholar] [CrossRef]
- Amano, Y.; Tsubouchi, H.; Shinohara, H.; Ogawa, M.; Matsubayashi, Y. Tyrosine-sulfated glycopeptide involved in cellular proliferation and expansion in Arabidopsis. Proc. Natl. Acad. Sci. USA 2007, 104, 18333–18338. [Google Scholar] [CrossRef]
- Shen, Y.P.; Diener, A.C. Arabidopsis thaliana RESISTANCE TO FUSARIUM OXYSPORUM 2 implicates tyrosine-sulfated peptide signaling in susceptibility and resistance to root infection. PLoS Genet. 2013, 9, e1003525. [Google Scholar] [CrossRef]
- Matsuzaki, Y.; Ogawa-Ohnishi, M.; Mori, A.; Matsubayashi, Y. Secreted peptide signals required for maintenance of root stem cell niche in Arabidopsis. Science 2010, 329, 1065–1067. [Google Scholar] [CrossRef]
- Fernandez, A.; Drozdzecki, A.; Hoogewijs, K.; Nguyen, A.; Beeckman, T.; Madder, A.; Hilson, P. Transcriptional and functional classification of the GOLVEN/ROOT GROWTH FACTOR/CLE-like signaling peptides reveals their role in lateral root and hair formation. Plant Physiol. 2013, 161, 954–970. [Google Scholar] [CrossRef] [PubMed]
- Doblas, V.G.; Smakowska-Luzan, E.; Fujita, S.; Alassimone, J.; Barberon, M.; Madalinski, M.; Belkhadir, Y.; Geldner, N. Root diffusion barrier control by a vasculature-derived peptide binding to the SGN3 receptor. Science 2017, 355, 280–284. [Google Scholar] [CrossRef]
- Drapek, C.; Sparks, E.E.; Marhavy, P.; Taylor, I.; Andersen, T.G.; Hennacy, J.H.; Geldner, N.; Benfey, P.N. Minimum requirements for changing and maintaining endodermis cell identity in the Arabidopsis root. Nat. Plants. 2018, 4, 586–595. [Google Scholar] [CrossRef] [PubMed]
- Patel, N.; Mohd-Radzman, N.A.; Corcilius, L.; Crossett, B.; Connolly, A.; Cordwell, S.J.; Ivanovici, A.; Taylor, K.; Williams, J.; Binos, S.; et al. Diverse peptide hormones affecting root growth identified in the Medicago truncatula secreted peptidome. Mol. Cellular Proteomics. 2018, 17, 160–174. [Google Scholar] [CrossRef] [PubMed]
- Komori, R.; Amano, Y.; Ogawa-Ohnishi, M.; Matsubayashi, Y. Identification of tyrosylprotein sulfotransferase in Arabidopsis. Proc. Natl. Acad. Sci. USA 2009, 106, 15067–15072. [Google Scholar] [CrossRef] [PubMed]
- Fernández-Fernández, M.R.; Gragera, M.; Ochoa-Ibarrola, L.; Quintana-Gallardo, L.; Valpuesta, J.M. Hsp70—A master regulator in protein degradation. Febs Lett. 2017, 591, 2648–2660. [Google Scholar] [CrossRef] [PubMed]
- Kotler, J.L.M.; Street, T.O. Mechanisms of Protein Quality Control in the Endoplasmic Reticulum by a Coordinated Hsp40-Hsp70-Hsp90 System. Annu. Rev. Biophys. 2023, 52, 509–524. [Google Scholar] [CrossRef]
- Qiu, X.B.; Shao, Y.M.; Miao, S.; Wang, L. The diversity of the DnaJ/Hsp40 family, the crucial partners for Hsp70 chaperones. Cell. Mol. Life Sci. 2006, 63, 2560–2570. [Google Scholar] [CrossRef]
- Yang, K.Z.; Xia, C.; Liu, X.L.; Dou, X.Y.; Wang, W.; Chen, L.Q.; Zhang, X.Q.; Xie, L.F.; He, L.Y.; Ma, X.; et al. A mutation in Thermosensitive Male Sterile 1, encoding a heat shock protein with DnaJ and PDI domains, leads to thermosensitive gametophytic male sterility in Arabidopsis. Plant J. 2009, 57, 870–882. [Google Scholar] [CrossRef]
- Ma, Z.X.; Leng, Y.J.; Chen, G.X.; Zhou, P.M.; Ye, D.; Chen, L.Q. The thermosensitive male sterile 1 interacts with the BiPs via DnaJ domain and stimulates their ATPase enzyme activities in Arabidopsis. PLoS ONE 2015, 10, e0132500. [Google Scholar] [CrossRef]
- Yamamoto, M.; Uji, S.; Sugiyama, T.; Sakamoto, T.; Kimura, S.; Endo, T.; Nishikawa, S.-i. ERdj3B-mediated quality control maintains anther development at high temperatures. Plant Physiol. 2020, 182, 1979–1990. [Google Scholar] [CrossRef] [PubMed]
- Studer, A.; Zhao, Q.; Ross-Ibarra, J.; Doebley, J. Identification of a functional transposon insertion in the maize domestication gene tb1. Nat. Genet. 2011, 43, 1160–1163. [Google Scholar] [CrossRef] [PubMed]
- Kuang, T.H.; Hu, C.; Shaw, R.K.; Zhang, Y.D.; Fan, J.; Bi, Y.Q.; Jiang, F.Y.; Guo, R.J.; Fan, X.M. A potential candidate gene associated with the angles of the ear leaf and the second leaf above the ear leaf in maize. BMC Plant Biol. 2023, 23, 540. [Google Scholar] [CrossRef] [PubMed]
- Zhang, L.Y.; Hu, J.; Han, X.L.; Li, J.J.; Gao, Y.; Richards, C.M.; Zhang, C.X.; Tian, Y.; Liu, G.M.; Gul, H.; et al. A high-quality apple genome assembly reveals the association of a retrotransposon and red fruit colour. Nat. Commun. 2019, 10, 1494. [Google Scholar] [CrossRef] [PubMed]
- Voss-Fels, K.P.; Cooper, M.; Hayes, B.J. Accelerating crop genetic gains with genomic selection. Theor. Appl. Genet. 2019, 132, 669–686. [Google Scholar] [CrossRef] [PubMed]
- Zhang, A.; Wang, H.W.; Beyene, Y.; Semagn, K.; Liu, Y.B.; Cao, S.L.; Cui, Z.H.; Ruan, Y.Y.; Burgueño, J.; San Vicente, F.; et al. Effect of trait heritability, training population size and marker density on genomic prediction accuracy estimation in 22 bi-parental tropical maize populations. Front. Plant Sci. 2017, 8, 1916. [Google Scholar] [CrossRef] [PubMed]
- Liu, X.G.; Wang, H.W.; Wang, H.; Guo, Z.F.; Xu, X.J.; Liu, J.C.; Wang, S.H.; Li, W.X.; Zou, C.; Prasanna, B.M.; et al. Factors affecting genomic selection revealed by empirical evidence in maize. Crop J. 2018, 6, 341–352. [Google Scholar] [CrossRef]
- Knapp, S.J.; Stroup, W.W.; Ross, W.M. Exact Confidence Intervals for Heritability on a Progeny Mean Basis 1. Crop Sci. 1985, 25, 192–194. [Google Scholar] [CrossRef]
- Stewart, C.N.; Via, L.E. A rapid CTAB DNA isolation technique useful for RAPD fingerprinting and other PCR applications. Bio. Tech. 1993, 14, 748–751. [Google Scholar]
- Saghai Maroof, M.A.; Biyashev, R.M.; Yang, G.P.; Zhang, Q.; Allard, R.W. Extraordinarily polymorphic microsatellite DNA in barley: Species diversity, chromosomal locations, and population dynamics. Proc. Natl. Acad. Sci. USA 1994, 91, 5466–5470. [Google Scholar] [CrossRef]
- Jiao, Y.P.; Peluso, P.; Shi, J.H.; Liang, T.; Stitzer, M.C.; Wang, B.; Campbell, M.S.; Stein, J.C.; Wei, X.H.; Chin, C.S.; et al. Improved maize reference genome with single-molecule technologies. Nature 2017, 546, 524–527. [Google Scholar] [CrossRef]
- McKenna, A.; Hanna, M.; Banks, E.; Sivachenko, A.; Cibulskis, K.; Kernytsky, A.; Garimella, K.; Altshuler, D.; Gabriel, S.; Daly, M.; et al. The Genome Analysis Toolkit: A MapReduce framework for analyzing next-generation DNA sequencing data. Genome Res. 2010, 20, 1297–1303. [Google Scholar] [CrossRef]
- Wang, K.; Li, M.Y.; Hakonarson, H. ANNOVAR: Functional annotation of genetic variants from high-throughput sequencing data. Nucleic Acids Res. 2010, 38, e164. [Google Scholar] [CrossRef]
- Holm, S. A simple sequentially rejective multiple test procedure. Scand. J. Stat. 1979, 6, 65–70. [Google Scholar]
- Zhang, X.; Ren, Z.Y.; Luo, B.W.; Zhong, H.X.; Ma, P.; Zhang, H.K.; Hu, H.M.; Wang, Y.K.; Zhang, H.Y.; Liu, D.; et al. Genetic architecture of maize yield traits dissected by QTL mapping and GWAS in maize. Crop J. 2022, 10, 436–446. [Google Scholar] [CrossRef]


| Population | Environment | Mean | Standard Deviation | Skewness | Kurtosis | Coefficient of Variation | Min–Max | Heritability (%) |
|---|---|---|---|---|---|---|---|---|
| Pop1 | 21YS | 1.95 | 0.67 | 0.4 | 0.27 | 0.34 | 0.21–4.08 | 33.10 |
| 22JH | 2.06 | 0.77 | 0.62 | 0.34 | 0.38 | 0.34–4.44 | ||
| 22YS | 1.79 | 0.56 | 0.37 | –0.1 | 0.31 | 0.72–3.28 | ||
| Pop2 | 21YS | 2.89 | 1.08 | 0.38 | –0.25 | 0.37 | 0.90–5.74 | 33.00 |
| 22JH | 2.74 | 0.86 | 0.41 | –0.27 | 0.31 | 0.90–5.03 | ||
| 22YS | 2.49 | 0.9 | 0.6 | 0.15 | 0.36 | 0.44–5.04 | ||
| Pop3 | 21YS | 2.21 | 0.71 | 0.22 | 0.01 | 0.32 | 0.70–4.50 | 33.20 |
| 22JH | 2.51 | 0.91 | 0.48 | 0.44 | 0.36 | 0.47–5.38 | ||
| 22YS | 2.27 | 0.82 | 0.39 | –0.07 | 0.36 | 0.60–4.88 | ||
| Pop4 | 21YS | 2.05 | 0.63 | 0.1 | –0.29 | 0.31 | 0.62–4.01 | 33.40 |
| 22JH | 2.34 | 0.79 | 0.09 | –0.48 | 0.34 | 0.52–4.14 | ||
| 22YS | 2.04 | 0.8 | 0.66 | 0.89 | 0.39 | 0.48–5.01 |
| Environment | Chromosome | SNP Position | Ref/Alt | p Value | Effect |
|---|---|---|---|---|---|
| 2021Yanshan (21YS) | 1 | 180672691 | G/A | 6.68 × 10⁻⁵ | 0.385 |
| 1 | 180672694 | G/A | 2.39 × 10⁻⁵ | 0.436 | |
| 2 | 158368933 | A/G | 9.90 × 10⁻⁵ | 0.279 | |
| 3 | 226041015 | C/T | 8.13 × 10⁻⁶ | −0.440 | |
| 9 | 51490213 | G/T | 1.11 × 10⁻⁴ | 0.274 | |
| 9 | 51490247 | G/A | 7.68 × 10⁻⁵ | 0.278 | |
| 9 | 51490264 | G/T | 1.06 × 10⁻⁴ | 0.274 | |
| 10 | 12395326 | T/C | 3.37 × 10⁻⁵ | 1.934 | |
| 2022Jinghong (22JH) | 3 | 226041015 | C/T | 1.28 × 10⁻⁴ | −0.398 |
| 8 | 137379725 | C/T | 1.29 × 10⁻⁴ | 0.372 | |
| 2022Yanshan (22YS) | 3 | 50835736 | T/C | 1.08 × 10⁻⁴ | 0.329 |
| 3 | 50835888 | G/A | 1.42 × 10⁻⁴ | 0.341 | |
| 3 | 50835891 | A/T | 1.42 × 10⁻⁴ | 0.341 | |
| 4 | 57322369 | A/T | 1.48 × 10⁻⁴ | 1.234 | |
| 4 | 122010523 | A/T | 2.33 × 10⁻⁵ | 0.265 | |
| 8 | 137379725 | C/T | 4.88 × 10⁻⁵ | 0.368 |
| SNP | Gene ID | Functional Annotation |
|---|---|---|
| S1_180672691 | Zm00001d031171 | Cactin |
| S1_180672694 | Zm00001d031173 | DnaJ protein ERDJ3A |
| S2_158368933 | Zm00001d005102 | Protein TONNEAU 1b |
| Zm00001d005103 | — | |
| S3_50835736 | Zm00001d040573 | B3 domain-containing transcription repressor VAL2 |
| S3_50835888 | Zm00001d040577 | — |
| S3_50835891 | ||
| S3_226041015 | Zm00001d044359 | — |
| Zm00001d044362 | Shaggy-related protein kinase alpha | |
| S4_57322369 | Zm00001d049986 | Pentatricopeptide repeat-containing protein mitochondrial |
| Zm00001d049987 | Probable potassium transporter 4 | |
| S4_122010523 | Zm00001d050771 | Tetratricopeptide repeat (TPR)-like superfamily protein |
| Zm00001d050774 | CCR-like | |
| S8_137379725 | Zm00001d011048 | pre-mRNA-processing-splicing factor 8A |
| Zm00001d011049 | — | |
| S9_51490213 | Zm00001d045978 | Protein MICRORCHIDIA 6 |
| S9_51490247 | ||
| S9_51490264 | ||
| S10_12395326 | Zm00001d023619 | Mono-/di-acylglycerol lipase N-terminal; Lipase class 3 |
| Zm00001d023620 | — |
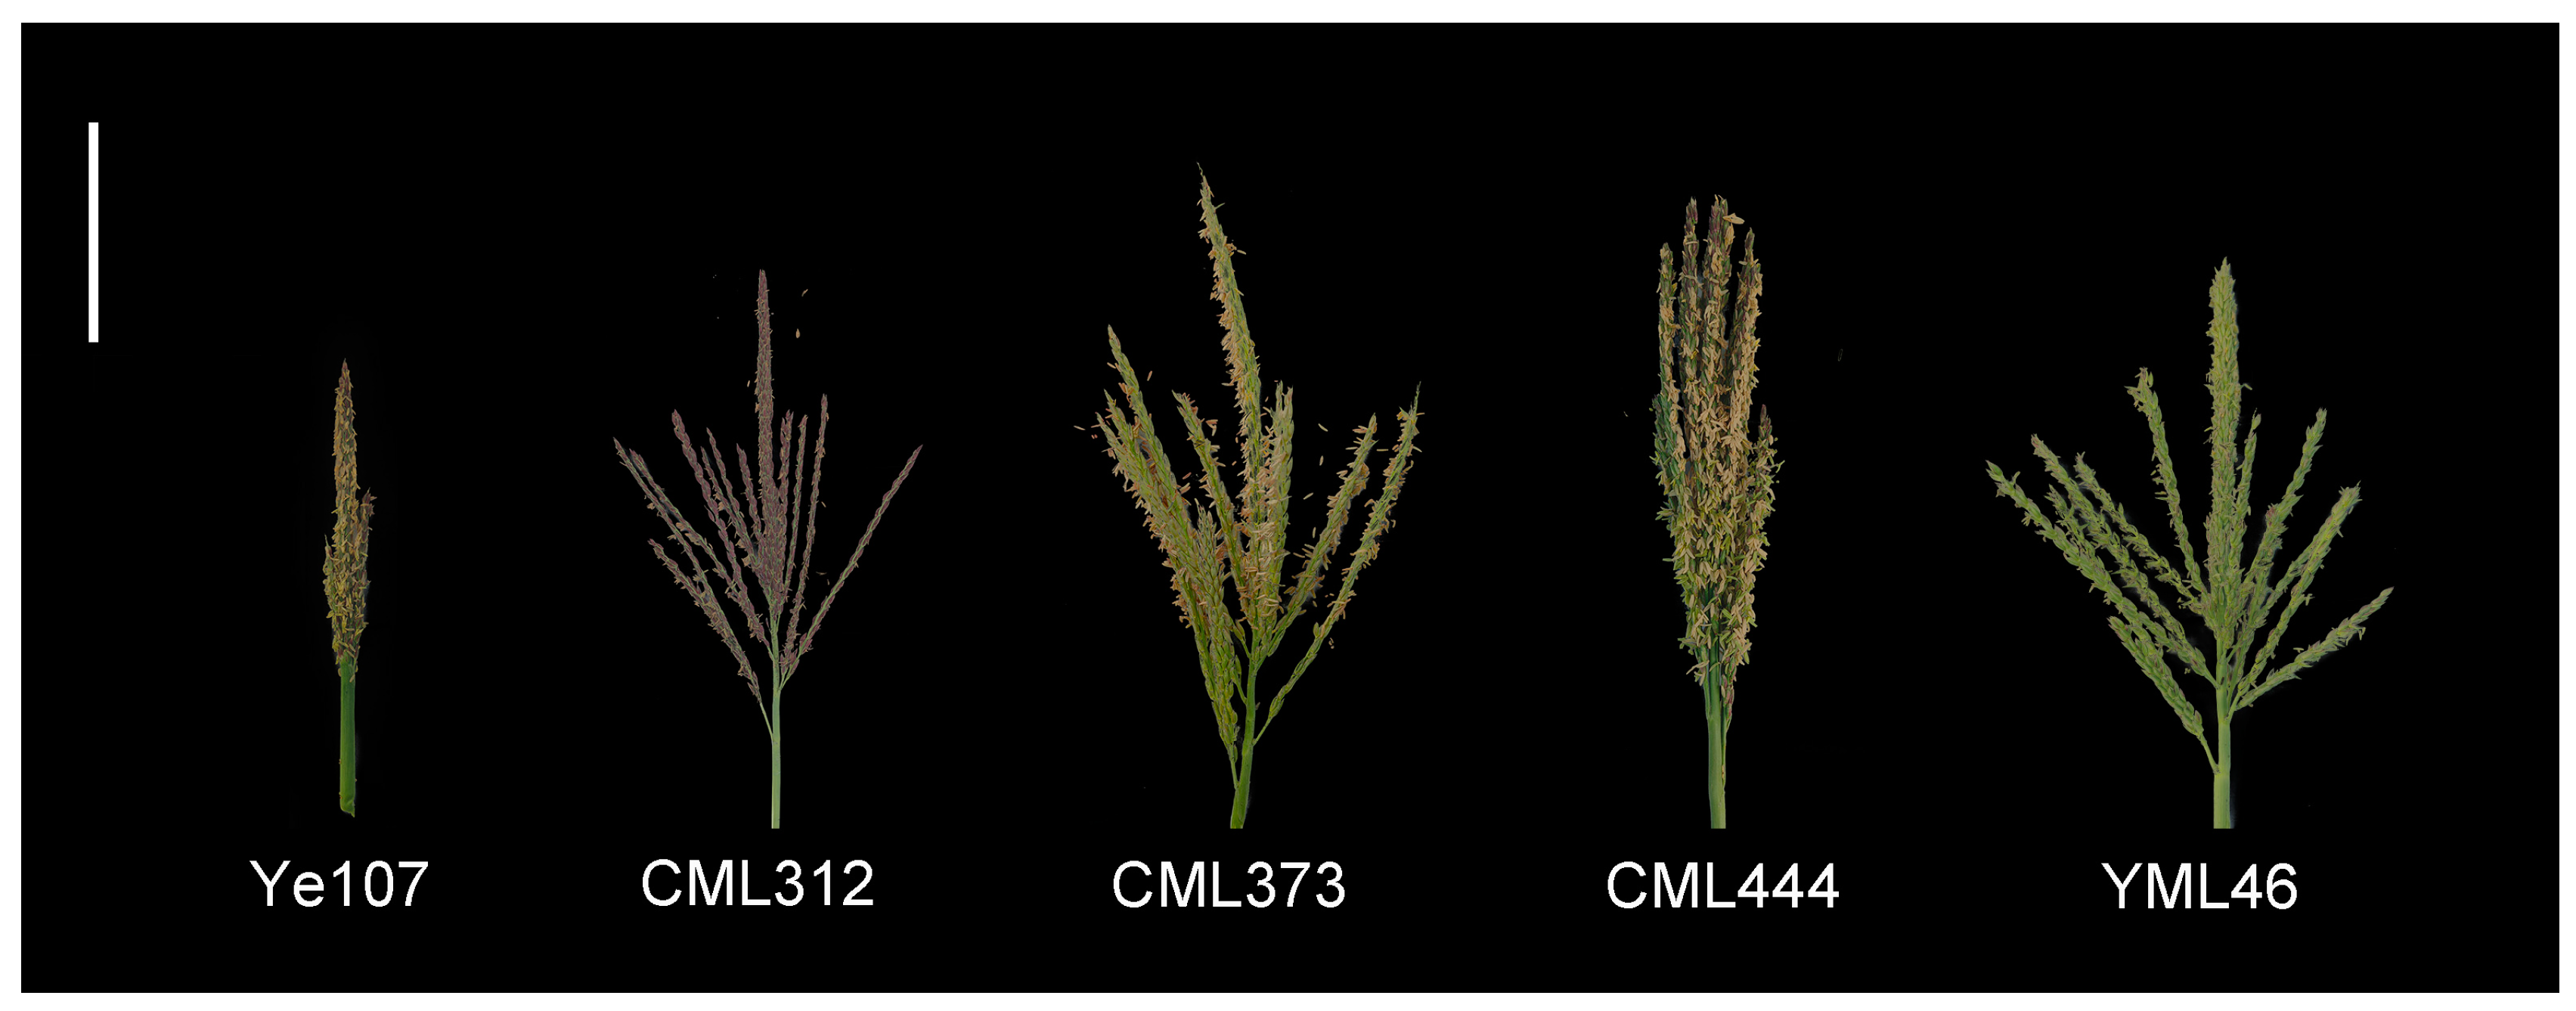
| Parent | Pedigree | Heterotic Group | Ecological Type |
|---|---|---|---|
| Ye107 | Selected from US hybrid DeKalb XL80 | Reid | Temperate |
| CML312 | S89500-F2-2-2-1-1-B | Non-Reid | Tropical |
| CML373 | P43SR-4-1-1-2-1-B-8-1-B | Non-Reid | Tropical |
| CML444 | P43C9-1-1-1-1-1-BBBB | Non-Reid | Tropical |
| YML46 | SW1-1-1-2-1-2-1 | Suwan | Tropical |
Disclaimer/Publisher’s Note: The statements, opinions and data contained in all publications are solely those of the individual author(s) and contributor(s) and not of MDPI and/or the editor(s). MDPI and/or the editor(s) disclaim responsibility for any injury to people or property resulting from any ideas, methods, instructions or products referred to in the content. |
© 2024 by the authors. Licensee MDPI, Basel, Switzerland. This article is an open access article distributed under the terms and conditions of the Creative Commons Attribution (CC BY) license (https://creativecommons.org/licenses/by/4.0/).
Share and Cite
Liu, M.; Zhang, Y.; Shaw, R.K.; Zhang, X.; Li, J.; Li, L.; Li, S.; Adnan, M.; Jiang, F.; Bi, Y.; et al. Genome-Wide Association Study and Prediction of Tassel Weight of Tropical Maize Germplasm in Multi-Parent Population. Int. J. Mol. Sci. 2024, 25, 1756. https://doi.org/10.3390/ijms25031756
Liu M, Zhang Y, Shaw RK, Zhang X, Li J, Li L, Li S, Adnan M, Jiang F, Bi Y, et al. Genome-Wide Association Study and Prediction of Tassel Weight of Tropical Maize Germplasm in Multi-Parent Population. International Journal of Molecular Sciences. 2024; 25(3):1756. https://doi.org/10.3390/ijms25031756
Chicago/Turabian StyleLiu, Meichen, Yudong Zhang, Ranjan K. Shaw, Xingjie Zhang, Jinfeng Li, Linzhuo Li, Shaoxiong Li, Muhammad Adnan, Fuyan Jiang, Yaqi Bi, and et al. 2024. "Genome-Wide Association Study and Prediction of Tassel Weight of Tropical Maize Germplasm in Multi-Parent Population" International Journal of Molecular Sciences 25, no. 3: 1756. https://doi.org/10.3390/ijms25031756