Article

Anti-Melanoma Effects of Miconazole: Investigating the Mitochondria Involvement

by
Francesca Scatozza
,
Maria Miriam Giardina
,
Carola Valente
,
Virginia Vigiano Benedetti
and
Antonio Facchiano
*
Istituto Dermopatico dell’Immacolata, IDI-IRCCS, 00167 Rome, Italy
*
Author to whom correspondence should be addressed.
Int. J. Mol. Sci. 2024, 25(7), 3589; https://doi.org/10.3390/ijms25073589
Submission received: 31 January 2024 / Revised: 15 March 2024 / Accepted: 18 March 2024 / Published: 22 March 2024
(This article belongs to the Special Issue Advances in Melanoma and Skin Cancers)

Abstract

:
Miconazole is an antimycotic drug showing anti-cancer effects in several cancers. However, little is known on its effects in melanoma. A375 and SK-MEL-28 human melanoma cell lines were exposed to miconazole and clotrimazole (up to 100 mM). Proliferation, viability with MTT assay and vascular mimicry were assayed at 24 h treatment. Molecular effects were measured at 6 h, namely, ATP-, ROS-release and mitochondria-related cytofluorescence. A metabolomic profile was also investigated at 6 h treatment. Carnitine was one of the most affected metabolites; therefore, the expression of 29 genes involved in carnitine metabolism was investigated in the public platform GEPIA2 on 461 melanoma patients and 558 controls. After 24 h treatments, miconazole and clotrimazole strongly and significantly inhibited proliferation in the presence of 10% serum on either melanoma cell lines; they also strongly reduced viability and vascular mimicry. After 6 h treatment, ATP reduction and ROS increase were observed, as well as a significant reduction in mitochondria-related fluorescence. Further, in A375, miconazole strongly and significantly altered expression of several metabolites including carnitines, phosphatidyl-cholines, all amino acids and several other small molecules, mostly metabolized in mitochondria. The expression of 12 genes involved in carnitine metabolism was found significantly modified in melanoma patients, 6 showing a significant impact on patients’ survival. Finally, miconazole antiproliferation activity on A375 was found completely abrogated in the presence of carnitine, supporting a specific role of carnitine in melanoma protection toward miconazole effect, and was significantly reversed in the presence of caspases inhibitors such as ZVAD-FMK and Ac-DEVD-CHO, and a clear pro-apoptotic effect was observed in miconazole-treated cells, by FACS analysis of Annexin V-FITC stained cells. Miconazole strongly affects proliferation and other biological features in two human melanoma cell lines, as well as mitochondria-related functions such as ATP- and ROS-release, and the expression of several metabolites is largely dependent on mitochondria function. Miconazole, likely acting via carnitine and mitochondria-dependent apoptosis, is therefore suggested as a candidate for further investigations in melanoma treatments.

1. Introduction

Melanoma is the most aggressive skin cancer. According to the American Cancer Society, about one hundred thousand new melanoma cases are diagnosed in USA each year with about eight thousand deaths, mostly in men (https://www.cancer.org/cancer/types/melanoma-skin-cancer/about/key-statistics.html, accessed on 10 March 2024). These numbers are similar in Europe. Relevant improvements have emerged recently in melanoma treatment, based on the re-activation of the immune response against the tumor (immunotherapy) and on the use of drugs targeting specific molecules (targeted therapy). Such new treatments have significantly improved overall survival; however, advanced stages of this cancer still have poor prognosis. Therefore, the identification of novel effective approaches in melanoma is still urgently needed; this is related to the high costs of the available treatments and to the recurrence risk associated to molecular adaptation mechanisms [1]. To this aim, drug repositioning strategies may represent a particularly interesting approach. Investigating, in a specific setup, drugs developed for other clinical conditions, represents a promising field, since pharmacokinetic and toxicological profiles of such drugs are known, making faster and less expensive their application in clinics, with indubitable benefits for patients and for the national health systems [2]. Miconazole has strong antimycotic activity and is known from the early seventies [3,4]. However, while clinical applications are mainly antimycotic, the mechanism of action involves inhibition of CYP450 [5,6], which plays a key role in several fundamental processes such as estrogen oxidation [7], control of metabolism and activity of many drugs [8], vitamin D metabolism [9], cell survival and proliferation [10]. A potential role of CYP450 has been suggested in several pathological conditions [11,12,13,14,15] and several cancer types [16,17,18,19,20,21,22,23,24,25,26], including melanoma [27]. This indicates how miconazole may affect several overlapping targets relevant in several pathological conditions, in addition to mycotic infections. We have recently shown for the first time that miconazole has a strong anti-melanoma effect in vitro, showing both a relevant dose-dependent inhibition of serum-induced proliferation and a marked cell death inducing effect [28]. In that study, we also showed that miconazole strongly increases its antimelanoma effect in KCNN2 silenced cells, indicating its activity as strongly regulated by the K+ ion channel KCNN2. This is consistent with the known ability of miconazole to target ion channels [29,30]. The known property of miconazole to preferentially target the skin [31], along with studies performed to increase its skin delivery [32,33], makes this molecule a relevant drug in skin diseases and an interesting new candidate in melanoma treatment. In the present study, we investigated how human melanoma cells (namely, A375 and SK-MEL-28) respond to miconazole and to an additional antimycotic molecule, namely clotrimazole. They belong to the same Azoles antimycotic drugs; however, while they may share common targets, strong differences in the biological effects are expected due to the different number of chlorides and rings and the presence of the oxygen at the hinge of the rings. We investigated biological response after 24 h treatment, namely proliferation, viability, and vascular mimicry. We then investigated molecular mechanisms underlying these biological effects by addressing, after 6 h treatment, mitochondria fluorescence, mitochondria-related functions such as ATP and ROS release, and the metabolic response, via a large metabolomics profile.

2. Results

We preliminarily investigated the antiproliferative effect of 4 azoles antifungal molecules, namely, fluconazole, voriconazole, miconazole and clotrimazole. Preliminary analyses indicated that fluconazole and voriconazole show no antiproliferative effects on either A375 and SK-MEL-28 human melanoma cells in 24 h treatment experiments at a dose range up to 100 μM (see Supplementary Materials Figure S1). On the contrary, miconazole and clotrimazole showed significant antiproliferative effects and were then investigated in further detail. Miconazole and clotrimazole effects were then investigated in more detail on human melanoma cells (A375 and SK-MEL-28), after 24 h treatments, to measure biological effects such as viability, proliferation and vascular mimicry. In addition, early effects were also investigated after 6 h treatment, to measure upstream effects likely related to the molecular mechanism of action.

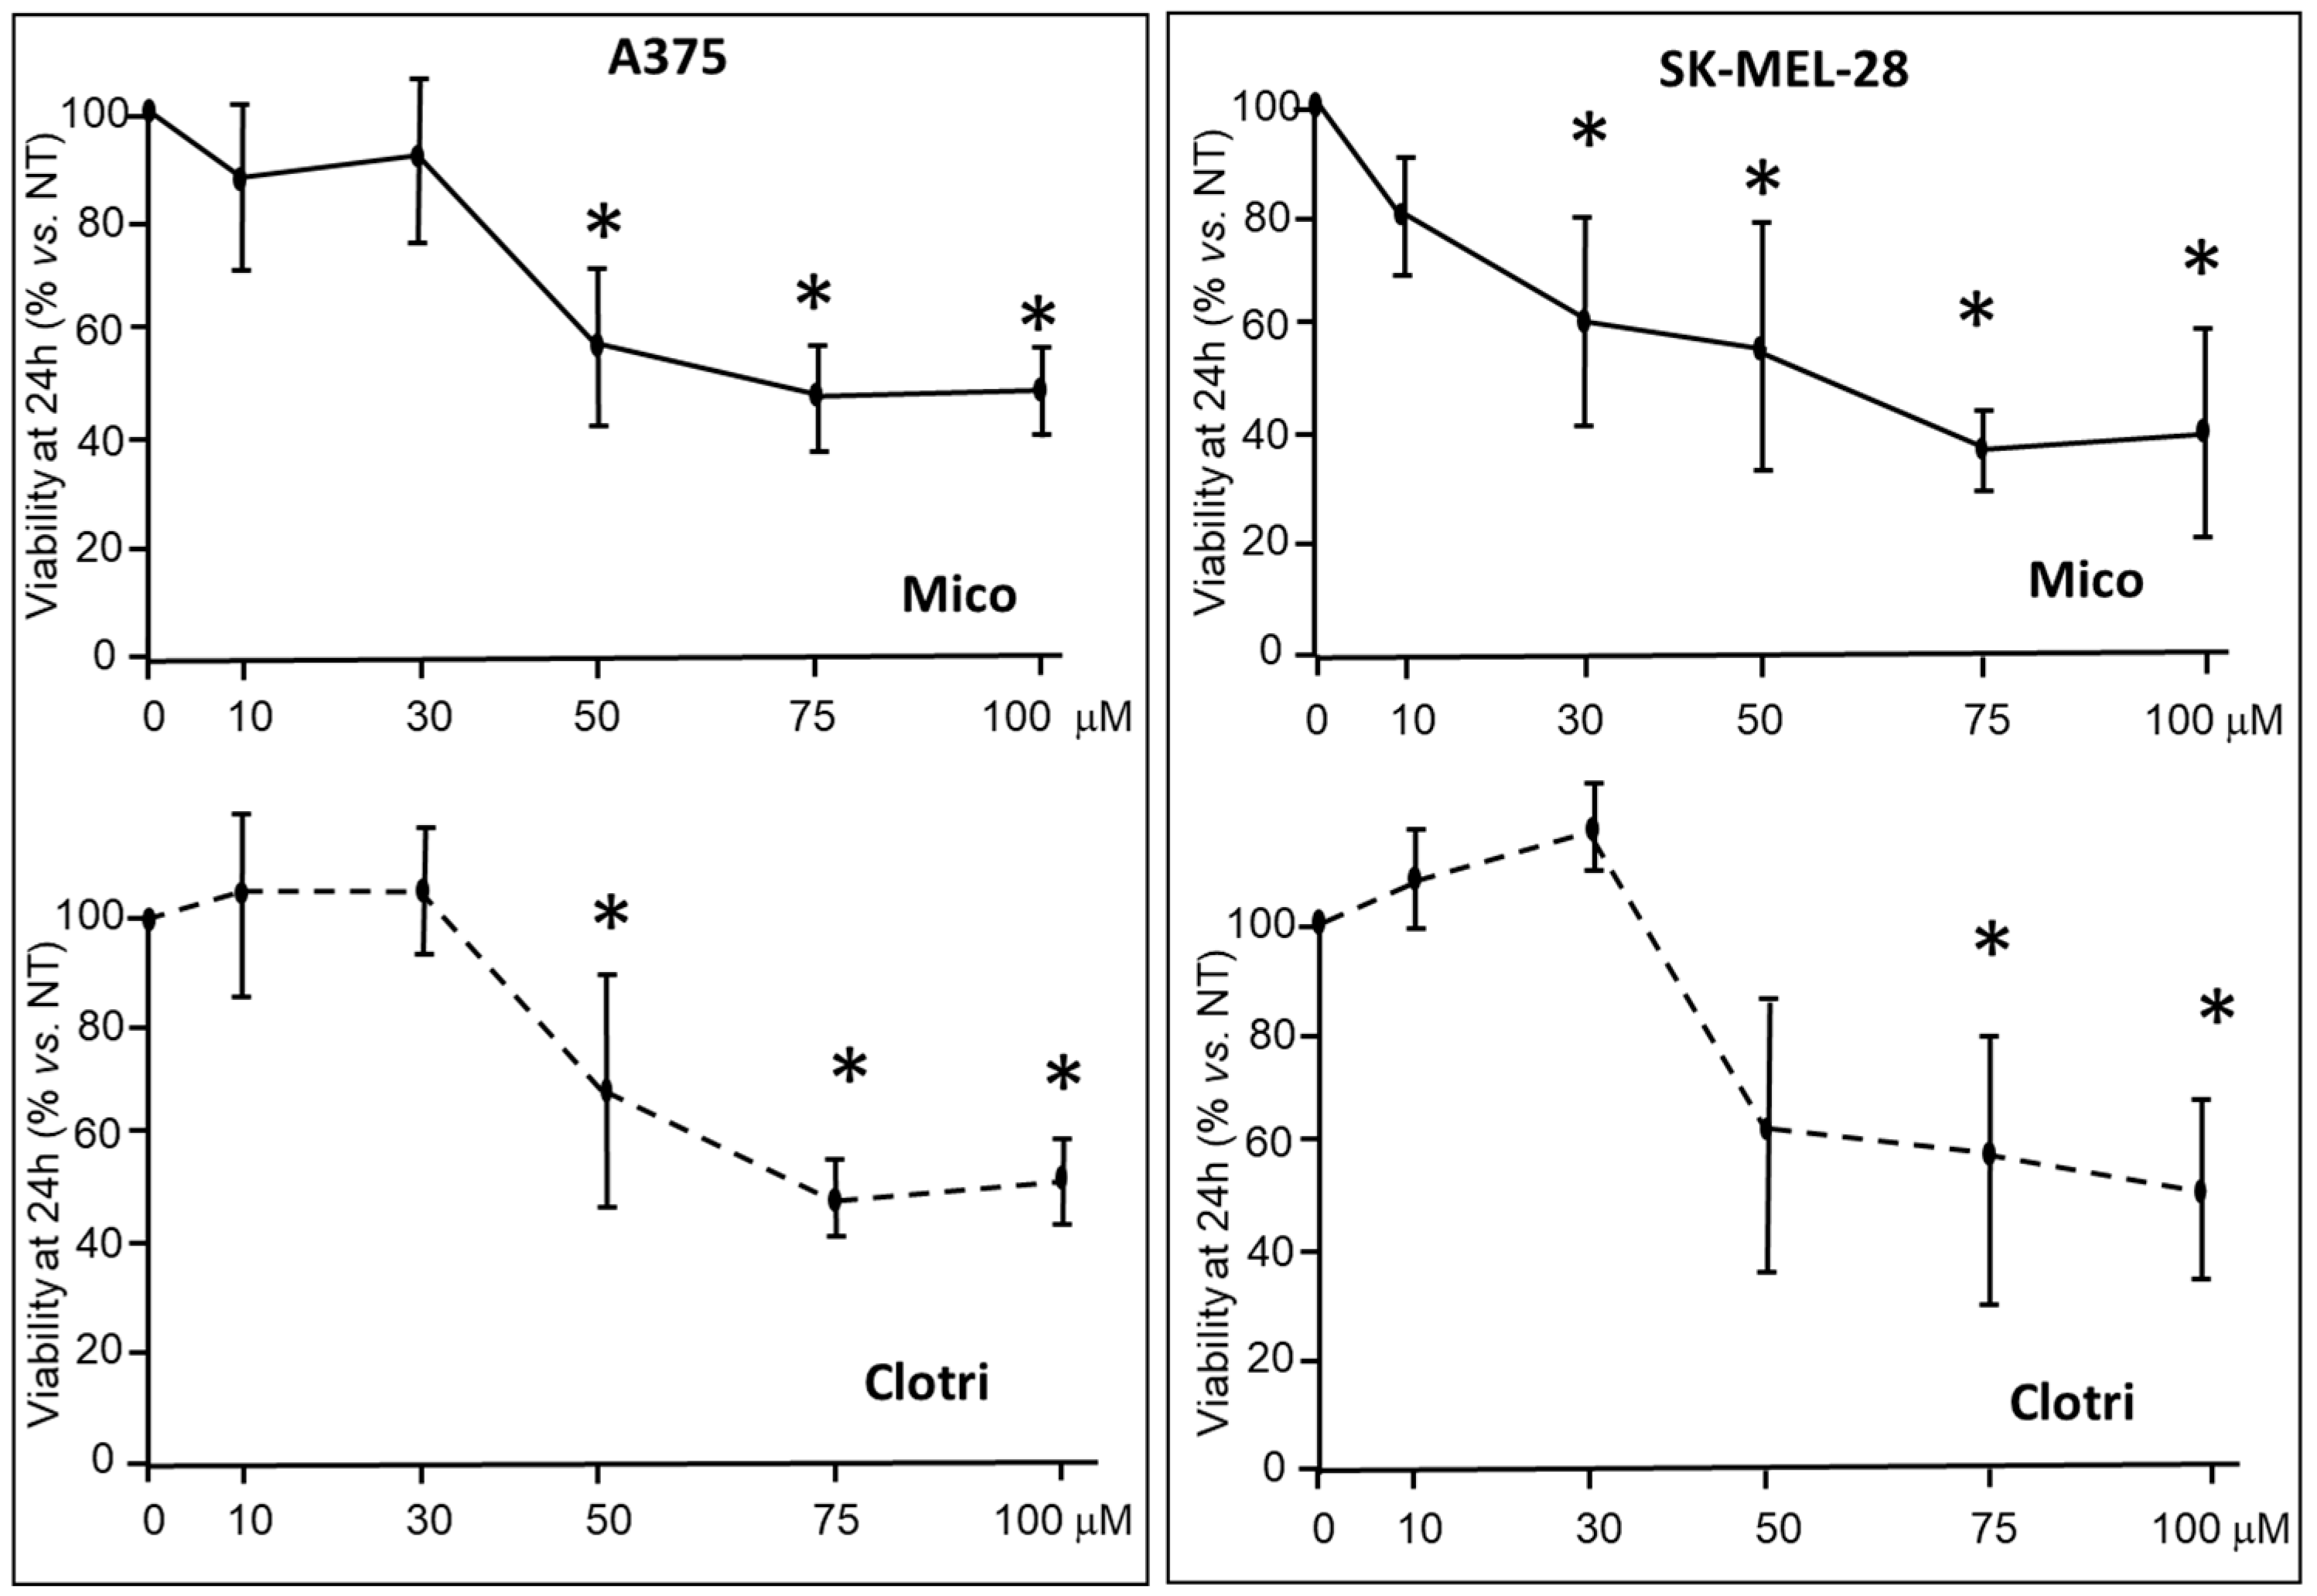
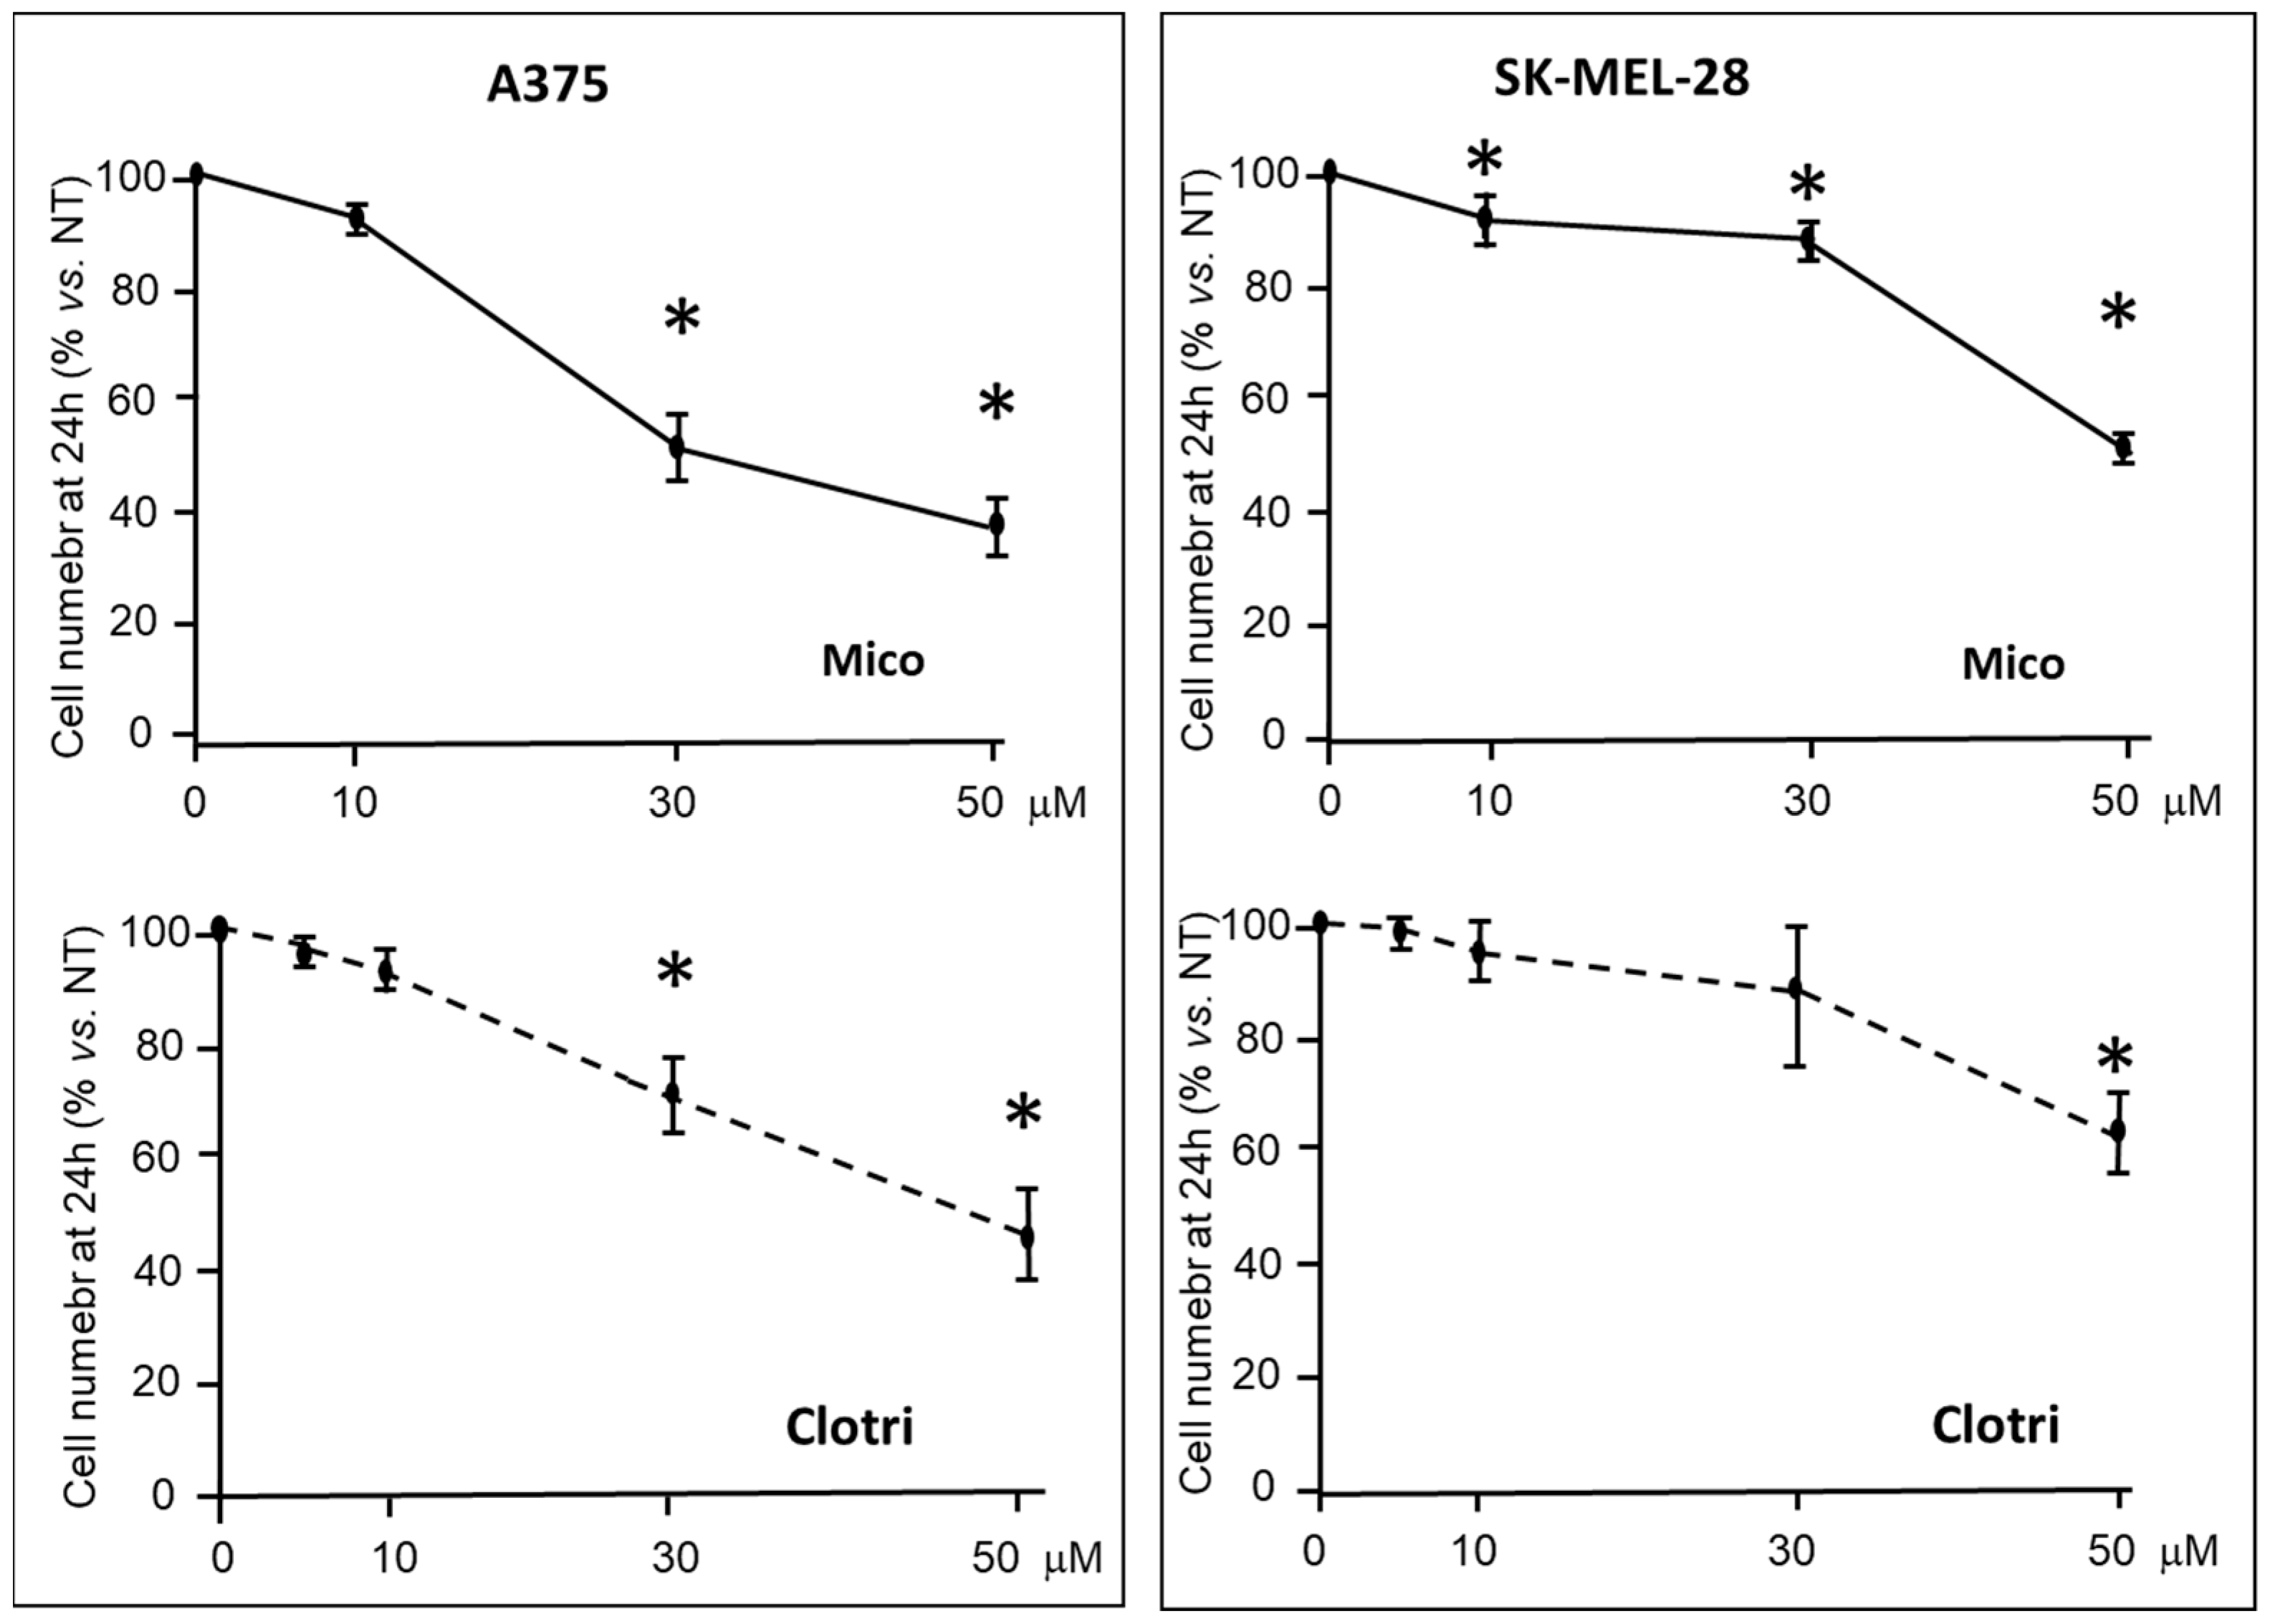
2.1. Effects at 24 h: Viability, Proliferation, Vascular Mimicry

2.1.1. Viability and Proliferation

A375 and SK-MEL-28 cells were treated with increasing miconazole and clotrimazole doses, in the presence of 10% FBS, and the viability was measured after 24 h treatment. As reported in Figure 1, the MTT assay, carried out as reported [34], reveals significant viability reduction in either cell types, with miconazole showing an effect similar to clotrimazole. Based on this experiment, miconazole and clotrimazole show IC50 of 32.5 and 47.9 μM, respectively.
In proliferation assays, A375 and SK-MEL-28 cells were treated with increasing doses of miconazole or clotrimazole in the presence of 10% FBS. Cell number was counted at 24 h. Figure 2 shows that both miconazole and clotrimazole significantly reduce cell number in a dose-dependent manner.
Supplementary Materials Figure S2 shows representative fields of A375 and SK-MEL-28 cells, respectively, at 24 h and 48 h treatments, exposed to miconazole, in dose-dependence experiments. These images show time- and dose-dependent antiproliferation effects in either cell types.

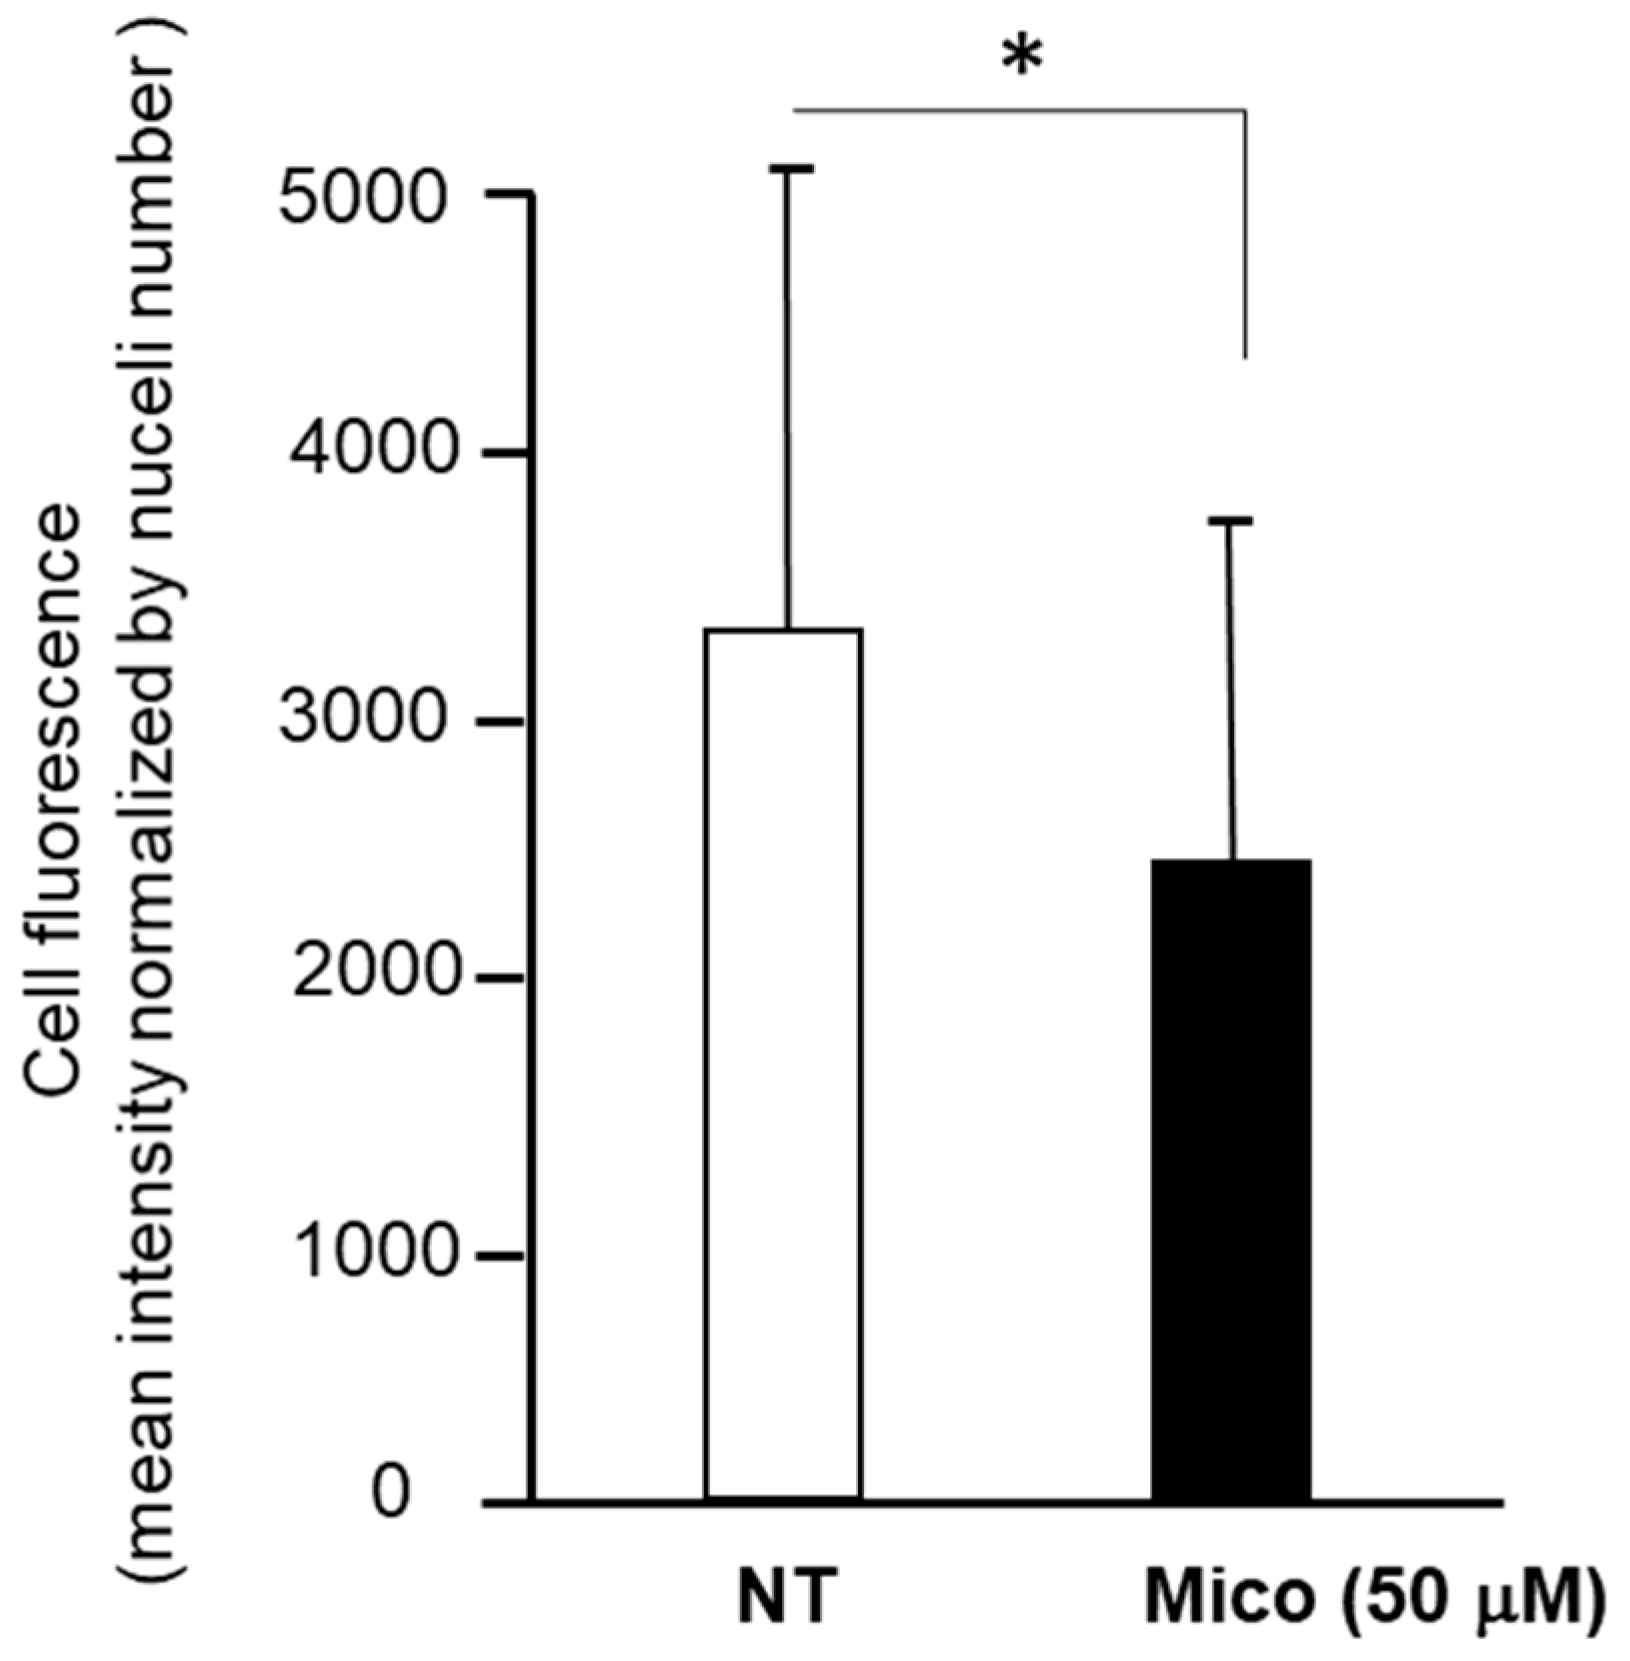
2.1.2. Vasculogenic Mimicry

Vasculogenic mimicry is often investigated in melanoma in vitro experimental set-up, as well as in other cancer types. We then investigated the effect of miconazole and clotrimazole 24 h treatment on vessel-like structures formation. Under our experimental conditions, A375 cells show a poor vasculogenic mimicry behavior; we therefore focused on SK-MEL-28. As shown in Figure 3, under normal conditions, Matrigel-seeded cells adopt a chord-like phenotype and form an arborizing pattern, while under miconazole or clotrimazole treatment, an evident reduction in vessel-like channel formations occurs. Figure 3A reports a quantification of the arborizing pattern as indicated in the Materials and Methods section and indicates a strong and significant dose-dependent reduction in vessel-like formations under either miconazole or clotrimazole treatment. Under these experimental conditions, miconazole appears to be more potent as compared to clotrimazole.

2.2. Effects at 6 h: ATP, ROS, Mitochondria and Metabolomics

2.2.1. ATP and ROS Levels

ATP levels were measured in A375 and SK-MEL-28 cells. Figure 4 shows that ATP levels are significantly reduced upon 6 h treatment either with miconazole and clotrimazole, in a dose-dependent way. Miconazole appears as effective or more potent than clotrimazole.
ROS levels were then measured on either cell types treated with miconazole and clotrimazole. Figure 5 shows dose-dependent experiments indicating a significant increase in ROS levels in A375 and SK-MEL-28 cells upon 6 h treatment with miconazole 50 μM, while clotrimazole shows a moderate not-significant effect.

2.2.2. Mitochondria Investigation

As shown in Figure 4 and Figure 5, respectively, ATP and ROS levels are significantly modified after 6 h treatment with miconazole. This result may suggest a possible involvement of mitochondria, as discussed in the Discussion section. In preliminary experiments, SK-MEL-28 and A375 cells were then treated at different times, with miconazole and stained with the Biotracker™ 488 Green Mitochondria Dye. The whole fluorescence upon 6 h and 12 h treatment was measured at the Ensight fluorometer [35] and was found significantly reduced at 50 μM dose in either A375 cells and SK-MEL-28, as shown in Figure 6A and 6B, respectively, suggesting that miconazole may be able to significantly alter mitochondria-related cellular fluorescence as early as at 6 h treatment.
We then investigated confocal cytofluorescence of treated and untreated cells to have a single-cell picture of intracellular fluorescence using Biotracker™ 488 Green Mitochondria Dye. Confocal cytofluorescence analysis was carried out on SK-MEL-28 cells treated with DMSO alone for 6 h as control or with miconazole 50 μM dissolved in DMSO. Figure 7 shows one representative image of untreated cells (panel A) and one representative image of miconazole-treated cells (Panel B). A change in mitochondria-related fluorescence is evident in miconazole-treated cells, at 6 h, indicating a strong reduction in mitochondria-associated fluorescence, similar to the reduction in the whole fluorescence reported in Figure 6. This effect led us to hypothesize that the reduced cytoplasmic staining is related to the loss of mitochondria integrity or reduced mitochondria number or to mitochondria size-reduction.
Panel C and D of Figure 7 report the A and B images analyzed with the “Mitochondrial analyzer” tool to identify mitochondria. This tool was used as reported in more detail in the Material and Methods section. According to this analysis, a clear reduction in mitochondria signals appears.
Figure 8 reports the quantification of the cytofluorescence of the experiment depicted in Figure 7 from 30 fields of miconazole-treated and 30 fields of untreated cells. It indicates a significant reduction in mitochondria-associated fluorescence by confocal cytofluorescence. Data generating this graph are reported in Table S3.

2.2.3. Metabolomics Analysis

Miconazole effect on A375 melanoma cells metabolism was then investigated by measuring expression levels of metabolites and small molecules. The 30 μM dose was chosen, at 6 h treatment, vs. control (i.e., DMSO-treated cells). One thousand nineteen metabolites were under investigation; 443 were found at a level falling within the detection range (the complete list is reported in Table S1). Out of these, 83 significantly different levels of metabolites and metabolism indicators were identified, mostly carnitines, cholines, different lipid types and most amino acids. Table 1 reports all 83 significant differences identified. The multiple testing correction was performed according to Benjamini procedure [36], as detailed in the Methods section.
Within the top 15 metabolites and metabolism indicators most altered, carnitines C0, C2, C3, C4 and C5 (respectively, Carnitine, Acetylcarnitine, Propionylcarnitine, Butyrylcarnitine and Valerylcarnitine) were found significantly altered. At line 1 of Table 1, the ratio C4/C3, indicating Short-Chain Acyl-Coenzyme A Dehydrogenase Deficiency is shown as the most modified indicator (12.4-fold increase in treated samples vs. ctrl), while the third most modified (line 3) was the ratio C4/C2, indicating Isobutyryl Coenzyme A Dehydrogenase Deficiency (5.37-fold increase in treated samples vs. ctrl). In most cases, carnitine levels are much lower in the miconazole-treated cells, indicating reduced fatty acid oxidation, also indicated by the lower beta-oxidation ratio, for instance, line 38 indicates C2/C0 ratio reduced by 0.57-fold decrease in treated vs. ctrl. Other significant changes of carnitines ratio values are present (lines 51,53, 55, 78, 79, 81 in Table 1) also as absolute values of Carnitines expression (see lines 78, 81). Further, strong alteration in polyammines, putrescine and asparagine is found in the top 15 most altered metabolites, indicated in Table 1. Also, LDH activity was found largely modified (line 2 of Table 1), computed by the ratio of lactate to hexose, mainly caused by a significant reduction in hexose. This could indicate increased anaerobic glycolysis to counteract the reduced lipid oxidation. This also explains the increased glutaminolysis rate. Overall, Table 1 shows a strongly altered expression level of all amino acids, along with significant alteration of many fatty acids and poly-ammines levels. Notably, amino acids and fatty acids metabolism is mostly occurring at the mitochondrial levels, confirming an early strong alteration of mitochondria activity.
In conclusion, miconazole 6 h treatment strongly modifies the expression of many metabolites, including carnitines, many fatty acids and nearly all amino acids, in melanoma cells. Table S2 reports the metabolic role (according to documentation accompanying Biocrates MxP® Quant 500 XL kit) of the indicators shown in Table 1.

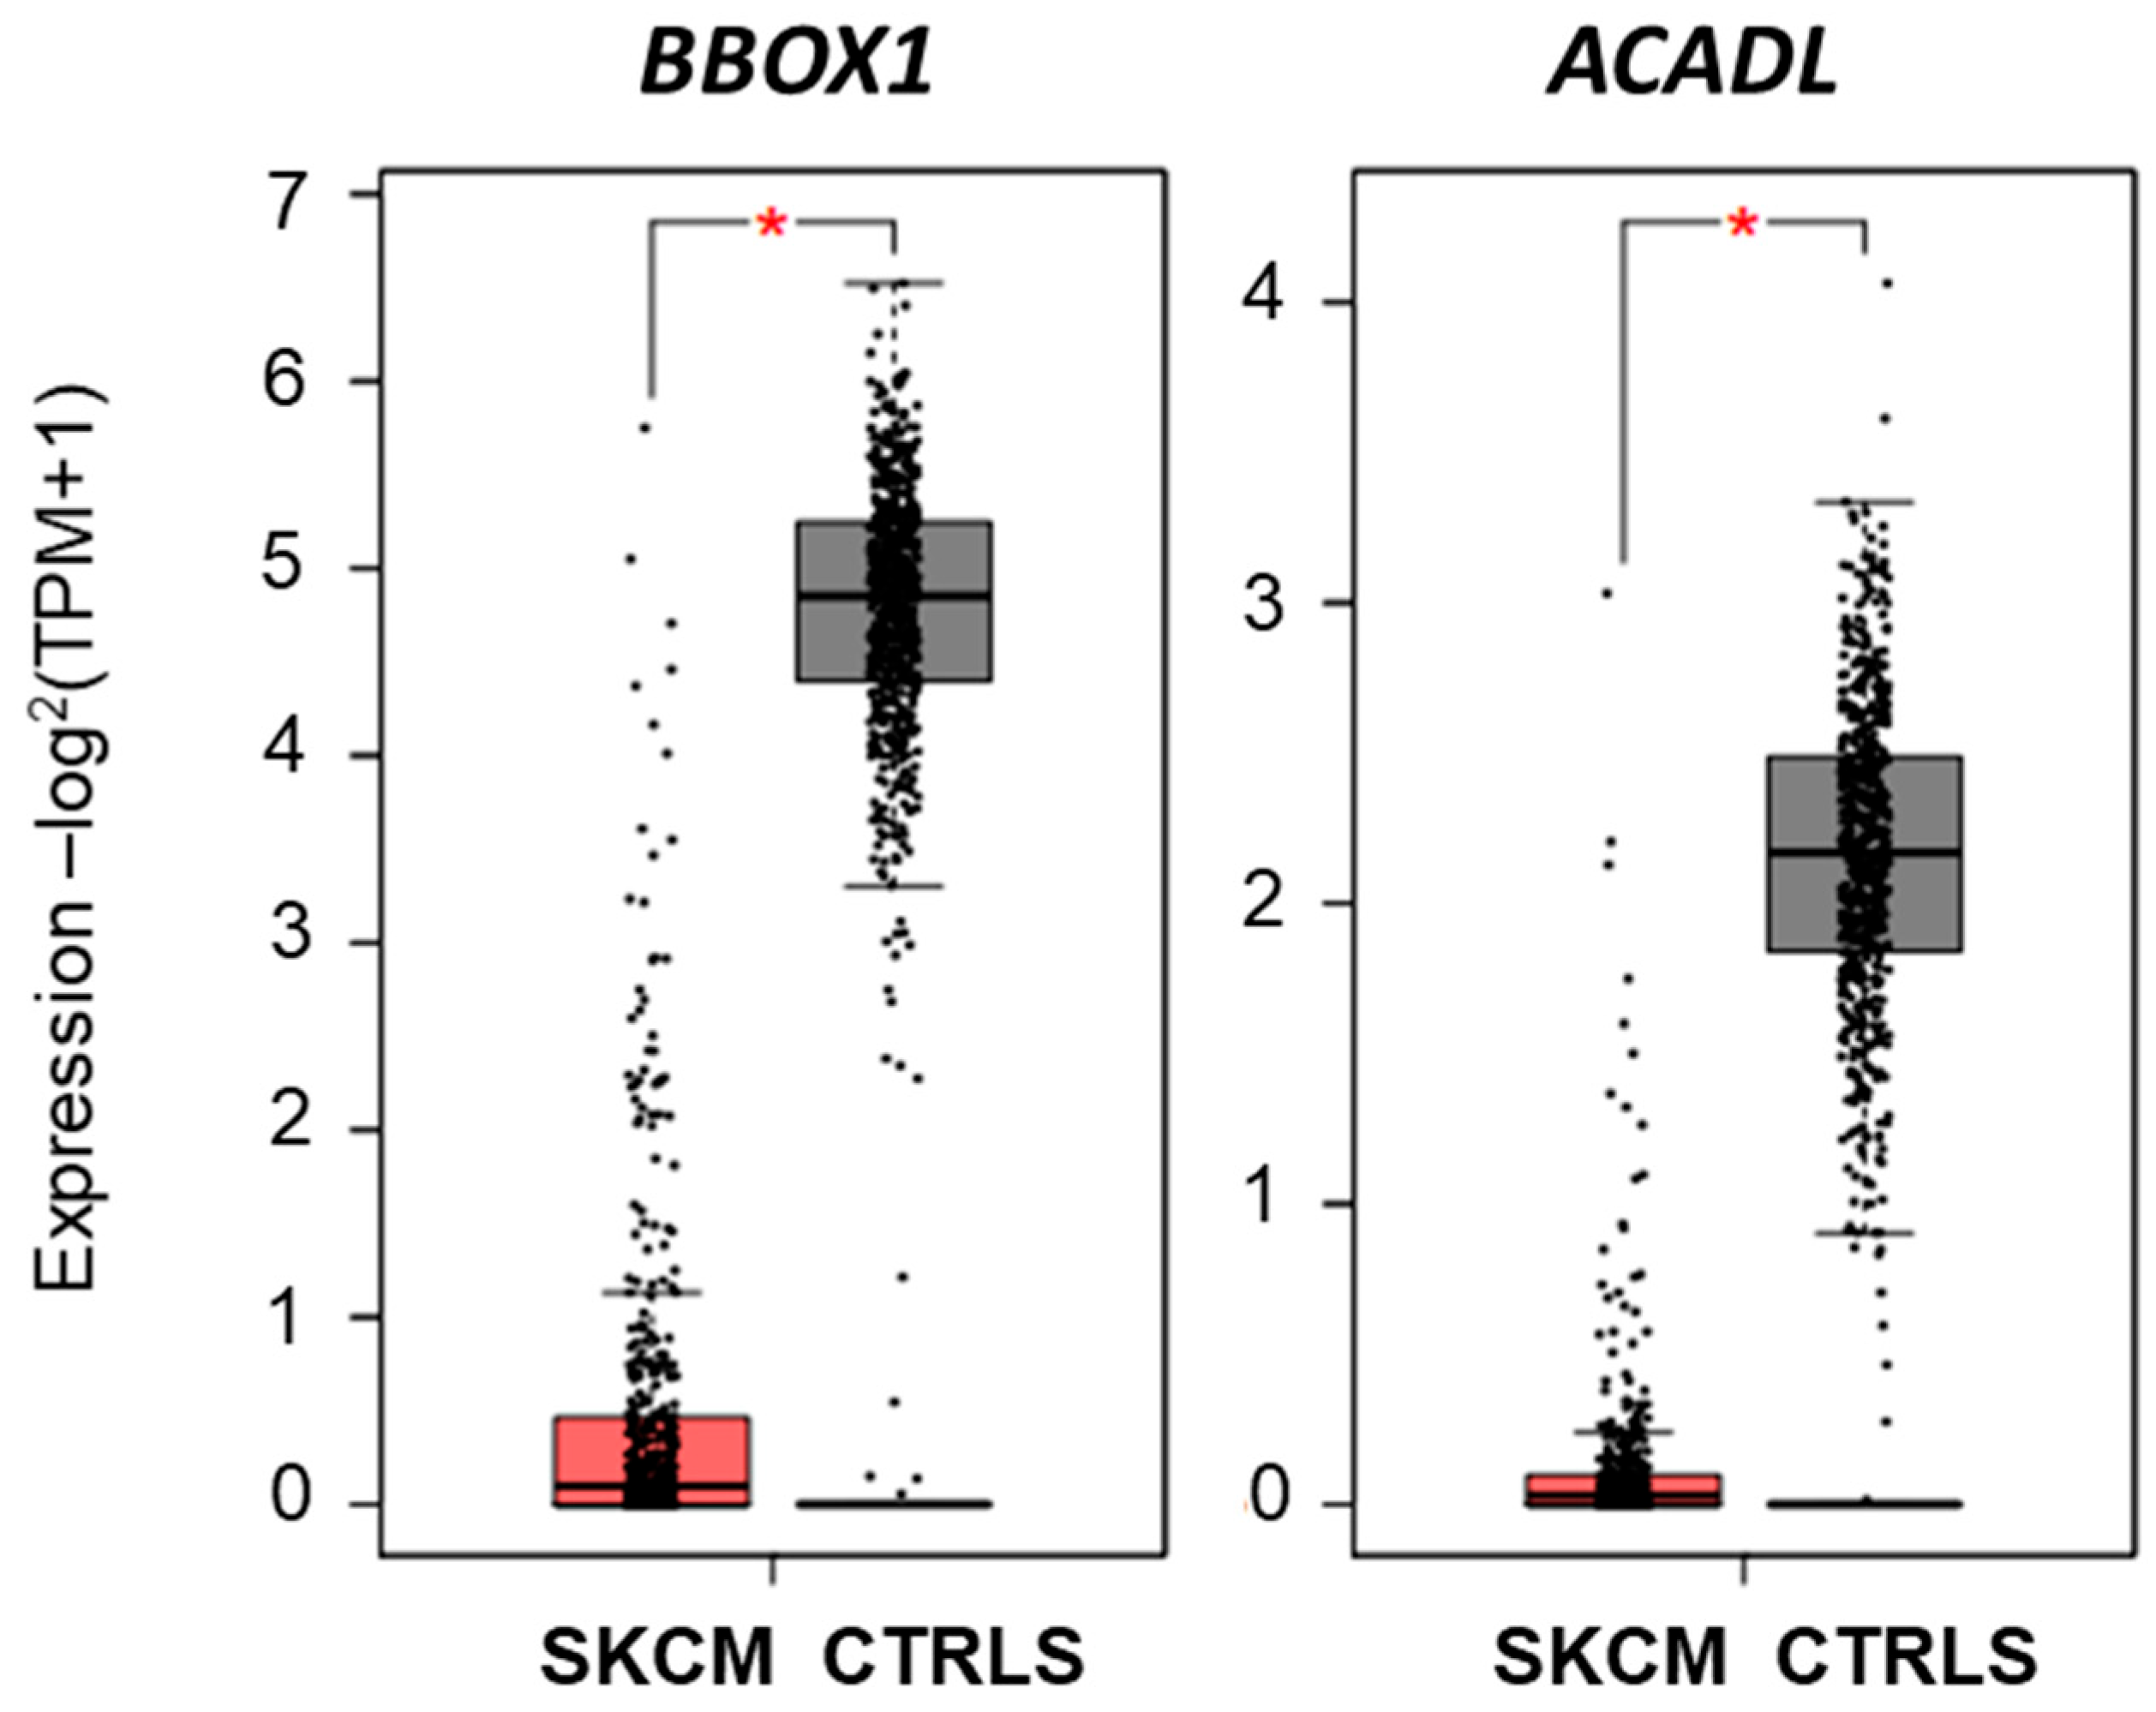
2.2.4. Investigating Carnitine’s Role

According to the metabolic effects reported in Table 1, several carnitine derivatives appear to be strongly affected in A375 exposed to 6 h miconazole 30 μM. Lines 1, 15, 18, 30, 38, 51, 55, 67, 78, 79 and 81 in Table 1 report significant alterations of carnitines expression or carnitine-derivatives ratios. We therefore hypothesized that carnitine metabolic balance may play a role in melanoma. The expression of 29 genes involved in carnitine metabolism was then investigated in 461 melanoma patients and 558 controls, in GEPIA2 platform (http://gepia2.cancer-pku.cn/#index, accessed on 10 November 2023). Table 2 shows that 12 carnitine-metabolism related genes are significantly modified in melanoma patients vs. ctrl; namely, two genes involved in carnitine synthesis (SHMT2, BBOX1), two carnitine carriers (SLC22A5 and SLC25A29), two genes related to Carnitine Palmitoyltransferases (CPT1B and ACACB), the Carnitine O-Octanoyltransferase (CROT), four genes related to acethylcarnitine metabolism (ACADM, ACAD8, ACADVL and ACADL) and one gene related to carnitine deficiency (IFT81). Particularly impressive is the expression lowered to almost zero, in melanoma patients, for BBOX1 and ACADL genes (Figure 9), never reported before to this extent. The strong expression reduction was validated in data from GENT2 database. Table 2 also shows that 6 out of 29 genes show a significant relation with melanoma patients’ survival, namely, SHMT2, SLC22A4, CPT1B, CHKB-CPT1B, CRAT, HADHA.
Such data suggested that carnitine may play a role in the miconazole antimelanoma effect. To investigate this hypothesis, 24 h proliferation of A375 melanoma cells was measured in the presence of miconazole (30 μM), with or without carnitine (100 μM). Figure 10 shows that miconazole antiproliferation effect on A375 melanoma cells is completely reversed in the presence of carnitine, demonstrating that miconazole antimelanoma effects are, at least in part, dependent on carnitine levels.

2.2.5. Investigating Pro-Apoptotic Caspases, Cell Death and Apoptosis

In order to assess the role of pro-apoptotic caspases in the observed effects, we carried out proliferation experiments, exposing A375 and SK-MEL-28 cells to miconazole 30 μM, for 24 h, in the presence or in the absence of caspases-inhibitors such as the pan-caspases inhibitor ZVAD-FMK and the caspase 3/7 inhibitor Ac-DEVD-CHO. As depicted in Figure 11A, the miconazole effect is significantly reverted by both ZVAD and DEVD, indicating that apoptotic caspases activity, likely caspase 3 or caspase 7, is required to observe the antiproliferative effect of miconazole.
In addition, as reported in Figure 11B, both early and late apoptosis as well as necrosis are increased in A375 and in SK-MEL-28, upon miconazole 30 μM treatment for 24 h, as compared to ctrl (NT = DMSO-treated). The experiments, performed at least in triplicate, indicate that in A375 cells, early apoptosis (Q1 area) increases from 1.9 to 4.5% (p = 0.03), late apoptosis (Q2 area) from 2.3 to 37.7% (p = 0.001), and necrosis (Q3 area) increases from 2.8 to 20.9% (p < 0.001). A375 images reported in Figure 11B refer to a representative experiment. In SK-MEL-28 cells, miconazole treatment increases early apoptosis from 5.3 to 13.6% (p = 0.02) and increases late apoptosis from 3 to 25.5% (p = 0.03), while necrotic cells are unchanged (p = n.s.). SK-MEL-28 images reported in Figure 11B refer to a representative experiment. Figure 11 indicates that miconazole antimelanoma effect is strongly dependent on the activity of proapoptotic caspases (panel A) and strongly increases the number of cells in early and late apoptosis (panel B).

3. Discussion

Miconazole is a drug largely used in clinics, mostly for its antimycotic activity. It has shown anti-inflammatory [37] as well as antitumor effects in different cancer setups such as hepato-cellular carcinoma cells [38], bladder cancer cells [39] and breast cancer [40]. In a glioblastoma setup, miconazole was shown to induce autophagic cell death by inducing ROS production [41]. Similarly, autophagy induction by miconazole treatment has been shown in bladder cancer cells [42]. Melanoma has been poorly investigated under this respect. In a study published in 2019, we demonstrated for the first time that miconazole may exert a strong antimelanoma effect in vitro; we related such an effect, at least in part, to the expression of an ion channel, namely KCNN2 (28). Miconazole antimelanoma effect was then confirmed in a zebrafish model study published in 2020 [43], and miconazole nanoemulsions are under investigation as a possible formulation [44]. Mechanisms underlying the strong miconazole antimelanoma effect are still to be elucidated. In the present study, we show biological effects at 24 h treatments with both miconazole and clotrimazole, namely, significant inhibition of in vitro proliferation, viability and vascular mimicry (Figure 1, Figure 2 and Figure 3, respectively). The underlying mechanisms were addressed by measuring effects at 6 h time point to investigate early molecular effects likely inducing the late biological effects observed at 24 h. At this early time point, ATP production, i.e., a hallmark of mitochondrial function, was significantly reduced in a dose-dependent way by miconazole in either A375 and SK-MEL-28 melanoma cells and by clotrimazole in A375 cells (Figure 4). Further, ROS production was increased on both cell lines by miconazole (Figure 5). ATP and ROS are strongly related to mitochondria activity. In fact, ATP production occurs in mitochondria, mainly through oxidative phosphorylation [45], and 90% of ROS is produced in mitochondria [46]. Mitochondria were then the most interesting candidates to be further investigated, as possible targets of miconazole activity in melanoma cells, also according to previous data reported in bladder cancer [47]. Indeed, both whole fluorescence and single-cells fluorescence by confocal microscopy were found reduced (Figure 6, Figure 7 and Figure 8). The observed reduction in ATP production, the increase in ROS levels and the parallel reduction in mitochondria-associated fluorescence are all indicators of a strong effect on mitochondrial function. The current study also presents for the first time several evidences indicating a strong metabolic effect of miconazole on human melanoma cells, at a very early time point such as 6 h treatment. Accordingly, Table 1 shows that mitochondria-related metabolites and metabolism indicators are significantly modified in cells treated with miconazole 30 μM for 6 h. Mostly carnitines (i.e., a lysine and methionine derivatives), nearly all amino acids and amino-acids-related molecules and choline-related molecules are strongly modified, suggesting a marked early effect of miconazole on energy production metabolic effects. Particularly, carnitines levels appear strongly modified both in terms of relative ratios and as absolute values. In fact, the most modified metabolite/indicator (see line n. 1 in Table 1) is C4/C3 ratio, (i.e., Butyrylcarnitine/Propionylcarnitine ratio), increased by 12 times in 6 h miconazole-treated cells. This indicator is reported as “Short-Chain Acyl-Coenzyme A Dehydrogenase (SCAD) Deficiency (NBS) and refers to deficiency of short-chain acyl-CoA dehydrogenase, which prevents the body from converting short-chain fatty acids into energy. Carnitines were, along with amino-acids and phophatidylcholines, the molecules most profoundly modified by miconazole treatment, according to Table 1. The third most modified metabolite/indicator (i.e., n. 3 in Table 1) is C4/C2 ratio (Butyrylcarnitine/Acetylcarnitine ratio), which is increased by more than five times in miconazole treated cells at 6 h. This increase indicates isobutyryl-CoA dehydrogenase deficiency, a condition that disrupts the breakdown of the amino acid valine. Carnitine metabolism is also shown to be altered at lines n. 15, 30, 38, 67, 78 and 81 in Table 1. Carnitines metabolism is mostly at the mitochondrial level and is crucial for the fatty acid oxidation and energy production [48,49,50,51], and carnitines are reported as key mitochondrial players in different pathologic conditions [50,52,53,54,55,56]. The potential role carnitine-metabolism-related genes may play in melanoma growth was then confirmed by the analysis depicted in Table 2 and Figure 9, indicating significant expression change and significant correlation with survival in melanoma patients. Dietary intake of carnitine was previously indicated to reduce melanoma growth in mice [57] by using food dietary supplements containing several other constituents in addition to carnitine, such as coenzyme Q10, branched-chain amino acids, vitamins and zinc. The present study shows, for the first time, a strong alteration of expression of several genes related to carnitine metabolism in melanoma patients. Also, carnitine shows, in the current study, the ability to significantly reverse the antimelanoma effect of miconazole in A375 human melanoma cells. Such data demonstrate, for the first time, that carnitine may play a specific role in the mechanism of action of drugs controlling melanoma cells proliferation. The second most modified metabolite/indicator (i.e., line n. 2 in Table 1) is Lac/H1, indicating Lactate Dehydrogenase Activity, increased by more than five times in 6 h miconazole-treated cells. This is a fermentation indicator, related to pyruvate reduction by lactate dehydrogenase into lactate; this action is strongly affected in cancer cells, particularly in melanoma [58]. Its strong increase in the experimental conditions of the present study was mostly related to the relevant reduction in hexose levels (see line 69 in Table 1). Metabolites/indicators n. 4, 5 and 7 in Table 1 are asparagine synthesis, putrescine synthesis and polyamine synthesis, all strongly increased in 6 h miconazole-treated cells. Polyamine, putrescin and asparagine metabolism are known to be strongly altered in cancer [59,60,61]. Metabolism of amino acids, polyamines, ornithine and taurine are all strongly inter-connected, and their expression was in fact found significantly altered in Table 1 (see lines n. 6, 8, 18, 19, 20, 23, 35, 39, 41, 42, 52, 54, 59 and 79) indicating a profound metabolism alteration of all amino acids and proteins. Finally, choline-related metabolism was found modified in Table 1 (see line n. 16, 57, 58, 60, 61, 63, 64, 65, 66 70, 71, 73, 74, 75 and 76), indicating a significant effect of miconazole on an essential molecule in phospholipids structure as well as in neurotransmitters, linked to betaine metabolism [62] and to fatty acids synthesis, which were in fact significantly modified in Table 1 at lines n. 12, 17, 38, 51, 82.
Finally, a significant and relevant reversion of the antiproliferation effect of miconazole was observed in the presence of ZVAD-FMK (i.e., a pan-caspases-inhibitor) and DEVD Ac-DEVD-CHO (i.e., a caspase 3/7 inhibitor) in both A375 and SK-MEL-28 cells. This suggested that the miconazole effect in human melanoma cells is, at least in part, dependent on proapoptotic signals mediated by caspases activation. Further, annexin/propidium iodide staining evaluated with FACS analysis indicates a strong increase in both early and late apoptosis upon miconazole 30 μM treatment for 24 h. Under this respect, differences between A375 and SK-MEL-28 may depend on their different growth kinetics. A mitochondrial-dependent apoptosis mediated by caspase3/7 is well known in several pathogenic setups [63,64,65,66], further supporting the role mitochondria play in the antiproliferative effects reported in the present study. Therefore, the collected evidences indicate that miconazole induces apoptosis in melanoma, likely via an early mitochondria disregulation evident at 6 h treatment.
In conclusion, as recently highlighted [67], drugs with antifungal activity have potential application in cancer therapy, thanks to common molecular targets overlapping cancer targets. Namely, previous evidences suggest the possible use of miconazole in colon, bladder, breast and lung cancers and osteosarcoma. Data reported in the present study support the potential use of miconazole in melanoma.

4. Materials and Methods

The aim of the present study was to investigate biological effects and molecular mechanisms involved in the response of human melanoma cell lines exposed to miconazole and clotrimazole. Late biological effects (namely, cell proliferation, cell viability, vascular mimicry) were assayed at 24 h, while early molecular mechanisms (ROS release, ATP release, mitochondria staining, metabolomics profiling) were assayed at 6 h treatment.

4.1. Cell Culture

Human melanoma cell lines SK-MEL-28 and A375 were purchased from the American Type Culture Collection (ATCC, Manassas, VA, USA). SK-MEL-28 and A375 were grown, respectively, in Minimum Essential medium Eagle (MEM; Hyclone, South Logan, UT, USA) and Dulbecco’s modified Eagle’s medium (DMEM; Hyclone) supplemented with 10% fetal bovine serum (FBS; Hyclone), 2 mM L-glutamine and 100 mM penicillin/streptomycin (Invitrogen, Carlsbad, CA, USA) at 37 °C with 5% CO2. Miconazole nitrate was from CliniSciences (Paris, France) and was diluted in DMSO at 10 mM mother solution, as previously reported [28]. Clotrimazole was from Sigma Aldrich (St. Louis, MO, USA) and was diluted in DMSO at 25 mM, mother solution.

4.2. Treatment for 24 h: Cell Proliferation, Cell Viability, Vascular Mimicry

4.2.1. Cell Proliferation

Miconazole and Clotrimazole effects were tested on 10% FBS-induced proliferation. SK-MEL-28 were plated at 1 × 10⁵ cells/plate, and A375 cells were plated at 8 × 10⁴ cells/plate in p35 Petri dishes at time 0. After 24 h, cells were starved for 18 h in serum-free medium and then treated with miconazole or clotrimazole increasing doses (up to 50 μM), in a medium containing FBS 10%.
At 24 h, cells were then harvested with 0.25% trypsin, 2.21 mM EDTA, 1× sodium bicarbonate (Corning, Manassas, VA, USA) and counted in hemocytometer.
A375 cells proliferation was also investigated in the presence of miconazole 30 μM, with or without L-carnitine 100 μM (catalog # C0158, (Sigma-Aldrich, St. Louis, MO, USA). Cells were seeded as reported above, and L-carnitine was given along with miconazole, after 6 h pre-treatment.

4.2.2. MTT Cell Viability Assay

SK-MEL-28 and A375 cells were plated at 8 × 10³ cell/plate into a 96-well culture plate and grown in MEM or DMEM, respectively, supplemented with 10% FBS. After 24 h, cells were starved for 18 h in serum-free medium and treated with miconazole or clotrimazole (up to 100 μM) in complete fresh medium containing FBS 10%. Cell viability was measured using MTT reagent (10 × 5 mg/mL Thiazolyl Blue Tetrazolium Bromide Sigma Aldrich (St. Louis, MO, USA) dissolved in PBS. On the day of measurement, medium was replaced with serum-free media plus MTT reagent (1×) and incubated for 4 h at 37 °C. After solubilization, formazan crystals were dissolved in DMSO 100 μL solution and incubated for 15 min [34]. The formazan absorbance was quantified by measuring the light absorbance at 570 nm using the Ensight fluorometer (Perkin Elmer, Inc., Beaconsfield, UK).

4.2.3. Vasculogenic Mimicry Assay

SK-MEL-28 were plated at 1 × 10⁵ cells/plate in p35 Petri dishes at time 0 and then starved for 18 h in serum-free medium. Twenty-four-well plates were coated with cold Matrigel (100 μL/well) and kept at 37 °C for 1 h until the gel solidified. Cells were treated with miconazole or clotrimazole (up to 50 μM), in the presence of 10% FBS. The formation of vessel-like channels was analyzed 24 h after plating. Images were then captured under S 40/0.45 LEICA microscope. The vessel-like formations were counted as the total number of closed polygons in random microscope fields, according to a methodology previously published [68]. Eight fields/well were assessed, and three experiments in triplicate were performed.

4.3. Treatment for 6 h: ROS Release, ATP Release, Mitochondria Staining, Metabolomics Profiling

4.3.1. Evaluation of ROS and ATP Production

SK-MEL-28 and A375 cells were plated at 1 × 10⁵ cells/plate and 8 × 10⁴ cell/plate, respectively, in p35 Petri dishes at time 0 and then starved for 18 h in serum-free medium. After 6 h treatment with miconazole or clotrimazole (up to 50 μM) in the presence of 10% FBS, cells were washed with PBS, harvested with 0.25% trypsin and counted. Intracellular ATP content was measured by using the ATP Colorimetric/Fluorometric Assay Kit (BioVision). According to the manufacturer’s instructions, the cell lysate absorbance was measured at 450 nm, and ATP concentration was expressed in nmol/106 cells.
Reactive Oxygen Species (ROS) level was measured using the 2′,7′-dichlorodihydrofluorescein diacetate (DCFDA)-Cellular Reactive Oxygen Species (ROS) Detection Assay Kit (AbCam ab 113,851). A375 and SK-MEL-28 cells were incubated with 25 μM DCFDA for 45 min at 37 °C and then treated with increasing doses of miconazole and clotrimazole in complete fresh medium for 6 h. Tert-Butyl Hydrogen Peroxide (TBHP) solution was used as a positive control for ROS production. The fluorescence intensity of controls and of treated wells was measured at the Ensight fluorometer (Perkin Elmer, Inc., Beaconsfield, UK) at Ex = 485 nm and Em = 535 nm, according to the manufacturer’s instructions as previously reported [35].

4.3.2. Mitochondria Investigation: Whole Fluorescence

SK-MEL-28 and A375 cells were plated at 8 × 10³ cell/plate into 96-well culture plates and grown in MEM or DMEM supplemented with 10% FBS. Cells were then starved for 18 h in serum-free medium and then treated with miconazole (up to 50 μM) dissolved in complete fresh medium containing 10% FBS. After 6 h treatment at 37 °C in 96 wells plates, cells were incubated with 10 nM Biotracker™ 488 Green Mitochondria Dye (Merck Millipore Bio, Temecula, CA, USA) for 15 min at 37 °C according to manufacturer instructions. The mitochondria fluorescence intensity of treated and untreated cells was then measured at the Ensight fluorometer (Perkin Elmer, Inc., Beaconsfield, UK) at Ex = 490 nm and Em = 523 nm, detected using the green FITC/GFP channel.

4.3.3. Mitochondria Investigation: Confocal Cytofluorescence

SK-MEL-28 cells (1 × 10⁵) were seeded on sterile glass slides (20 × 20 mm) placed in six-multiwells plates. Cells were kept for 24 h in medium without serum, then the medium was substituted with medium-10% serum + DMSO (ctrl) or medium-10% serum + Miconazole 50 μM in DMSO and treated for 6 h. Cells were then fixed with formaldehyde 3.7% for 15 min at RT, washed two times in blocking buffer BSA 1% PBS (Bovine Serum Albumin, Sigma Aldrich, Darmstadt, Germany) to minimize a-specific binding. Cells were then incubated with BioTracker 488 Green Mitochondria dye (Merck Millipore Bio, Temecula, CA, USA) 20 μM for 30 min at 37 °C. Finally, cover slide was mounted with Vectashield (ref. H1200, Vector Laboratories, Burlingame, CA, USA). Cytofluorescence images under confocal microscope (LSM 510, Zeiss, Oberkochen, Baden-Württemberg, Germany) were taken. Images were obtained in scan mode by frame, size 512 × 512 nm2, Pixel Dwell 25.00 µs, revealed by Argon/2 laser at 488 nm wavelength. Images were then analyzed with the data processing software ZEN core 3.8 (ZEISS, Oberkochen, Baden-Württemberg, Germany) and with “Images J2” with Java 8 (NHI, LOCI, University of Wisconsin, Madison, WI, USA). Mean fluorescence intensity was calculated and normalized by nuclei number, in 30 fields for sample. In more detail: by using the tool “Measure” of ImageJ (version 2.14.0/1.54F), the mean fluorescence intensity, after subtracting the background, was calculated for each field. Data were then normalized for the number of nuclei in each field. Mean, standard deviation and t-test analysis were then performed for treated and untreated samples.
Mitochondria fluorescence was then investigated with the “Mitochondrial analyzer” Fiji plugin, downloaded at https://github.com/AhsenChaudhry/Mitochondria-Analyzer (accessed on 10 March 2024), able to perform a mitochondrial specific analysis, as previously reported [69,70]. In more detail, the image analyzer performs an adaptative thresholding of the image for the correct extraction of mitochondrial objects. After a pre-processing noise optimization step, the software makes background subtraction, sigma filter and local contrast enhancement. This procedure extracted a clean picture of mitochondria (Figure 7C,D) from the images of Figure 7A,B.

4.3.4. Metabolomics Analysis

Metabolomics analyses were carried out on A375 cells, untreated or treated with miconazole for 6 h. Cells were plated at 1 × 10⁶ cells/plate, starved for 18 h in serum-free medium and then treated with miconazole 30 μM in medium containing FBS 10%. After 6 h treatment, the cell medium was removed, and cells were quickly rinsed with pre-cooled 0.9% NaCl solution. Extraction was performed on ice by adding 180 µL of ice-cold isopropanol per 1 × 10⁶ cells and quickly detached by scraping, according to Biocrates instructions (Biocrates, Innsbruck, Austria) with minor modifications. Extracts were transferred to 1.5 mL microcentrifuge tubes, immediately frozen, and then sent to Biocrates for analysis. Analytical methods were applied, according to Biocrates (Biocrates, Innsbruck, Austria). Briefly: the commercially available MxP® Quant 500 XL kit from Biocrates was used for the quantification of several endogenous metabolites of various biochemical classes. Lipids and hexoses were measured by flow injection analysis-tandem mass spectrometry (FIA-MS/MS) using a 5500 QTRAP® instrument (AB Sciex, Darmstadt, Germany) with an electrospray ionization (ESI) source, and small molecules were measured by liquid chromatography-tandem mass spectrometry (LC-MS/MS) using a different 5500 QTRAP® instrument of the same type. The extracts were analyzed by FIA-MS/MS and LC-MS/MS methods using multiple reaction monitoring (MRM). For the XL-part, a predefined amount of underivatized samples was pipetted on an additional plate with inserts carrying lipid internal standards. LC concentrations were calculated using appropriate mass spectrometry software (Sciex Analyst®, https://biocrates.com/wp-content/uploads/2023/06/Application-note-Quant500-XL-across-MS-platforms.pdf, accessed on 10 March 2024) and FIA-concentrations were quantified using the Biocrates WebIDQ software (https://biocrates.com/webidq/, accessed on 10 March 2024). The assay has been validated based on the European Medicines Agency (EMA) guidelines. All concentration values were normalized to external target values of Biocrates quality controls that are routinely run on every plate.
Under our experimental conditions, the cell number in treated samples was indicated to be halved at 24 h and un-modified at 6 h treatments, vs. T0.

4.4. Analysis of Carnitine Role

Genes related to carnitine metabolism were identified from the Human Gene database available at the Genecards platform (https://www.genecards.org/, accessed on 10 March 2024); their expression was then analyzed with the “Box plot” tool at the GEPIA2 platform/http://gepia2.cancer-pku.cn/#analysis, accessed on 10 March 2024). Expression data were then validated on GENT2 platform (http://gent2.appex.kr/gent2/, accessed on 10 March 2024).
In addition, A375 cells proliferation was investigated in the presence of miconazole 30 μM, with or without L-carnitine 100 μM. Cells were seeded as reported before; miconazole, and L-carnitine was added alone or with miconazole, after 6 h pre-treatment

4.5. Apoptosis Analyses

The role of proapoptotic caspases activation was investigated by exposing A375 and SK-MEL-28 cells to miconazole 30 μM, for 24 h, in the presence or in the absence of caspases-inhibitors such as the pan-caspases inhibitor ZVAD-FMK (MCE Medicalchem express catalog. N. HY16658B 1 Deer Park Dr, Suite Q, Monmouth Junction, NJ 08852, USA) and the caspase 3/7 inhibitor Ac-DEVD-CHO (Euroclone S.p.A; catalog n. ALX-260-030-M001; Enzo Life Sciences Inc., Via Figino, 20/22 20016 Pero, MI, Italy). Both inhibitors were used at 45 μM concentration. A375 as SK-MEL-28 cells, untreated (i.e., treated with DMSO only) or treated with miconazole 30 μM for 24 h, were washed twice in PBS, resuspended in Annexin binding buffer and stained with FITC- conjugated Annexin V and Propidium Iodide (PI), according to the manufacturer’s instruction. The Annexin V-FITC Apoptosis detection Kit was used, catalog n. BMS500FI/20 from Bender MedSystems GmbH Campus Vienna Biocenter 2 1030 Vienna, Austria. FACS analysis was performed using BD FACSMelody™ Cell Sorter (Beckman Coulter Life Sciences, Indianapolis, IN, USA) using channel 488 for FITC-Conjugated Annexin V and filter PE with range 610–630 nm for PI. Data were collected in duplicate from five different experiments and further analyzed with FlowJo 10 software (Beckman Coulter Life Sciences, 385 Williamson Way Ashland, OR 97520, USA).

4.6. Statistical Analyses

Data were expressed as mean ± S.D. from at least three independent experiments. Statistical analysis was performed using Student’s t-test or one-way ANOVA test or Friedman test, when indicated. p value ≤ 0.05 was considered the statistically significant threshold. Statistical analyses were performed on GraphPad Prism 9 (GraphPad Software Inc., Boston, MA, USA). Statistical analyses of metabolomics data: to enable a comparison of the concentrations in different groups, all values were normalized to the cell number, i.e., 2 × 10⁶ at T0, 2 × 10⁶ at 6 h in treated samples, and 1 × 10⁶ cell number at 24 h in treated samples. Amounts were then expressed as pmol/106 cells. The analysis involved the quantification of 1019 metabolites; 576 analytes were eliminated from the statistical analysis since their concentration was missing or below the detection limit. The following analysis was then carried out on 443 analytes. Concentration was measured and log10 transformation was achieved. Then, ANOVA analysis was carried out on the groups. The delta for the log10-transformed values was obtained; to get the ratio between the concentrations, this delta was reversed. In the present study, the effect measured on the group “6 h in DMSO” was compared to the group “6 h in DMSO + Miconazole 30 μM”, to focus on early effects. The multiple testing correction was performed according to Benjamini procedure [36]. It adjusts the p value to take the many comparisons (i.e., one for each metabolite) into account, resulting in a q value (=FDR-adjusted p value). Metabolites concentration was then considered statistically different only with p < 0.05 AND q < 0.2. Out of 443 analyzed metabolites, 83 metabolites/indicators were found significantly modified at 6 h DMSO + miconazole treatment vs. DMSO treated.

5. Conclusions

Miconazole potently interferes in mitochondrial activity in melanoma cells, leading to a strong caspases-dependent antimelanoma activity. Such effects depend at least in part on carnitine and may suggest miconazole use within a novel antimelanoma strategy.

Supplementary Materials

The following supporting information can be downloaded at: https://www.mdpi.com/article/10.3390/ijms25073589/s1.

Author Contributions

Conceptualization, A.F., F.S. and M.M.G.; methodology, F.S., M.M.G. and V.V.B.; formal analysis, F.S., M.M.G., C.V. and V.V.B.; writing—original draft preparation, F.S., A.F. and M.M.G.; writing—review and editing, F.S. and A.F.; supervision, A.F.; project administration, A.F.; funding acquisition, A.F. All authors have read and agreed to the published version of the manuscript.

Funding

The study was supported in part by the Grant Ric. Corr. 3.4, by Ministry of Health to A.F.

Institutional Review Board Statement

Not applicable.

Informed Consent Statement

Not applicable.

Data Availability Statement

Availability of data and materials: reagents and materials used in the present study are commercially available. The datasets generated and/or analyzed during the current study are available as Supplementary Materials Tables S1–S3 and in the Mendeley data repository, available after manuscript acceptance, at: Reserved DOI:10.17632/d8nsdsfb5b.1.

Acknowledgments

Complex Protein Mixture (CPM) at ISS Rome for the useful support in handling complex solutions is kindly acknowledged.

Conflicts of Interest

The authors declare no conflicts of interest.

References

  1. Ng, G.; Xu, W.; Atkinson, V. Treatment Approaches for Melanomas That Relapse After Adjuvant or Neoadjuvant Therapy. Curr. Oncol. Rep. 2022, 24, 1273–1280. [Google Scholar] [CrossRef] [PubMed]
  2. Kale, M.A.; Shamkuwar, P.B.; Mourya, V.K.; Deshpande, A.B.; Shelke, P.A. Drug Repositioning: A Unique Approach to Refurbish Drug Discovery. Curr. Drug Discov. Technol. 2022, 19, e140122192307. [Google Scholar] [CrossRef] [PubMed]
  3. Van Cutsem, J.M.; Thienpont, D. Miconazole, a broad-spectrum antimycotic agent with antibacterial activity. Chemotherapy 1972, 17, 392–404. [Google Scholar] [CrossRef] [PubMed]
  4. Botter, A.A. Topical treatment of nail and skin infections with miconazole, a new broad-spectrum antimycotic. Mycoses 1971, 14, 187–191. [Google Scholar] [CrossRef] [PubMed]
  5. Pierard, G.E.; Hermanns-Le, T.; Delvenne, P.; Pierard-Franchimont, C. Miconazole, a pharmacological barrier to skin fungal infections. Expert Opin. Pharmacother. 2012, 13, 1187–1194. [Google Scholar] [CrossRef]
  6. De Nollin, S.; Borgers, M. An ultrastructural and cytochemical study of Candida albicans after in vitro treatment with imidazoles. Mycoses 1976, 19, 317–328. [Google Scholar] [CrossRef] [PubMed]
  7. Narashimamurthy, J.; Rao, A.R.; Sastry, G.N. Aromatase inhibitors: A new paradigm in breast cancer treatment. Curr. Med. Chem. Agents 2004, 4, 523–534. [Google Scholar] [CrossRef]
  8. Terrones-Gurrola, M.C.D.R.; Ponce-Peña, P.; Salas-Pacheco, J.M.; Camacho-Luis, A.; Pozos-Guillén, A.J.; Nieto-Delgado, G.; López-Guzmán, O.D.; Vértiz-Hernández, A.A. Arsenic: A Perspective on Its Effect on Pioglitazone Bioavailability. Int. J. Environ. Res. Public Health 2023, 20, 1901. [Google Scholar] [CrossRef]
  9. Kakimoto, A.; Ogura, H.; Suenaga, M.; Mishima, T.; Fujioka, S.; Ouma, S.; Matsunaga, Y.; Tsuboi, Y. Role of cytochrome P450 for vitamin D metabolisms in patients with neurodegenerative disorders. Clin. Park. Relat. Disord. 2022, 7, 100162. [Google Scholar] [CrossRef]
  10. Krkoška, M.; Svobodová, J.; Kabátková, M.; Zapletal, O.; Hyršlová Vaculová, A.; Nekvindová, J.; Vondráček, J. Deregulation of signaling pathways controlling cell survival and proliferation in cancer cells alters induction of cytochrome P450 family 1 enzymes. Toxicology 2021, 461, 152897. [Google Scholar] [CrossRef]
  11. Shetkar, S.S.; Ramakrishnan, S.; Seth, S.; Chandna, P.; Verma, S.K.; Bhargava, B.; Bahl, V.K. CYP 450 2C19 polymorphisms in Indian patients with coronary artery disease. Indian Heart J. 2014, 66, 16–24. [Google Scholar] [CrossRef]
  12. Nguyen, T.M.L.; McGowan, J.C.; Gardier, A.M. CYP 450 enzymes influence (R,S)-ketamine brain delivery and its antidepressant activity. Neuropharmacology 2022, 206, 108936. [Google Scholar] [CrossRef] [PubMed]
  13. Pikuleva, I.A.; Waterman, M.R. We have previously shown Cytochromes P450: Roles in Diseases. J. Biol. Chem. 2013, 288, 17091–17098. [Google Scholar] [CrossRef] [PubMed]
  14. Stavropoulou, E.; Pircalabioru, G.G.; Bezirtzoglou, E. The Role of Cytochromes P450 in Infection. Front. Immunol. 2018, 9, 89. [Google Scholar] [CrossRef] [PubMed]
  15. Villeneuve, J.P.; Pichette, V. Cytochrome P450 and Liver Diseases. Curr. Drug Metab. 2004, 5, 273–282. [Google Scholar] [CrossRef] [PubMed]
  16. Tan, E.Y.; Bharwani, L.; Chia, Y.-H.; Soong, R.C.T.; Lee, S.S.Y.; Chen, J.J.C.; Chan, P.M.Y. Impact of cytochrome P450 2D6 polymorphisms on decision-making and clinical outcomes in adjuvant hormonal therapy for breast cancer. World J. Clin. Oncol. 2022, 13, 712–724. [Google Scholar] [CrossRef] [PubMed]
  17. Thorén, L.; Margolin, S.; Eliasson, E.; Bergh, J.; Lindh, J.D. Adherence to endocrine therapy in early breast cancer in relation to Cytochrome P450 2D6 genotype: A comparison between pharmacy dispensation data and medical records. Breast Cancer Res. Treat. 2023, 198, 499–508. [Google Scholar] [CrossRef] [PubMed]
  18. Korbecki, J.; Rębacz-Maron, E.; Kupnicka, P.; Chlubek, D.; Baranowska-Bosiacka, I. Synthesis and Significance of Arachidonic Acid, a Substrate for Cyclooxygenases, Lipoxygenases, and Cytochrome P450 Pathways in the Tumorigenesis of Glioblastoma Multiforme, Including a Pan-Cancer Comparative Analysis. Cancers 2023, 15, 946. [Google Scholar] [CrossRef]
  19. Uthansingh, K.; Parida, P.K.; Pati, G.K.; Sahu, M.K.; Padhy, R.N. Evaluating the Association of Genetic Polymorphism of Cytochrome p450 (CYP2C9*3) in Gastric Cancer Using Polymerase Chain Reaction-Restriction Fragment Length Polymorphism (PCR-RFLP). Cureus 2022, 14, e27220. [Google Scholar] [CrossRef]
  20. Sonesson, A.; Buur Rasmussen, B.B. In vitro studies investigating the interactions between degarelix, a decapeptide gonadotropin-releasing hormone blocker, and cytochrome P450. Basic Clin. Pharmacol. Toxicol. 2011, 109, 195–202. [Google Scholar] [CrossRef]
  21. Mo, H.Y.; Wei, Q.Y.; Zhong, Q.H.; Zhao, X.Y.; Guo, D.; Han, J.; Noracharttiyapot, W.; Visser, L.; Berg, A.V.D.; Xu, Y.-M.; et al. Cytochrome P450 27C1 Level Dictates Lung Cancer Tumorigenicity and Sensitivity towards Multiple Anticancer Agents and Its Potential Interplay with the IGF-1R/Akt/p53 Signaling Pathway. Int. J. Mol. Sci. 2022, 23, 7853. [Google Scholar] [CrossRef]
  22. Khamis, Z.I.; Pang, X.; Cui, Z.; Sang, Q.A.; Zhang, J. Cytochrome P450-2D6: A novel biomarker in liver cancer health disparity. PLoS ONE 2021, 16, e0257072. [Google Scholar] [CrossRef]
  23. Presa, D.; Khurram, S.A.; Zubir, A.Z.A.; Smarakan, S.; Cooper, P.A.; Morais, G.R.; Sadiq, M.; Sutherland, M.; Loadman, P.M.; McCaul, J.; et al. Cytochrome P450 isoforms 1A1, 1B1 AND 2W1 as targets for therapeutic intervention in head and neck cancer. Sci. Rep. 2021, 11, 18930. [Google Scholar] [CrossRef]
  24. Kong, C.; Yan, X.; Zhu, Y.; Zhu, H.; Luo, Y.; Liu, P.; Ferrandon, S.; Kalady, M.F.; Gao, R.; He, J.; et al. Fusobacterium Nucleatum Promotes the Development of Colorectal Cancer by Activating a Cytochrome P450/Epoxyoctadecenoic Acid Axis via TLR4/Keap1/NRF2 Signaling. Cancer Res. 2021, 81, 4485–4498. [Google Scholar] [CrossRef]
  25. Singh, R.D.; Avadhesh, A.; Sharma, G.; Dholariya, S.; Shah, R.B.; Goyal, B.; Gupta, S.C. Potential of Cytochrome P450, a Family of Xenobiotic Metabolizing Enzymes, in Cancer Therapy. Antioxid. Redox Signal. 2023, 38, 853–876. [Google Scholar] [CrossRef]
  26. Yada, E.; Kasajima, R.; Niida, A.; Imoto, S.; Miyano, S.; Miyagi, Y.; Sasada, T.; Wada, S. Possible Role of Cytochrome P450 1B1 in the Mechanism of Gemcitabine Resistance in Pancreatic Cancer. Biomedicines 2021, 9, 1396. [Google Scholar] [CrossRef]
  27. Flaherty, K.T.; Lathia, C.; Frye, R.F.; Schuchter, L.; Redlinger, M.; Rosen, M.; O’dwyer, P.J. Interaction of sorafenib and cytochrome P450 isoenzymes in patients with advanced melanoma: A phase I/II pharmacokinetic interaction study. Cancer Chemother. Pharmacol. 2011, 68, 1111–1118. [Google Scholar] [CrossRef]
  28. D’arcangelo, D.; Scatozza, F.; Giampietri, C.; Marchetti, P.; Facchiano, F.; Facchiano, A. Ion Channel Expression in Human Melanoma Samples: In Silico Identification and Experimental Validation of Molecular Targets. Cancers 2019, 11, 446. [Google Scholar] [CrossRef] [PubMed]
  29. Alvarez, J.; Montero, M.; Garcia-Sancho, J. High affinity inhibition of Ca(2+)-dependent K+ channels by cytochrome P-450 inhibitors. J. Biol. Chem. 1992, 267, 11789–11793. [Google Scholar] [CrossRef] [PubMed]
  30. Hatton, C.J.; Peers, C. Effects of cytochrome P-450 inhibitors on ionic currents in isolated rat type I carotid body cells. Am. J. Physiol. 1996, 271, C85–C92. [Google Scholar] [CrossRef] [PubMed]
  31. Mandy, S.J.; Garrott, T.C. Miconazole treatment for severe dermatophytoses. JAMA 1974, 230, 72–75. [Google Scholar] [CrossRef] [PubMed]
  32. Pyo, S.M.; Hespeler, D.; Keck, C.M.; Müller, R.H. Dermal miconazole nitrate nanocrystals—Formulation development, increased antifungal efficacy & skin penetration. Int. J. Pharm. 2017, 531, 350–359. [Google Scholar] [CrossRef]
  33. Firooz, A.; Namdar, R.; Nafisi, S.; Maibach, H.I. Nano-Sized Technologies for Miconazole Skin Delivery. Curr. Pharm. Biotechnol. 2016, 17, 524–531. [Google Scholar] [CrossRef] [PubMed]
  34. Stepanenko, A.A.; Dmitrenko, V.V. Pitfalls of the MTT assay: Direct and off-target effects of inhibitors can result in over/underestimation of cell viability. Gene 2015, 574, 193–203. [Google Scholar] [CrossRef]
  35. Scatozza, F.; Moschella, F.; D’arcangelo, D.; Rossi, S.; Tabolacci, C.; Giampietri, C.; Proietti, E.; Facchiano, F.; Facchiano, A. Nicotinamide inhibits melanoma in vitro and in vivo. J. Exp. Clin. Cancer Res. 2020, 39, 211. [Google Scholar] [CrossRef] [PubMed]
  36. Benjamini, Y.; Hochberg, Y. Controlling the False Discovery Rate: A Practical and Powerful Approach to Multiple Testing. J. R. Stat. Soc. Ser. B Methodol. 1995, 57, 289–300. [Google Scholar] [CrossRef]
  37. Kim, B.Y.; Son, Y.; Cho, H.R.; Lee, D.; Eo, S.K.; Kim, K. Miconazole Suppresses 27-Hydroxycholesterol-induced Inflammation by Regulating Activation of Monocytic Cells to a Proinflammatory Phenotype. Front. Pharmacol. 2021, 12, 691019. [Google Scholar] [CrossRef]
  38. Stryjska, K.; Radko, L.; Chęcińska, L.; Kusz, J.; Posyniak, A.; Ochocki, J. Synthesis, Spectroscopy, Light Stability, Single-Crystal Analysis, and In Vitro Cytotoxic Activity on HepG2 Liver Cancer of Two Novel Silver(I) Complexes of Miconazole. Int. J. Mol. Sci. 2020, 21, 3629. [Google Scholar] [CrossRef]
  39. Tsai, T.F.; Chen, P.C.; Lin, Y.C.; Chou, K.Y.; Chen, H.E.; Ho, C.Y.; Lin, J.F.; Hwang, T.I.S. Miconazole Contributes to NRF2 Activation by Noncanonical P62-KEAP1 Pathway in Bladder Cancer Cells. Drug Des. Dev. Ther. 2020, 2020, 1209–1218. [Google Scholar] [CrossRef]
  40. Wu, C.; Gao, M.; Shen, L.; Li, B.; Bai, X.; Gui, J.; Li, H.; Huo, Q.; Ma, T. Miconazole triggers various forms of cell death in human breast cancer MDA-MB-231 cells. Pharmazie 2019, 74, 290–294. [Google Scholar] [CrossRef]
  41. Jung, H.J.; Seo, I.; Jha, B.K.; Suh, S.I.; Baek, W.K. Miconazole induces autophagic death in glioblastoma cells via reactive oxygen species-mediated endoplasmic reticulum stress. Oncol. Lett. 2021, 21, 335. [Google Scholar] [CrossRef] [PubMed]
  42. Ho, C.Y.; Chang, A.C.; Hsu, C.H.; Tsai, T.F.; Lin, Y.C.; Chou, K.Y.; Chen, H.; Lin, J.; Chen, P.; Hwang, T.I. Miconazole induces protective autophagy in bladder cancer cells. Environ. Toxicol. 2021, 36, 185–193. [Google Scholar] [CrossRef] [PubMed]
  43. Precazzini, F.; Pancher, M.; Gatto, P.; Tushe, A.; Adami, V.; Anelli, V.; Mione, M.C. Automated in vivo screen in zebrafish identifies Clotrimazole as targeting a metabolic vulnerability in a melanoma model. Dev. Biol. 2020, 457, 215–225. [Google Scholar] [CrossRef] [PubMed]
  44. Amado, J.; Pires, P.C.; Veiga, F.; Santos, A.C. Miconazole Nanoemulsions to Treat Melanoma: A Study of Formulation Development, Droplet Size and Solubility. Med. Sci. Forum. 2022, 14, 119. [Google Scholar] [CrossRef]
  45. Bertram, R.; Pedersen, M.G.; Luciani, D.S.; Sherman, A. A simplified model for mitochondrial ATP production. J. Theor. Biol. 2006, 243, 575–586. [Google Scholar] [CrossRef]
  46. Tirichen, H.; Yaigoub, H.; Xu, W.; Wu, C.; Li, R.; Li, Y. Mitochondrial Reactive Oxygen Species and Their Contribution in Chronic Kidney Disease Progression Through Oxidative Stress. Front. Physiol. 2021, 12, 627837. [Google Scholar] [CrossRef]
  47. Yuan, S.Y.; Shiau, M.Y.; Ou, Y.C.; Huang, Y.C.; Chen, C.C.; Cheng, C.L.; Chiu, K.Y.; Wang, S.S.; Tsai, K.J. Miconazole induces apoptosis via the death receptor 5-dependent and mitochondrial-mediated pathways in human bladder cancer cells. Oncol. Rep. 2017, 37, 3606–3616. [Google Scholar] [CrossRef]
  48. Vaz, F.M.; Wanders, R.J.A. Carnitine biosynthesis in mammals. Biochem. J. 2002, 361, 417–429. [Google Scholar] [CrossRef]
  49. Lee, Y.G.; Chou, H.C.; Chen, Y.T.; Tung, S.Y.; Ko, T.L.; Buyandelger, B.; Wen, L.L.; Juan, S.H. L-Carnitine reduces reactive oxygen species/endoplasmic reticulum stress and maintains mitochondrial function during autophagy-mediated cell apoptosis in perfluorooctanesulfonate-treated renal tubular cells. Sci. Rep. 2022, 12, 4673. [Google Scholar] [CrossRef]
  50. Mancilla, R.F.; Lindeboom, L.; Grevendonk, L.; Hoeks, J.; Koves, T.R.; Muoio, D.M.; Schrauwen, P.; Schrauwen-Hinderling, V.; Hesselink, M.K. Skeletal muscle mitochondrial inertia is associated with carnitine acetyltransferase activity and physical function in humans. JCI Insight 2023, 8, e163855. [Google Scholar] [CrossRef]
  51. Knottnerus, S.J.G.; Bleeker, J.C.; Wüst, R.C.I.; Ferdinandusse, S.; Ijlst, L.; Wijburg, F.A.; Wanders, R.J.A.; Visser, G.; Houtkooper, R.H. Disorders of mitochondrial long-chain fatty acid oxidation and the carnitine shuttle. Rev. Endocr. Metab. Disord. 2018, 19, 93–106. [Google Scholar] [CrossRef]
  52. Yao, M.; Zhou, P.; Qin, Y.Y.; Wang, L.; Yao, D.F. Mitochondrial carnitine palmitoyltransferase-II dysfunction: A possible novel mechanism for nonalcoholic fatty liver disease in hepatocarcinogenesis. World J. Gastroenterol. 2023, 29, 1765–1778. [Google Scholar] [CrossRef]
  53. Hassan, N.; Rashad, M.; Elleithy, E.; Sabry, Z.; Ali, G.; Elmosalamy, S. L-Carnitine alleviates hepatic and renal mitochondrial-dependent apoptotic progression induced by letrozole in female rats through modulation of Nrf-2, Cyt c and CASP-3 signaling. Drug Chem. Toxicol. 2023, 46, 357–368. [Google Scholar] [CrossRef]
  54. Virmani, M.A.; Cirulli, M. The Role of l-Carnitine in Mitochondria, Prevention of Metabolic Inflexibility and Disease Initiation. Int. J. Mol. Sci. 2022, 23, 2717. [Google Scholar] [CrossRef]
  55. Tonazzi, A.; Giangregorio, N.; Console, L.; Palmieri, F.; Indiveri, C. The Mitochondrial Carnitine Acyl-carnitine Carrier (SLC25A20): Molecular Mechanisms of Transport, Role in Redox Sensing and Interaction with Drugs. Biomolecules 2021, 11, 521. [Google Scholar] [CrossRef]
  56. McCann, M.R.; De la Rosa, M.V.G.; Rosania, G.R.; Stringer, K.A. L-Carnitine and Acylcarnitines: Mitochondrial Biomarkers for Precision Medicine. Metabolites 2021, 11, 51. [Google Scholar] [CrossRef] [PubMed]
  57. Awa, H.; Futamura, A.; Higashiguchi, T.; Ito, A.; Mori, N.; Murai, M.; Ohara, H.; Chihara, T.; Kaneko, T. Effects of Combined Treatment with Branched-Chain Amino Acids, Citric Acid, L-Carnitine, Coenzyme Q10, Zinc, and Various Vitamins in Tumor-Bearing Mice. Biol. Pharm. Bull. 2017, 40, 266–271. [Google Scholar] [CrossRef] [PubMed]
  58. Gao, D.; Ma, X. Serum lactate dehydrogenase is a predictor of poor survival in malignant melanoma. Panminerva Medica 2017, 59, 332–337. [Google Scholar] [CrossRef] [PubMed]
  59. Jiang, J.; Batra, S.; Zhang, J. Asparagine: A Metabolite to Be Targeted in Cancers. Metabolites 2021, 11, 402. [Google Scholar] [CrossRef]
  60. Sari, I.N.; Setiawan, T.; Kim, K.S.; Wijaya, Y.T.; Cho, K.W.; Kwon, H.Y. Metabolism and function of polyamines in cancer progression. Cancer Lett. 2021, 519, 91–104. [Google Scholar] [CrossRef] [PubMed]
  61. Casero, R.A.; Stewart, T.M.; Pegg, A.E. Polyamine metabolism and cancer: Treatments, challenges and opportunities. Nat. Rev. Cancer 2018, 18, 681–695. [Google Scholar] [CrossRef]
  62. Ueland, P.M. Choline and betaine in health and disease. J. Inherit. Metab. Dis. 2011, 34, 3–15. [Google Scholar] [CrossRef]
  63. Korotkov, S.M. Mitochondrial Oxidative Stress Is the General Reason for Apoptosis Induced by Different-Valence Heavy Metals in Cells and Mitochondria. Int. J. Mol. Sci. 2023, 24, 14459. [Google Scholar] [CrossRef]
  64. Nandi, S.; Sikder, R.; Rapior, S.; Arnould, S.; Simal-Gandara, J.; Acharya, K. A review for cancer treatment with mushroom metabolites through targeting mitochondrial signaling pathway: In vitro and in vivo evaluations, clinical studies and future prospects for mycomedicine. Fitoterapia 2024, 172, 105681. [Google Scholar] [CrossRef]
  65. Gao, X.; Deng, B.; Ran, S.; Li, S. The effect of GSK-3β in arsenic-induced apoptosis of malignant tumor cells: A systematic review and me-ta-analysis. Toxicol. Mech. Methods 2022, 32, 477–487. [Google Scholar] [CrossRef]
  66. Boice, A.; Bouchier-Hayes, L. Targeting apoptotic caspases in cancer. Biochim. Biophys. Acta Mol. Cell Res. 2020, 1867, 118688. [Google Scholar] [CrossRef] [PubMed]
  67. Weng, N.; Zhang, Z.; Tan, Y.; Zhang, X.; Wei, X.; Zhu, Q. Repurposing antifungal drugs for cancer therapy. J. Adv. Res. 2023, 48, 259–273. [Google Scholar] [CrossRef] [PubMed]
  68. Trisciuoglio, D.; Tupone, M.G.; Desideri, M.; Di Martile, M.; Gabellini, C.; Buglioni, S.; Pallocca, M.; Alessandrini, G.; D’aguanno, S.; Del Bufalo, D. BCL-XL overexpression promotes tumor progression-associated properties. Cell Death Dis. 2017, 8, 3216. [Google Scholar] [CrossRef] [PubMed]
  69. Chaudhry, A.; Shi, R.; Luciani, D.S. A pipeline for multidimensional confocal analysis of mitochondrial morphology, function, and dynamics in pancreatic β-cells. Am. J. Physiol. Metab. 2020, 318, E87–E101. [Google Scholar] [CrossRef] [PubMed]
  70. Fernadez Casafuz, A.B.; De Rossi, M.C.; Bruno, L. Mitochondrial cellular organization and shape fluctuations are differentially modulated by cytoskeletal networks. Sci. Rep. 2023, 13, 4065. [Google Scholar] [CrossRef] [PubMed]
Figure 1. Effects of miconazole (MICO) and clotrimazole (Clotri) on cells viability by MTT after 24 h exposure, in A375 and SK-MEL-28 cells, in the presence of 10% FBS. Data are expressed as mean ± S.D. of at least three independent experiments One-way ANOVA analysis shows a significant effect in all four panels; asterisks indicate significant difference vs. 0 μM according to multiple comparisons with Dunnet multiple comparison test. (* = p < 0.05). The 0 μM dose corresponds to DMSO only.
Ijms 25 03589 g001
Figure 2. Proliferation of A375 and SK-MEL-28 melanoma cells under miconazole or clotrimazole treatment for 24 h in the presence of 10% FBS. Data are expressed as mean ± S.D. of at least three independent experiments. One-way ANOVA shows a significant effect in all four panels; asterisks indicate significant difference vs. 0 μM according to multiple comparisons with Dunnet test. (* = p < 0.05). The 0 μM dose corresponds to DMSO only.
Ijms 25 03589 g002
Figure 3. Vasculogenic mimicry of SK-MEL-28 under treatment with either miconazole or clotrimazole for 24 h. Quantification from three experiments (A); representative fields for not-treated (NT) (B), treated with miconazole 30 μM (C) and 50 μM (E), with clotrimazole 30 μM (D) and 50 μM (F) in the presence of 10% FBS. Representative images from one of at least three independent experiments are reported. Vascular mimicry (VM) in SK-MEL-28 was analyzed by counting vessel-like formations expressed as a number of closed polygons in random microscope fields. One-way ANOVA shows a significant effect for miconazole at 30 and 50 μM, and for clotrimazole at 50 μM treatment. The 0 μM dose corresponds to DMSO only. Asterisks indicate a significant effect vs. 0 μM according to multiple comparisons with Dunnet multiple comparison test. (* = p < 0.05). (100× magnification). Scale bar = 50 µM.
Ijms 25 03589 g003
Figure 4. ATP levels in lysates from cells under miconazole and clotrimazole treatment for 6 h. Miconazole and clotrimazole treatment strongly reduced ATP levels in A375 and SK-MEL-28 cells after 6 h treatment. Data are expressed as mean ± S.D. of at least three independent experiments. The 0 μM dose corresponds to DMSO only. One-way ANOVA shows a significant effect in three out of four panels; asterisks indicate significant difference vs. 0 μM, according to multiple comparisons with Dunnet test. (* = p < 0.05).
Ijms 25 03589 g004
Figure 5. ROS levels in lysates from cells under miconazole and clotrimazole treatment for 6 h. Miconazole treatment induces a significant increase in ROS production. Data are expressed as mean ± S.D. of at least three independent experiments. The 0 μM dose corresponds to DMSO only. One-way ANOVA shows a significant effect in miconazole-treated cells; asterisks indicate significant difference vs. 0 μM, according to multiple comparisons with Dunnet test. (* = p < 0.05).
Ijms 25 03589 g005
Figure 6. Whole fluorescence of cells stained with Biotracker™ 488 Green Mitochondria Dye. Either A375 (A) and SK-MEL-28 cells (B) were treated with miconazole 50 μM at increasing times. Miconazole treatment at 6 h and 24 h showed a significant effect in either cases as compared to ctrl (NT = DMSO-treated) according to the t-test (asterisks indicate p < 0.05).
Ijms 25 03589 g006
Figure 7. (A,B): SK-MEL-28 LSM images at 63× magnification, untreated (NT = DMSO-treated) (A) and treated (B) with miconazole 50 μM for 6 h (representative images of 30 fields). Mitochondria were stained with BioTracker 488 Green Mitochondria dye (Merck Millipore Bio, Temecula, CA, USA). (C,D): mitochondria identified using the “Mitochondria analyzer” tool.
Ijms 25 03589 g007
Figure 8. Fluorescence intensity quantification of SK-MEL-28 stained with BioTracker 488 Green Mitochondria dye (Merck Millipore Bio, Temecula, CA, USA) measured by Image J2 software on 30 randomly chosen fields from LSM images. NT = DMSO-treated. Mean + St. Dev. is reported. Asterisk indicates significant p value according to Student t-test (p = 0.025).
Ijms 25 03589 g008
Figure 9. Expression levels of BBOX1 and ACDL genes in 461 melanoma patients (SKCM) and 561 controls (CTRLS), according to TCGA/GTEx data available at GEPIA2 platform (http://gepia2.cancer-pku.cn/#index, accessed on 10 November 2023). * indicates p > 0.0001.
Ijms 25 03589 g009
Figure 10. A375 proliferation (24 h) in the presence of miconazole (Mico) 30 μM, with or without carnitine (CAR) 100 μM. The inhibitory effect of miconazole is completely reversed in the presence of carnitine. NT = DMSO-treated * indicates p < 0.001.
Ijms 25 03589 g010
Figure 11. (A): Proliferation of A375 (left panels) and SK-MEL-28 (right panels) for 24 h, in the presence of miconazole (Mico) 30 μM, either with ZVAD (top panels) or with DEVD (bottom panels) 45 μM. The inhibitory effect of miconazole is significantly and completely reversed in the presence of ZVAD and significantly and partially reversed in the presence of DEVD. NT = DMSO-treated. * indicates p < 0.001. (B): FACS analysis of A375 and SK-MEL-28 untreated (NT = DMSO treated) or treated with miconazole, stained with FITC-conjugated Annexin V and Propidium Iodide, shows a strong increase in both early and late apoptosis, as well as necrosis (Q1, Q2 and Q3 areas, respectively). Experiments reported in panel (B) were performed at least in triplicate, and the images refer to a representative experiment.
Ijms 25 03589 g011
Table 1. Metabolites found significantly modified in A375 cells treated with miconazole for 6 h. Values are the ratio of treatment vs. DMSO. Values > 1 indicate increase in miconazole-treated samples, while <1 indicates reduction in miconazole-treated samples. Numbers are sorted by ratio value. Significance was measured according to ANOVA analysis.
NMetabolite or Metabolite IndicatorRatiop ValueFormula
1Short-Chain Acyl-Coenzyme A Dehydrogenase (SCAD) Deficiency (NBS)12.463.3−13C4/C3
2Lactate Dehydrogenase Activity5.391.3−7Lac/H1
3Isobutyryl-Coenzyme A Dehydrogenase Deficiency (NBS)5.372.6−11C4/C2
4Monoglyceride 16:15.160.005
5Asparagine Synthesis3.335.0−7Asn/Asp
6Putrescine Synthesis2.870.007Putrescine/Orn
7Lysophosphatidyl-choline 17:02.670.018
8Polyamine Synthesis2.450.023(Putrescine + Spermidine + Spermine)/Orn
9Sarcosine Synthesis from Choline2.370.002Sarcosine/Choline
10Glutaminolysis Rate2.248.5−6(Ala + Asp + Glu + Lac + Suc)/Gln
11Lysophosphatidyl-glycerol 16:12.074.6−4
12Betaine Synthesis2.010.004Betaine/Choline
13Asparagine1.960.012
14Phosphatidyl-ethanolamine P-16:0/15:01.950.008
15Butyrylcarnitine1.840.002
16Lysophosphatidyl-choline 16:01.810.031
17Sphingosine phosphate d18:11.734.0−4
182-Methylbutyrylglycinuria (NBS)1.690.011C5/C3
19Taurine Synthesis1.670.025Taurine/Cys
20Gamma-Aminobutyric Acid Synthesis1.470.005GABA/Glu
21Methionine Oxidation0.850.017Met-SO/Met
22Glycine Synthesis0.801.6−4Gly/Ser
23Dihydrolipoamide Dehydrogenase Deficiency (NBS)0.710.008Pro/Phe
245-Aminovaleric acid0.700.017
25beta-Alanine0.690.025
26Hydroxyglutaric acid0.680.003
27Serine0.670.010
28Alanine0.630.031
29Taurine0.620.006
30Carnitine0.604.4−4
31Triacylglyceride 18:1_33:30.600.009
32Threonine0.590.007
33Glutamine0.590.002
34Aspartic acid0.590.028
35Sum of Amino Acids0.590.004
36alpha-Aminoadipic acid0.590.018
37trans-4-Hydroxyproline0.580.010
38Ratio of Acetylcarnitine to Carnitine0.570.008C2/C0
39Sum of Solely Glucogenic Amino Acids0.570.002Ala + Arg + Asn + Asp + Cys + Gln + Glu + Gly + His + Met + Pro + Ser + Thr + Val
40beta-Aminobutyric acid0.560.012
41Sum of Non-Essential Amino Acids0.568.9 × 10−4Ala + Arg + Asn + Asp + Cys + Gln + Glu + Gly + Pro + Ser + Tyr
42Cysteine Synthesis0.556.0 × 10−4Cys/(Ser + Met)
43Glutamic acid0.551.7 × 10−4
44Glicine0.540.002
45Taurolithocholic acid0.510.013
46Carnosine Synthesis0.510.029Carnosine/His
47Glutathione Constituents0.501.2 × 10−4Glu + Gly + Cys
48Proline0.488.2 × 10−4
49Sum of Conjugated Primary Bile Acids0.470.024GCA + GCDCA + TCA + TCDCA
50Taurochenodeoxy-cholic acid0.460.019
51Beta-Oxidation0.444.8 × 10−4(C2 + C3)/C0
52Sum of Taurine-Conjugated Bile Acids0.430.014TCA + TCDCA + TDCA + TLCA
53Malonic Aciduria (NBS)0.431.6 × 10−5C3/C2
54Sum of Sulfur-Containing Amino Acids0.430.002Met + Cys
55Short/Branched-Chain Acyl-Coenzyme A Dehydrogenase Deficiency (NBS)0.425.4 × 10−5C5/C0
56Taurodeoxycholic acid0.410.016
57Phosphatidyl-choline O-38:30.390.023
58Phosphatidyl-choline O-36:50.380.024
59Ornithine0.380.031
60Phosphatidyl-choline O-36:30.380.020
61Phosphatidyl-choline O-38:60.380.018
62Cysteine0.377.8 × 10−4
63Choline0.376.3 × 10−4
64Phosphatidyl-choline 36:30.350.02
65Phosphatidyl-choline 38:40.350.022
66Phosphatidyl-choline 40:60.350.027
67Acetylcarnitine0.343.9 × 10−5
68Aconitic acid0.335.0 × 10−4
69Hexose0.320.013
70Phosphatidyl-choline 38:50.320.011
71Phosphatidyl-choline O-36:40.320.008
72Taurocholic acid0.320.005
73Phosphatidyl-choline 36:40.310.009
74Phosphatidyl-choline 36:50.310.008
75Phosphatidyl-choline O-38:40.310.007
76Phosphatidyl-choline 38:60.290.007
77Succinic acid0.262.5 × 10−4
78Valerylcarnitine0.257.8 × 10−7C5
79Methylmalonic Acidemia (NBS)0.251.8 × 10−5C3/C0
80Sphinganine d14:00.210.004
81Propionylcarnitine0.158.6 × 10−7 C3
82Triacylglyceride 18:1_33:00.070.004
83Phosphatidyl-inositol (18:1_20:2)0.040.011
Table 2. Expression of carnitine metabolism-related genes in melanoma vs. ctrls, and the relation of their expression with patients’ survival (n.s. = not significant change).
Enzymes Related to Carnitine MetabolismExpression in
Melanoma vs. Ctrls log2(TPM-1)
Patients’ Survival
Hazard Ratio (p < 0.05)
Related to carnitine synthesis
TMLDn.s.n.s.
TMABADHn.sn.s.
SHMT1n.sn.s.
SHMT26.8 vs. 5.5 *HR 1.4 (p = 0.02)
BBOX10.1 vs. 4.9 *n.s.
ALDH9A1n.s.n.s.
TMLHEn.s.n.s.
ALDH9A1n.s.n.s.
Carnitine Carriers
SLC22A52.1 vs. 3.5 *n.s.
SLC25A20n.s.n.s.
SLC22A4n.s.HR 0.66 (p = 0.002)
SLC22A16n.s.n.s.
SLC25A293.9 vs. 5.4 *n.s.
SLC16A9n.s.n.s.
Related to Carnitine Palmitoyltransferases
CPT2n.s.n.s.
CPT1An.s.n.s.
CPT1B3 vs. 4.2 *HR 0.74 (p = 0.02)
CPT1Cn.s.n.s.
ACACB2.1 vs. 3.9 *n.s.
CHKB-CPT1Bn.s.HR 0.75 (p = 0.03)
Carnitine O-Acetyltransferase
CRATn.s.HR 1.3 (p = 0.04)
Carnitine O-Octanoyltransferase
CROT2.9 vs. 3.9 *n.s.
Related to acethylcanitine metabolism
ACADM5 vs. 4 *n.s.
ACAD83.6 vs. 5 *n.s.
ACADSn.s.n.s.
ACADVL7.5 vs. 9 *n.s.
ACADL0.1 vs. 2.1 *n.s.
Related to carnitine deficiency
HADHAn.s.HR = 1.4 (p = 0.009)
IFT813.6 vs. 2.7 *n.s.
* p < 0.0001.
Disclaimer/Publisher’s Note: The statements, opinions and data contained in all publications are solely those of the individual author(s) and contributor(s) and not of MDPI and/or the editor(s). MDPI and/or the editor(s) disclaim responsibility for any injury to people or property resulting from any ideas, methods, instructions or products referred to in the content.

