
Using Targeted Metabolomics to Unravel Phenolic Metabolites of Plant Origin in Animal Milk

 , , , , and
Abstract
:1. Introduction
2. Results
2.1. Qualitative Analysis of Milk Samples
2.2. Quantitative Analysis of Milk Samples
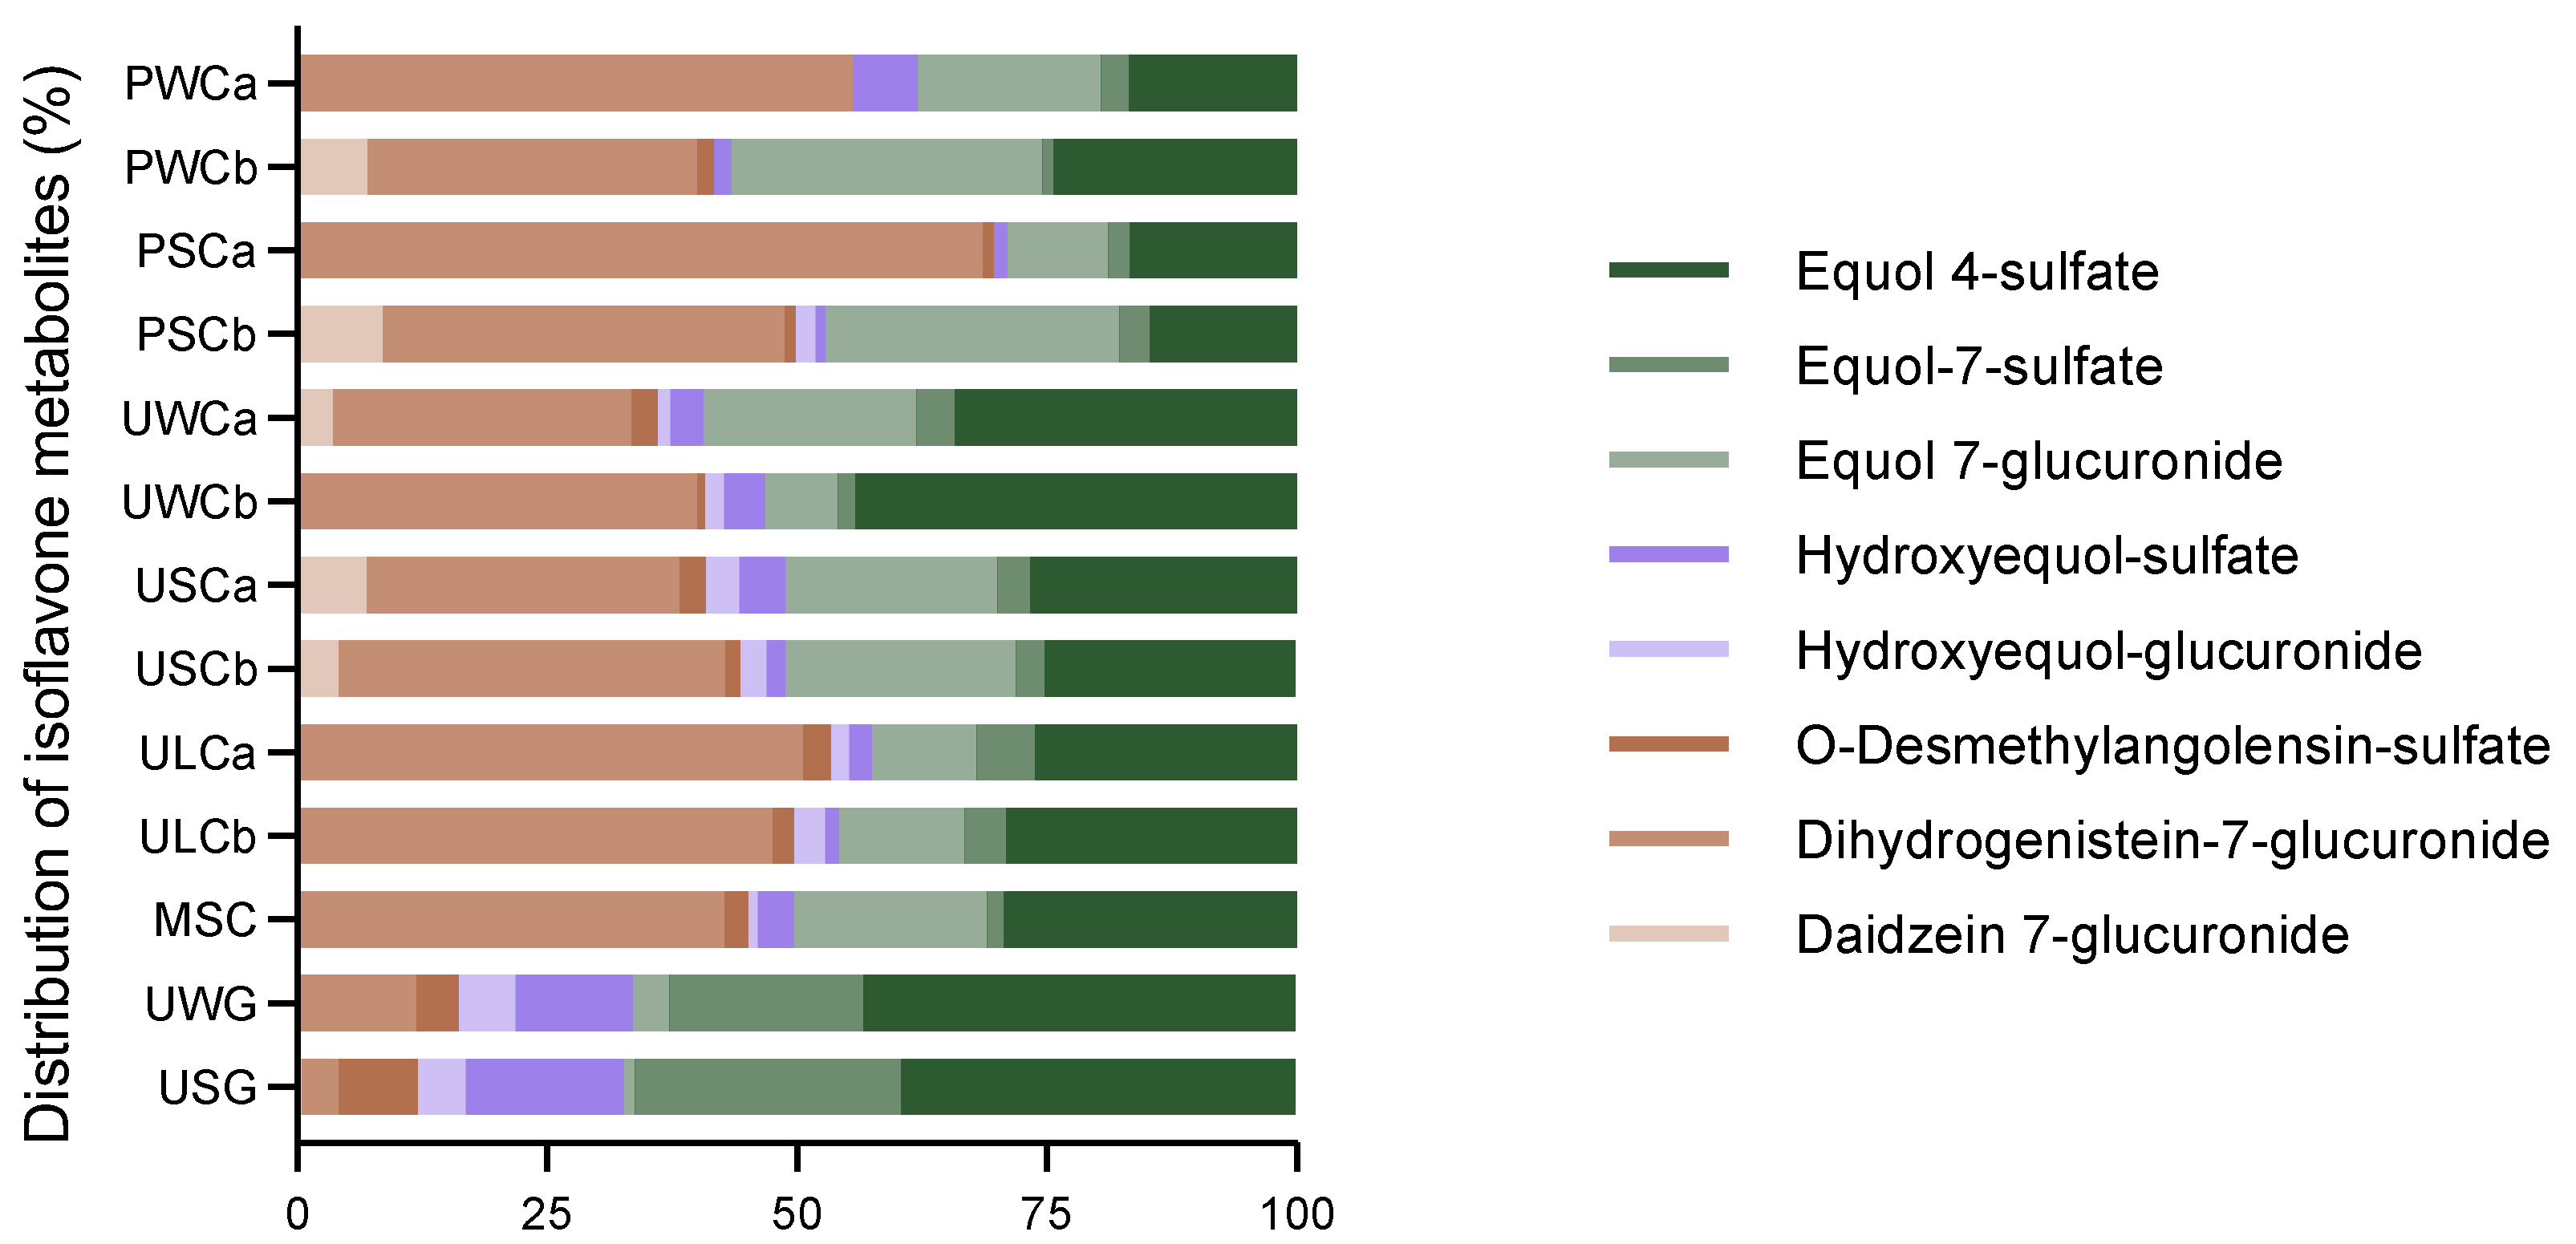
2.2.1. Isoflavone Metabolites
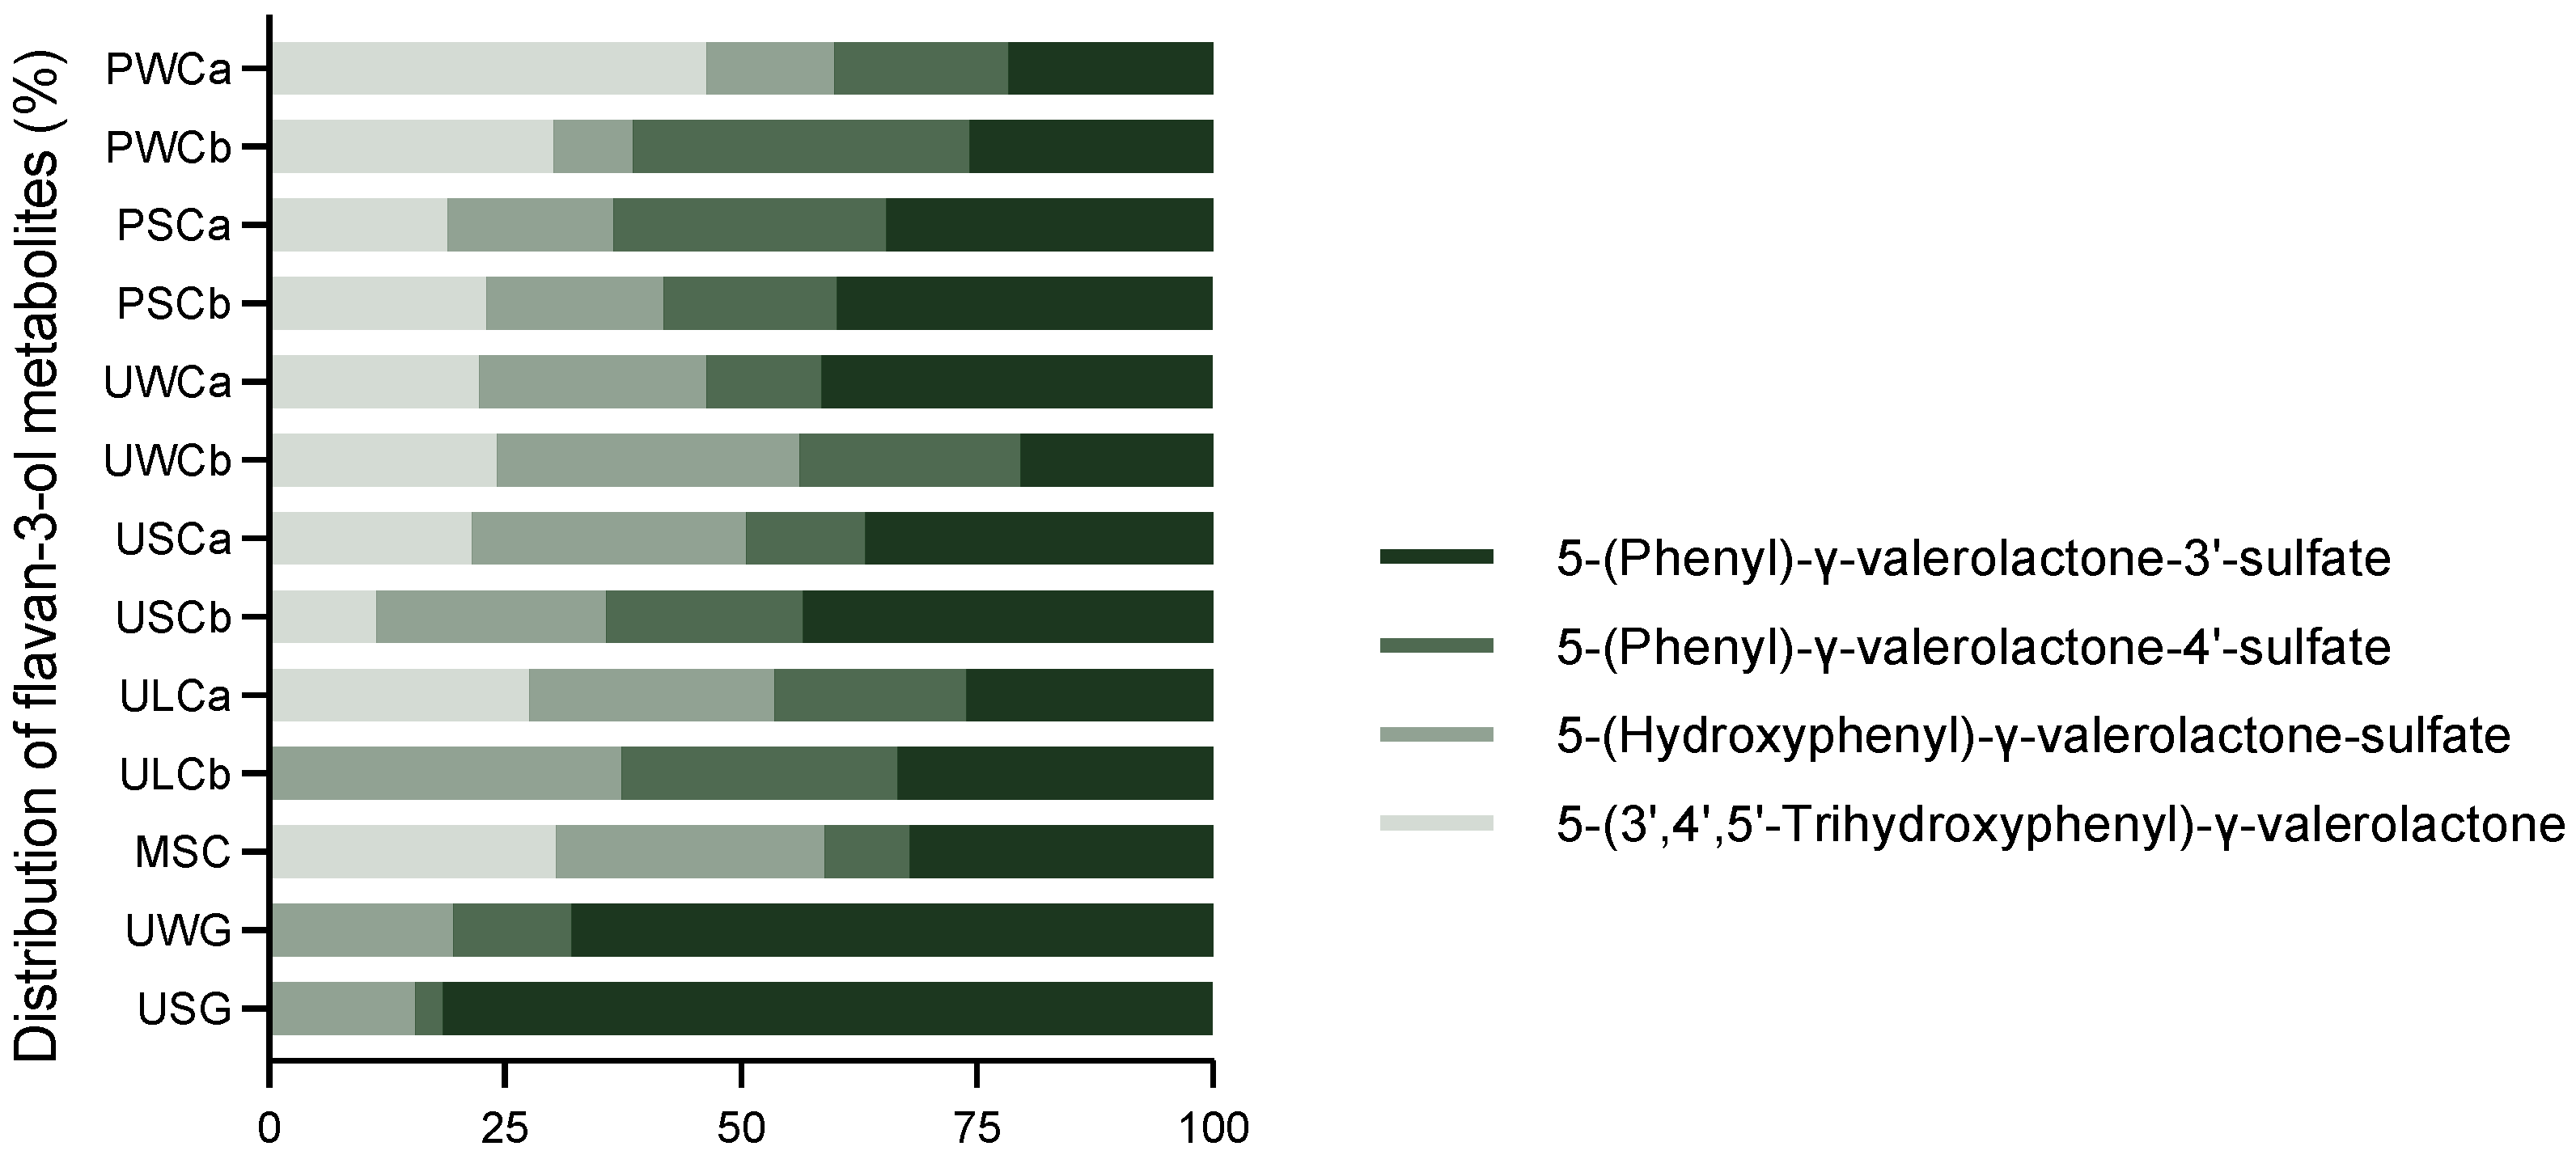
2.2.2. Flavan-3-ol Metabolites
2.2.3. Lignan Metabolites
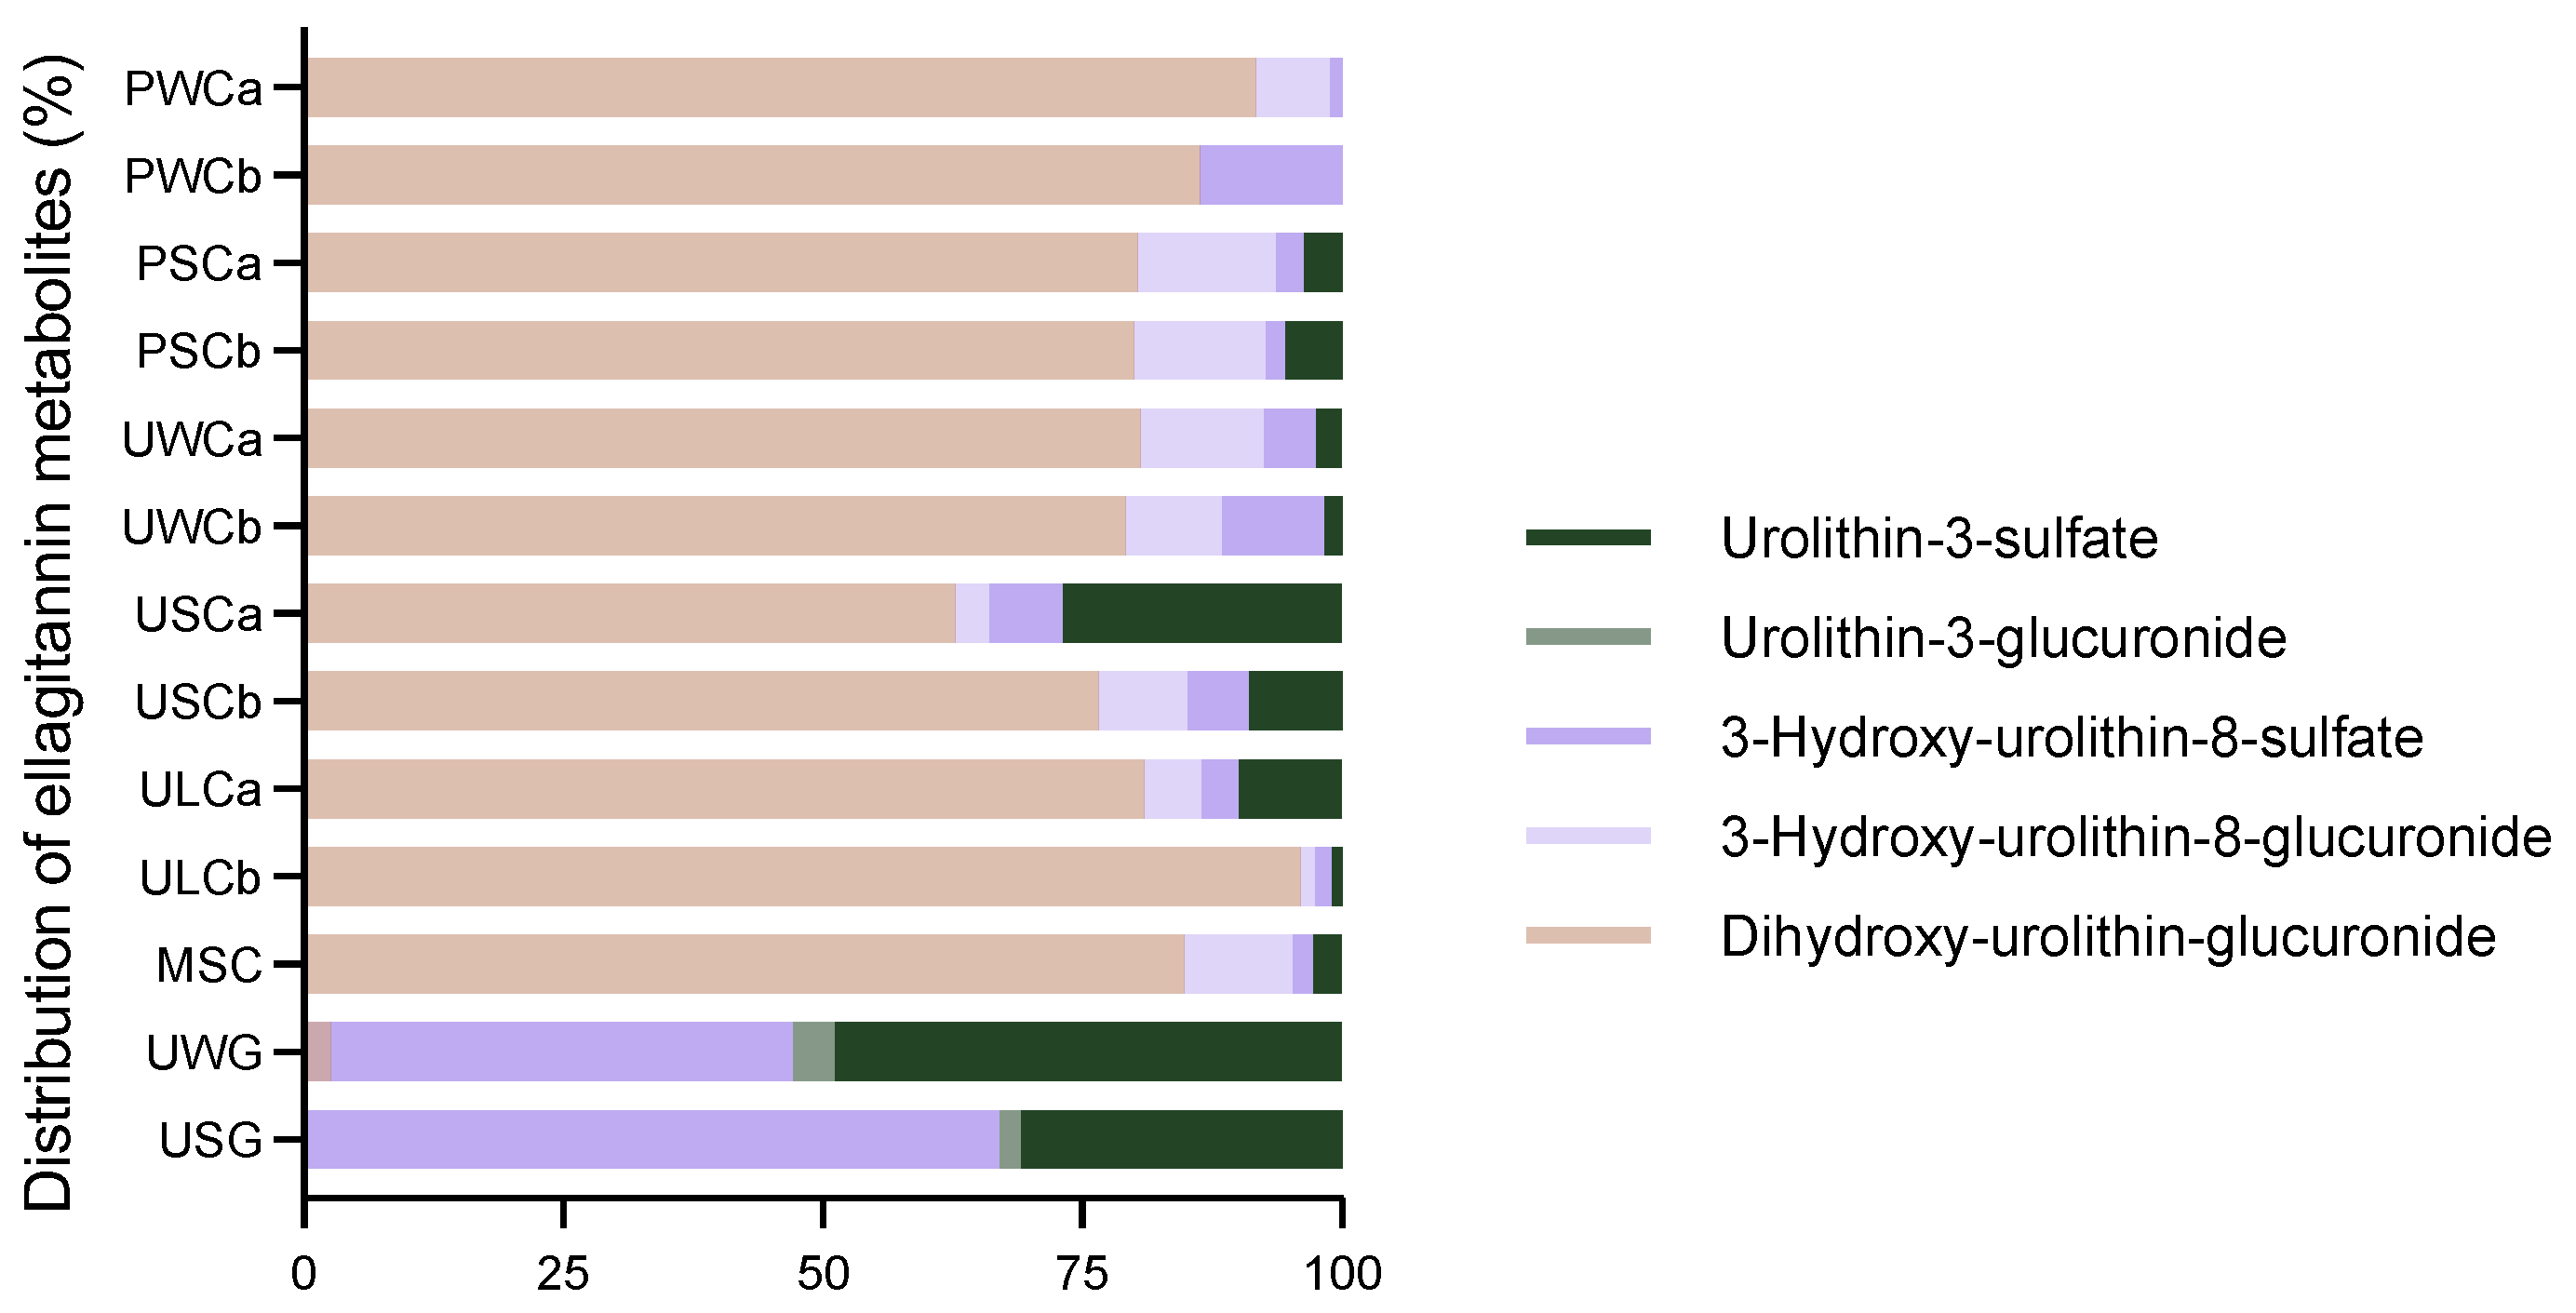
2.2.4. Ellagitannin Metabolites
2.2.5. Hippuric Acids
2.2.6. Benzene Diol Metabolites
3. Discussion
4. Materials and Methods
4.1. Chemicals and Reagents
4.2. Milk Samples
4.3. Sample Preparation
4.4. Qualitative and Quantitative Analysis of Phenolic Compounds
4.5. Statistical Analysis
5. Conclusions
Author Contributions
Funding
Data Availability Statement
Conflicts of Interest
References
- Rocchetti, G.; Gallo, A.; Nocetti, M.; Lucini, L.; Masoero, F. Milk metabolomics based on ultra-high-performance liquid chromatography coupled with quadrupole time-of-flight mass spectrometry to discriminate different cows feeding regimens. Food Res. Int. 2020, 134, 109279. [Google Scholar] [CrossRef]
- Pereira, P.C.; Vicente, F. Milk nutritive role and potential benefits in human health. Nutr. Dairy their Implic. Health Dis. 2017, 161–176. [Google Scholar] [CrossRef]
- Cormick, G.; Belizán, J.M. Calcium intake and health. Nutrients 2019, 11, 1606. [Google Scholar] [CrossRef]
- de Oliveira, M.R.; Silva, T.J.; Barros, E.; Guimarães, V.M.; Baracat-Pereira, M.C.; Eller, M.R.; dos Reis Coimbra, J.S.; de Oliveira, E.B. Anti-hypertensive peptides derived from caseins: Mechanism of Physiological Action, Production Bioprocesses, and Challenges for Food Applications. Appl. Biochem. Biotechnol. 2018, 185, 884–908. [Google Scholar] [CrossRef]
- Ratajczak, A.E.; Zawada, A.; Rychter, A.M.; Dobrowolska, A.; Krela-Kaźmierczak, I. Milk and Dairy Products: Good or Bad for Human Bone? Practical dietary recommendations for the prevention and management of osteoporosis. Nutrients 2021, 13, 1329. [Google Scholar] [CrossRef] [PubMed]
- Thorning, T.K.; Raben, A.; Tholstrup, T.; Soedamah-Muthu, S.S.; Givens, I.; Astrup, A. Milk and dairy products: Good or bad for human health? An assessment of the totality of scientific evidence. Food Nutr. Res. 2016, 60, 32527. [Google Scholar] [CrossRef]
- Avila-Nava, A.; Medina-Vera, I.; Toledo-Alvarado, H.; Corona, L.; Marquez-Mota, C.C. Supplementation with antioxidants and phenolic compounds in ruminant feeding and its effect on dairy products: A systematic review. J. Dairy Res. 2023, 90, 216–226. [Google Scholar] [CrossRef] [PubMed]
- Pizzoferrato, L.; Manzi, P.; Marconi, S.; Fedele, V.; Claps, S.; Rubino, R. Degree of antioxidant protection: A parameter to trace the origin and quality of goat’s milk and cheese. J. Dairy Sci. 2007, 90, 4569–4574. [Google Scholar] [CrossRef] [PubMed]
- Alothman, M.; Hogan, S.A.; Hennessy, D.; Dillon, P.; Kilcawley, K.N.; O’Donovan, M.; Tobin, J.; Fenelon, M.A.; O’Callaghan, T.F. The “Grass-Fed” milk story: Understanding the impact of pasture feeding on the composition and quality of bovine milk. Foods 2019, 8, 350. [Google Scholar] [CrossRef]
- Coppa, M.; Chassaing, C.; Sibra, C.; Cornu, A.; Verbič, J.; Golecký, J.; Engel, E.; Ratel, J.; Boudon, A.; Ferlay, A.; et al. Forage system is the key driver of mountain milk specificity. J. Dairy Sci. 2019, 102, 10483–10499. [Google Scholar] [CrossRef]
- Del Rio, D.; Rodriguez-Mateos, A.; Spencer, J.P.E.; Tognolini, M.; Borges, G.; Crozier, A. Dietary (poly)phenolics in human health: Structures, bioavailability, and evidence of protective effects against chronic diseases. Antioxid. Redox Signal. 2013, 18, 1818–1892. [Google Scholar] [CrossRef] [PubMed]
- Rodriguez-Mateos, A.; Vauzour, D.; Krueger, C.G.; Shanmuganayagam, D.; Reed, J.; Calani, L.; Mena, P.; Del Rio, D.; Crozier, A. Bioavailability, bioactivity and impact on health of dietary flavonoids and related compounds: An update. Arch. Toxicol. 2014, 88, 1803–1853. [Google Scholar] [CrossRef] [PubMed]
- Tsen, S.Y.; Siew, J.; Lau, E.K.L.; Afiqah Bte Roslee, F.; Chan, H.M.; Loke, W.M. Cow’s milk as a dietary source of equol and phenolic antioxidants: Differential distribution in the milk aqueous and lipid fractions. Dairy Sci. Technol. 2014, 94, 625–632. [Google Scholar] [CrossRef]
- Daems, F.; Romnee, J.M.; Heuskin, S.; Froidmont, É.; Lognay, G. Analytical methods used to quantify isoflavones in cow’s milk: A review. Dairy Sci. Technol. 2016, 96, 261–283. [Google Scholar] [CrossRef] [PubMed]
- Foroutan, A.; Guo, A.C.; Vazquez-Fresno, R.; Lipfert, M.; Zhang, L.; Zheng, J.; Badran, H.; Budinski, Z.; Mandal, R.; Ametaj, B.N.; et al. Chemical composition of commercial cow’s milk. J. Agric. Food Chem. 2019, 67, 4897–4914. [Google Scholar] [CrossRef] [PubMed]
- Krajčová, A.; Schulzová, V.; Lojza, J.; Krížová, L.; Hajšlová, J. Phytoestrogens in bovine plasma and milk—LC-MS/MS analysis. Czech J. Food Sci. 2010, 28, 264–274. [Google Scholar] [CrossRef]
- Kuhnle, G.G.C.; Dell’Aquila, C.; Aspinall, S.M.; Runswick, S.A.; Mulligan, A.A.; Bingham, S.A. Phytoestrogen content of foods of animal origin: Dairy products, eggs, meat, fish, and seafood. J. Agric. Food Chem. 2008, 56, 10099–10104. [Google Scholar] [CrossRef] [PubMed]
- Kuhnen, S.; Moacyr, J.R.; Mayer, J.K.; Navarro, B.B.; Trevisan, R.; Honorato, L.A.; Maraschin, M.; Pinheiro Machado Filho, L.C. Phenolic content and ferric reducing-antioxidant power of cow’s milk produced in different pasture-based production systems in southern Brazil. J. Sci. Food Agric. 2014, 94, 3110–3117. [Google Scholar] [CrossRef] [PubMed]
- Kay, C.D.; Clifford, M.N.; Mena, P.; McDougall, G.J.; Andres-Lacueva, C.; Cassidy, A.; Del Rio, D.; Kuhnert, N.; Manach, C.; Pereira-Caro, G.; et al. Recommendations for standardizing nomenclature for dietary (poly)phenol catabolites. Am. J. Clin. Nutr. 2020, 112, 1051–1068. [Google Scholar] [CrossRef] [PubMed]
- Narduzzi, L.; Agulló, V.; Favari, C.; Tosi, N.; Mignogna, C.; Crozier, A.; Del Rio, D.; Mena, P. (Poly)phenolic compounds and gut microbiome: New opportunities for personalized nutrition. Microbiome Res. Reports 2022, 1, 16. [Google Scholar] [CrossRef]
- Tucak, M.; Horvat, D.; Cupic, T.; Krizmanic, G.; Tomas, V.; Ravlic, M.; Popovic, S. Forage legumes as sources of bioactive phytoestrogens for use in pharmaceutics: A review. Curr. Pharm. Biotechnol. 2018, 19, 537–544. [Google Scholar] [CrossRef] [PubMed]
- Andersen, C.; Weisbjerg, M.R.; Hansen-Mller, J.; Sejrsen, K. Effect of forage on the content of phyto-oestrogens in bovine milk. Animal 2009, 3, 617–622. [Google Scholar] [CrossRef] [PubMed]
- Sakakibara, H.; Viala, D.; Ollier, A.; Combeau, A.; Besle, J.M. Isoflavones in several clover species and in milk from goats fed clovers. BioFactors 2004, 22, 237–239. [Google Scholar] [CrossRef] [PubMed]
- Milk Composition Database. Available online: https://mcdb.ca/ (accessed on 10 February 2024).
- Leonard, L.M.; Choi, M.S.; Cross, T.W.L. Maximizing the estrogenic potential of soy isoflavones through the gut microbiome: Implication for cardiometabolic health in postmenopausal women. Nutrients 2022, 14, 553. [Google Scholar] [CrossRef] [PubMed]
- Xu, Z.; Xu, J.; Li, S.; Cui, H.; Zhang, G.; Ni, X.; Wang, J. S-Equol enhances osteoblastic bone formation and prevents bone loss through OPG/RANKL via the PI3K/Akt pathway in streptozotocin-induced diabetic rats. Front. Nutr. 2022, 9, 986192. [Google Scholar] [CrossRef] [PubMed]
- Ping, S.H.; Tian, F.M.; Zhao, Z.M.; Liang, C.Y.; Liu, F.; Wang, Y.D.; Zhang, L. Protective effects of equol on the cartilage and subchondral bone in ovariectomized rats with osteoarthritis. Iran. J. Basic Med. Sci. 2022, 25, 1228–1233. [Google Scholar] [CrossRef] [PubMed]
- Sekikawa, A.; Wharton, W.; Butts, B.; Veliky, C.V.; Garfein, J.; Li, J.; Goon, S.; Fort, A.; Li, M.; Hughes, T.M. potential protective mechanisms of S-equol, a metabolite of soy isoflavone by the gut microbiome, on cognitive decline and dementia. Int. J. Mol. Sci. 2022, 23, 11921. [Google Scholar] [CrossRef] [PubMed]
- Soukup, S.T.; Stoll, D.A.; Danylec, N.; Schoepf, A.; Kulling, S.E.; Huch, M. Metabolism of daidzein and genistein by gut bacteria of the class coriobacteriia. Foods 2021, 10, 2741. [Google Scholar] [CrossRef] [PubMed]
- Soukup, S.T.; Engelbert, A.K.; Watzl, B.; Bub, A.; Kulling, S.E. Microbial metabolism of the soy isoflavones daidzein and genistein in postmenopausal women: Human intervention study reveals new metabotypes. Nutrients 2023, 15, 2352. [Google Scholar] [CrossRef] [PubMed]
- Mena, P.; Bresciani, L.; Brindani, N.; Ludwig, I.A.; Pereira-Caro, G.; Angelino, D.; Llorach, R.; Calani, L.; Brighenti, F.; Clifford, M.N.; et al. Phenyl-γ-valerolactones and phenylvaleric acids, the main colonic metabolites of flavan-3-ols: Synthesis, analysis, bioavailability, and bioactivity. Nat. Prod. Rep. 2019, 36, 714–752. [Google Scholar] [CrossRef]
- Di Pede, G.; Bresciani, L.; Brighenti, F.; Clifford, M.N.; Crozier, A.; Del Rio, D.; Mena, P. In Vitro faecal fermentation of monomeric and oligomeric flavan-3-ols: Catabolic pathways and stoichiometry. Mol. Nutr. Food Res. 2022, 66, 2101090. [Google Scholar] [CrossRef] [PubMed]
- Regos, I.; Urbanella, A.; Treutter, D. Identification and quantification of phenolic compounds from the forage legume sainfoin (Onobrychis viciifolia). J. Agric. Food Chem. 2009, 57, 5843–5852. [Google Scholar] [CrossRef] [PubMed]
- Taghizadeh, A.; Besharati, M. Tannin and its effects in animal nutrition. Tann. Types Foods Contain. Nutr. 2011, 113–137. [Google Scholar]
- Bellassi, P.; Rocchetti, G.; Nocetti, M.; Lucini, L.; Masoero, F.; Morelli, L. A combined metabolomic and metagenomic approach to discriminate raw milk for the production of hard cheese. Foods 2021, 10, 109. [Google Scholar] [CrossRef] [PubMed]
- Cecarini, V.; Cuccioloni, M.; Zheng, Y.; Bonfili, L.; Gong, C.; Angeletti, M.; Mena, P.; Del Rio, D.; Eleuteri, A.M. Flavan-3-ol microbial metabolites modulate proteolysis in neuronal cells reducing amyloid-β (1-42) levels. Mol. Nutr. Food Res. 2021, 65, 2100380. [Google Scholar] [CrossRef] [PubMed]
- Mena, P.; Favari, C.; Acharjee, A.; Chernbumroong, S.; Bresciani, L.; Curti, C.; Brighenti, F.; Heiss, C.; Rodriguez-Mateos, A.; Del Rio, D. Metabotypes of flavan-3-ol colonic metabolites after cranberry intake: Elucidation and statistical approaches. Eur. J. Nutr. 2022, 61, 1299–1317. [Google Scholar] [CrossRef] [PubMed]
- Mena, P.; Ludwig, I.A.; Tomatis, V.B.; Acharjee, A.; Calani, L.; Rosi, A.; Brighenti, F.; Ray, S.; Griffin, J.L.; Bluck, L.J.; et al. Inter-individual variability in the production of flavan-3-ol colonic metabolites: Preliminary elucidation of urinary metabotypes. Eur. J. Nutr. 2019, 58, 1529–1543. [Google Scholar] [CrossRef] [PubMed]
- Wyse, J.; Latif, S.; Gurusinghe, S.; McCormick, J.; Weston, L.A.; Stephen, C.P. Phytoestrogens: A review of their impacts on reproductive physiology and other effects upon grazing livestock. Animals 2022, 12, 2709. [Google Scholar] [CrossRef] [PubMed]
- Petit, H.V.; Gagnon, N. Concentration of the mammalian lignans enterolactone and enterodiol in milk of cows fed diets containing different concentrations of whole flaxseed. Animal 2009, 3, 1428–1435. [Google Scholar] [CrossRef]
- Mullens, D.A.; Ivanov, I.; Hullar, M.A.J.; Randolph, T.W.; Lampe, J.W.; Chapkin, R.S. Personalized nutrition using microbial metabolite phenotype to stratify participants and non-invasive host exfoliomics reveal the effects of flaxseed lignan supplementation in a placebo-controlled crossover trial. Nutrients 2022, 14, 2377. [Google Scholar] [CrossRef]
- Liu, G.; Li, J.; Li, Y.; Hu, Y.; Franke, A.A.; Liang, L.; Hu, F.B.; Chan, A.T.; Mukamal, K.J.; Rimm, E.B.; et al. Gut microbiota-derived metabolites and risk of coronary artery disease: A prospective study among US men and women. Am. J. Clin. Nutr. 2021, 114, 238–247. [Google Scholar] [CrossRef] [PubMed]
- Eriksen, A.K.; Kyrø, C.; Nørskov, N.P.; Frederiksen, K.; Bach Knudsen, K.E.; Overvad, K.; Landberg, R.; Tjønneland, A.; Olsen, A. Pre-diagnostic plasma enterolactone concentrations are associated with lower mortality among individuals with type 2 diabetes: A case-cohort study in the Danish Diet, Cancer and Health cohort. Diabetologia 2019, 62, 959–969. [Google Scholar] [CrossRef] [PubMed]
- González-Barrio, R.; Truchado, P.; García-Villalba, R.; Hervás, G.; Frutos, P.; Espín, J.C.; Tomás-Barberán, F.A. Metabolism of oak leaf ellagitannins and urolithin production in beef cattle. J. Agric. Food Chem. 2012, 60, 3068–3077. [Google Scholar] [CrossRef] [PubMed]
- Cortés-Martín, A.; García-Villalba, R.; García-Mantrana, I.; Rodríguez-Varela, A.; Romo-Vaquero, M.; Collado, M.C.; Tomás-Barberán, F.A.; Espín, J.C.; Selma, M.V. Urolithins in human breast milk after walnut intake and kinetics of gordonibacter colonization in newly born: The role of mothers’ urolithin metabotypes. J. Agric. Food Chem. 2020, 68, 12606–12616. [Google Scholar] [CrossRef] [PubMed]
- Zhang, X.; Sandhu, A.; Edirisinghe, I.; Burton-Freeman, B. An exploratory study of red raspberry (Rubus idaeus L.) (poly)phenols/metabolites in human biological samples. Food Funct. 2018, 9, 806–818. [Google Scholar] [CrossRef] [PubMed]
- García-Villalba, R.; Giménez-Bastida, J.A.; Cortés-Martín, A.; Ávila-Gálvez, M.Á.; Tomás-Barberán, F.A.; Selma, M.V.; Espín, J.C.; González-Sarrías, A. Urolithins: A comprehensive update on their metabolism, bioactivity, and associated gut microbiota. Mol. Nutr. Food Res. 2022, 66, 2101019. [Google Scholar] [CrossRef] [PubMed]
- Ryu, H.W.; Song, H.H.; Kim, K.O.; Park, Y.J.; Kim, D.Y.; Kim, J.H.; Oh, S.R. Secondary metabolite profiling and modulation of antioxidants in wild and cultivated Euphorbia supina. Ind. Crops Prod. 2016, 89, 215–224. [Google Scholar] [CrossRef]
- Sousa, D.O.; Murphy, M.; Hatfield, R.; Nadeau, E. Effects of harvest date and grass species on silage cell wall components and lactation performance of dairy cows. J. Dairy Sci. 2021, 104, 5391–5404. [Google Scholar] [CrossRef] [PubMed]
- Münger, L.H.; Trimigno, A.; Picone, G.; Freiburghaus, C.; Pimentel, G.; Burton, K.J.; Pralong, F.P.; Vionnet, N.; Capozzi, F.; Badertscher, R.; et al. Identification of urinary food intake biomarkers for milk, cheese, and soy-based drink by untargeted GC-MS and NMR in healthy humans. J. Proteome Res. 2017, 16, 3321–3335. [Google Scholar] [CrossRef]
- Clifford, M.N.; Ludwig, I.A.; Pereira-Caro, G.; Zeraik, L.; Borges, G.; Almutairi, T.M.; Dobani, S.; Bresciani, L.; Mena, P.; Gill, C.I.R.; et al. Exploring and disentangling the production of potentially bioactive phenolic catabolites from dietary (poly)phenols, phenylalanine, tyrosine and catecholamines. Redox Biol. 2024, 71, 103068. [Google Scholar] [CrossRef]
- Tomás-Barberán, F.A.; González-Sarrías, A.; García-Villalba, R.; Núñez-Sánchez, M.A.; Selma, M.V.; García-Conesa, M.T.; Espín, J.C. Urolithins, the rescue of “old” metabolites to understand a “new” concept: Metabotypes as a nexus among phenolic metabolism, microbiota dysbiosis, and host health status. Mol. Nutr. Food Res. 2017, 61, 1500901. [Google Scholar] [CrossRef]
- Rowland, I.R.; Wiseman, H.; Sanders, T.A.B.; Adlercreutz, H.; Bowey, E.A. Interindividual variation in metabolism of soy isoflavones and lignans: Influence of habitual diet on equol production by the gut microflora. Nutr. Cancer 2000, 36, 27–32. [Google Scholar] [CrossRef] [PubMed]
- Hazim, S.; Curtis, P.J.; Schär, M.Y.; Ostertag, L.M.; Kay, C.D.; Minihane, A.M.; Cassidy, A. Acute benefits of the microbial-derived isoflavone metabolite equol on arterial stiffness in men prospectively recruited according to equol producer phenotype: A double-blind randomized controlled trial. Am. J. Clin. Nutr. 2016, 103, 694–702. [Google Scholar] [CrossRef]
- Mena, P.; Dall’Asta, M.; Calani, L.; Brighenti, F.; Del Rio, D. Gastrointestinal stability of urolithins: An in vitro approach. Eur. J. Nutr. 2017, 56, 99–106. [Google Scholar] [CrossRef]
- Andreux, P.A.; Blanco-Bose, W.; Ryu, D.; Burdet, F.; Ibberson, M.; Aebischer, P.; Auwerx, J.; Singh, A.; Rinsch, C. The mitophagy activator urolithin A is safe and induces a molecular signature of improved mitochondrial and cellular health in humans. Nat. Metab. 2019, 1, 595–603. [Google Scholar] [CrossRef] [PubMed]
- Cabiddu, A.; Delgadillo-Puga, C.; Decandia, M.; Molle, G. Extensive ruminant production systems and milk quality with emphasis on unsaturated fatty acids, volatile compounds, antioxidant protection degree and phenol content. Animals 2019, 9, 771. [Google Scholar] [CrossRef]
- Delgadillo-Puga, C.; Noriega, L.G.; Morales-Romero, A.M.; Nieto-Camacho, A.; Granados-Portillo, O.; Rodríguez-López, L.A.; Alemán, G.; Furuzawa-Carballeda, J.; Tovar, A.R.; Cisneros-Zevallos, L.; et al. Goat’s milk intake prevents obesity, hepatic steatosis and insulin resistance in mice fed a high-fat diet by reducing inflammatory markers and increasing energy expenditure and mitochondrial content in skeletal muscle. Int. J. Mol. Sci. 2020, 21, 5530. [Google Scholar] [CrossRef]
- Delgadillo-Puga, C.; Cuchillo-Hilario, M.; León-Ortiz, L.; Ramírez-Rodríguez, A.; Cabiddu, A.; Navarro-Ocaña, A.; Morales-Romero, A.M.; Medina-Campos, O.N.; Pedraza-Chaverri, J. Goats’ feeding supplementation with Acacia farnesiana pods and their relationship with milk composition: Fatty acids, polyphenols, and antioxidant activity. Animals 2019, 9, 515. [Google Scholar] [CrossRef] [PubMed]
- Chávez-Servín, J.L.; Andrade-Montemayor, H.M.; Velázquez Vázquez, C.; Aguilera Barreyro, A.; García-Gasca, T.; Ferríz Martínez, R.A.; Olvera Ramírez, A.M.; de la Torre-Carbot, K. Effects of feeding system, heat treatment and season on phenolic compounds and antioxidant capacity in goat milk, whey and cheese. Small Rumin. Res. 2018, 160, 54–58. [Google Scholar] [CrossRef]
- Rocchetti, G.; Ghilardelli, F.; Mosconi, M.; Masoero, F.; Gallo, A. Occurrence of polyphenols, isoflavonoids, and their metabolites in milk samples from different cow feeding regimens. Dairy 2022, 3, 314–325. [Google Scholar] [CrossRef]
- Adler, S.A.; Purup, S.; Hansen-Møller, J.; Thuen, E.; Steinshamn, H. Phytoestrogens and their metabolites in bulk-tank milk: Effects of farm management and season. PLoS ONE 2015, 10, e0127187. [Google Scholar] [CrossRef] [PubMed]
- Stergiadis, S.; Nørskov, N.P.; Purup, S.; Givens, I.; Lee, M.R.F. Comparative nutrient profiling of retail goat and cow milk. Nutrients 2019, 11, 2282. [Google Scholar] [CrossRef] [PubMed]
- Wang, L.; Xu, Q.; Kong, F.; Yang, Y.; Wu, D.; Mishra, S.; Li, Y. Exploring the goat rumen microbiome from seven days to two years. PLoS ONE 2016, 11, e0154354. [Google Scholar] [CrossRef] [PubMed]
- Kasparovska, J.; Pecinkova, M.; Dadakova, K.; Krizova, L.; Hadrova, S.; Lexa, M.; Lochman, J.; Kasparovsky, T. Effects of isoflavone-enriched feed on the rumen microbiota in dairy cows. PLoS ONE 2016, 11, e0154642. [Google Scholar] [CrossRef] [PubMed]
- Brindani, N.; Mena, P.; Calani, L.; Benzie, I.; Choi, S.W.; Brighenti, F.; Zanardi, F.; Curti, C.; Del Rio, D. Synthetic and analytical strategies for the quantification of phenyl-γ-valerolactone conjugated metabolites in human urine. Mol. Nutr. Food Res. 2017, 61, 6–10. [Google Scholar] [CrossRef]
- Feliciano, R.P.; Istas, G.; Heiss, C.; Rodriguez-Mateos, A. Plasma and urinary phenolic profiles after acute and repetitive intake of wild blueberry. Molecules 2016, 21, 1120. [Google Scholar] [CrossRef]


| Milk Sample Type | Code * |
|---|---|
| Pasteurized whole cow’s milk | PWCa, PWCb |
| Semi-skimmed pasteurized cow’s milk | PSCa, PSCb |
| Whole UHT cow’s milk | UWCa, UWCb |
| Semi-skimmed UHT cow’s milk | USCa, USCb |
| Whole lactose-free UHT cow’s milk | ULCa, ULCb |
| Microfiltered semi-skimmed cow’s milk | MSC |
| Whole UHT goat’s milk | UWG |
| Semi-skimmed UHT goat’s milk | USG |
| Compound | Retention Time (min) | Parent Ion [M-H] (m/z) | S-lens | Quantifier Product Ion (m/z) | CE (V) | Qualifier Product Ion (m/z) | CE (V) |
|---|---|---|---|---|---|---|---|
| Isoflavone metabolites | |||||||
| Dihydrogenistein-7-glucuronide | 5.49 | 447 | 108 | 271 | 25 | 165 | 24 |
| Daidzein-7-glucuronide | 4.71 | 429 | 104 | 252 | 37 | 113 | 18 |
| O-Desmethylangolensin-sulfate | 7.63 | 337 | 136 | 257 | 20 | 108 | 34 |
| Hydroxyequol-glucuronide | 5.52 | 433 | 108 | 257 | 26 | 113 | 18 |
| Hydroxyequol-sulfate | 6.46 | 337 | 136 | 257 | 23 | ||
| Equol-7-glucuronide | 5.27 | 417 | 108 | 113 | 22 | 241 | 26 |
| Equol-7-sulfate | 7.27 | 321 | 136 | 241 | 23 | 119 | 39 |
| Equol-4′-sulfate | 7.56 | 321 | 136 | 241 | 23 | 121 | 29 |
| Flavan-3-ol metabolites | |||||||
| 5-(3′,4′,5′-Trihydroxyphenyl)-γ-valerolactone | 5.54 | 223 | 75 | 205 | 12 | 138 | 26 |
| 5-(3ʹ/4ʹ-Hydroxyphenyl)-γ-valerolactone-sulfate | 5.62 | 287 | 96 | 207 | 23 | 119 | 35 |
| 5-Phenyl-γ-valerolactone-4′-sulfate | 5.04 | 271 | 93 | 191 | 23 | 147 | 35 |
| 5-Phenyl-γ-valerolactone-3′-sulfate | 5.88 | 271 | 93 | 191 | 23 | 147 | 35 |
| Lignan metabolites | |||||||
| Enterolactone-glucuronide | 5.49 | 473 | 108 | 297 | 25 | 113 | 20 |
| Enterolactone-sulfate | 7.89 | 377 | 136 | 297 | 25 | 253 | 26 |
| Enterolactone | 6.02 | 297 | 115 | 253 | 26 | 189 | 43 |
| Enterodiol-sulfate | 7.67 | 381 | 136 | 253 | 26 | ||
| Ellagitannin metabolites | |||||||
| Dihydroxy-urolithin-glucuronide (urolithin C-glucuronide) | 4.46 | 419 | 78 | 243 | 37 | 113 | 15 |
| 3-Hydroxy-urolithin-8-glucuronide (also known as urolithin A-glucuronide) | 4.79 | 403 | 78 | 227 | 37 | 113 | 15 |
| 3-Hydroxy-urolithin-8-sulfate (urolithin A-sulfate) | 6.67 | 307 | 78 | 227 | 19 | 183 | 19 |
| Urolithin-3-glucuronide (also known as urolithin B-glucuronide) | 5.37 | 387 | 83 | 211 | 35 | 113 | 17 |
| Urolithin-3-sulfate (also known as urolithin B-sulfate) | 8.23 | 291 | 78 | 211 | 19 | 167 | 19 |
| Hippuric acid derivatives | |||||||
| 3′-Hydroxyhippuric acid | 2.06 | 194 | 72 | 150 | 15 | 100 | 11 |
| Hippuric acid | 3.59 | 178 | 61 | 134 | 15 | 77.2 | 22 |
| Benzene diols derivatives | |||||||
| Benzene-1/2-ol-sulfate (isomer 1, catechol-sulfate 1) | 2.22 | 189 | 70 | 109 | 20 | 81 | 20 |
| Benzene-1/2-ol-sulfate (isomer 2, catechol-sulfate 2) | 3.36 | 189 | 70 | 109 | 20 | 81 | 20 |
| Compound * (ng/100 mL ± Standard Error) | |||||||||
|---|---|---|---|---|---|---|---|---|---|
| Milk Sample | DHG-7-G | D-7-G | ODMA-S | HE-G | HE-S | E-7-G | E-7-S | E-4-S | Total |
| PWCa | 78 ± 13 d | - | - | - | 9.3 ± 3 c | 26± 5 f | 3.9 ± 0.2 c | 23 ± 5 d | 141 ± 6 c |
| PWCb | 89 ± 9 d | 19 ± 1 b | 4.5 ± 0.9 c | - | 4.6 ± 0.6 c | 84 ± 1 abc | 2.8 ± 0.1 c | 65 ± 9 cd | 269± 17 c |
| PSCa | 192 ± 49 bcd | - | 3.0 ± 0.1 c | - | 4.0 ± 0.9 c | 28 ± 8 ef | 6.3 ± 1.4 c | 46 ± 3 d | 280 ± 48 c |
| PSCb | 161 ± 43 cd | 34 ± 9 a | 4.8 ± 0.1 c | 7.8 ± 1.6 c | 3.8 ± 0.4 c | 118 ± 21 a | 12 ± 0.1 c | 59 ± 4 cd | 400 ± 67 c |
| UWCa | 142 ± 29 abc | 17 ± 3 b | 13 ± 1 c | 6.3 ± 1.0 c | 15 ± 1 c | 102 ± 12 ab | 19 ± 2 c | 163 ± 17 cd | 478 ± 33 c |
| UWCb | 229 ± 53 cd | - | 4.6 ± 0.2 c | 11 ± 0.5 c | 23 ± 4 c | 42 ± 3 def | 10 ± 3 c | 253 ± 9 c | 591 ± 1 c |
| USCa | 159 ± 36 cd | 34 ± 9 a | 14 ± 1 c | 17 ± 2 c | 23 ± 2 c | 109 ± 22 ab | 17 ± 3 c | 136 ± 4 cd | 501 ± 20 c |
| USCb | 140 ± 35 cd | 15 ± 2 b | 5.7 ± 0.2 c | 9.4 ± 0.3 c | 6.4 ± 1.5 c | 84 ± 13 abc | 11 ± 3 c | 91 ± 19 cd | 353 ± 10 c |
| ULCa | 307 ± 50 a | - | 17 ± 1 c | 11 ± 1 c | 13 ± 3 c | 64 ± 8 cde | 36 ± 9 c | 159 ± 25 cd | 607 ± 81 c |
| ULCb | 280 ± 52 ab | - | 13 ± 4 c | 18 ± 2 c | 8.1 ± 0.1 c | 74 ± 5 bcd | 25 ± 5 c | 172 ± 40 cd | 590 ± 92 c |
| MSC | 179 ± 2 bcd | - | 10 ± 2 c | 4.2 ± 0.3 c | 15 ± 4 c | 81 ± 14 bc | 7 ± 2 c | 123 ± 27 d | 419 ± 46 c |
| UWG | 280 ± 48 ab | - | 101 ± 10 b | 131 ± 12 b | 278 ± 3 b | 87 ± 17 abc | 457 ± 88 b | 1016 ± 207 b | 2350 ± 374 b |
| USG | 143 ± 35 cd | 17 ±1 b | 313 ± 1 a | 188 ± 38 a | 616 ± 78 a | 43 ± 3 def | 1044 ± 120 a | 1540 ± 108 a | 3904 ± 345 a |
| Compound * (ng/100 mL ± Standard Error) | |||||
|---|---|---|---|---|---|
| Milk Sample | THP-γ-VL | HP-γ-VL-S | P-γ-VL-4-S | P-γ-VL-3-S | TOTAL |
| PWCa | 140 ± 18 a | 41 ± 4 c | 56 ± 3 d | 65 ± 11 c | 303 ± 16 c |
| PWCb | 111 ± 11 a | 31 ± 1 c | 131 ± 20 c | 95 ± 7 c | 367 ± 30 c |
| PSCa | 30 ± 2 cd | 28 ± 5 c | 46 ± 12 d | 56 ± 1 c | 161 ± 10 c |
| PSCb | 56 ± 1 bc | 45 ± 8 c | 44 ± 11 d | 96 ± 11 c | 241 ± 10 c |
| UWCa | 71 ± 12 b | 77 ± 15 c | 38 ± 5 d | 133 ± 11 c | 320 ± 31 c |
| UWCb | 45 ± 13 bcd | 60 ± 16 c | 44 ± 10 d | 38 ± 11 c | 188 ± 7 c |
| USCa | 71 ± 15 b | 96 ± 10 c | 41 ± 5 d | 122 ± 13 c | 330 ± 5 c |
| USCb | 20 ± 2 d | 42 ± 4 c | 36 ± 5 d | 75 ± 16 c | 173 ± 20 c |
| ULCa | 64 ± 6 b | 61 ± 10 c | 47 ± 14 d | 601 ± 14 c | 233 ± 43 c |
| ULCb | - | 63 ± 6 c | 50 ± 8 d | 57 ± 9 c | 170 ± 13 c |
| MSC | 76 ± 13 b | 72 ± 2 c | 23 ± 5 d | 80 ± 8 c | 252 ± 17 c |
| UWG | - | 333 ± 54 b | 216 ± 33 b | 1161 ± 79 b | 1710 ± 165 b |
| USG | - | 2676 ± 122 a | 497 ± 29 a | 14,101 ± 692 a | 17,274 ± 827 a |
| Compound * (ng/100 mL ± Standard Error) | ||||
|---|---|---|---|---|
| Milk Sample | EL-G | EL-S | EL | TOTAL |
| PWCa | 779 ± 26 a | 116 ± 26 c | 97 ± 11 ef | 992 ± 199 bcd |
| PWCb | 698 ± 182 a | 84 ± 1 c | 66 ± 22 ef | 848 ± 201 cde |
| PSCa | 744 ± 24 a | 189 ± 2 c | 56 ± 1 f | 990 ± 22 bcd |
| PSCb | 770 ± 98 a | 177 ± 14 c | 110 ± 17 ef | 1057 ± 113 bcd |
| UWCa | 780 ± 162 a | 538 ± 62 a | 188 ± 10 cde | 150 ± 187 a |
| UWCb | 756 ± 167 a | 427 ± 89 ab | 152 ± 5 cdef | 1335 ± 183 ab |
| USCa | 65 ± 15 b | 602 ± 110 a | 14 ± 42 def | 810 ± 73 def |
| USCb | 57 ± 5 b | 256 ± 19 bc | 124 ± 36 def | 437 ± 33 fg |
| ULCa | 125 ± 21 b | 579 ± 83 a | 278 ± 62 c | 982 ± 112 bcd |
| ULCb | 158 ± 37 b | 55 ± 104 a | 833 ± 3 a | 1496 ± 102 a |
| MSC | 72 ±2 b | 201 ± 64 c | 121 ± 24 def | 394 ±50 g |
| UWG | 113 ± 17 b | 181 ± 37 c | 242 ± 23 cd | 535± 42 efg |
| USG | 88 ± 17 b | 439 ± 31 a | 667 ± 109 b | 119 ± 125 abc |
| Compound * (ng/100 mL ± Standard Error) | ||||||
|---|---|---|---|---|---|---|
| Milk Sample | DHU-G | 3-HU-8-G | 3-HU-8-S | U-3-G | U-3-S | TOTAL |
| PWCa | 427 ± 29 a | 33 ± 7 bc | 4.8 ± 1.5 c | - | - | 465 ± 32 c |
| PWCb | 237 ± 27 cd | 37 ± 3 b | - | - | - | 274 ± 28 c |
| PSCa | 256 ± 27 bcd | 43 ± 9 b | 8.3 ± 1.6 c | - | 12 ± 2 c | 319 ± 38 c |
| PSCb | 416 ± 17 ab | 65 ± 11 a | 9.6 ± 1.8 c | - | 28 ± 1 c | 514 ± 26 c |
| UWCa | 266 ± 46 bcd | 39 ± 9 b | 16 ± 5 c | - | 8.4 ± 0.1 c | 329 ± 57 c |
| UWCb | 289 ± 68 abcd | 34 ± 9 bc | 36 ± 7 c | - | 6.5 ± 1.9 c | 365 ± 61 c |
| USCa | 224 ± 58 cde | 12 ± 1 d | 25 ± 1 c | - | 96 ± 14 c | 357 ± 70 c |
| USCb | 365 ± 18 abc | 41 ± 7 b | 28 ± 8 c | - | 43 ± 4 c | 476 ± 25 c |
| ULCa | 244 ± 48 cd | 7 ±1 cd | 10 ± 1 c | - | 30 ± 7 c | 301 ± 54 c |
| ULCb | 406 ± 13 ab | 5.7 ± 0.6 d | 6.6 ± 1 c | - | 4.2 ± 0.4 c | 423 ± 131 c |
| MSC | 264 ± 67 bcd | 33 ± 2 bc | 5.7 ± 1.4 c | - | 8.8 ± 1.1 c | 311 ± 69 c |
| UWG | 145 ± 4 de | - | 2414 ± 262 b | 222 ± 59 b | 2652 ± 334 b | 5433 ± 605 b |
| USG | 76 ± 10 e | - | 81534 ± 17 a | 2647 ± 455 a | 37,581 ± 1956 a | 121,839 ± 2104 a |
| Compound * (µg/100 mL ± Standard Error) | |||
|---|---|---|---|
| Milk Sample | 3′-HHA | HA | TOTAL |
| PWCa | 25 ± 5 c | 1847 ± 226 ab | 1872 ± 228 b |
| PWCb | 10 ± 2 c | 1381 ± 313 bc | 1391 ± 312 bc |
| PSCa | 13 ± 2 c | 1215 ± 172 c | 1228 ± 174 c |
| PSCb | 16 ± 1 c | 1245 ± 21 c | 1261 ± 21 c |
| UWCa | 17 ± 2 c | 12401 ± 82 c | 1258 ± 84 c |
| UWCb | 18 ± 4 c | 1495 ± 171 bc | 1514 ± 175 bc |
| USCa | 15 ± 1 c | 1197 ± 86 c | 1211 ± 89 c |
| USCb | 19 ± 4 c | 1378 ± 234 bc | 1397 ± 23 bc |
| ULCa | 14 ± 1 c | 1349 ± 133 bc | 1363 ± 134 bc |
| ULCb | 11 ± 2 c | 1427 ± 283 bc | 1438 ± 284 bc |
| MSC | 16 ± 3 c | 1306 ± 120 bc | 1322 ± 122 bc |
| UWG | 67 ± 13 b | 1435 ± 148 bc | 1502 ± 158 bc |
| USG | 169 ± 15 a | 2366 ± 218 a | 2535 ± 228 a |
| Compound * (ng/100 mL ± Standard Error) | |||
|---|---|---|---|
| Milk Sample | B-S1 | B-S2 | TOTAL |
| PWCa | 5.4± 0.5 c | 4.3 ± 0.2 c | 9.7 ± 0.6 c |
| PWCb | 6.5 ± 0.6 bc | 2.8 ± 0.8 c | 9.3 ± 0.4 c |
| PSCa | 2.3 ± 0.4 c | 1.7 ± 0.1 c | 4.0 ± 0.4 c |
| PSCb | 2.8 ± 0.3 c | 4.6 ± 1.3 c | 7.4 ± 1.5 c |
| UWCa | 3.8 ± 0.6 c | 3.4 ± 0.8 c | 7.2 ±1.4 c |
| UWCb | 3.9 ± 0.9 c | 4.3 ± 1.1 c | 8.2 ± 1.8 c |
| USCa | 2.8 ± 0.6 c | 3.6 ± 0.6 c | 6.4 ± 0.6 c |
| USCb | 3.8 ± 0.4 c | 2.2 ± 0.4 c | 6.0 ± 0.4 c |
| ULCa | 4.0 ± 0.4 c | 2.8 ± 0.1 c | 4.8 ± 0.4 c |
| ULCb | 56 ± 0.5 c | 2.7 ± 0.6 c | 8.3 ± 1.0 c |
| MSC | 3.7 ± 0.6 c | 4.5 ± 0.8 c | 8.1 ± 1.4 c |
| UWG | 11 ± 1 b | 30 ± 6 b | 41 ± 5 b |
| USG | 98 ± 5 a | 45 ± 4 a | 143 ± 9 a |
Disclaimer/Publisher’s Note: The statements, opinions and data contained in all publications are solely those of the individual author(s) and contributor(s) and not of MDPI and/or the editor(s). MDPI and/or the editor(s) disclaim responsibility for any injury to people or property resulting from any ideas, methods, instructions or products referred to in the content. |
© 2024 by the authors. Licensee MDPI, Basel, Switzerland. This article is an open access article distributed under the terms and conditions of the Creative Commons Attribution (CC BY) license (https://creativecommons.org/licenses/by/4.0/).
Share and Cite
Agulló, V.; Favari, C.; Pilla, N.; Bresciani, L.; Tomás-Barberán, F.A.; Crozier, A.; Del Rio, D.; Mena, P. Using Targeted Metabolomics to Unravel Phenolic Metabolites of Plant Origin in Animal Milk. Int. J. Mol. Sci. 2024, 25, 4536. https://doi.org/10.3390/ijms25084536
Agulló V, Favari C, Pilla N, Bresciani L, Tomás-Barberán FA, Crozier A, Del Rio D, Mena P. Using Targeted Metabolomics to Unravel Phenolic Metabolites of Plant Origin in Animal Milk. International Journal of Molecular Sciences. 2024; 25(8):4536. https://doi.org/10.3390/ijms25084536
Chicago/Turabian StyleAgulló, Vicente, Claudia Favari, Niccolò Pilla, Letizia Bresciani, Francisco A. Tomás-Barberán, Alan Crozier, Daniele Del Rio, and Pedro Mena. 2024. "Using Targeted Metabolomics to Unravel Phenolic Metabolites of Plant Origin in Animal Milk" International Journal of Molecular Sciences 25, no. 8: 4536. https://doi.org/10.3390/ijms25084536