Polarization of T Lymphocytes Is Regulated by Mesenchymal Stem Cells in NZBWF1 and BALB/c Mice

1
Department of Immunology and Rheumatology, Drum Tower Hospital, Nanjing University Medical School, Nanjing 210008, P R China
2
Department of Hematology, Subei People’s Hospital of Jiangsu Province, Yangzhou 225001, P R China
3
Immunology and Reproductive Biology Lab, Medical School and State Key Laboratory of Pharmaceutical Biotechnology, Nanjing University, Nanjing 210093, P R China
*
Author to whom correspondence should be addressed.
Int. J. Mol. Sci. 2007, 8(5), 455-469; https://doi.org/10.3390/i8050455
Submission received: 27 February 2007
/
Revised: 17 April 2007
/
Accepted: 9 May 2007
/
Published: 30 May 2007
(This article belongs to the Section Biochemistry)
Abstract
:Mesenchymal stem cells (MSCs) have been shown to suppress proliferation and activation of T lymphocytes in vivo and in vitro although the molecular mechanism of the immunosuppressive effect is not completely understood. To investigate the immunoregulatory effects of mice bone marrow mesenchymal stem cells on T lymphocyte, MSCs from NZBWF1 and BALB/c mice were isolated and expanded from bone marrow, and identified with cell morphology and the surface phenotypes. CD3+ T lymphocytes isolated by nylon wool columns were co-cultured with PMA with or without the two strains of MSCs. Then T cell apoptosis and intercellular cytokines of T cell were assessed by flow cytometry. Quantification of transcription factors T-box (T-bet) and GATA-binding protein 3 (GATA-3) expressed in T cells was detected by RT-PCR and western blot. Our results showed that there was a decrease of CD3+ T cell apoptosis when NW MSCs or Bc MSCs were added, and an increase of Th2 subset by NW MSCs and Th1 subset by Bc MSCs were observed by co-culturing MSCs with T lymphocytes. It is suggested that, by favoring Th1-cell development and inhibitory Th2-cell development, normal MSCs might interfere with the SLE development, and that marrow-derived NW MSCs had defective immunoregulatory function when compared with MSCs from healthy mouse strains.
1. Introduction
There is a complex immunologic dysregulation in the background of SLE. It is now well established that T cells play a key role in the regulation of immunologic processes. Much evidence supports the central role of T cells in the pathogenesis and development of SLE [1]. Depletion of T cells was shown to prevent the development of SLE in SLE-prone mice [2]. T helper subsets can be distinguished according to their cytokine secretion capacities and contradictory data about the dominance of Th1 or Th2 cytokines in SLE were presented [3,4]. On the other hand, some reports thought that autoimmune diseases might be stem cell disorders and found that defects of hematopoietic cells in the diseaes [5]. Preliminary reports on cotransplantation of MSCs and hematopoietic stem cells (HSCs) indicated a significant reduction in acute and chronic graft-versus-host disease (GVHD) [6,7] and an enhancement of HSCs engraftment [8,9]. In addition, in vitro culture-expanded autologous MSCs could be infused intravenously without toxicity [10]. It was reported that co-transplantation of MSCs along with HSCs was prior to simple HSCs transplantation in MRL/lpr mice [11].
Bone marrow-derived mesenchymal stem cells (MSCs) are nonhematopoietic stem cells, which compose the bone marrow microenvironment and regulate growth and differentiation of hematopoietic stem cells. They demonstrate extensive proliferative capacity and can differentiate into osteocytes, adventitia, chondrocytes, adipocytes, muscle cells or nerve cells in vitro and in vivo [12–14], and may be useful in the repair or regeneration of damaged or mutated tissues [15,16]. Recently, several studies have shown an immunosuppressive effect of MSCs in vivo and in vitro although the exact mechanism is still unclear. The cultured MSCs do not express FAS ligand and immune phenotype, such as B7-1, B7-2, or CD40L, and MHC II [17–19]. This phenotype is regarded as nonimmunogenic and suggests that MSCs might be effective in inducing tolerance. MSCs can suppress lymphocyte proliferation in mixed lymphocyte culture [20,21], and mitogen- and alloantigen- activated human CD3+, CD4+, and CD8+ T cells were all inhibited by human MSCs [22,23]. But few studies have focused on the polarization of T lymphocytes, which might have a critical role in the pathogenesis of SLE. Therefore, this study was undertaken to elucidate the immunomodulatory effects of MSCs from NZBWF1 and BALB/c mice on the polarization of T lymphocyte so as to understand the role of MSCs in the pathogenic mechanism of SLE. NZBWF1 mouse strain spontaneously develops an autoimmune disease resembling human SLE [24,25]. These mice manifest clinical and immunological abnormalities, including high levels of antinuclear antibodies, hemolytic anemia, proteinuria, and progressive immune complex glomerulonephritis. In our studies, BALB/c mice were used as control. The lupus-prone NZBWF1 animals are henceforth referred as NW, whereas the control BALB/c strain is indicated as Bc.
2. Results
2.1 MSCs cultures
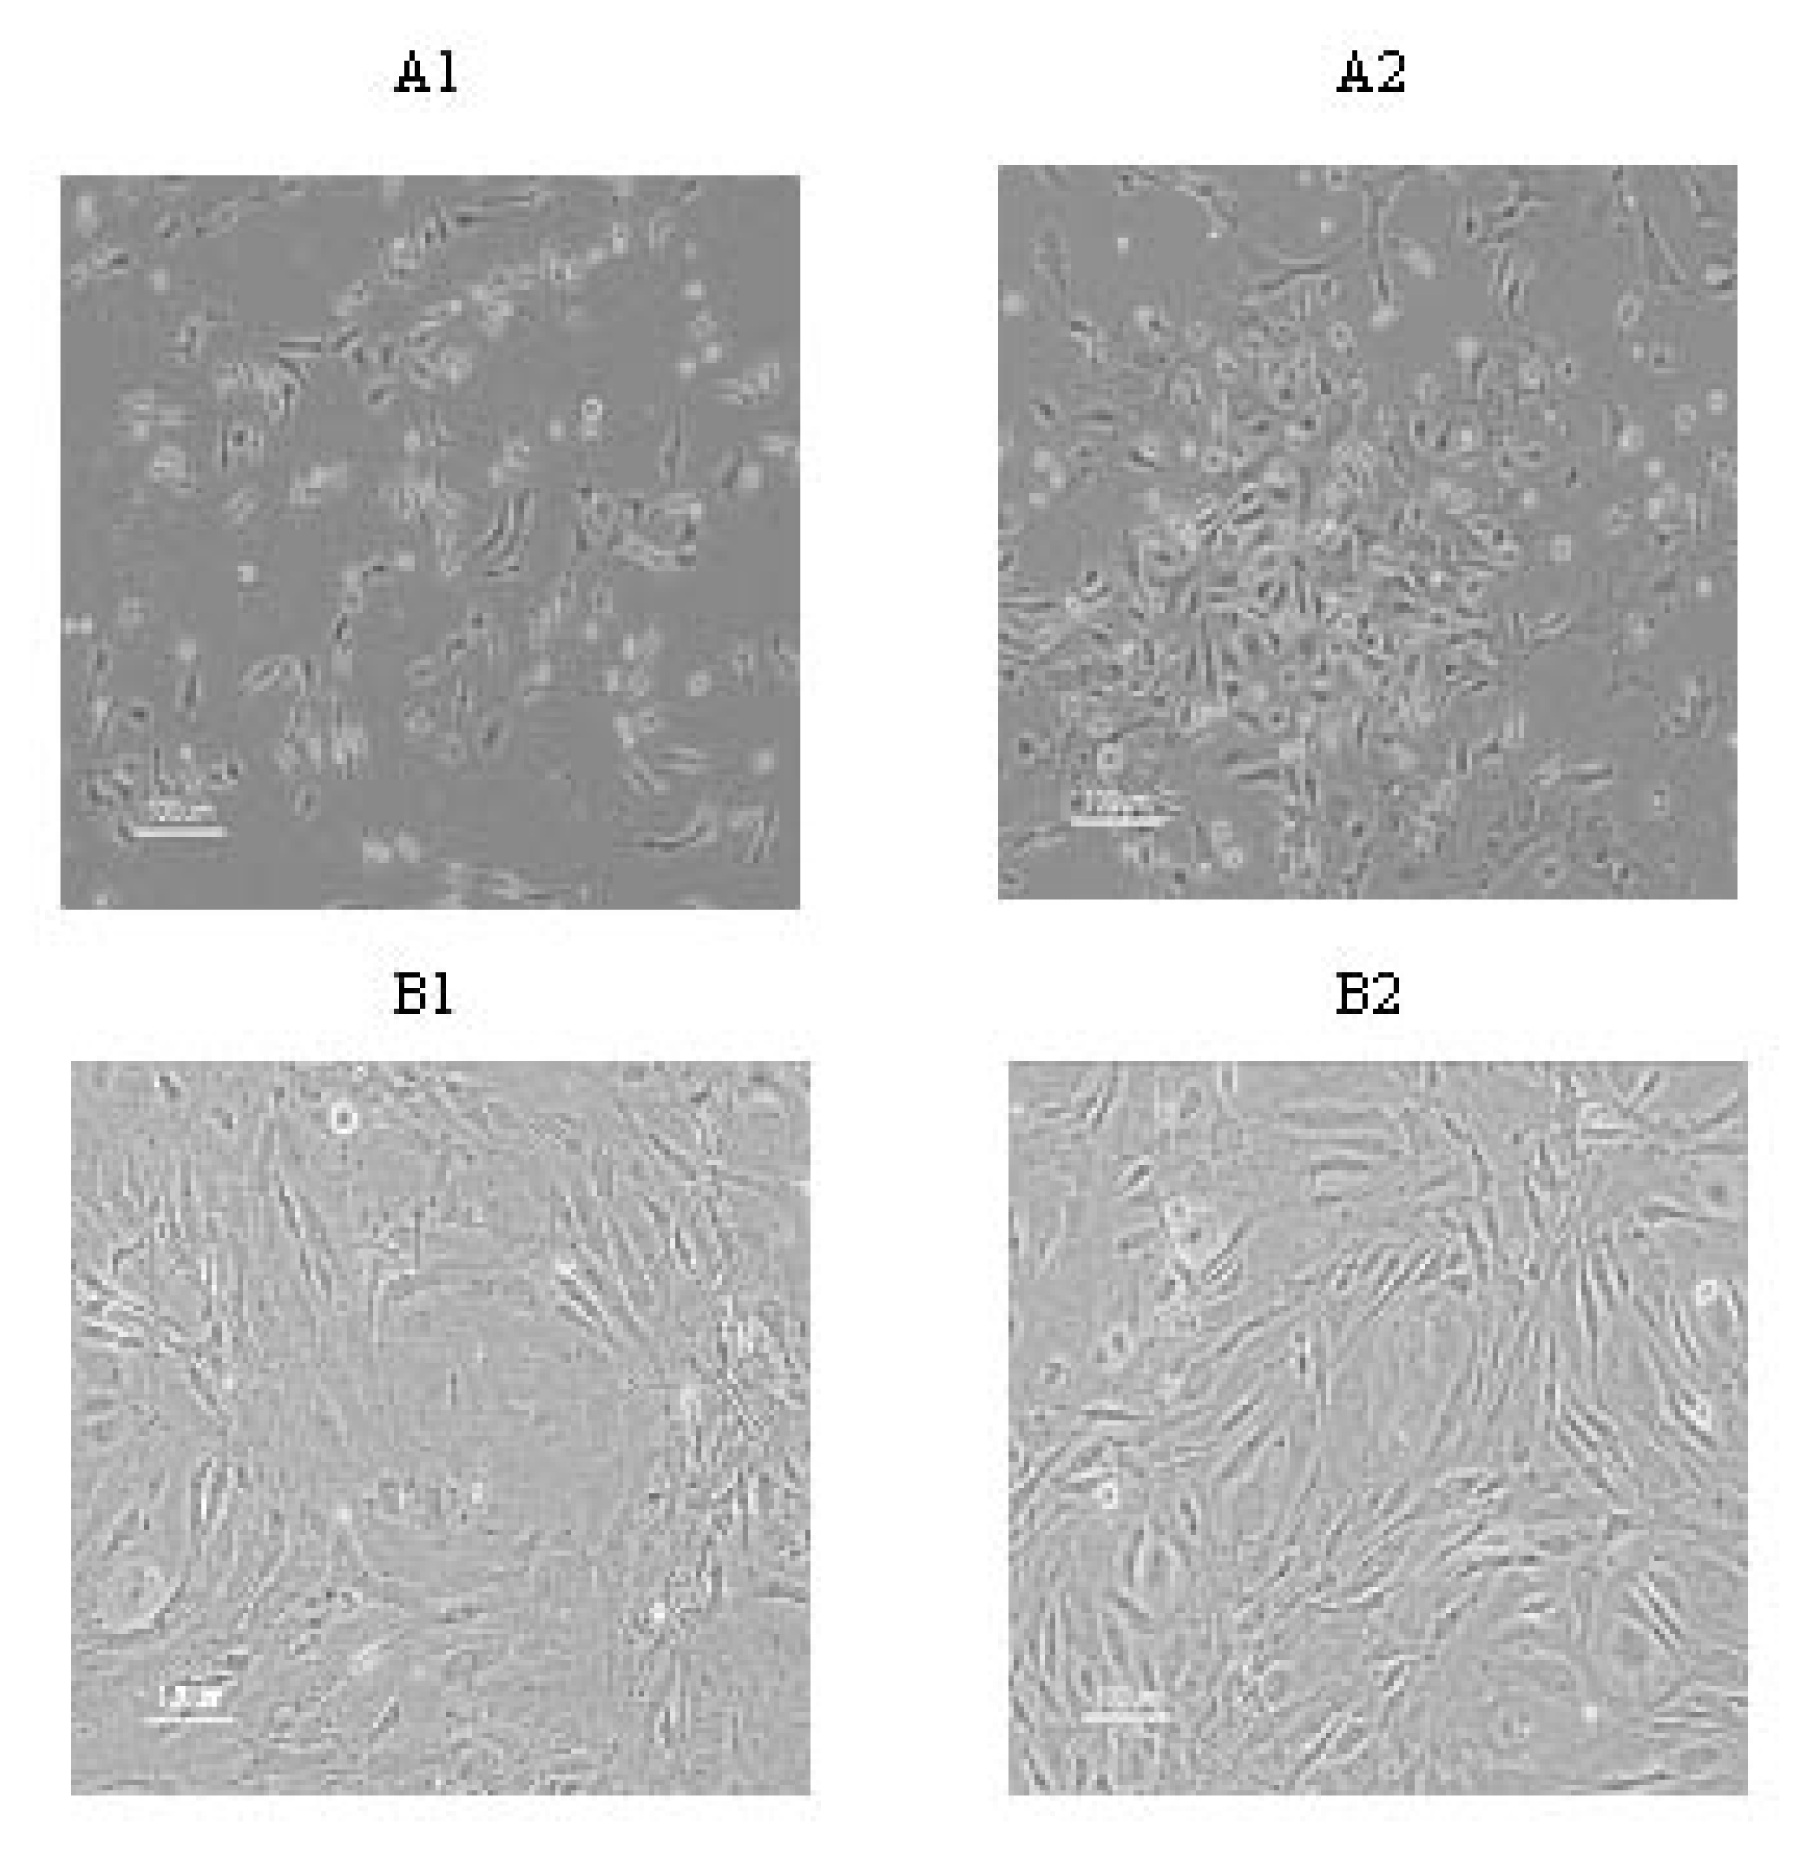
MSCs from mouse bone marrow were isolated based on the enhanced adherence to plastic in culture plates. Homogeneous population of fibroblast-like cells with 90 % confluence in NZBWF1 and BALB/c mice were seen at a median of 7 or 10 days after initial plating, respectively. After the first passage, the cells grew exponentially, requiring weekly passages. Morphologically, NW MSCs appeared very similar to normal counterparts. However, in primary and continued culture, NW MSCs seemed to be more viable in the same culture conditions. As shown in Figure A2 and B2, isolated colonies of NW MSCs are more typical. We have six NZBWF1 and six BALB/c mice conducted, with each marrow sample yielding similar results.
2.2 MSCs phenotype
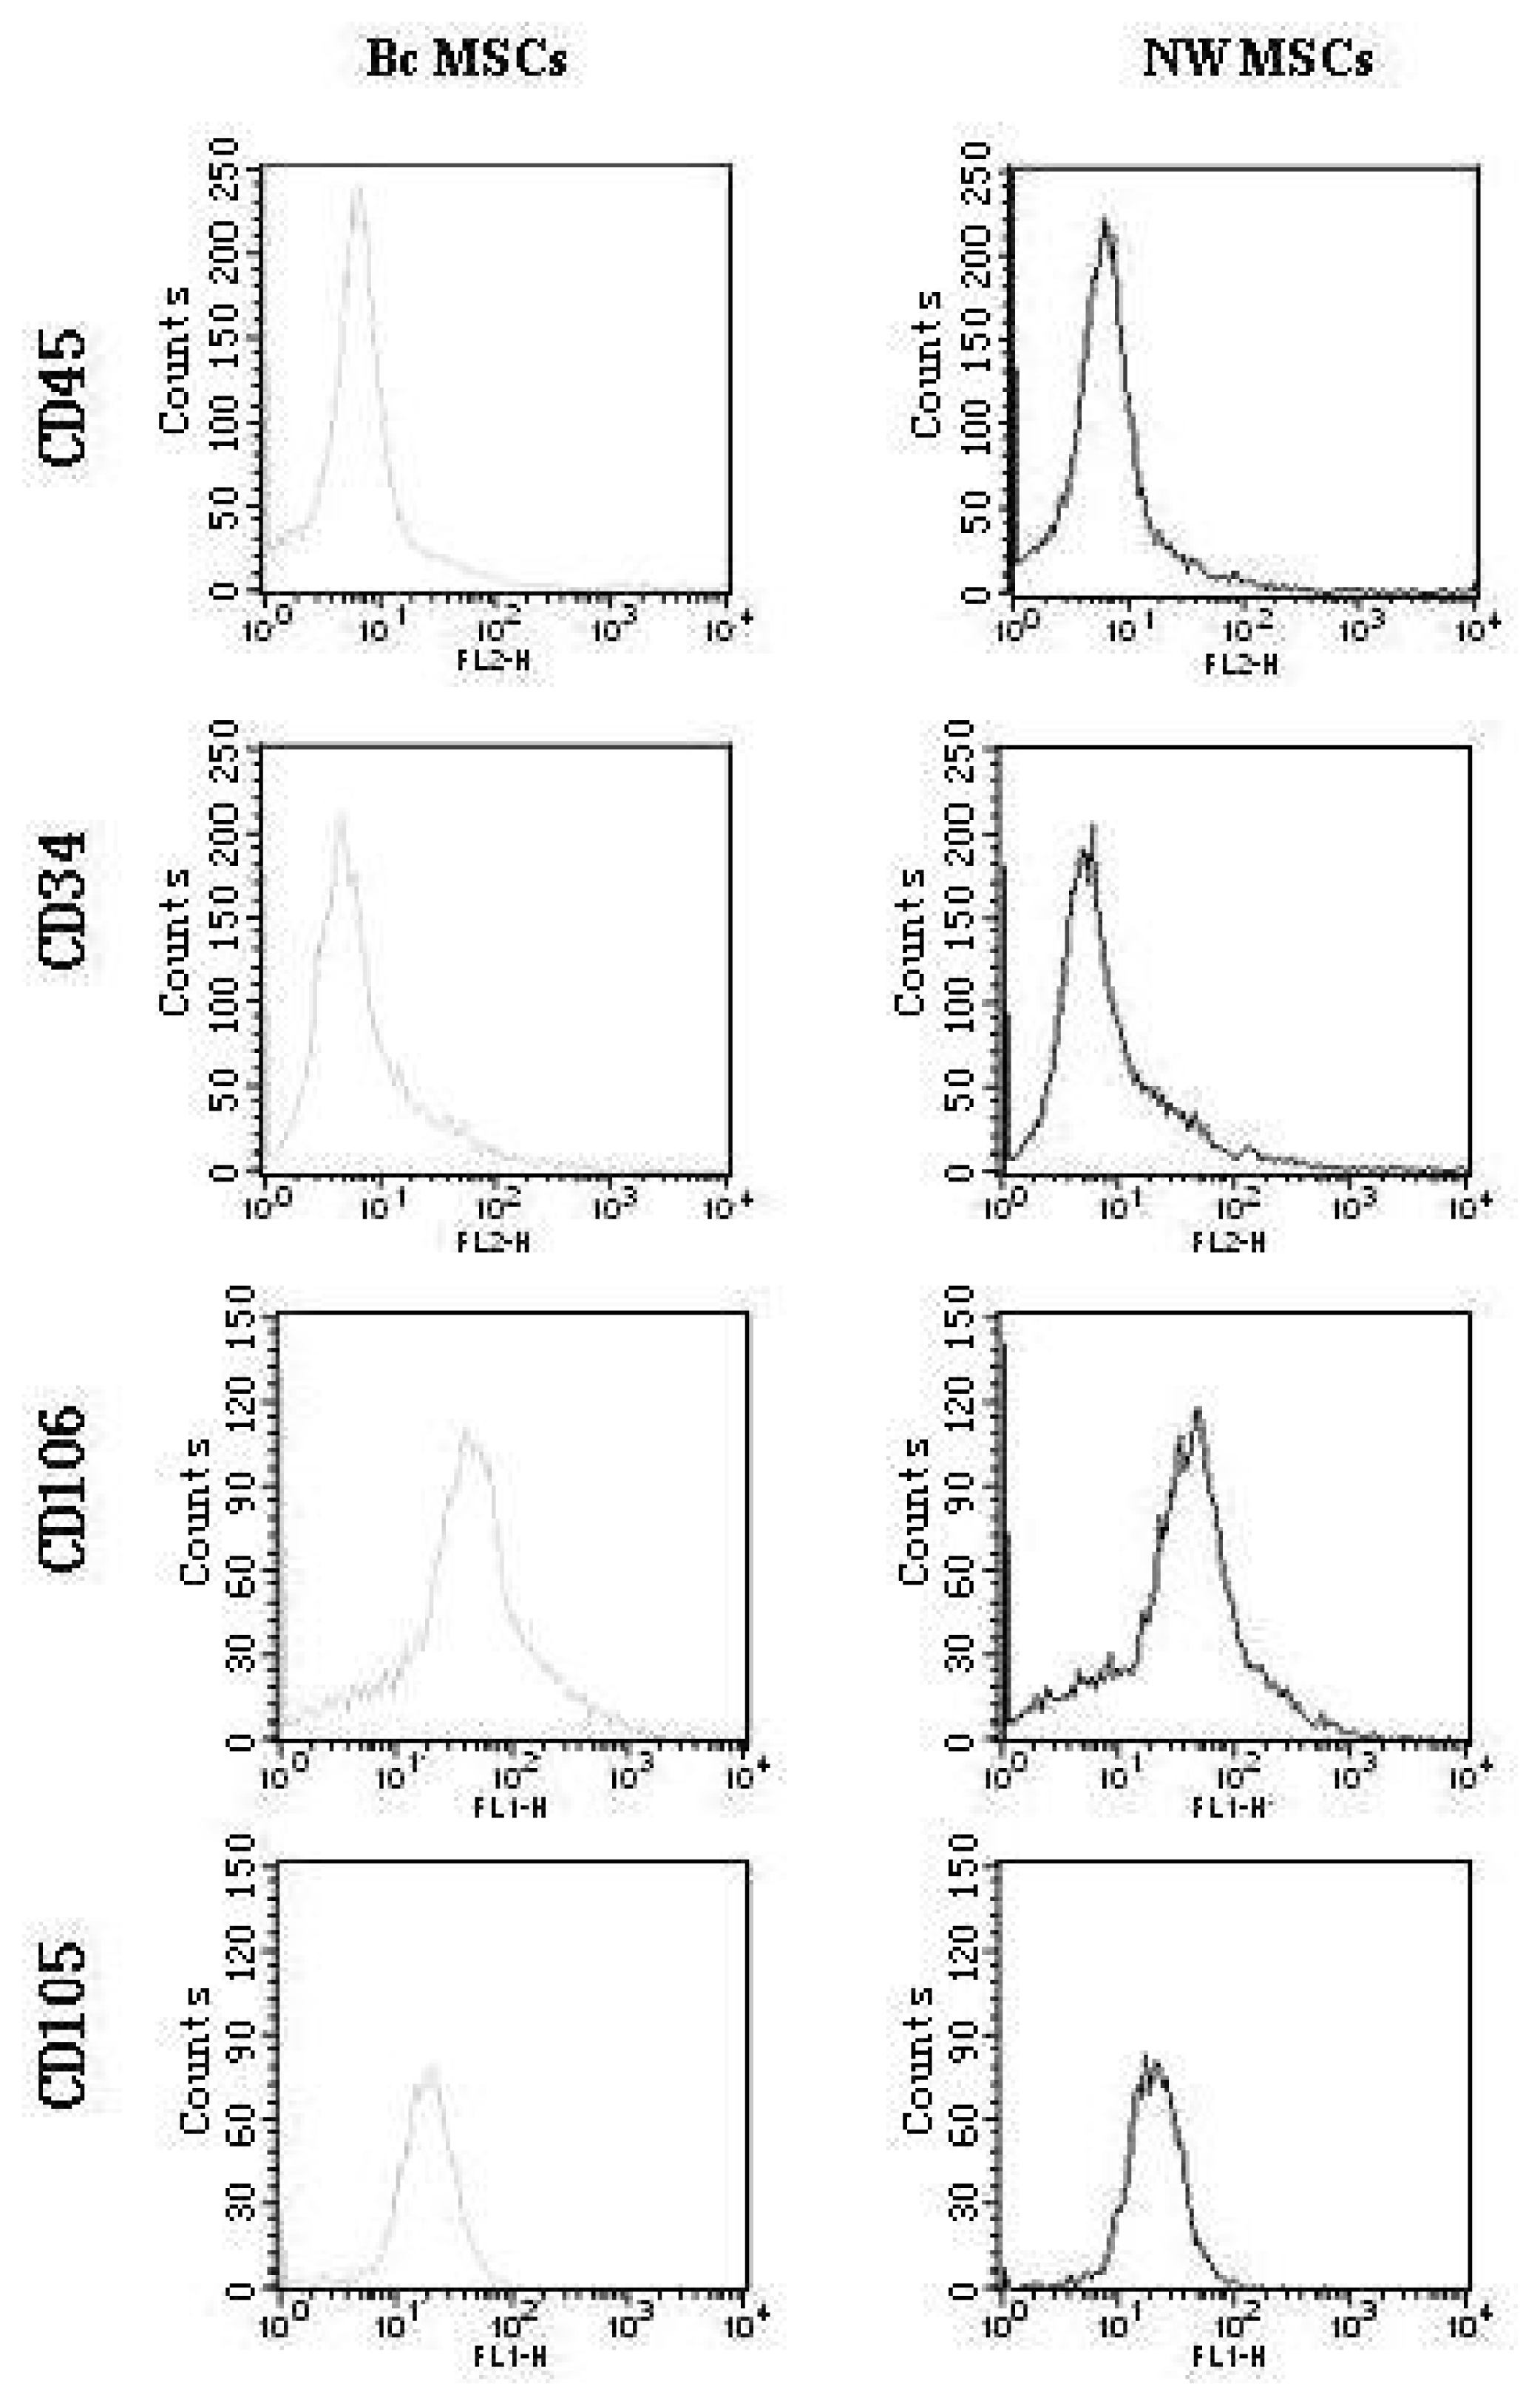
MSCs at passage 3 were characterized by flow cytometry as shown in Figure 2. No differences were observed between MSCs from NZBWF1 mice and BALB/c mice in terms of morphology and expression of certain cell markers. In both cases, MSCs expressed CD105 and CD106; in contrast, they lack the expression of CD34 and CD45, which are common on cells of the hematopoietic lineages. Such an antigen profile is in keeping with those described in other studies [17,29].
2.3 Different effects of MSCs on T-lymphocytes apoptosis
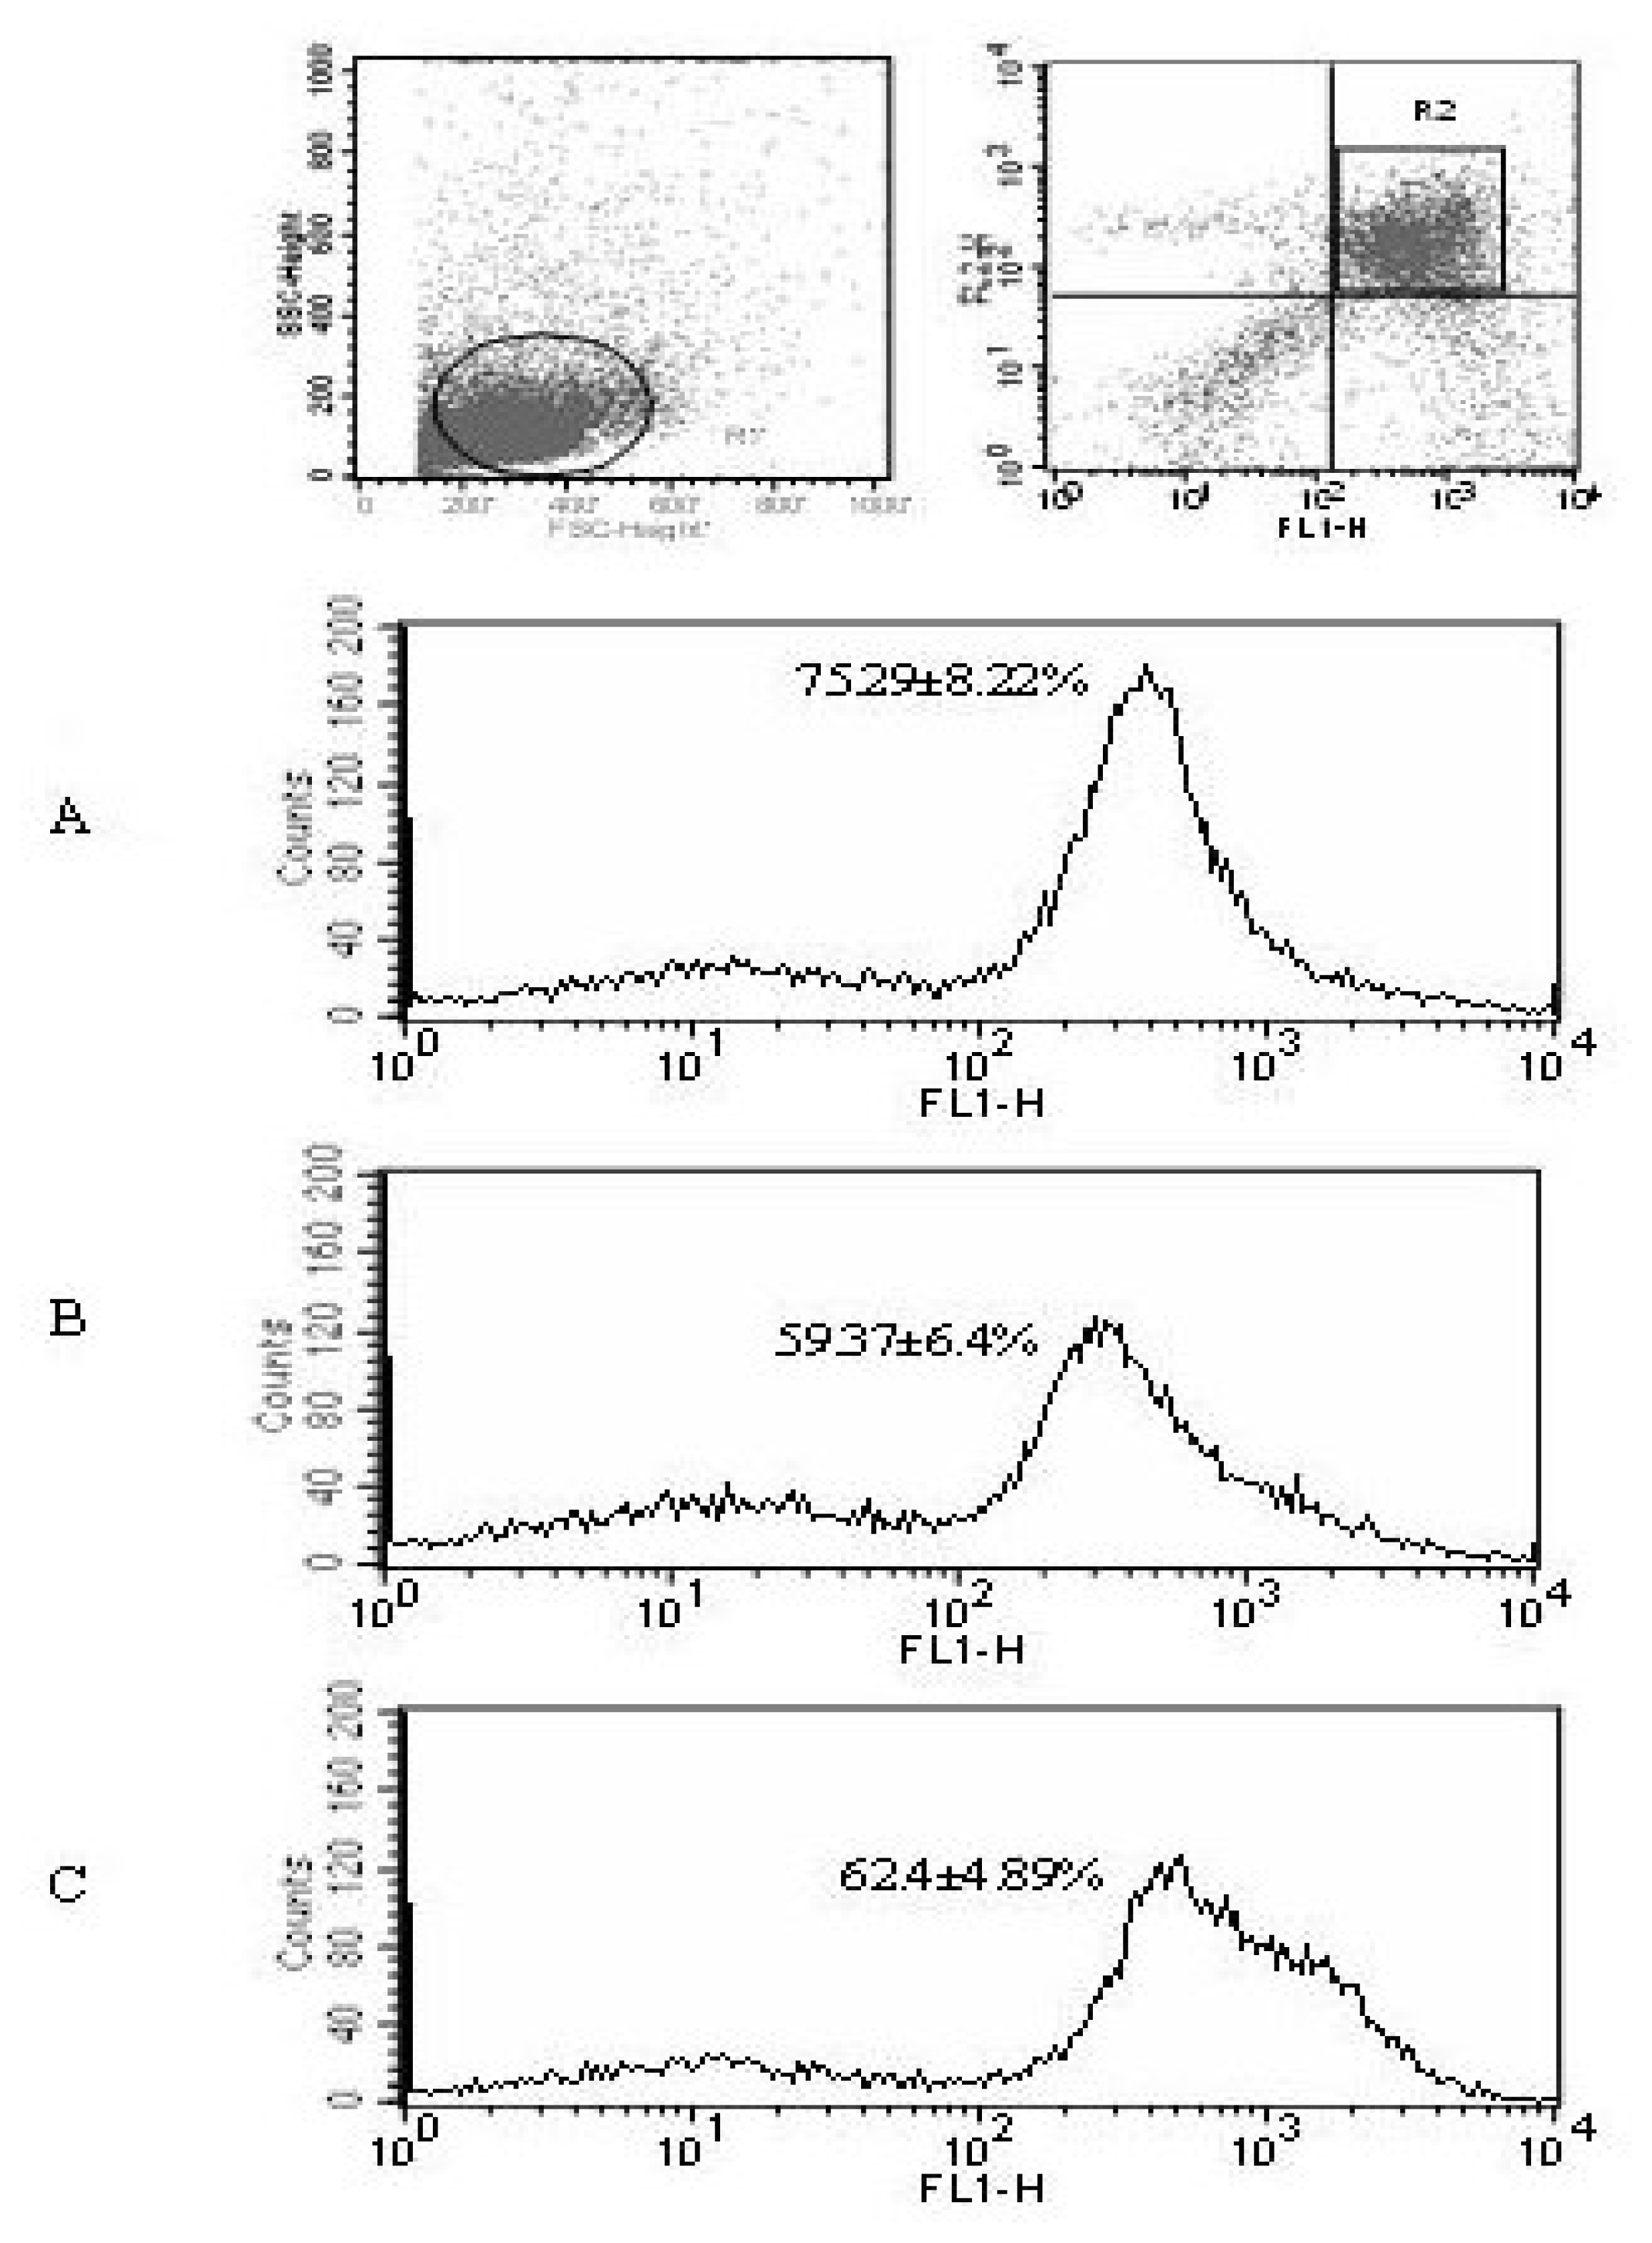
We then demonstrated that T-lymphocytes apoptosis could be affected by the different MSCs. T lymphocytes cultured in the presence or absence of NW MSCs and Bc MSCs were labeled with Annexin V and PI followed by flow cytometric analysis. Figure 3 showes the comparison of this effect of different MSCs on T-lymphocytes apoptosis. T cells co-cultured with two MSCs all resulted in significant decrease in Annexin V/PI staining compared with simple T cells culture, from 75.29 ± 8.22 % to approximately 62.40 ± 4.89 % or 59.37 ± 6.40 % (p < 0.05).
2.4 Expression of T-bet and GATA-3
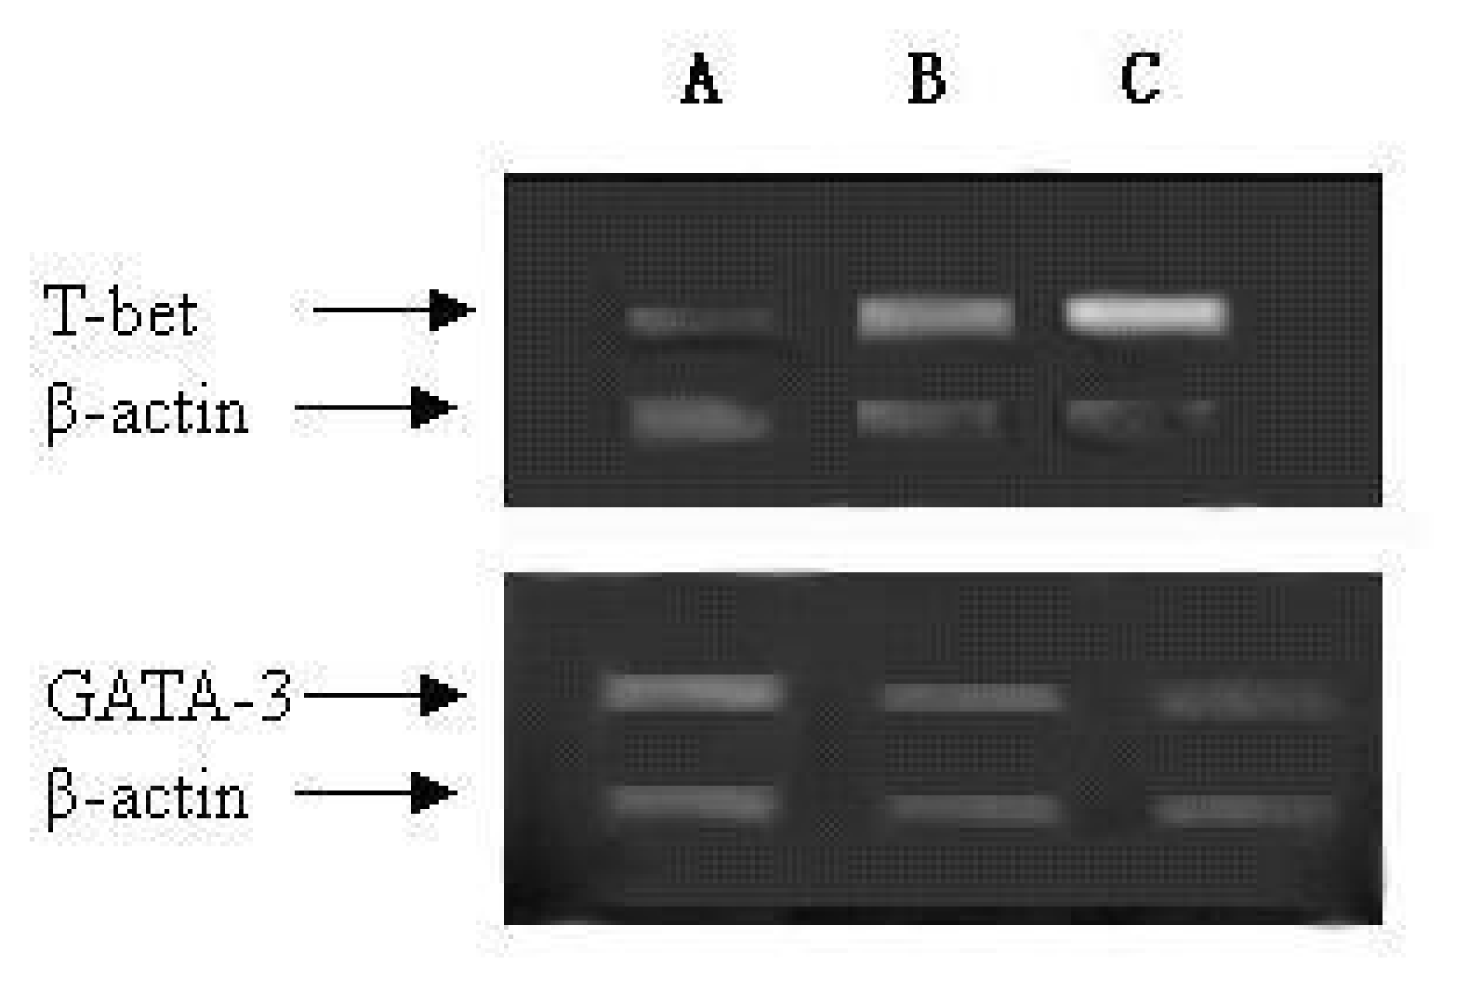
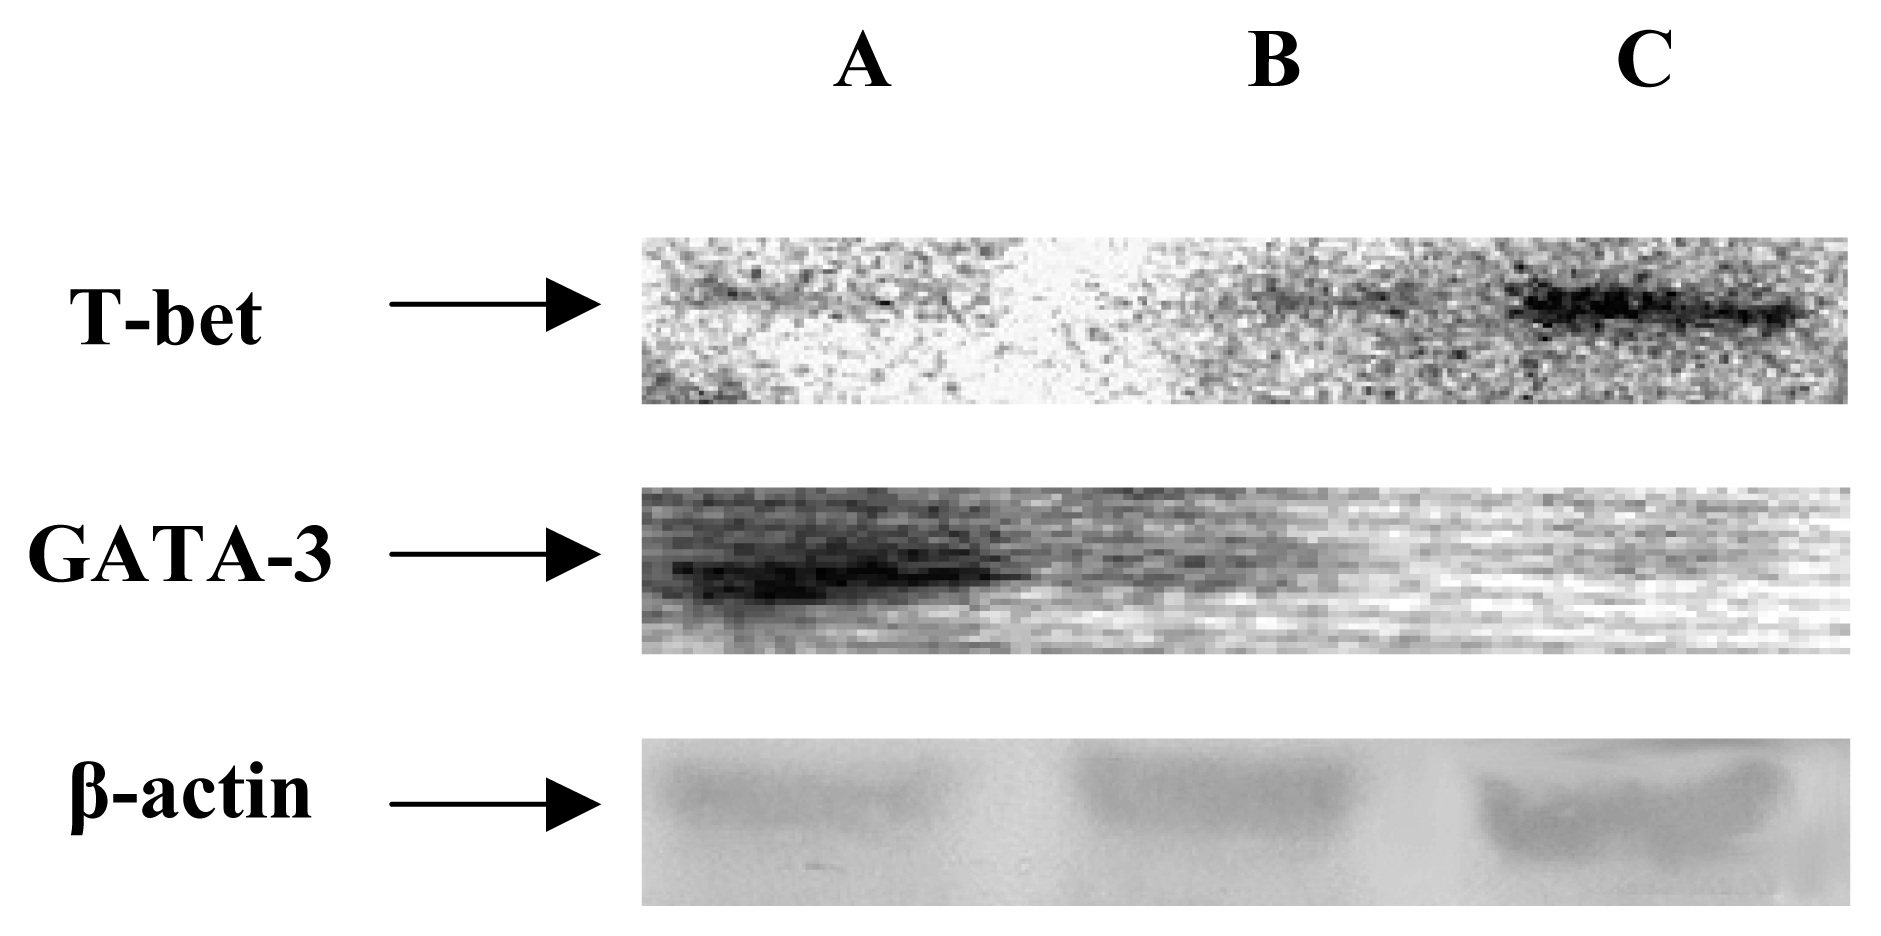
T-bet is a newly discovered Th1-specific transcription factor, whose expression is restricted to Th1 and not Th2 cells [30]. GATA-3, a member of the GATA family of zinc finger proteins, is thought to initiate Th2 development while inhibiting Th1 cell differentiation [31]. The balance between T-bet and GATA-3 expression is representative of the balance between Th1 and Th2 cytokines, and may provide a useful tool to help define the Th phenotype of immune cells [32]. We examined the expression of Tbet and GATA-3 mRNA by RT-PCR and protein by Western blot analysis in three groups. As shown in Figure 4 and Figure 5, the Bc MSCs group enhanced the level of T-bet, whereas down-regulation of T-bet relative to β-actin expression was observed in NW MSCs group. Compared to the control group, expression of GATA-3 was markly increased in NW MSCs group, but decreased in Bc MSCs group.
2.5 Quantification of Th1 and Th2 Type Cytokine of CD3 + T Cells
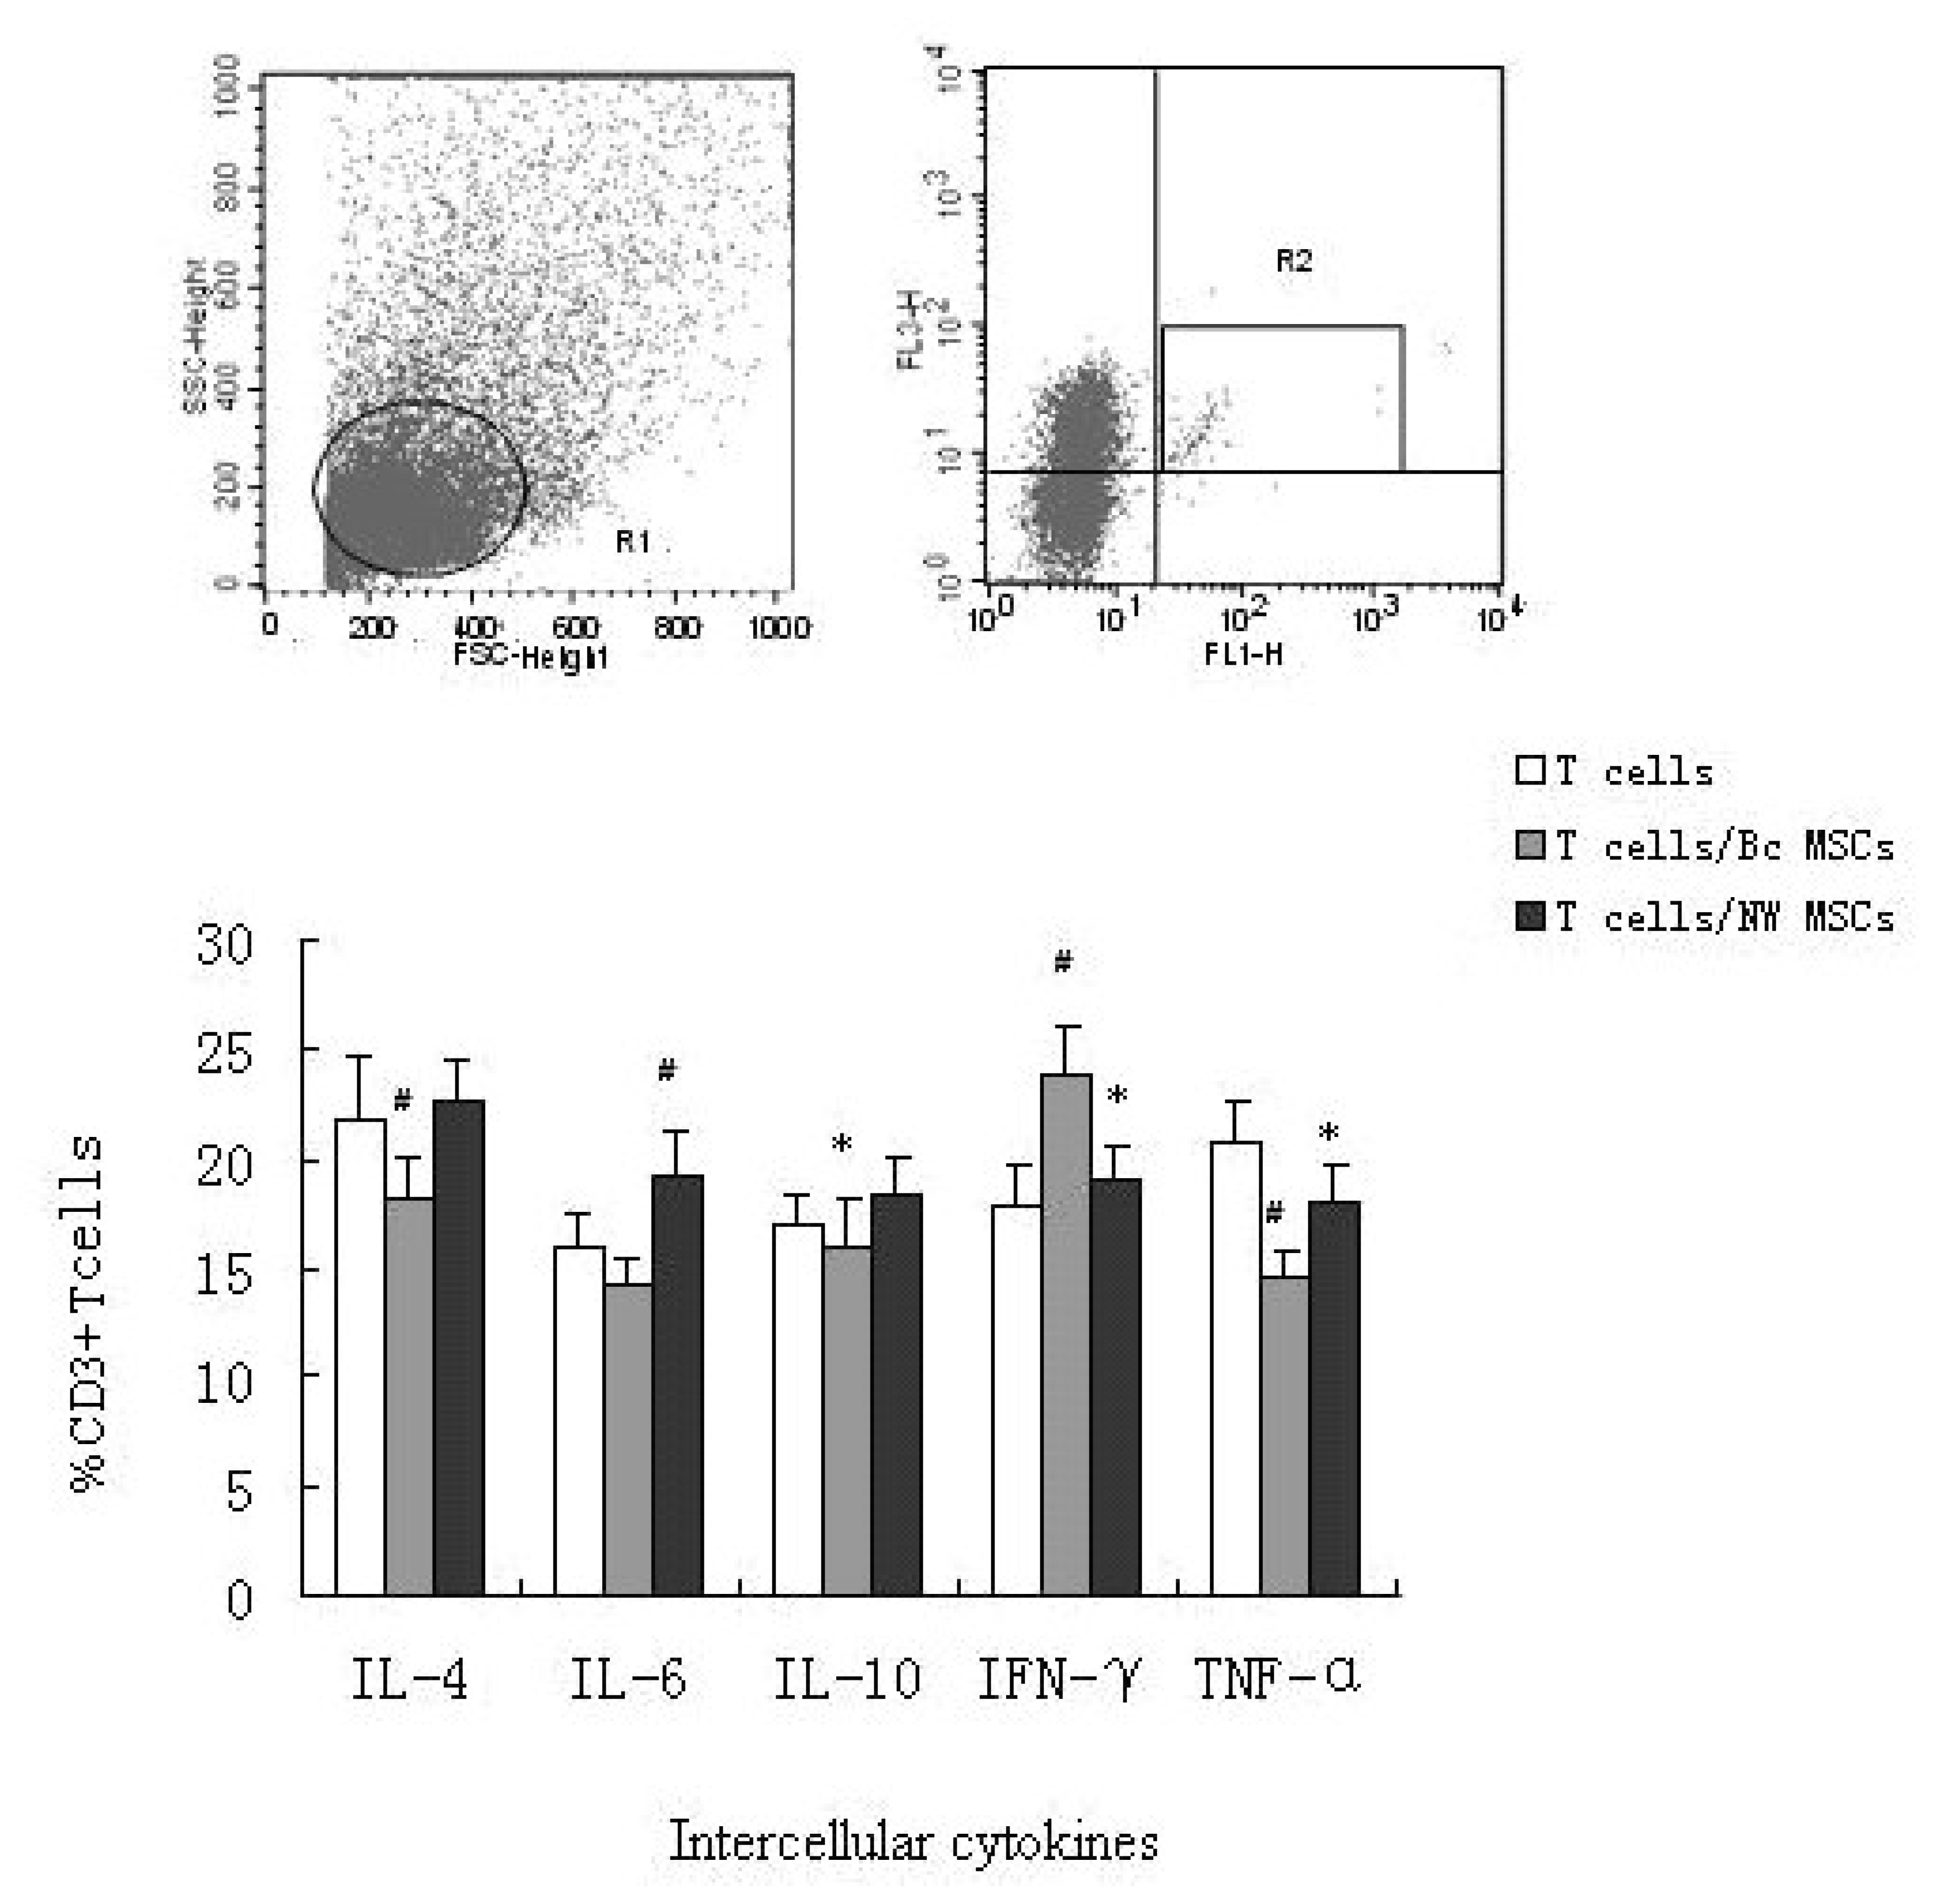
Assay of intercellular cytokines of T cells was measured by flow cytometry. T cells were stimulated with PMA for 24 h, and then stained with PE-Cy5 labeled anti-CD3, and PE or FITC labeled antibodies direct against IL-4, IL-10, IFN-γ, IL-6, and TNF-α. One representative experiment of five measurements was shown in Figure 6. The number of positive events in the dot plots and histograms for isotype controls were subtracted from sample data in each experiment. Among CD3+ T cells in Bc MSCs group, there were more positive for IFN-γ and less positive for IL-4, IL-10 and IL-6 than simple T cells group. The difference in IL-4 expressing cell number between the two groups was statistically significant (p < 0.01). While in NW MSCs group, production of IL-4, IL-10 and IL-6 all increased compared to the control. The difference of producing IFN-γ was unobvious when present and absent NW MSCs. Interestingly, the ratio of TNF-α+/CD3+ T cells after co-cultured with Bc MSCs (14.7 ± 1.5 %) and NW MSCs (18.1 ± 0.9 %) all decreased compared to the control (20.9 ± 1.2 %).
3. Discussion
MSCs have shown to be poorly immunogenic and suppress allogeneic or autologous T cell response [22,33,34], which suggested MSCs might be used in therapeutic applications. In this paper, we have examined interactions between mice MSCs and T lymphocytes in order to understand better the mechanisms of MSC-mediated immune modulation. Some researchers have investigated effects of allogeneic bone marrow-derived mesenchymal stem cells on T lymphocytes from BXSB mice [35]. The present study is the first report showing that MSCs from lupus mice interact with T cells from normal mice and are capable of altering the outcome of immune response.
Our results showed that apoptosis of T cells was all decreased when two different MSCs were added. Our experimental approach was based on the currently published protocol by Rasmusson [36]. In his experiment peripheral blood lymphocytes were co-cultured with MSCs. Previous reports demonstrated that MSCs-T cells co-culture did not lead to T cells apoptosis [37,38]. Plumas found that human MSCs induced apoptosis of activated T cells [39]. The different data may be due to the use of MSCs generated by different techniques, the use of different stimuli, culture conditions, doses, and kinetics, and different lymphocyte populations tested [40]. It may be, by reducing of T cells apoptosis, MSCs induce more Th1 or Th2 subset to affect immune system, and thereby either lead to pathology, or exert a positive impact on the disease.
The balance of Th1 and Th2 cells among different groups was then detected. We tested the expression of T-bet and GATA-3 and intercellular cytokines in T cells co-cultured with different MSCs. T-bet and GATA-3 are two major T helper-specific transcription factors that regulate the expression of Th1 or Th2 cytokine genes and play a crucial role in T-helper cell differentiation.
The T- bet/GATA-3 ratio may reflect the Th1/Th2 status. The RT-PCR and Western blot analysis both showed that T-bet was expressed at significantly low level and GATA-3 had a higher level in NW MSCs group, which was in contrary to the Bc MSCs group. The sequent cytokines assay supported this concept. Assay of intercellular cytokines of T cells was measured by flow cytometry. Our results showed levels of cytokines (IL-4, IL-10 and IL-6) were enhanced followed co-culturing T cells with NW MSCs, as compared with the simple-T culture group, which is indicative of a higher TH2 response, suggesting a deterioration of SLE state. Indeed, most of studies revealed that the increased production of type 2 cytokines in SLE patients as well as in murine lupus-prone strains [41–43]. While Bc MSCs, in their ability to inhibit IL-4, IL-10, IL-6 and increase IFN-γ secretion, may orchestrate a shift towards an increase in Th1 cells, which is in line with the report by Deng [35].
TNF-α is a potential proinflammatory and immunoregulatory cytokine that plays an important role in inflammatory and immune responses. It is unclear as to whether the role of TNF-α as a mediator of inflammation is a beneficial or deleterious one in the susceptibility to SLE. While many authors concluded that serum TNF-α levels are clearly elevated in SLE patients and its correlation with disease activity [44,45], others reported increased levels only in a minority of patients with active SLE [46]. In our research, the secreting TNF-α of T cells after co-cultured with Bc MSCs and NW MSCs are decreased, although the difference is not statistically significant between the two co-cultured groups (data no shown). It can be explained by: 1. The cellular sources of TNF-α are diverse, including T lymphocytes, pre-B cells, mast cells, keratinocytes, astrocytes and microglial cells, smooth muscle cells, intestinal cells and mesengial cells. Our research only focused whether MSCs modulated the TNF-α production of T lymphocytes in vitro, not taking other cytokine sources into account. 2. Our finding might be partially explained by species differences.
The results imply that lupus MSCs might be defective, but whether these defects are pathogenic to the disease remains to be explored. Normal MSCs made T-subset a shift to Th1, which might lead to an improvement of the illness and may offer one explanation for the clinical outcome observed by other authors [11]. So we hypothesize that MSCs would influence the maturation and differation of T cells and hence the Th polarization of an immune response in vivo. Interestingly, we also find there are differences in passage-time and proliferation between Bc MSCs and NW MSCs. The latter has higher proliferation and shorter passage-time. This implies NW MSCs may be defective in their function, which is supported by El-Badri who reported that MSCs from lupus murine model had defective structure and function when compared with MSCs from healthy mouse strains [47].
In summarization, through the interactions of MSCs with T cells, it appears that MSCs influence the development of Th1 or Th2 cytokines and alter the on-going immune response. Yet the complete mechanism of immune modulation by MSCs will require further investigations. Clinically, MSCs are being proposed for a number of indications; the administration of normal MSCs in vivo to autoimmune diseases such as SLE may be one potential therapeutic method. These results encourage clinical use of MSCs in treatment in of SLE. Further studies should confirm the clinical benefit of the injection of MSCs to the lupus mice.
4. Experimental Section
4.1. Animals and reagents
NZBWF1 and BALB/c male mice (8–10 weeks old) were purchased from Model Animal Research Center of Nanjing University. They were group-housed in individually ventilated cages under targed controlled environmental conditions of 24 °C and 50 % relative humidity with 12 h light/dark photoperiod (light-at 06:00 and off at 18:00). Standard mouse chow and water were available throughout the experiment. Mice were allowed to acclimatize for 10 days prior to treatment. All culture media, supplements and reagents were purchased from Sigma (St. Louis, MO, USA) unless otherwise noted. The culture media of mice MSCs was constituted of 85 % DMEM-LG, 15 % fetal calf serum, 2 mM glutamine and penicillin/strepromycin (100 U/ml and 100 mg/ml, respectively). All antibodies for flow cytometry were from eBioscience (San diego, USA).
4.2. MSCs isolation and culture
MSCs were isolated and cultured by the procedure described previously [26, 27] with modifications. The mice were euthanized and both femurs and tibiae were removed. The marrow was flushed with DMEM-LG using a 10-cc syringe with a 0.45-mm needle. Cell clusters within the marrow suspension were dissociated by vigorous pipetting and filtrated through a 100-um cell strainer. Red blood cells in suspension were lysed with ACK lysing buffer (0.15 M NH4Cl, 1.0 mM KHCO3, 0.1 mM EDTA, pH7.2). The bone marrow cells were plated at densities of 106 cells/cm2 in medium (DMEM-LG, 15 %FCS) and incubated in a humidified 5 % CO2 atmosphere at 37 °C. Non-adherent cells were gently removed and media was replaced at first 48 hours after initial plating and then every fourth days thereafter. After 7 to 9 days isolated colonies of mesenchymal stem cells were apparent. These cells were then trypsinized with 0.05 % trypsin-0.5 mM EDTA solution, and replated at 104 cells/cm2 (passage 1). Cells were split approximately 1:3 at each passage thereafter. These cells were classified by morphology and immune phenotype. Differentiation potential was examined by culturing the cells under favorable conditions for adipogenic and osteogenic differentiation (data not shown), as previously described [28].
4.3. FACS analysis for surface molecules of MSCs
The expression of surface molecules on MSCs at passage 3 was analyzed by FACS (Becton Dicknson, San Jose, CA, USA). Staining was performed according to a standard rapid immunofluorescence technique. Briefly, after washing in PBS containing 0.1 % sodium azide and 1 % FCS (FACS wash buffer), the cells were incubated for 20 min on ice with isotype-specific, FITC-or PE-conjugated anti-mouse antibodies, and washed again. Isotype-control antibodies were used to determine background staining and autofluorescence. A total of 10,000 live cells were counted per sample.
4.4. Preparation of allogeneic T cells
The allogeneic T cells of BALB/c mice were obtained from spleen of suspensions by passing through the nylon wool columns followed lysing of the red blood cells. They were identified as positive for CD3 and the purity was 87 ± 9 %.
4.5. Co-culture of MSCs with T cells
The MSCs at passage 3 were treated with 5 μg/ml mitomycin C at 37 °C for 45min, followed by five extensive washes with FCS-containing medium. Then T cells were implanted and incubated for another 24 h with PMA (Phorbol- 12-Myristate-13-Acetate, 40 ng/ml). The co-culture was mediated by 10,000 MSCs and 100,000 T cells.
4.6. Apoptosis assays
Apoptosis was was also assessed by flow cytometry in which Annexin V and propidium iodide (PI) staining were applied. T cells were washed in phosphate buffered saline and then with binding buffer (50 nM HEPES pH7.4, 750 mM CaCl2, 5 mM MgCl2 and 20 % BSA). Recombinant Annexin V conjugated with fluorescein isothiocyanate (200 μg/ml) was then added for 30 min. After washing with binding buffer, 10 μl PI was added and then the cells were detected by flow cytometry.
4.7. RT-PCR analysis
Total RNA was prepared from T cells using Trizol regent. RT-PCR was performed on the cDNA with the following sense and antisense primers: 1.β-actin: 5′=AGGCATCCTGACCCTGAAGTAC, 3′=GACTGTCTGATGGAGTACTTCT, and the PCR product size=389bp (accession XM903322); 2.T-bet: 5′=CAGGATGTTTGTGGATGTGG, 3′=TTCGGTGAAGTGG TTGTTGTT CCC, and the PCR product size=198bp (accession NM019507); 3.GATA-3: 5′=GTCATCCCTGAGCCACATCT, 3′=TCAAGGAGGC TGGGGAAGA T, and the PCR product size=203 bp (accession NM008091). For semi-quantitative-PCR analyses, the number of required cycles and amounts of total RNA to be used was determined. After denaturing at 95 °C for 10 min, PCR amplification for β-actin, T-bet and GATA-3 detection was performed under the following conditions: 94 °C for 45 s, 58 °C for 30 s, and 72 °C for 45 s, for a total of 30–35 cycles. The reaction was terminated after a 5-min elongation. Reaction products were electrophoresis using a 1.5 % agarose gel containing 1 μl/ml EtBr, then bands of the gel were analyze using GS-800 Calibreted Densitometer (Bio-Red, Hercules, CA, USA).
4.8. Western blot analysis
For Western blotting, equivalent amount of protein lysates, obtained from T cells were separated by 15 % SDS-PAGE and then electrophoretically transferred onto a nitrocellulose membrane. The membrane was then incubated in blocking solution (5 % dry milk in PBS) for 1 h at room temperature. Subsequently blots were incubated with antibodies against T-bet and GATA-3, overnight at 4 ºC. Expression of the β-actin was used as control. The day after, the membrane was incubated with peroxidase-conjugated anti-mouse IgG for 60 min at room temperature. The density of T-bet and GATA-3 stained bands relative to β-actin expression was quantified with Quantity ONE densitometry software.
4.9. Quantification of intracellular cytokines
T cells co-cultured with MSCs were activated with PMA (40ng/ml) and Ionomycin (1ug/ml) for 6h and Monensin (1.7 μg/ml) was added at the final 2 h to inhibit cytokine secretion. The harvested T cells were first incubated with FITC labeled anti-CD3 mAb and then the cells were fixed in w 2 % formaldehyde in PBS for 15 min. The permeabilization of the cell membrane was achieved by 0.1 % Saponin. The cells were thereafter exposed to the FITC-conjugated cytokine specific antibodies for 30 min at 4 °C and then washed, followed by analysis using flow cytometry. At least 20,000 cells per sample were analyzed. The results were expressed as the histogram of fluorescence intensity.
4.10. Statistical Analysis
All values were expressed at mean ± SEM. The t-test was used for statistical comparison in different groups. A level of p < 0.05 was considered statistically significant.
Figure 1.
Morphological charaterization of mice MSCs. MSCs were isolated from mice bone marrow, and plated in LG-DMEM supplemented with 15 % FBS. Photomicrographs (original magnification 100 ×, phase contrast microscopy) were shown for unfixed MSCs at passage 0. A1: Bc MSCs at Passage 0, A2: NW MSCs at passage 0; B1: Bc MSCs at Passage 3, B2: NW MSCs at passage 3.

Figure 2.
Flow cytometric analysis of mice MSCs surface phnotype. Antibodies used were PE-labeled anti-CD34 and CD45, FITC-labled CD106, Biotin-conjucted anti-CD105. FITC-conjugated streptavidin was added for CD105-treated cells followed by washing. Gray lines: Bc MSCs; Black lines: NW MSCs. All MSCs used here were at passage 3. MSCs from six separate mice were tested with similar results. Representative results from one mouse were shown.

Figure 3.
Differences in apoptosis levels of T cells after co-cultured with different MSCs. Gate R1 showed viable, single occupied CD3+ T cells. The apoptotic cells, which simultaneously uptake Annexin V-FITC (FL1) and PI (FL2) were gated as R2. The histogram showed the percentage of the apoptotic cells in different T cells groups: (A) T cells cultured after 24h in the absence of MSCs, (B) T cells co-cultured with NW MSCs for 24 h, (C) T cells co-cultured with Bc MSCs for 24 h. Experiments were performed three times with similar results.

Figure 4.
RT-PCR analysis of T-bet and GATA-3 mRNA in T cells treated with different strain MSCs. Figure 4 showed RT-PCR amplification of T-bet and GATA-3 mRNA from T cells with or without the treatment of MSCs: (A) T cells co-cultured with NW MSCs for 24 h, (B) T cells cultured after 24 h in the absence of MSCs, (C) T cells co-cultured with Bc MSCs for 24 h. As an internal control, the expression of the β-actin mRNA was examined in same materials.

Figure 5.
Western blot of T-bet and GATA-3 in three groups. (A) T cells co-cultured with NW MSCs for 24 h, (B) T cells cultured after 24 h in the absence of MSCs, (C) T cells co-cultured with Bc MSCs for 24 h. After separation in 10 % acrilamyde gel proteins were transferred to the nitrocellulose membrane and tested with anti- T-bet and -GATA-3 antibodies. Membranes were stripped and retested with anti-actin antibodies to quantify protein deposition.

Figure 6.
Changes in intracellular cytokines of T cells with the treatment of different MSCs. Cells were stained with fluorescent antibodies, as described in Section 2. Gate R1 showed viable, single occupied cells. The cytokine-releasing cells expressing CD3 were gated as R2. The histogram showed the percentage of double-positive cells in all CD3+ T cells. Data of a representative experiment out of five were shown. *, p < 0.05 vs control; #, p < 0.01 vs control.

Acknowledgements
The authors thank Professor Weizhi Hu for his assistance and review of the manuscript and both Dr. Xiaoxi Li and Dr. Sha Hao for the skilled technical assistance. This work was supported by both ‘135’ Talent Grant of Jiangsu Province (No.RC2002003) and University Doctor Funding (No.20050315001), Ministry of Education of China.
References and Notes
- Wofsy, D.; Seaman, W.E. Successful treatment of autoimmunity in NZB/NZW F1 mice with monoclonal antibody to L3T4. J. Exp. Med 1985, 161, 378–391. [Google Scholar]
- Wofsy, D. Administration of monoclonal anti-T cell antibodies retards murine lupus in BXSB mice. J. Immunol 1986, 136, 4554–4560. [Google Scholar]
- Funauchi, M.; Ikoma, S.; Enomoto, H.; Horiuchi, A. Decreased Th1-like and increased Th-2 like cells in systemic lupus erythematosus. Scand. J. Rheumatol 1998, 27, 219–224. [Google Scholar]
- Takahashi, S.; Fossati, L.; Iwamoto, M.; Merino, R.; Motta, R.; Kobayakawa, T. Imbalance towards Th1 predominance is associated with acceleration of lupus-like autoimmune syndrome in MRL mice. J. Clin. Invest 1996, 97, 1597–1604. [Google Scholar]
- Ikehara, S. Autoimmune diseases as stem cell disorders: normal stem cell transplant for their treatment. Int. J. Mol. Med 1998, 1, 5–16. [Google Scholar]
- Frassoni, F.; Labopin, M.; Bacigalupo, A.; Gluckman, E.; Rocha, V.; Bruno, B. Expanded mesenchymal stem cells (MSC), coinfused with HLA identical hematopoietic stem cell transplants, reduce acute and chronic graft-vs-host disease: a matched pair analysis. Bone Marrow Transpl 2002, 29, S2. [Google Scholar]
- Lazarus, H.; Curtin, P.; Devine, S.; McCarthy, P.; Holland, K.; Moseley, A. Role of mesenchymal stem cells (MSC) in allogeneic transplantation: Early phase I clinical results. Blood 2000, 96, 392A. [Google Scholar]
- Koc, O.N.; Gerson, S.L.; Phillips, G.L.; Cooper, B.W.; Kutteh, L. Autologous CD34+ cell transplantation for patients with advanced lymphoma: Effects of overnight storage on peripheral blood progenitor cell enrichment and engraftment. Bone Marrow Transpl 1998, 21, 337–343. [Google Scholar]
- Brandt, J.E.; Galy, A.H.; Luens, K.M.; Travis, M.; Young, J.; Tong, J. Bone marrow repopulation by human marrow stem cells after long-term expansion culture on a porcine endothelial cell line. Exp. Hematol 1998, 26, 950–961. [Google Scholar]
- Lazarus, H.M.; Haynesworth, S.E.; Gerson, S.L.; Rosenthal, N.S.; Caplan, A.I. Ex vivo expansion and subsequent infusion of human bone marrow-derived stromal progenitor cells (mesenchymal progenitor cells): Implications for therapeutic use. Bone Marrow Transpl 1995, 16, 557–564. [Google Scholar]
- Ikehara, S. New strategies for allogeneic BMT. Bone Marrow Transpl 2003, 32, S73–75. [Google Scholar]
- Pittenger, M.F.; Mackay, A.M.; Beck, S.C.; Jaiswal, R.K.; Douglas, R.; Mosca, J.D. Multilineage potential of adult human mesenchymal stem cells. Science 1999, 284, 143–147. [Google Scholar]
- Deans, R.J.; Moseley, A.B. Mesenchymal stem cells: biology and potential clinical uses. Exp. Hematol 2000, 28, 875–884. [Google Scholar]
- Kopen, G.C.; Prockop, D.J.; Phinney, D.G. Marrow stromal cells migrate throughout forebrain and cerebellum, and they differentiate into astrocytes after injection into neonatal mouse brains. Proc. Natl. Acad. Sci. USA 1999, 96, 10711–10716. [Google Scholar]
- Pereira, R.F.; O’Hara, M.D.; Laptev, A.V.; Halford, K.W.; Pollard, M.D.; Class, R. Marrow stromal cells as a source of progenitor cells for nonhematopoietic tissues in transgenic mice with a phenotype of osteogenesis imperfecta. Proc. Natl. Acad. Sci. USA 1998, 95, 1142–1147. [Google Scholar]
- Toma, C.; Pittenger, M.F.; Cahill, K.S.; Byrne, B.J.; Kessler, P.D. Human mesenchymal stem cells differentiate to a cardiomyocyte phenotype in the adult murine heart. Circulation 2002, 105, 93–98. [Google Scholar]
- Le Blanc, K.; Tammikm, C.; Rosendahl, K.; Zetterberg, E.; Ringden, O. HLA expression and immunologic properties of differentiated and undifferentiated mesenchymal stem cells. Exp. Hematol 2003, 31, 890–896. [Google Scholar]
- McIntosh, K.; Bartholomew, A. Stromal cell modulation of the immune system. Graft 2000, 3, 324–328. [Google Scholar]
- Majumdar, M.K.; Keane-Moore, M.; Buyaner, D.; Hardy, W.B.; Moorman, M.A.; Mcintosh, K.R. Characterization and functionality of cell surface molecules on human mesencymal stem cells. J. Biomed. Sci 2003, 10, 228–241. [Google Scholar]
- Bartholomew, A.; Sturgeon, C.; Siatskas, M.; Ferrer, K.; McIntosh, K.; Patil, S. Mesenchymal stem cells suppress lymphocyte proliferation in vitro and prolong skin graft survival in vivo. Exp. Hematol 2002, 30, 42–48. [Google Scholar]
- Potian, J.A.; Aviv, H.; Ponzio, N.M.; Harrison, J.S.; Rameshwar, P. Veto-like activity of mesenchymal stem cells: functional discrimination between cellular responses to alloantigens and recallantigens. J. Immunol 2003, 171, 3426–3434. [Google Scholar]
- Di Nicola, M.; Carlo-Stella, C.; Magni, M.; Milanesi, M.; Longoni, P.D.; Matteucci, P. Human bone marrow stromal cells suppress T-lymphocyte proliferation induced by cellular or nonspecific mitogenic stimuli. Blood 2002, 99, 3838–3843. [Google Scholar]
- Le Blanc, K.; Rasmusson, I.; Gotherstrom, C.; Seidel, C.; Sundberg, B.; Sundin, M. Mesenchymal stem cells inhibit the expression of CD25 (interleukin-2receptor) and CD38 on phytohaemagglutinin-activated lymphocytes. Scand. J. Immunol 2004, 60, 307–315. [Google Scholar]
- Corna, D.; Morigi, M.; Facchinetti, D.; Bertani, T.; Zoja, C.; Remuzzi, G. Mycophenolate mofetil limits renal damage and prolongs life in murine lupus autoimmune disease. Kidney Int 1997, 51, 1583–1589. [Google Scholar]
- Shirai, T.; Hirose, S.; Sekigawa, I.; Sato, H. Genetic and cellular basis of anti-DNA antibody synthesis in systemic lupus erythematosus of New Zealand mice. J. Rheumatol 1987, 13, 11–20. [Google Scholar]
- Haynesworth, S.E.; Baber, M.A.; Caplan, A.I. Cytokine expression by human marrow-derived mesenchymal progenitor cells in vitro: effects of dexamethasone and IL-1 alpha. J. Cell Physiol 1996, 166, 585–592. [Google Scholar]
- Goshima, J.; Goldberg, V.M.; Caplan, A.I. The osteogenic potential of culture-expanded rat marrow mesenchymal cells assayed in vivo in calcium phosphate ceramic blocks. Clin. Orthop 1991, 269, 298–311. [Google Scholar]
- Pittenger, M.F.; Mackay, A.M.; Beck, S.C. Multilineage potential of adult human mesenchymal stem cells. Science 1999, 284, 143–147. [Google Scholar]
- Stute, N.; Holtz, K.; Bubenheim, M.; Langea, C.; Blake, F.; Zander, A.R. Autologous serum for isolation and expansion of human mesenchymal stem cells for clinical use. Exp. Hematol 2004, 32, 1212–1215. [Google Scholar]
- Szabo, S.; Kim, S.T.; Costa, L.G.; Zhang, X.; Fathman, C.G.; Glimcher, L. A novel transcription factor, T-bet, directs Th1 lineagecommitment. Cell 2000, 100, 655–659. [Google Scholar]
- Pai, S.Y.; Truitt, M.L.; Ho, I.C. GATA-3 deficiency abrogates the development and maintenance of T helper type 2 cells. Proc. Natl. Acad. Sci. USA 2004, 101, 1993–1998. [Google Scholar]
- Chakir, H.; Wang, H.; Lefebvre, D.E.; Webb, J.; Scott, F.W. T-bet/GATA-3 ratio as a measure of the Th1/Th2 cytokine profile in mixed cell populations: predominant role of GATA-3. J. Immunol. Methods 2003, 278, 157–169. [Google Scholar]
- Krampera, M.; Glennie, S.; Dyson, J.; Scott, D.; Laylor, R. Bone marrow mesenchymal stem cells inhibit the response of naive and memory antigen-specific T cells to their cognate peptide. Blood 2003, 101, 3722–3729. [Google Scholar]
- Djouad, F.; Plence, P.; Bony, C.; Tropel, P.; Apparailly, F.; Sany, J. Immunosuppressive effect of mesenchymal stem cells favors tumor growth in allogeneic animals. Blood 2003, 102, 3837–3844. [Google Scholar]
- Deng, W.; Han, Q.; Liao, L. Effects of allogeneic bone marrow-derived mesenchymal stem cells on T and B lymphocytes from BXSB mice. DNA Cell. Biol 2005, 2, 458–463. [Google Scholar]
- Rasmusson, I.; Ringden, O.; Sundberg, B.; Le Blanc, K. Mesenchymal stem cells inhibit lymphocyte proliferation by mitogens and alloantigens by different mechanisms. Exp. Cell. Res 2005, 305, 33–41. [Google Scholar]
- Zappia, E.; Casazza, S.; Pedemonte, E.; Benvenuto, F.; Bonanni, I.; Gerdoni, E. Mesenchymal stem cells ameliorate experimental autoimmune encephalomyelitis inducing T-cell anergy. Blood 2005, 106, 1755–1761. [Google Scholar]
- Tse, W.T.; Pendleton, J.D.; Beyer, W.M.; Egalka, M.C.; Guinan, E.C. Suppression of allogeneic T-cell proliferation by human marrow stromal cells: implications in transplantation. Transplantation 2003, 75, 389–397. [Google Scholar]
- Plumas, J.; Chaperot, L.; Richard, M.J.; Molens, J.P.; Bensa, J.C.; Favrot, M.C. Mesenchymal stem cells induce apoptosis of activated T cells. Leukemia 2005, 19, 1597–1604. [Google Scholar]
- Le Blanc, K.; Ringden, O. Immunobiology of human mesenchymal stem cells and future use in hematopoietic stem cell transplantation. Biol. Blood Marrow Tr 2005, 11, 321–334. [Google Scholar]
- Richaud-patin, Y.; Alcocer-Varela, J.; Llorente, L. High levels of TH2 cytokine gene expression in systemic lupus erythematosus. Rev. Invest. Clin 1995, 47, 267–272. [Google Scholar]
- Horwitz, D.A.; Gray, J.D.; Behrendsen, S.C.; Kubin, M.; Rengaraju, M.; Ohtsuka, K. Decreased production of interleukin-12 and other Th1-type cytokines in patients with recent-onset systemic lupus erythematosus. Arthritis Rheum 1998, 41, 838–844. [Google Scholar]
- Chen, Y.C.; Ye, Y.L.; Chiang, B.L. Establishment and characterization of cloned CD4-CD8-αβ-T cell receptor (TCR) -bearing autoreactive T cells from autoimmune NZB×NZWF1 mice. Clin. Exp. Immunol 1997, 108, 52–57. [Google Scholar]
- Aringer, M.; Zimmermann, C.; Graninger, W.B.; Petera, P.; Steiner, G.; Ulrich, W.; Smolen, J.S. TNF-α is an essential mediator in lupus nephritis. Arthritis Rheum 2002, 46, 3418–3419. [Google Scholar]
- Gabay, C.; Cakir, N.; Moral, F.; Roux-Lombard, P.; Meyer, O.; Dayer, J.M. Circulating levels of tumor necrosis factor soluble receptors in systemic lupus erythematosus are significantly higher than in other rheumatic diseases and correlate with disease activity. J. Rheumatol 1997, 24, 303–308. [Google Scholar]
- Al-Janadi, M.; Al-Balla, S.; Al-Dalaan, A.; Raziuddin, S. Cytokine profile in systemic lupus erythematosus, rheumatoid arthritis, and other rheumatic diseases. J. Clin. Immunol 1993, 13, 58–67. [Google Scholar]
- El-Badri, N.S.; Pascual, C.; Ferrari, A.; Maheshwari, A. Abnormalities of stromal cells in autoimmune systemic lupus murine model. Blood 2004, 104, 364A. [Google Scholar]
© 2007 by MDPI Reproduction is permitted for noncommercial purposes.
Share and Cite
MDPI and ACS Style
Sun, L.; Liang, J.; Li, H.; Hou, Y. Polarization of T Lymphocytes Is Regulated by Mesenchymal Stem Cells in NZBWF1 and BALB/c Mice. Int. J. Mol. Sci. 2007, 8, 455-469. https://doi.org/10.3390/i8050455
AMA Style
Sun L, Liang J, Li H, Hou Y. Polarization of T Lymphocytes Is Regulated by Mesenchymal Stem Cells in NZBWF1 and BALB/c Mice. International Journal of Molecular Sciences. 2007; 8(5):455-469. https://doi.org/10.3390/i8050455
Chicago/Turabian StyleSun, Lingyun, Jun Liang, Hui Li, and Yayi Hou. 2007. "Polarization of T Lymphocytes Is Regulated by Mesenchymal Stem Cells in NZBWF1 and BALB/c Mice" International Journal of Molecular Sciences 8, no. 5: 455-469. https://doi.org/10.3390/i8050455