Article

Electrochemical Recognition of Metalloproteins by Bromide-modified Silver Electrode - A New Method

1
Institute of Biochemistry and Biophysics, University of Tehran, Tehran, Iran
2
Department of Chemistry, Faculty of Science, University of Tehran, Tehran, Iran
3
Department of Chemistry, University of Agriculture, Faisalabad, Pakistan
4
Department of Chemistry, Faculty of Science, University of Mazandaran, Babolsar, Iran
*
Author to whom correspondence should be addressed.
Int. J. Mol. Sci. 2007, 8(7), 723-735; https://doi.org/10.3390/i8070723
Submission received: 8 May 2007 / Revised: 9 July 2007 / Accepted: 19 July 2007 / Published: 25 July 2007
(This article belongs to the Section Biochemistry)

Abstract

:
A bromide–modified silver electrode is reported, in the present study, to catalyze the redox reactions of metalloproteins. This study describes that the bromide ions show very good redox behavior with silver electrode. The cathodic and anodic peak potentials were related to the concentration of bromide ions involved in making bromide-modified silver electrode. The electrode reaction in the bromine solution was a diffusion-controlled process. Positive potential shift of the bromide ions was seen when different proteins were added to the solution using a silver electrode. New cathodic and anodic peaks were observed at different potential ranges for myoglobin, cytochrome c and catalase. A linearly increasing cathodic peak current of bromide ions was seen when the concentration of superoxide dismutase was increased in the test solution. However, no change for albumin was observed when its concentration was increased in the test solution. Present data proves our methodology as an easy-to-use analysis for comparing the redox potentials of different metalloproteins and differentiating the metallo-from non-metalloproteins. In this study, we introduced an interesting method for bio-electrochemical analyses.

1. Introduction

Recently, electrochemical methods are being used for improving the investigation of metalloproteins (redox proteins) [1]. The redox behavior of a protein can be used to design a biosensor [2,3], which can measure the protein concentration [4] and to investigate the structure of this protein after ligand binding or changes in the environment [58]. It is well known that the biological macromolecules exhibit a rather slow rate of heterogeneous electron transfer at conventional electrodes, which is ascribed to the macromolecule’s extended three-dimensional structure, the resulting inaccessibility of their electro-active centers or to their adsorption onto and subsequent passivity of the electrode surface [1,9]. Chemically modified electrodes have been prepared in order to overcome these problems [1,9]. Two kinds of modified electrodes have been applied; one is a mediator-modified electrode, while the other is a promoter electrode. The difference is due to the electro-activity of the modifiers. The mediator-modified electrode has a component that takes part in electron transfer in the potential range of interest, while the promoter electrode does not. Therefore, the materials that serve as a mediator can yield redox waves [1,9].
The potential range of a protein depends on many factors, which can be used to determine the intrinsic redox potential of heme proteins including the axial ligation pattern, orientation of the ligands, porphyrin conformation, solvent exposure of the heme and thus the polarity and hydrophobicity of the heme pocket, interactions of heme and its ligands with the protein environment [1015]. Shifman et al (2000) have demonstrated the reduction potential modulation of heme proteins in a single four-helix bundle. They showed that the redox potential of heme depends on heme-charged amino acids [16], heme-hydrophobic amino acids [1820], the burial of heme in the hydrophobic core [16] and heme peripheral substituents and the kind of metal ions [1617].
Some challenges encountered during the use of chemically modified electrodes are: 1) most of the methods used to this time, cannot show redox behavior of all the redox proteins [21], 2) such methods cannot differentiate metallo-from non-metalloproteins and 3) these methods need fixing of mediators and proteins onto the surface of electrode [1,4,22]. In this study, a novel method was devised for the redox behavior determination of the proteins in a solution. Present method does not need the fixing of mediator, uses bromide ions as promoters and the proteins, having redox species, can easily be detected.

2. Results and Discussion

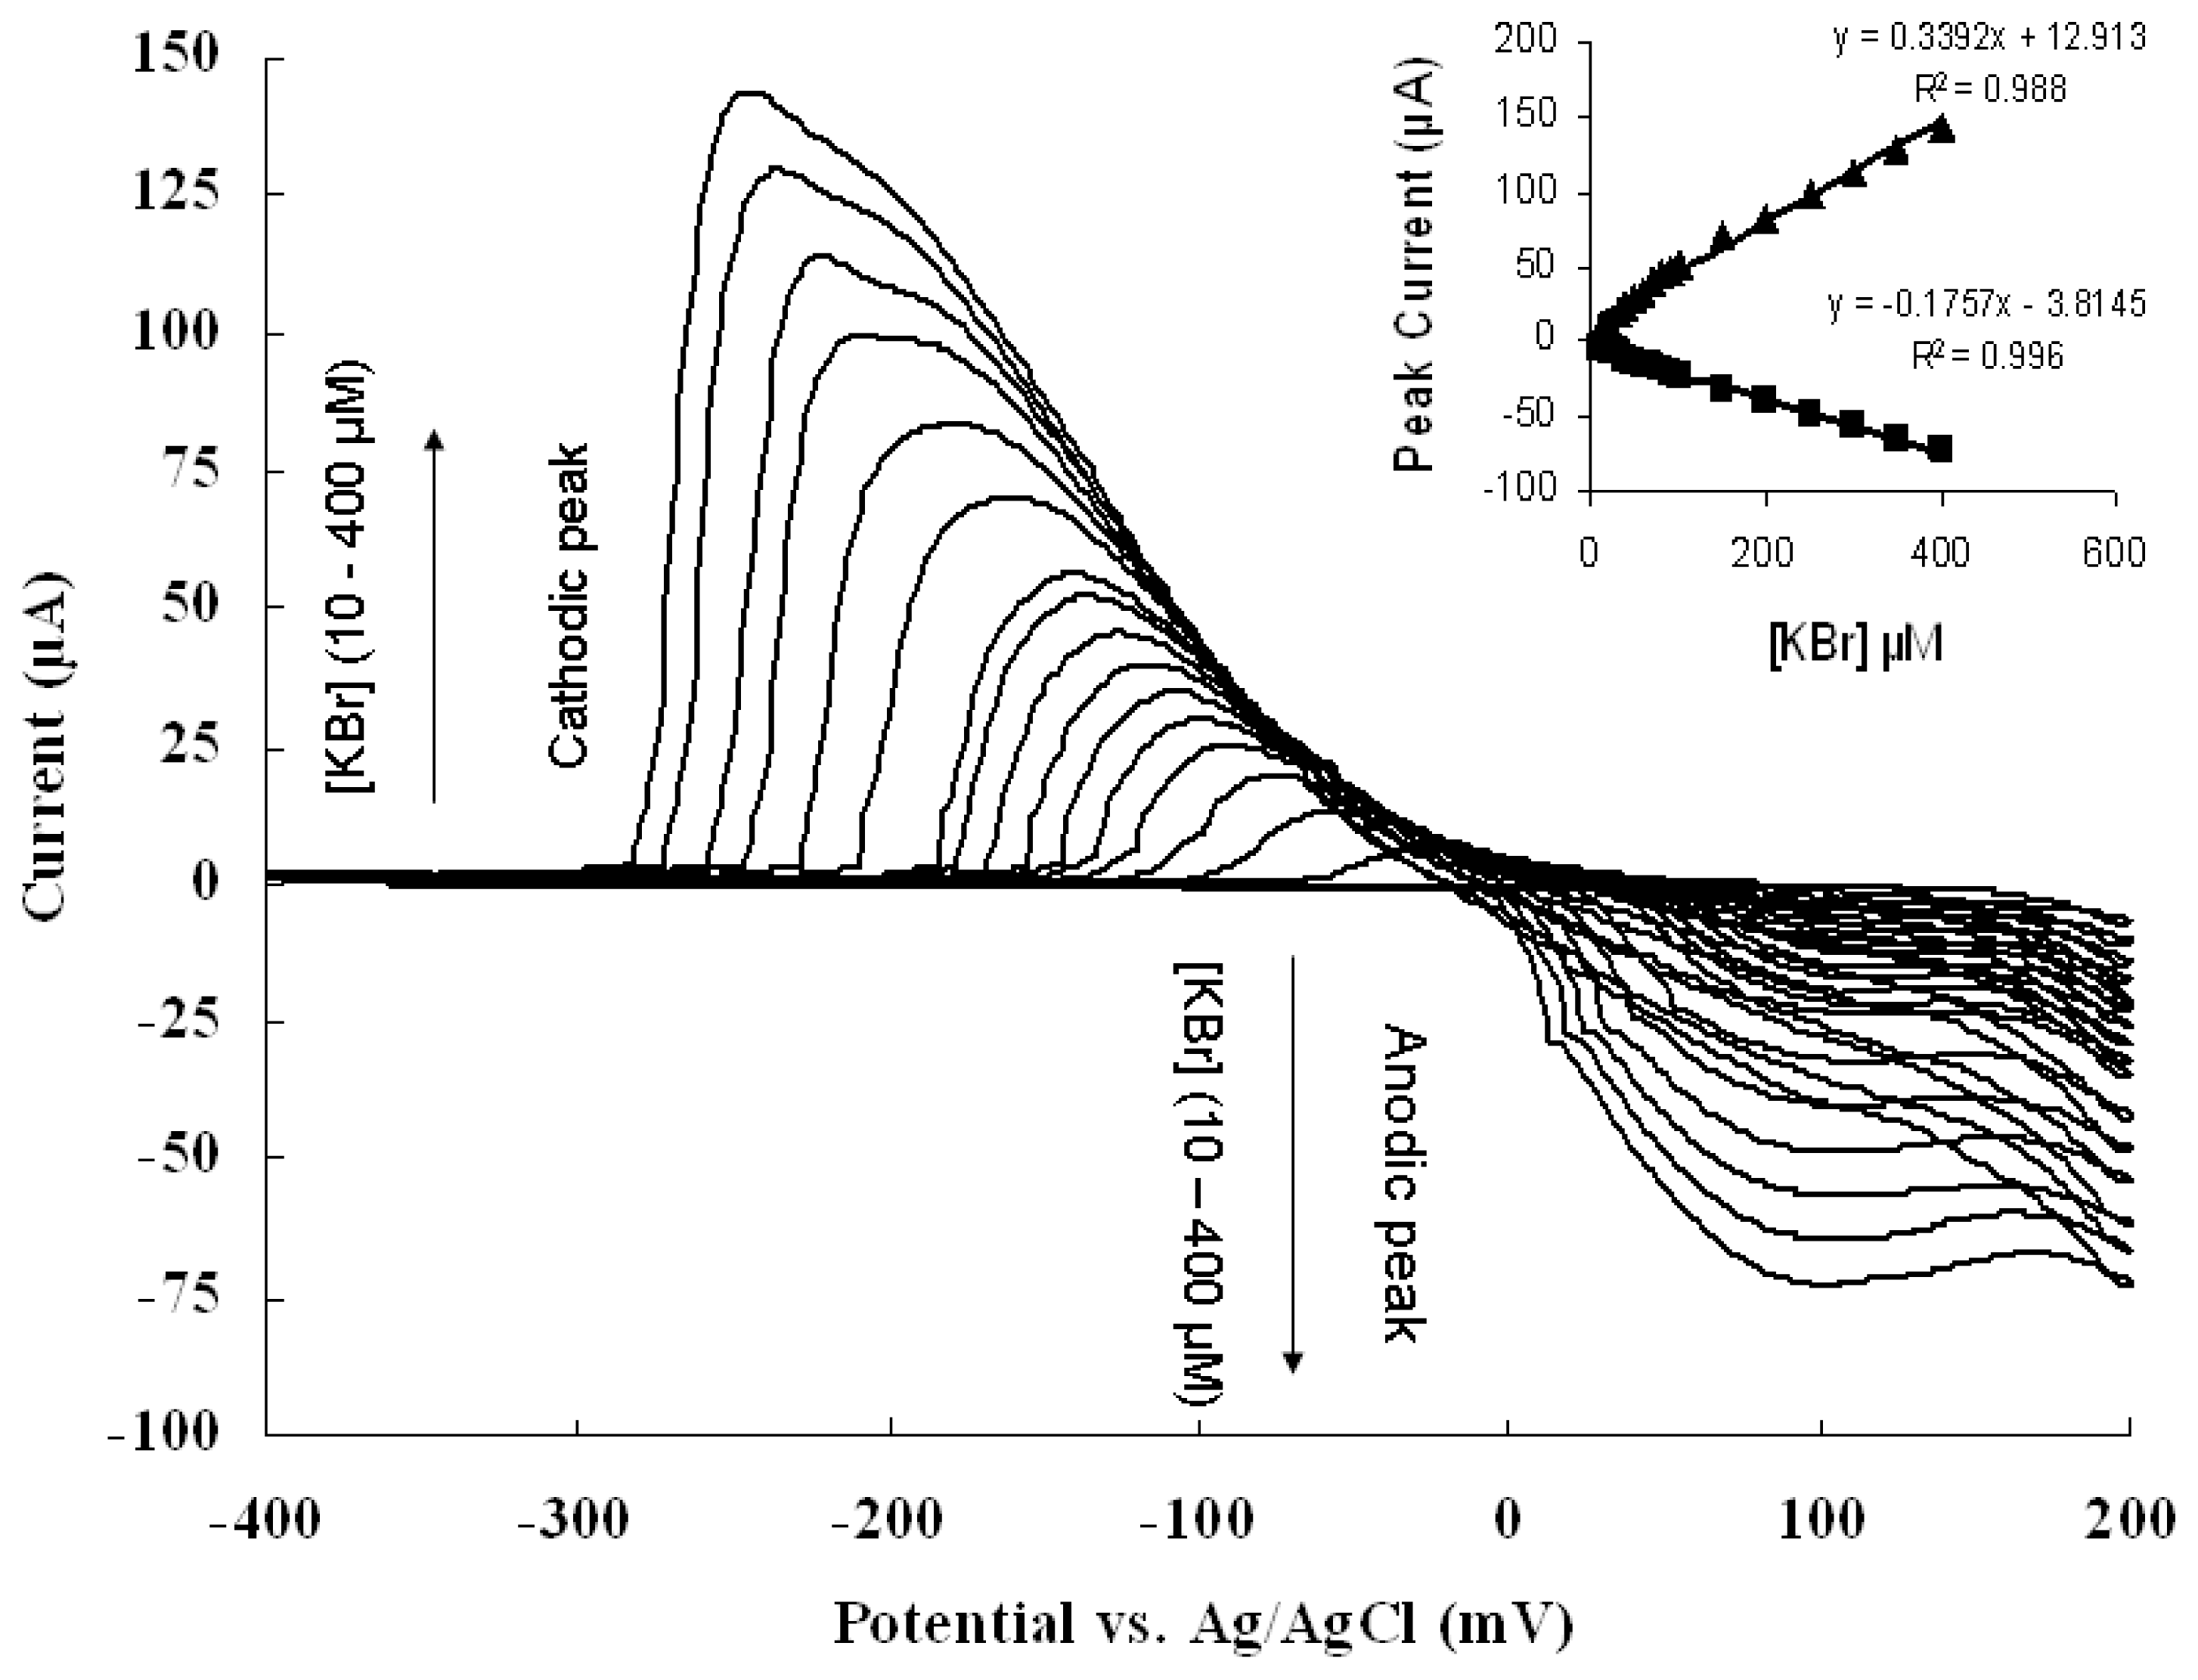
2.1 Redox behavior and concentration effect of bromide ions on silver electrode

When a halide ion such as; chloride or bromide in a solution of KNO3, reacts with the Ag electrode surface, a silver halide precipitate is formed on the surface, consequently producing an oxidation wave on the voltammograms [23]. The reduction of the silver halide precipitate on the electrode surface leads to the generation of a reduction current in accordance with the equation (1) [23]:
AgBr + e - Ag + Br - E Ag / AgBr = - 100 mV     ( vs . Ag / Ag Cl )
Where EAg/AgBr is a quasi-reversible potential with 300 μM Br in the electrolyte solution.
Cyclic voltammograms of silver electrode were obtained in the presence of different concentrations of Brions in KNO3 solution, which is represented in the Figure 1. Increasing concentration of Br leads to a negative shift in the cathodic peak, which is similar to the previous results [24]. Current figure and Equation (1) show very good redox behavior of bromide ions with silver electrode. Inset of Figure 1 shows a linear relationship of bromide ion concentration with cathodic and anodic peak currents. As described in the figure, only 300 μM concentration of bromide ions showed 130 and 60 μA current for cathodic and anodic peaks, respectively. Our work also describes that the changed concentration of bromide ions can lead to a significant change in its mediator function by changing its peak current.

2.2 Dependence of peak current on scan rate

Figure 2 demonstrates the cyclic voltammograms of silver electrode. This analysis was done at different scan rates in the presence of 300 μM KBr. Inset of figures (a) and (b) show that the cathodic and anodic peak currents of bromide ions have a linear relationship with square root of scan rate (v1/2). In this case, the electrode reaction is considered to be under “diffusion control” (often called “mass-transport control”), when overall rate of the reaction is controlled by diffusion rate of reactants towards the electrode surface, rather than the reaction itself (kinetic control) [25]. This data supports the fact that Br reaction is related only to the diffusion rate of Br from the solution to the surface of electrode.
It means that Br do not remain attached to the electrode. It immediately separates from the electrode after undergoing the reaction. Due to this property, bromide ion mediator does not decrease sensitivity of the working electrode but other mediators show this negative effect. Different materials such as gels and some polymers etc. are needed to fix most of the electrochemical mediators on the surface of electrode [1,9] but bromide ions can mediate the reaction in solution without being fixed to the electrode.

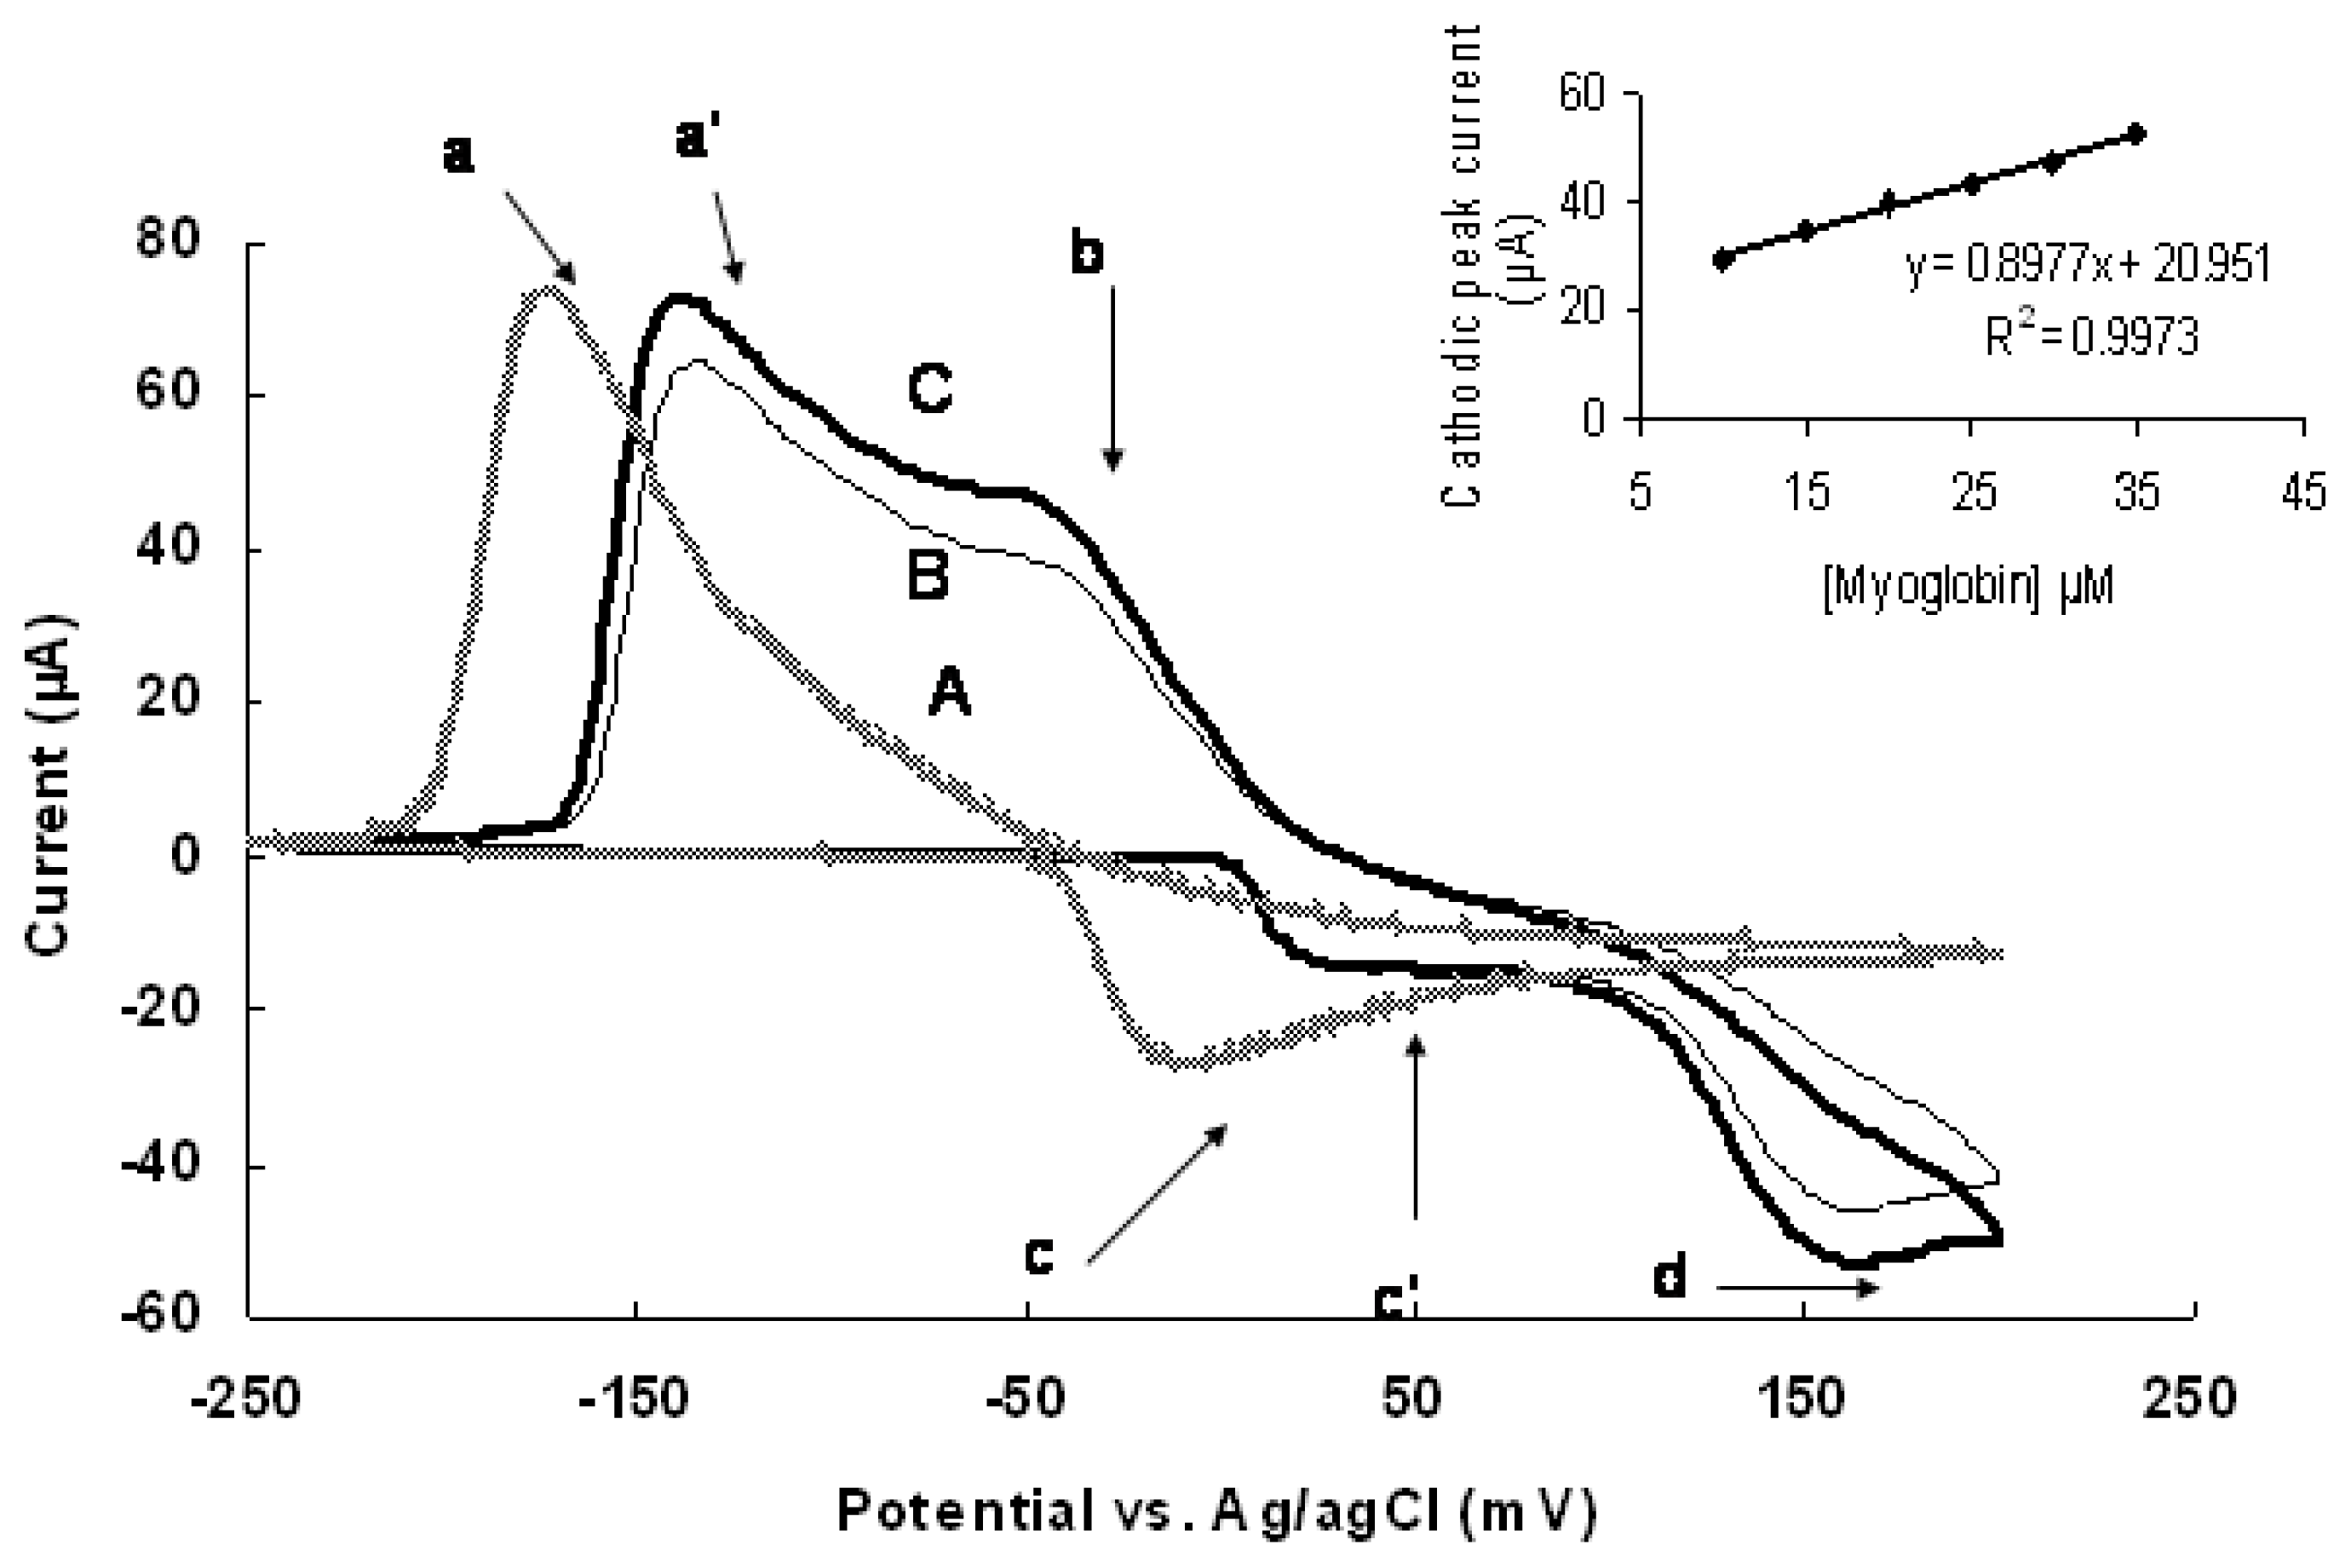
2.3 Catalytic redox reaction of myoglobin at modified silver electrode and the detection of myoglobin

Effect of different concentrations of myoglobin was noted on the cyclic voltammograms of silver electrode in 0.1 M KNO3 solution, as illustrated in Figure 3. Cyclic voltammograms of silver electrode were recorded in a solution of 0.1 M KNO3 with the following: (A) 300 μM bromide ions (B) 300 μM bromide ions and 20 μM myoglobin (C) 300 μM bromide ions and 30 μM myoglobin. In this Figure, (a) and (c) represent cathodic and anodic peaks of bromide ions respectively, (a′) and (c′) represent the cathodic and anodic peaks of bromide ions in a solution with myoglobin, (b) and (d) represent the cathodic and anodic peaks of myoglobin. Here, we see that the addition of myoglobin to bromine ions solution leads to a potential shift in the cathodic and anodic peaks of Br for about 40 and 25 mV, respectively and new cathodic and anodic peaks were seen in the region of −45 and 162 mV, which are related to myoglobin. The potential shift of bromide ions, after the addition of myoglobin, is a function of myoglobin concentration on the surface of silver electrode. One possibility is the adsorption of myoglobin onto the surface of electrode and changing the surface property of silver electrode. The present work shows that bromide-modified silver electrode can undergo electro-catalyzed oxidation and reduction of myoglobin. With bromide ions as electro-catalyzer, myoglobin shows strong anodic and cathodic peak currents but in the absence of these ions, myoglobin cannot show any redox behavior.
Inset of Figure 3 represents a linear relationship between cathodic peak currents and the concentration of myoglobin in 0.1 M KNO3 solution containing 300 μM KBr. Note that the change in cathodic peak current of myoglobin (−45 mV) has a linear relationship with myoglobin concentration in the range of 10–35 μM, which is related to the redox potential of myoglobin within this range.

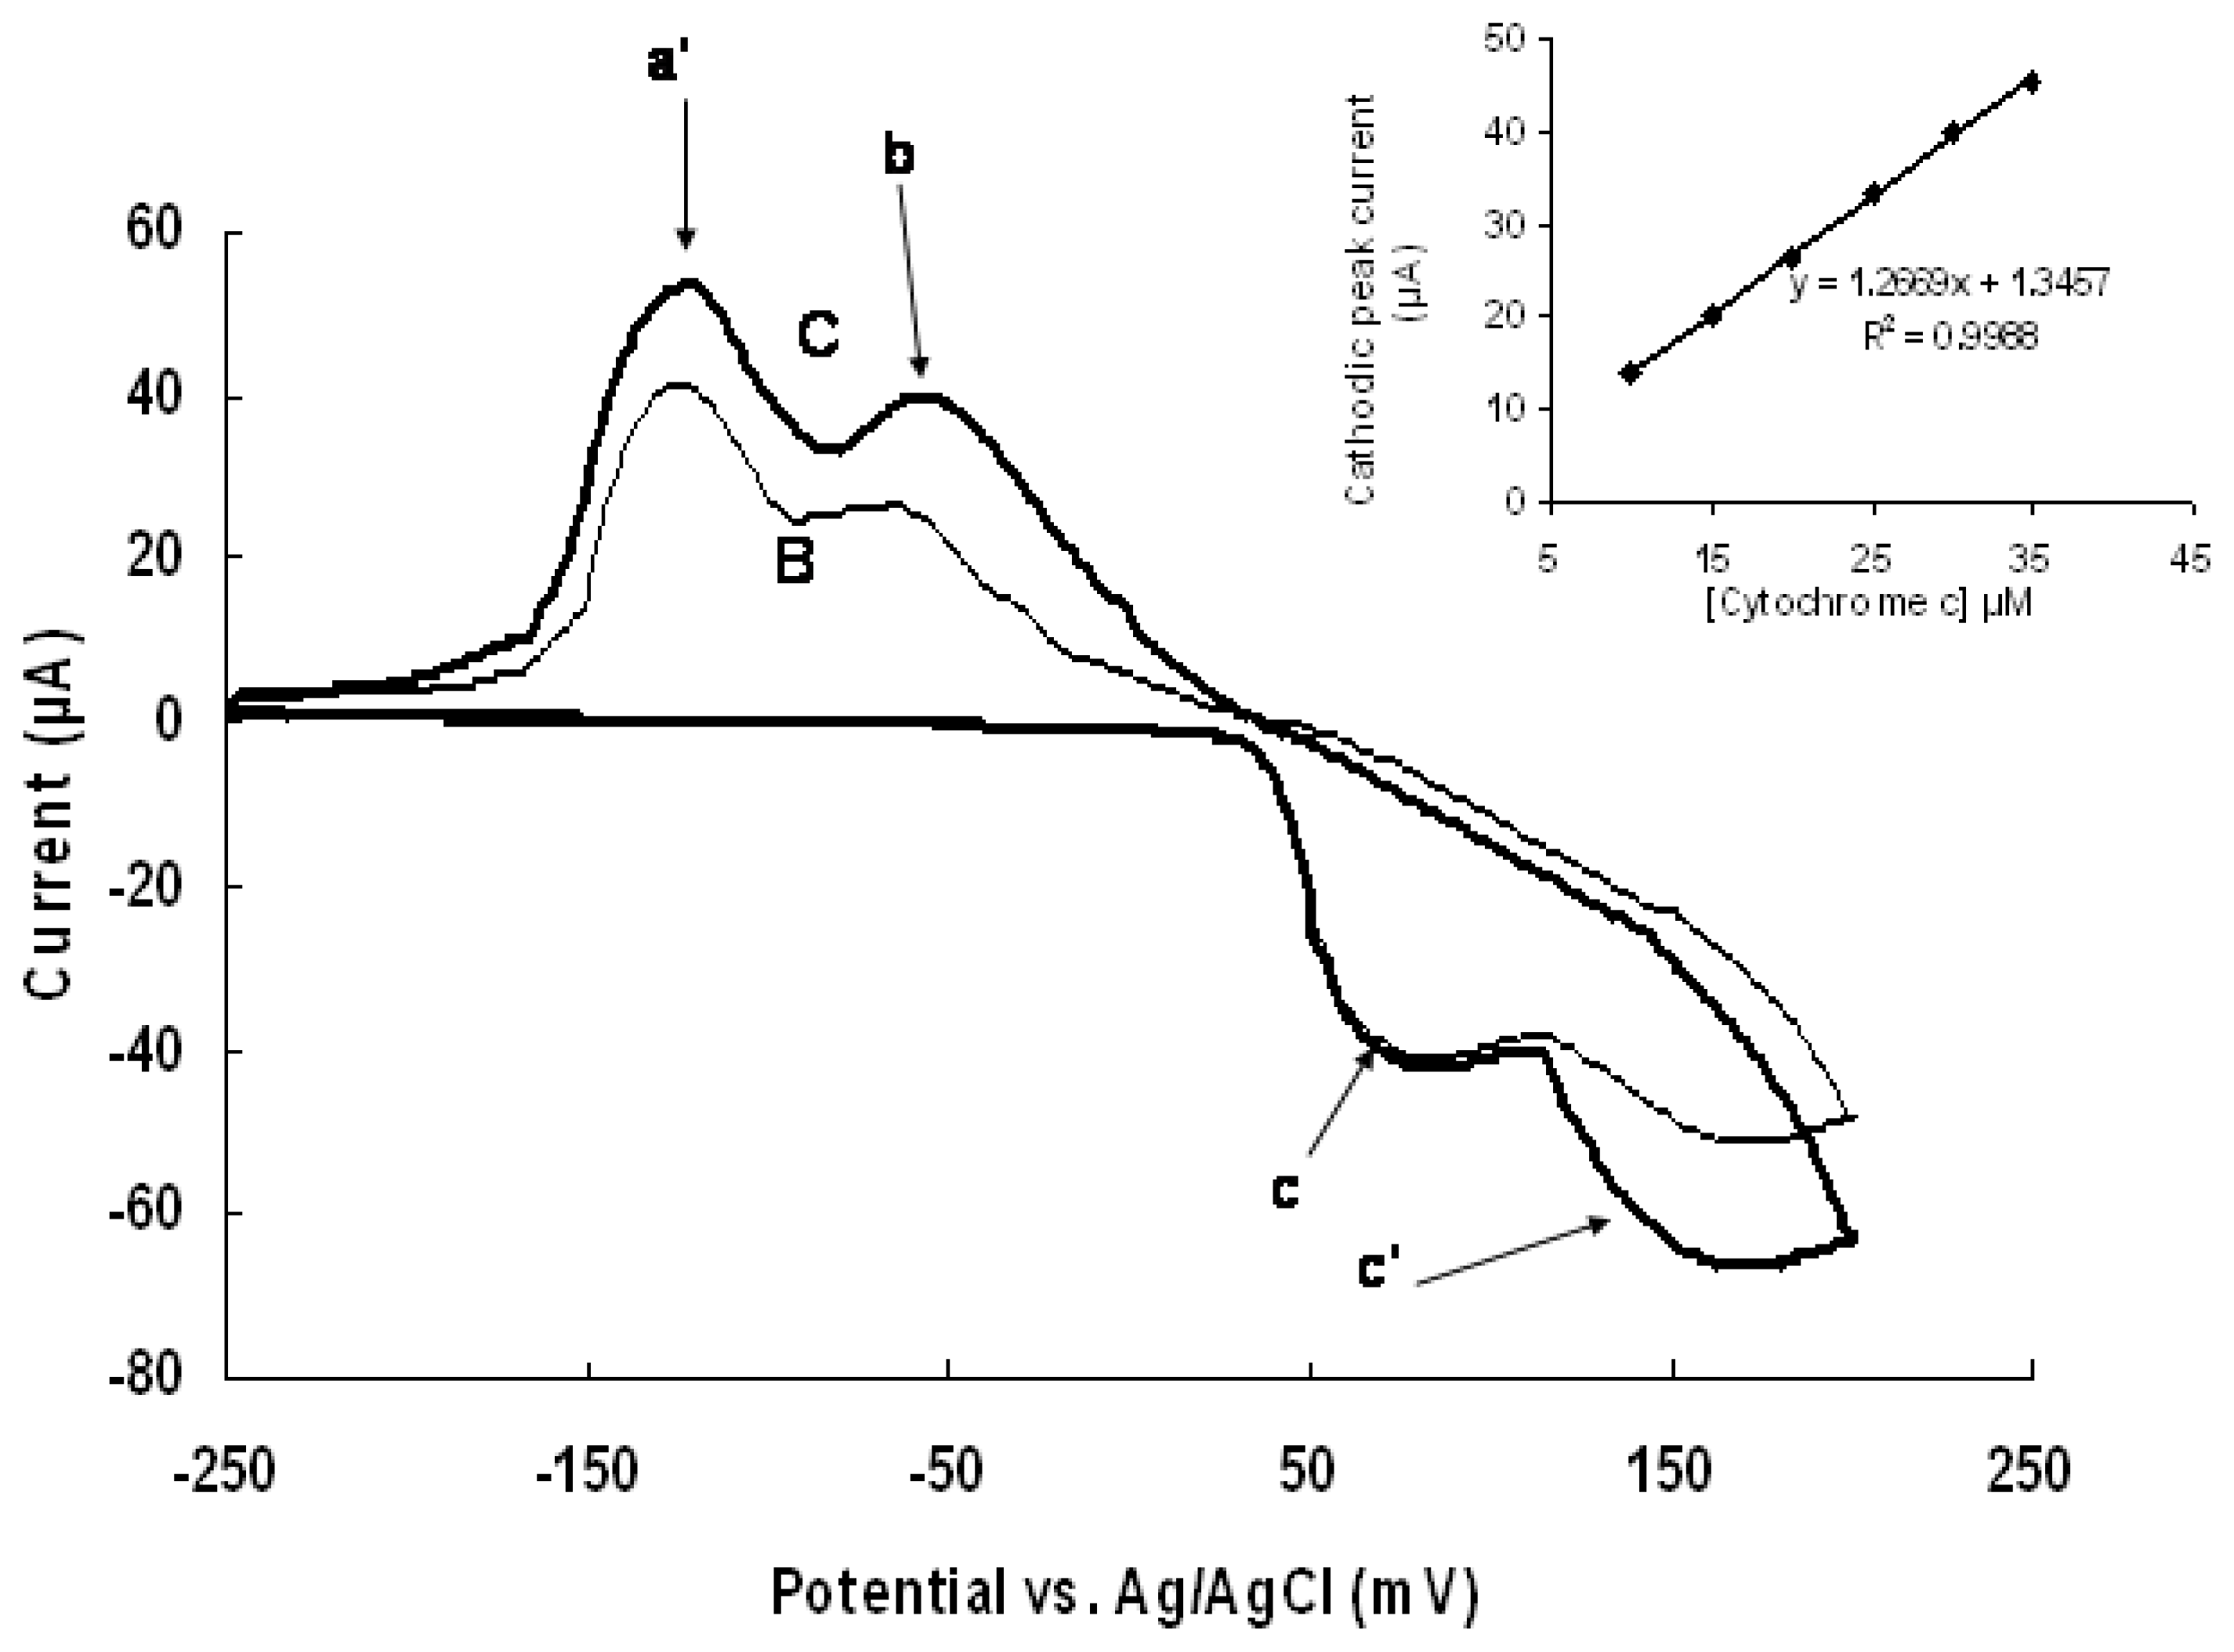
2.4 Catalytic redox reaction of cytochrome c at modified silver electrode and cytochrome c detection

Cyclic voltammograms of silver electrode were recorded in a solution of 0.1 M KNO3. The reaction was undertaken with the following: (B) 300 μM bromide ions and 20 μM cytochrome c (C) 300 μM bromide ions and 30 μM cytochrome c, as shown in the Figure 4 where (a′) and (c′) are the cathodic and anodic peaks of bromide ions in the solution containing cytochrome c; (b) and (d) are cathodic and anodic peaks of cytochrome c. Here, we see that the addition of cytochrome c to bromine solution leads to a potential shift in the cathodic and anodic peaks of Br for about 65 and 105 mV, respectively and new cathodic and anodic peaks were seen in the region of −66 and 174 mV, which are related to cytochrome c. The present work shows that bromide-modified silver electrode can undergo electro-catalyzed oxidation and reduction of cytochrome c. In the presence of bromide ions as electro-catalyzer, cytochrome c shows strong anodic and cathodic peak currents but in the absence of these ions, cytochrome c cannot show any redox behavior.
Inset of Figure 4 represents the relationship between cathodic peak currents and the concentration of cytochrome c in 0.1 M KNO3 solution containing 300 μM KBr. Note that the change in cathodic peak current of cytochrome c (−66 mV) has a linear relationship with cytochrome c concentration in the range of 10–35 μM, which is related to the reduction of cytochrome c within this range.

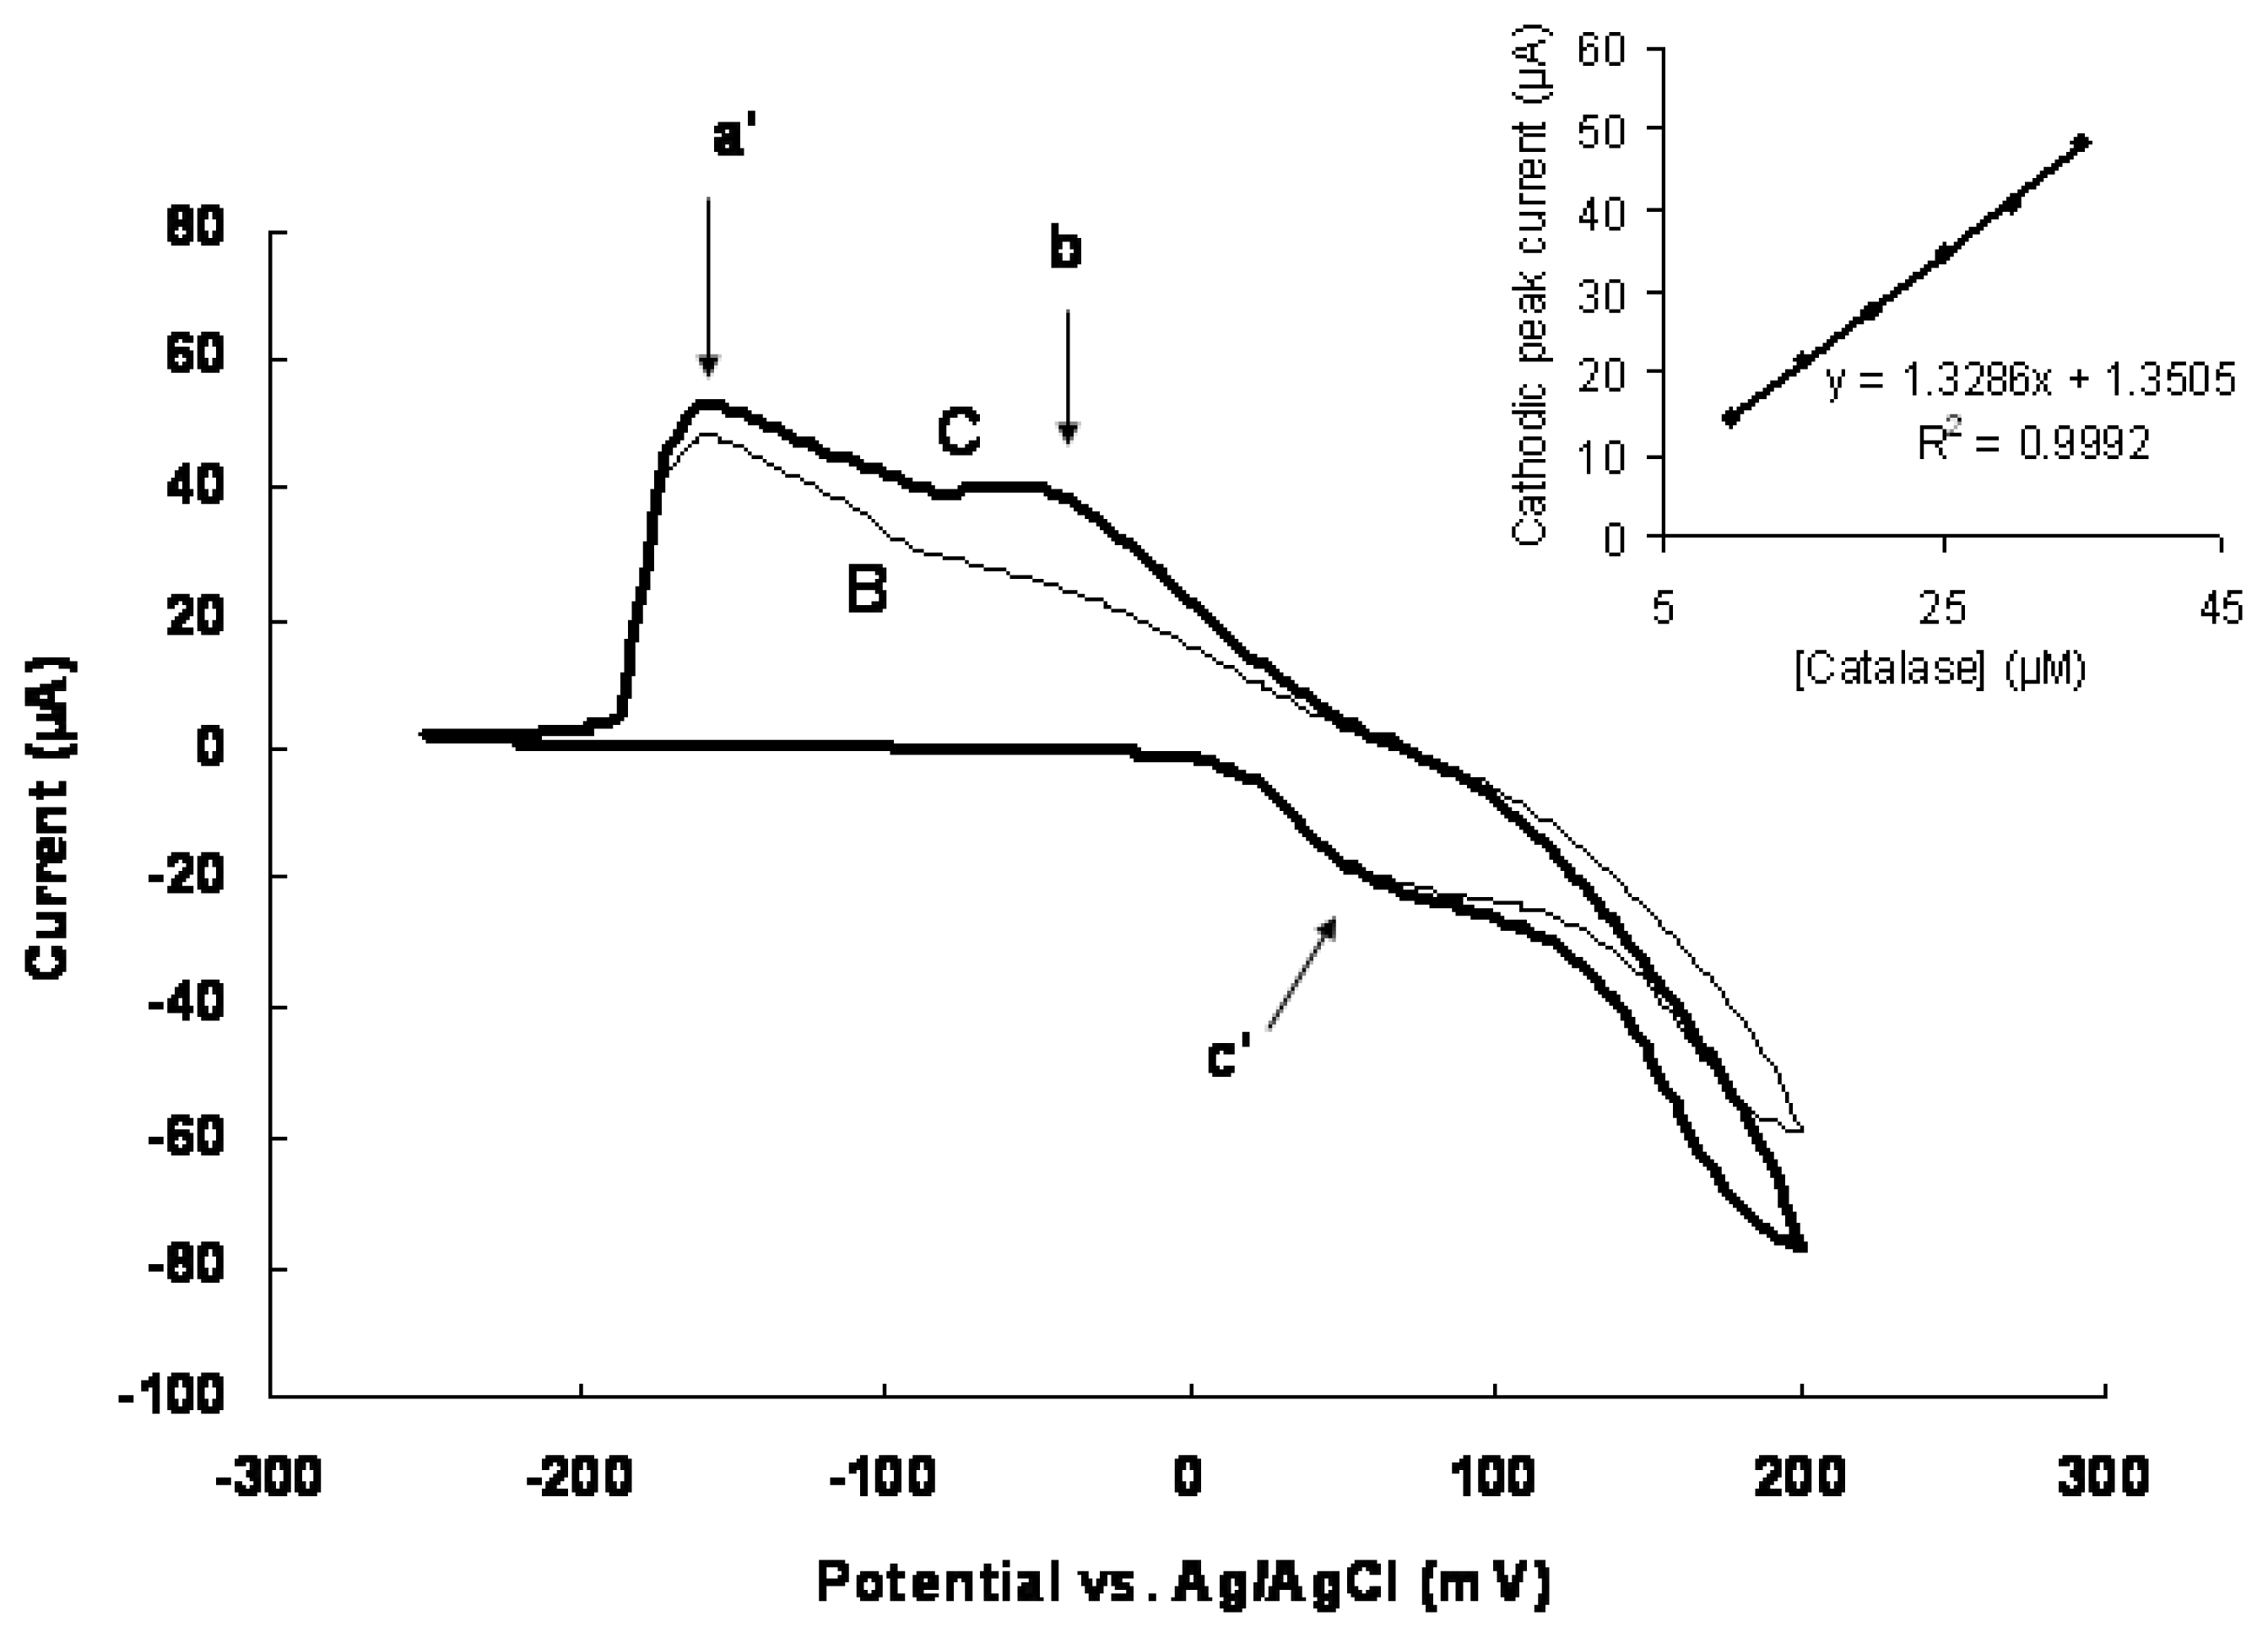
2.5 Catalytic redox reaction of catalase at modified silver electrode and catalase detection

Cyclic voltammograms of silver electrode were recorded in a solution of 0.1 M KNO3 with the following: (B) 300 μM bromide ions and 20 μM catalase (C) 300 μM bromide ions and 30 μM catalase, as shown in Figure 5, where (a′) and (c′) are the cathodic and anodic peaks of bromide ions in a solution with catalase while, (b) cathodic peaks of catalase. Here, we see that the addition of catalase to bromine solution leads to a potential shift in cathodic and anodic peaks of Br for about 20 and 65 mV, respectively and new cathodic and anodic peaks were seen in the regions of −52 and out of the range of 200 mV, which are related to the presence of catalase. The present work shows that bromide-modified silver electrode can undergo electro-catalyzed oxidation and reduction of catalase as described in Figure 5. With bromide ions as electro-catalyzer, catalase shows strong anodic and cathodic peak current but in the absence of these ions, catalase cannot show any redox behavior. Inset of figure 5 represents the relationships of cathodic peak current and the concentrations of catalase in 0.1 M KNO3 solution having 300 μM KBr. Note that the change in cathodic peak current of catalase (−52 mV) has a linear relationship with catalase concentration in the range of 10–35 μM, which is related to the redox potential of catalase within this range.

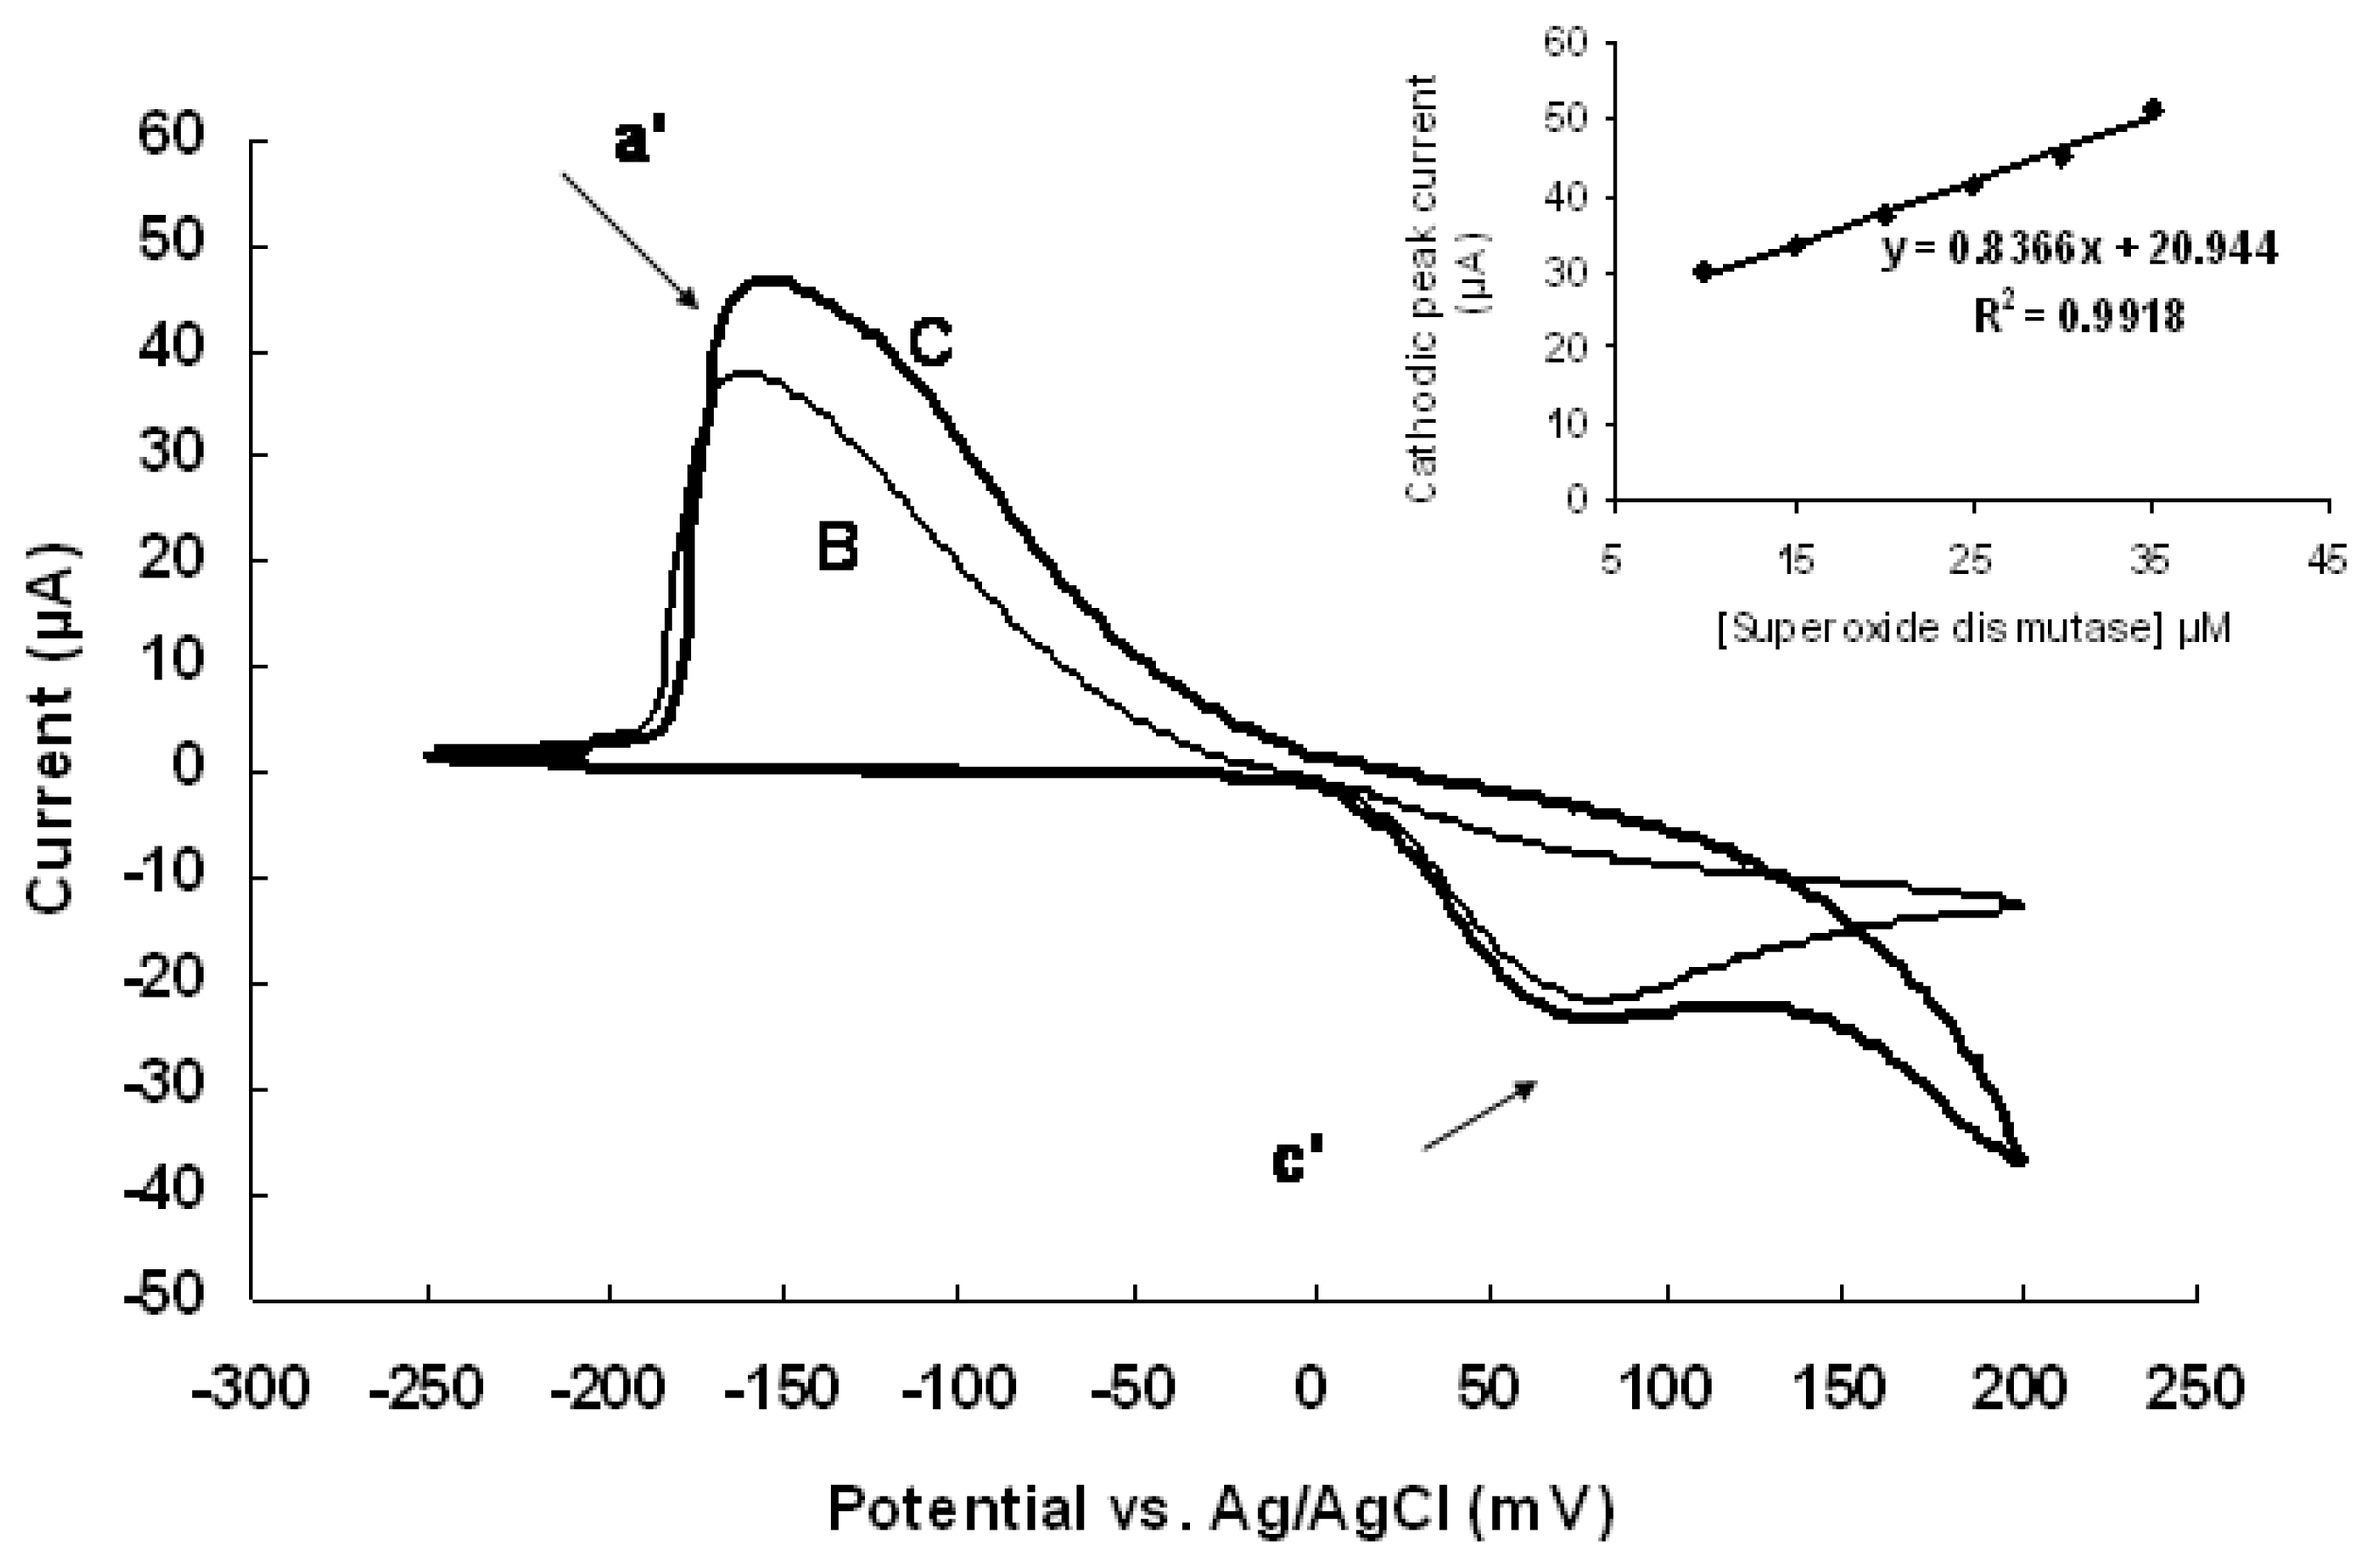
2.6 Catalytic redox reaction of superoxide dismutase at modified silver electrode and the detection of superoxide dismutase

Cyclic voltammograms of sliver electrode were recorded in the solution of 0.1 M KNO3. The reaction was carried out in the presence of: (B) 300 μM bromide ions and 20 μM superoxide dismutase (C) 300 μM bromide ions and 30 μM superoxide dismutase, as shown in the Figure 6, where (a′) and (c′) are showing the cathodic and anodic peaks of bromide ions in a solution having superoxide dismutase. Here, we see that the addition of superoxide dismutase to the bromine solution leads to a potential shift in the cathodic and anodic peaks of Br for about 15 and 80 mV. Appearance of new cathodic and anodic peaks was not detected for this protein but an increasing cathodic and anodic peak current was seen, which is related to the redox behavior of superoxide dismutase. This data shows that the redox-potential region of the superoxide dismutase is very near to the potential region of bromide ions after the addition of protein. The present work shows that the bromide-modified silver electrode can undergo electro-catalyzed oxidation and reduction of superoxide dismutase. Using bromide ions as electro-catalyzer, superoxide dismutase shows increasing anodic and cathodic peak currents but in the absence of bromide ions, the protein does not show any redox behavior.
Inset of Figure 6 represents the relationship between cathodic peak currents of bromide ions and the concentration of superoxide dismutase in 0.1 M KNO3 solution having 300 μM KBr. Note that the change in cathodic peak current of bromide ions has a linear relationship with superoxide dismutase concentration in the range of 10–35 μM.

2.7 Effect of albumin on redox peak of bromide ions

Cyclic voltammograms of silver electrode were also recorded in a solution of 0.1 M KNO3. The reaction was carried out in the presence of (B) 300 μM bromide ions and 20 μM albumin (C) 300 μM bromide ions and 30 μM albumin, as shown in Figure 7, where (a′) and (c′) are the cathodic and anodic peaks of bromide ions in the solution, which contained albumin. Here, we see that by adding the albumin to the bromine solution leads to a potential shift in the cathodic and anodic peaks of Br for about 52 and 58 mV. Neither new cathodic and anodic peaks nor increasing cathodic and anodic peak currents of bromide ions was seen in this experiment. This experiment describes that any oxidation and reduction is not happening in the presence of albumin.
Our work shows that bromide-modified silver electrode can undergo electro-catalyzed oxidation and reduction of metalloproteins as described in figure 8. With bromide ions as electro-catalyzer, the metalloproteins show a strong redox reaction but in the absence of these ions, these proteins cannot show any redox behavior.
The electrochemical behavior of different proteins, using the bromide–modified silver electrode, is summarized below in Table 1.
As observed in the present work, proteins lead to the following changes: new cathodic and anodic peaks for myoglobin, cytochrome c and catalase (with iron as the redox species in these proteins); an increase in the peak currents of bromide ions for SOD (Cu2+ as the redox species), but no change was observed with an increase in the concentration of albumin (which lacks any redox species). Our data showed that the redox potential ranges of Fe+3 in myoglobin, cytochrom c and catalase are different, which is in correspondence to previous works [16, 17], which explained that the environment around the redox species affects its redox behavior. Present work explains that the behavior of Cu was different from Fe in the presence of bromide-modified silver electrode. This method can also differentiate metal-containing proteins from non-metalloproteins.
Overall, a number of mediators have been used, to this time, for catalyzing the redox reaction of metalloproteins. Most of those mediators need to be immobilized on the surface of the electrode [1, 9] and in some conditions; it needs immobilization of the test protein. Such circumstances do not allow good peak stability of proteins. In immobilization studies, the protein detection depends on the stabilizing materials and the way of this stabilization [1,9,2628]. Present method does not need immobilization of mediator and protein, which makes it very stable and reliable method. Previous studies showed that some of mediators can catalyze redox reaction of small proteins but not the larger ones [21]. They showed that bare silver electrode cannot show the redox behavior of heme proteins. They used histidine-modified silver electrode and peak current response of small proteins, such as cytochrome c and myoglobin, was good but larger protein could not show any redox reaction but bromide mediator, used in the present method, can catalyze redox reactions for small as well as the large proteins without attaching to the surface of electrode. Such properties show that the bromide ions can be used in: concentration determination of metalloproteins, ligand binding and structural investigation of protein in the solution; redox behavior comparison of metalloproteins with each other and differentiating the metallo- and non-metalloprotein from each other. These findings make our method to be very useful in bio-electrochemical investigations.

3. Experimental section

3.1 Reagents

Catalase, cytochrome c, superoxide dismutase (SOD), bovine serum albumin (BSA), myoglobin, KNO3 and KBr were obtained from Sigma. All other chemical reagents were of analytical grade. Double distilled water was used in all experiments. Stock solutions were kept at 4 °C.

3.2 Preparation of working electrode

The working silver electrode (disk diameter of 1 mm) was obtained from Azar Electrode, Iran. The substrate silver electrode was first polished using the sand paper. Then, it was polished to mirror smoothness with alumina (particle size ~0.05 mm) water slurry on silk. The adsorbed species were further removed by etching the electrode in a 10 % HNO3 solution for one minute. Finally, the electrode was thoroughly washed with double distilled water and then treated in an ultrasonic bath for about 3 minutes. After this pretreatment, the silver electrode was ready to use.

3.3 Measurements

Electrochemical measurements were carried out with a Potentiostat/Galvanostat (Model 263A, EG&G, USA) and a single-compartment voltammetric cell, equipped with a platinum rod auxiliary electrode, and an Ag/AgCl reference electrode. A multi-block heater (Lab-Line Instruments Inc., USA) was employed to control the temperature of all the experiments. The entire experiment was performed at 25 ± 0.5 °C. Test solutions were de-aerated by bubbling with high purity nitrogen
Figure 1. Cyclic voltammograms of silver electrode were obtained in KNO3 solution having different concentrations of KBr. From inner to outer: 10; 20; 30; 40; 50; 60, 70; 80; 90; 100; 150; 200; 250; 300; 350 and 400 μM of KBr (scan rate: 100 mV s−1).
Ijms 08 00723f1
Figure 2. Cyclic voltammograms of silver electrode were obtained for 300 μM KBr in KNO3 solution. Scan rates from inner to outer are: 20, 40, 60, 80, 100, 150, 200, 250, 300, 350, 400, 500, 600, 700, 800, 900, 1000 mV/s. Inset a) Relationship of peak current and scan rate (v) and inset b) Relationship of peak current and square root of scan rate (v1/2).
Ijms 08 00723f2
Figure 3. Cyclic voltammograms of silver electrode in a solution of 0.1 M KNO3 and: (A) 300 μM bromide ions (B) 300 μM bromide ions and 20 μM myoglobin (C) 300 μM bromide ions and 30 μM myoglobin. In this Figure, (a) and (c) represent cathodic and anodic peaks of bromide ions, respectively; (a′) and (c′) represent the cathodic and anodic peaks of bromide ions in the solution with myoglobin; (b) and (d) represent cathodic and anodic peaks of myoglobin. (scan rate 20 mV s−1). Inset shows the linear relationship of myoglobin concentration with cathodic peak current.
Ijms 08 00723f3
Figure 4. Cyclic voltammograms of silver electrode in a solution of 0.1 M KNO3 and: (B) 300 μM bromide ions and 20 μM cytochrome c (C) 300 μM bromide ions and 30 μM cytochrome c. In this Figure, (a) and (c) represent cathodic and anodic peaks of bromide ions, respectively; (a′) and (c′) represent the cathodic and anodic peaks of bromide ions in the solution with cytochrome c; (b) and (d) represent cathodic and anodic peaks of cytochrome c. (scan rate 20 mV s−1). Inset shows the linear relationship of cytochrome c concentration with its cathodic peak current.
Ijms 08 00723f4
Figure 5. Cyclic voltammograms of silver electrode in a solution of 0.1 M KNO3 and: (B) 300 μM bromide ions and 20 μM catalase (C) 300 μM bromide ions and 30 μM catalase. In this Figure, (a′) and (c′) represent the cathodic and anodic peaks of bromide ions in the solution with catalase; (b) represent cathodic peaks of catalase (scan rate 20 mV s−1). Inset shows the linear relationship of catalase concentration with its cathodic peak current.
Ijms 08 00723f5
Figure 6. Cyclic voltammograms of silver electrode in a solution of 0.1 M KNO3 and: (B) 300 μM bromide ions and 20 μM superoxide dismutase (C) 300 μM bromide ions and 30 μM superoxide dismutase. (a′) and (c′) represent the cathodic and anodic peaks of bromide ions in the solution with superoxide dismutase (scan rate 20 mV s−1). Inset shows the linear relationship of superoxide dismutase concentration with cathodic peak current of bromide ions.
Ijms 08 00723f6
Figure 7. Cyclic voltammograms of silver electrode in a solution of 0.1 M KNO3 and: (B) 300 μM bromide ions and 20 μM albumin (C) 300 μM bromide ions and 30 μM albumin. (a′) and (c′) represent the cathodic and anodic peaks of bromide ions in the solution with albumin (scan rate 20 mV s−1).
Ijms 08 00723f7
Figure 8. Schematic diagram of electron exchange process between bromide-modified silver electrode and metalloproteins in the solution.
Ijms 08 00723f8
Table 1. Electrochemical behaviors of some proteins on a bromine–modified silver electrode in 0.1 M KNO3.
ProteinsMolecular weight (MW)Electrode reactionAnodic peak potential of the proteins (mV)Cathodic peak potential of the proteins (mV)

Myoglobin16,700Heme (Fe3+) + e ↔Heme (Fe2+)162−45
Cytochrome c12,380Cyt c [heme (Fe3+)] + e↔ Cyt [heme (Fe2+)]174−66
Catalase250,000Catalase [heme (Fe3+)] + e↔ Catalase [heme (Fe2+)]>200−52
Superoxide dismutase32,500SOD (Cu2+) + e ↔ SOD (Cu+)80−150
Albumin67,000-----------------

Acknowledgements

The financial supports from the University of Tehran and the Iranian National Science Foundation (INSF) are gratefully acknowledged. The authors would like to thank Dr. Amer Jamil (Associate professor, Department of Biochemistry, University of Agriculture, Faisalabad, Pakistan) for his kindest help during this project.

References

  1. Buleandra, M.; Radu, G.L.; Tanase, I. Redox Protein electroanalysis: Metalloproteins. Roum. Biotechnol. Lett 2000, 5, 423–438. [Google Scholar]
  2. Kong, Y.T.; Boopathi, M.; Shim, Y.B. Direct electrochemistry of horseradish peroxidase bonded on a conducting polymer modified glassy carbon electrode. Biosens. Bioelectron 2003, 19, 227–232. [Google Scholar]
  3. Kurzawa, C.; Hengstenberg, A.; Schuhmann, W. Immobilization method for the preparation of biosensors based on pH shift-induced deposition of biomoleculecontaining polymer films. Anal. Chem 2002, 74, 355–361. [Google Scholar]
  4. Chen, H.Y.; Ju, H.X.; Xun, Y. Methylene BIue/PerfIuorosuIfonated ionomer Modified Microcylinder Carbon Fiber Electrode and its Application for the Determination of Hemoglobin. Anal. Chem 1994, 66, 4538–4542. [Google Scholar]
  5. Peng, W.; Liu, X.; Zhang, W.; Li, G. An electrochemical investigation of effect of ATP on hemoglobin. Biophys. Chem 2003, 106, 267–273. [Google Scholar]
  6. Zhang, W.; Zhou, H.; Li, G.; Scheer, H. An electrochemical study of hemoglobin in water–glycerol solution. Biophys. Chem 2004, 111, 229–233. [Google Scholar]
  7. Dayer, M.R.; Moosavi-Movahedi, A.A.; Norouzi, P.; Ghourchian, H.; Safarian, S. Inhibition of Human Hemoglobin Autoxidation by Sodium n-Dodecyl Sulphate. J. Biochem. Mol. Biol. 2002, 35, 364–370. [Google Scholar]
  8. Moosavi-Movahedi, A.A.; Chamani, J.; Ghourchian, H.; Shafiey, H.; Sorenson, C.M.; Sheibani, N. Electrochemical Evidence for the Molten Globule States of Cytochrome c Induced by N-Alkyl Sulfates at Low Concentrations. J. Protein Chem 2003, 22, 23–30. [Google Scholar]
  9. Scheller, F.W.; Bistolas, N.; Liu, S.; Janchen, M.; Katterle, M.; Wollenberger, U. Thirty years of haemoglobin electrochemistry. Advances in Colloid and Interface Science 2005, 116, 111–120. [Google Scholar]
  10. Dolla, A.; Blanchard, L.; Guerlesquin, F.; Bruschi, M. The protein moiety modulates the redox potential in cytochromes c. Biochimie 1994, 76, 471–479. [Google Scholar]
  11. Bento, I.; Schneider, T.R.; Soares, C.M.; Carrondo, M.A. Molecular basis for redox-Bohr and cooperative effects in cytochrome c3 from Desulfovibrio dessulfuricans ATCC 27774: crystallographic and modelling studies of oxidised and reduced high-resolution structures at pH 7.6. Proteins 2004, 54, 135–152. [Google Scholar]
  12. Bento, I.; Teixeira, V.H.; Baptista, A.M.; Soares, C.M.; Matias, P.M.; Carrondo, M.A. Redox-Bohr and other cooperativity effects in the nine heme cytochrome c from Desulfovibrio desulfuricans ATCC 27774: crystallographic and modeling studies. J. Biol. Chem 2003, 278, 36455–36469. [Google Scholar]
  13. Bertrand, P.; Mbarki, O.; Asso, M.; Blanchard, L.; Guerlesquin, F.; Tegoni, M. Control of the redox potential in c-type cytochromes: importance of the entropic contribution. Biochemistry 1955, 34, 11071–11079. [Google Scholar]
  14. Springs, S.L.; Bass, S.E.; Bowman, G.; Nodelman, I.; Schutt, C.E.; McLendon, G.L. A multigeneration analysis of cytochrome b (562) redox variants: evolutionary strategies for modulating redox potential revealed using a library approach. Biochemistry 2002, 41, 4321–4328. [Google Scholar]
  15. Capitanio, N.; Capitanio, G.; Boffoli, D.; Papa, S. Role of cooperative H+/e Linkage (redox Bohr effect) at heme a/CuA and heme a3/CuB in the proton pump of cytochrome c oxidase. Biochemistry 2000, 39, 15454–15461. [Google Scholar]
  16. Shifman, J.M.; Gibney, B.R.; Sharp, R.E.; Dutton, P.L. Heme redox potential control in de novo designed four-alpha-helix bundle proteins. Biochemistry 2000, 39, 14813–14821. [Google Scholar]
  17. Springs, S.L.; Bass, S.E.; McLendon, G.L. Cytochrome b (562) variants: a library for examining redox potential evolution. J. Inorg. Biochem 2001, 86, 73–79. [Google Scholar]
  18. Gibney, B.R.; Dutton, P.L. De novo design and synthesis of heme proteins. Adv. Inorg. Chem 2001, 51, 409–454. [Google Scholar]
  19. Huffman, D.L.; Suslick, K.S. Hydrophobic interactions in metalloporphyrin-peptide complexes. Inorg. Chem 2005, 39, 5418–5419. [Google Scholar]
  20. Rau, H.K.; DeJonge, N.; Haehnel, W. Combinatorial synthesis of four-helix bundle hemoproteins for tuning of cofactor properties. Angew. Chem. Int. Ed. Engl 2000, 39, 250–253. [Google Scholar]
  21. Li, G.; Chen, L.; Zhu, J.; Zhu, D.; Untereker, D.F. Histidine Modified Electrode and Its Application to the Electrochemical Studies of Hemeproteins. Electroanalysis 1999, 11, 139–142. [Google Scholar]
  22. Fan, H.; Wang, S.; Sun, D.; Zhu, G.; Wagner, G.; Li, G. Electron transfer reactivity and enzymatic activity of hemoglobin in a SP sephadex membrane. Anal. Chem 2001, 73, 2850–2854. [Google Scholar]
  23. Arai, K.; Kusu, F.; Noguchi, N.; Takamura, K.; Osawa, H. Selective determination of chloride and bromide ions in serum by cyclic voltammetry. Anal. Biochem 1996, 240, 109–13. [Google Scholar]
  24. Sun, W.; Kong, J.; Deng, J. Electrocatalytic reduction of hemoglobin at a chemically modified electrode containing riboflavin. Electroanal 1997, 9, 115–119. [Google Scholar]
  25. Selman, J.R.; Tobias, C.W. Academic Press: New York, 1978; pp. 211–318.
  26. Sibbald, M.S.; Chumanov, G.; Cotton, T.M. Reduction of cytochrome c by halide-modified, laser-ablated silver colloids. J. Phys. Chem 1996, 100, 4672–4678. [Google Scholar]
  27. Dong, S.; Zhu, Y.; Song, S. Electrode processes of hemoglobin at a platinum electrode covered by Brilliant Cresyl Blue. Bioelectrochem. Bioenerg 1989, 21, 233–243. [Google Scholar]
  28. Kuramitz, H.; Ugawara, K.S.; Kawasaki, M.; Hasebe, K.; Nakamura, H.; Tanaka, S. Electrocatalytic reduction of hemoglobin at a self-assembled monolayer electrode containing redox dye, Nile Blue as an electron-transfer mediator. Anal. Sci 1999, 15, 15589–592. [Google Scholar]

