Communication

Solution Equilibria Formation of Manganese(II) Complexes with Ethylenediamine, 1,3-Propanediamine and 1,4-ButanediaMine in Methanol

by
José J. N. Segoviano-Garfias
*,
Gabriela A. Zanor
and
Fidel Ávila-Ramos
División de Ciencias de la Vida (DICIVA), Universidad de Guanajuato, Campus Irapuato-Salamanca, Ex Hacienda El Copal, Carretera Irapuato-Silao Km. 9, Irapuato 36500, Mexico
*
Author to whom correspondence should be addressed.
Molbank 2022, 2022(2), M1367; https://doi.org/10.3390/M1367
Submission received: 15 April 2022 / Revised: 9 May 2022 / Accepted: 13 May 2022 / Published: 18 May 2022

Abstract

:
Manganese is an abundant element that plays critical roles and is at the reaction center of several enzymes. In order to promote an understanding of the behavior of manganese(II) ion with several aliphatic ligands, in this work, the stability and spectral behavior of the complexes with manganese(II) and ethylenediamine, 1,3-propanediamine or 1,4-butanediamine were explored. A spectrophotometric study of its speciation in methanol was performed at 293 K. The formation constants obtained for these systems were: manganese(II)-ethylenediamine log β110 = 3.98 and log β120 = 7.51; for the manganese(II)-1,3-propanediamine log β110 = 5.08 and log β120 = 8.66; and for manganese(II)-1,4-butanediamine log β110 = 4.36 and log β120 = 8.46. These results were obtained by fitting the experimental spectrophotometric data using the HypSpec software. The complexes reported in this study show a spectral pattern that could be related to a chelate effect in which the molar absorbance is not directly related to the increase in the carbon chain of the ligands.

Graphical Abstract

1. Introduction

Manganese(II) is a highly abundant and stable metal ion [1], which is considered a hard Lewis acid [2]. In nature, manganese plays critical roles in several proteins [1]. It is usually at the reaction center of several enzymes, such as superoxide dismutase, pyruvate carboxylase [3], and at the oxygen-evolving complex (OEC) in the photosynthesis II system [4], which is the catalytic site responsible for the water oxidation reaction to molecular oxygen [5,6,7,8]. Manganese is reported as the unique affordable and sustainable element, capable of catalyzing water splitting in nature systems [9] and is therefore considered an excellent candidate for its use in an artificial photosynthesis system [10]. In order to understand the electronic spectra of manganese complexes and promote an approach to mimic the spectrum of the oxygen-evolving complex [11], in recent years, several manganese complexes have been synthesized as models [12,13,14,15]. Some of these studies involved the use of simple ligands to generate an artificial OEC cluster [16]. Most of the manganese(II) complexes reported the use of a nitrogen-donor aromatic ligand, such as pyrazines or bipyridines [17]; a few studies also used aliphatic diamines as ligands [18,19]. In this work, with the purpose to explore the electronic spectra of manganese(II) complexes and compare them with the electronic spectra of OEC, an equilibrium study is conducted involving the formation constants, speciation and the calculated individual electronic spectrum of the complexes with manganese(II) and diamine ligands: ethylenediamine (en), 1,3-propanediamine (pn) and 1,4-butanediamine (bn) in a methanol solution. Additionally, the distinct effects of increasing the carbon atoms number of these ligands are discussed. To our knowledge, there are no reported studies of the Mn(II) with pn and bn. In contrast, manganese–ethylenediamine systems have been reported previously in various solvent mixtures. Nevertheless, their equilibrium constants have not been reported in pure methanol.

2. Results and Discussion

In order to compare the results obtained in this study to our previous investigations [20,21], in all equilibrium measurements, ionic strength was avoided. This allows the use of a wide concentration range of ligands (either ethylenediamine, 1,3-propanediamine or 1,4-butanediamine). The formation constants obtained should not be considered true stability constants and must only be compared with systems measured under similar conditions.

2.1. Formation Constants of Manganese(II) Systems with Ethylenediamine, 1,3-Propanediamine or 1,4-Butanediamine

The electronic spectra collected for the systems of manganese(II) with ethylenediamine, 1,3-propanediamine and 1,4-butanediamine in methanol are shown in Figure 1, Figure 2 and Figure 3, respectively. For these systems, as the ligand concentration increases, the hyperchromic effect begins to appear in the range of 240 to 260 nm. The formation constants βjkl were obtained by processing the spectra of two experiments at two different concentrations of manganese(II), and each experiment was performed using different ranges of concentrations of ligands (either ethylenediamine, 1,3-propanediamine or 1,4-butanediamine). The values obtained correspond to the equilibria between Mn2+ and each ligand. The method generates a correlation between the spectrum obtained, the concentration of manganese(II), the ligand used and the proposal of the possible colored species.
In these systems, only two colored species and Mn2+ were found. The formation constants were achieved using the following model (where L is en, pn or bn):
Mn2+ + L ⇌ [Mn(L)]2+ log β110
Mn2+ +2L ⇌ [Mn(L)2]2+ log β120
Ethylenediamine, 1,3-propanediamine and 1,4-butanediamine are bidentate ligands [22], which usually generate -mono or -bis complexes [23]. Table 1 indicates the logarithmic values of the formation constants and a summary of the experimental parameters of these systems using the format by Tuck [24]. Therein, it can be observed that the formation constants of manganese(II) complexes with ethylenediamine change from 3.98 to 7.51 for -mono and -bis complexes, respectively. On the other hand, the formation constants of manganese(II) complexes with 1,3-propanediamine change from 5.08 to 8.66 for -mono and -bis complexes, respectively. Finally, for the manganese(II) complexes with 1,4-butanediamine, they change from 4.36 to 8.46 for -mono and -bis complexes, respectively. Although aliphatic diamines have not been extensively explored as nitrogen-donor ligands in manganese(II) complexes, it has been reported that they might show a high conformational flexibility [23] and possibly induce a sigma donation to the metal center [25].
As far as we know, the formation constants for the manganese(II) systems with en, pn or bn in methanol without ionic strength and using a spectrophotometric method have not been reported. Nevertheless, there are a few studies of the manganese(II)-ethylenediamine system in solution using several methods and solvents. Table 2 offers a brief review of these systems. The calorimetric method (ionic strength of 0.05 N and buffer of NH4Cl-NH3) [26] uses glass electrode and a mixture of solvents of water/methanol, dioxane, acetonitrile or dimethylformamide(DMF) (with ionic strength of 0.1 M) [27] and dimethyl sulfoxide (DMSO) as solvent [28]. In order to compare the values of the formation constants obtained in this work with the values reported in Table 2, several differences should be taken into account, such as the method, solvent and experimental conditions. An important factor used in the measurements is the solvent donor number: in methanol (19), dioxane (14.8), acetonitrile (14.1), DMF (26.6) and DMSO (29.8), which represents the nucleophilic ability of solvents to accept or donate electron pairs [29]. It might influence the chelate effect in the complexes [30]. Nevertheless, the formation constant values for the manganese(II)–ethylenediamine system obtained in this work are analogous to some of the studies shown in Table 2. A change of the solvent affects the binding properties of the ligand [31]. However, the equilibrium experiments in methanol have several advantages; the donor numbers of methanol (19) and water (18) are closer, and possibly, their solvation spheres are analogous [29].
The calculated electronic spectrum for manganese(II) complexes with ethylenediamine, 1,3-propanediamine or 1,4-butanediamine are shown in Figure 4, Figure 5 and Figure 6, respectively. The manganese(II) complexes with ethylenediamine, 1,3-propanediamine or 1,4-butanediamine show a molar absorption between 220 to 260 nm, with a strong resemblance between them. In the study of metal complexes, the electronic spectrum can provide important information on the structure or nature of bonds in a complex. Nevertheless, specific signals with intense absorption are not clearly noted by considering this, in order to compare the electronic spectra of the species, 220 nm was selected as an arbitrary wavelength value. The molar extinction coefficients (ε) at 220 nm for the mono-complexes of Mn(II) with en, pn and bn are 10,900 L mol−1 cm−1, 10,300 L mol−1 cm−1 and 9634.3 L mol−1 cm−1, respectively. For the bis-complexes, they are 11,300 L mol−1 cm−1, 11900 L mol−1 cm−1 and 11653 L mol−1 cm−1, respectively. For mono-complexes, the order of molar absorbance in this study is pn ≈ bn > en; for the bis-complexes, it is pn ≈ en > bn. The order of the formation constants for the mono-complexes is pn > en ≈ bn, and for the bis-complexes, it is pn ≈ bn > en. Due to the increase in the carbon chain in each ligand, an increase in the molar absorbance and stability should also be expected. The use of 1,4-butanediamine as a ligand allows us to theorize a decrease in the chelate effect due to its chain length. This behavior was reported before in copper complexes [23]. Considering that only the N-donor atom of each ligand could bond to manganese(II), in consequence, the mono or bis -species might present a decreased charge transfer and stability. On the other hand, while the formation constants are compared to other metals under similar conditions, such as Cu2+, the formation constants of the cupric complex with pn and bn [23] are much larger than those obtained in this study. This difference could be explained considering the proportion charge to the atomic radius. The relative stability of transition metal complexes corresponds to the Irving–Williams series, which indicates the increasing covalent interactions and electrostatic contributions in the metal–ligand bond [32].
Although several electronic transitions might occur in manganese(II) complexes, the absorption bands between 240 and 260 nm might correspond to ligand field transitions or d-d transitions [33]. At the range of 220 to 240 nm for manganese(II) complexes with en, pn or bn, the transition from the σ orbitals to eg orbitals probably occurs [33,34]. It is important to mention that aliphatic ligands analogous to en, pn and bn are of the middle field and are therefore σ donors only, with no orbitals of appropriate symmetry for π bonding. The σ interactions are usually between the dz2 orbital of manganese(II) and p orbital of the ligand [34]. Of the opposite behavior, manganese(II) complexes with aromatic ligands have maximum absorbance to longer wavelengths [35], which are promoted by the intra-ligand absorption π → π* [21,36,37] or n → π* absorptions [21,38,39,40], which are not observed here. In the present study, the complexes show a maximum absorbance between the wavelengths of 240 to 260 nm. However, the spectrum of OEC reported by Lavergne [41] or Van Leeuwen [42] have a maximum absorbance at longer wavelengths (310–320 nm), while the molar absorbance of the OEC is about 6800 L mol−1 cm−1. The manganese(II) bis-complexes used in this study have a maximum absorbance closer to these values. The exploration and analysis of the spectra of manganese complexes using simple ligands can be an aid to understanding the electronic spectrum of OEC [43]. Analyzing the similarities between the complexes reported here with diamine simple ligands and the electronic signals of OEC can be an aid to gradually evolve an electronic model complex and reproduce the electronic spectra of OEC, which might contribute to its understanding.

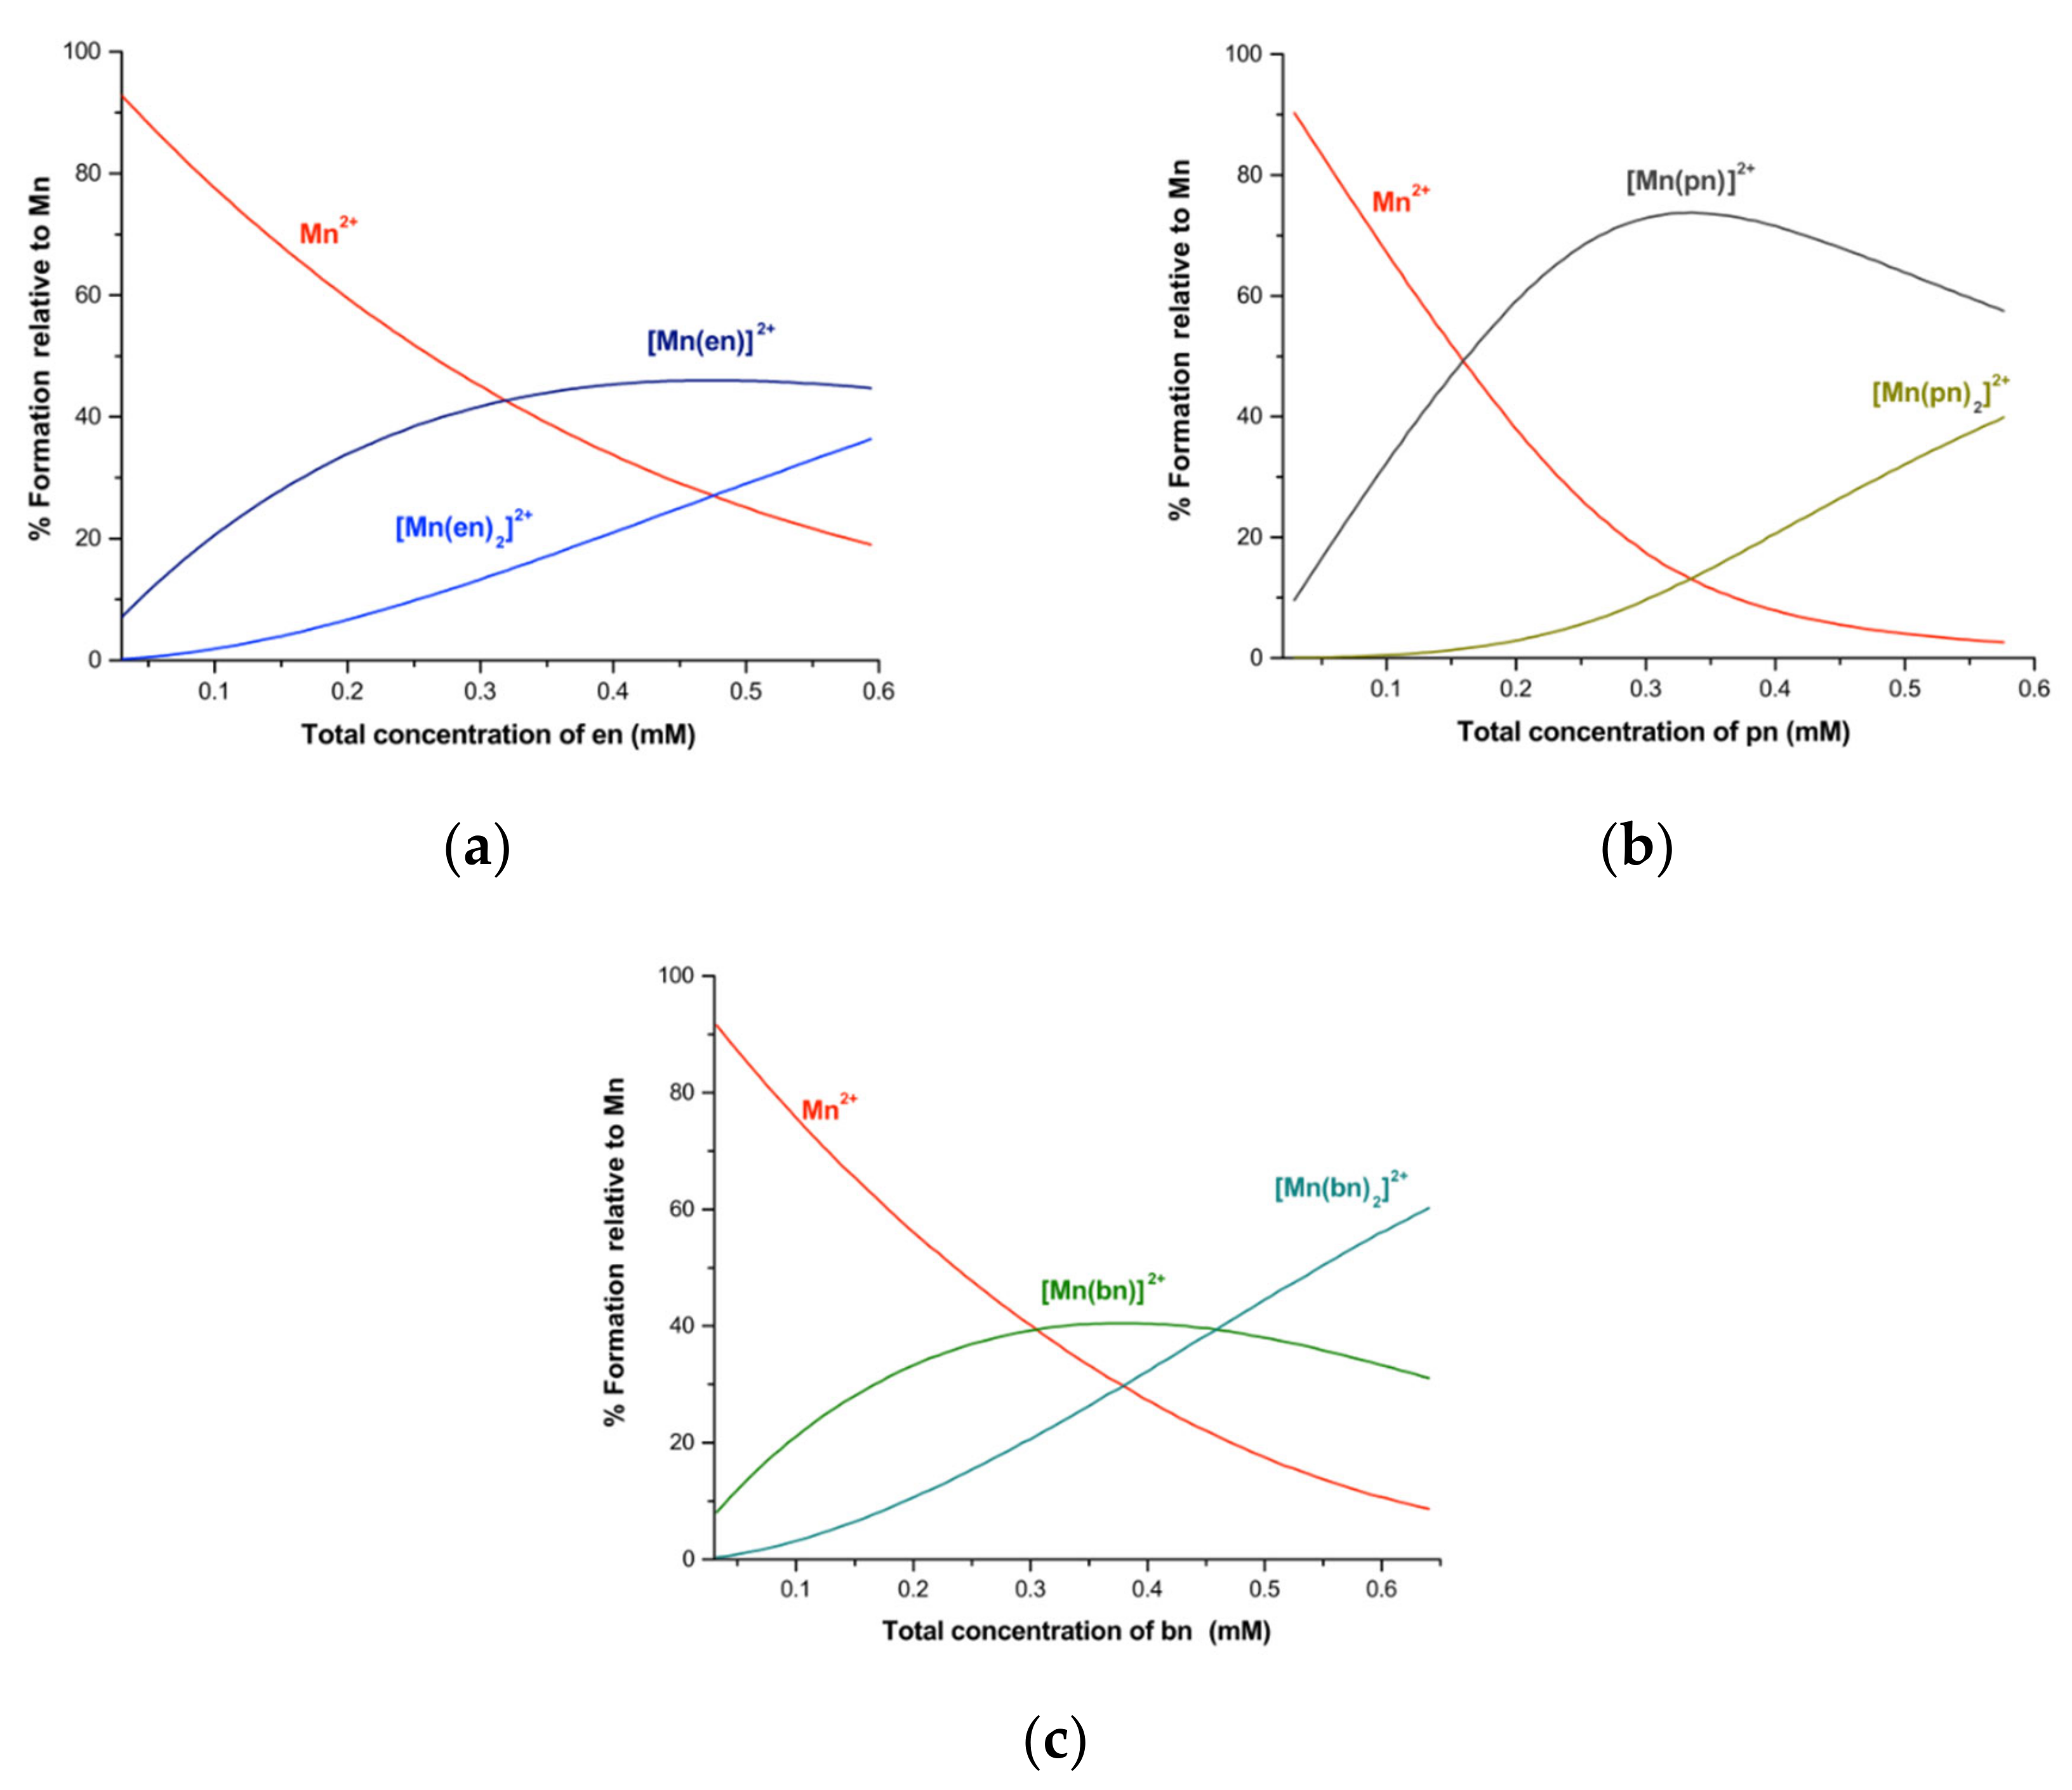
2.2. Distribution Curves of the Manganese(II) with Ethylenediamine, 1,3-Propanediamine or 1,4-Butanediamine Systems

The speciation diagrams for manganese(II) with en, pn and bn solution systems are shown in Figure 7a–c, respectively. A solution with an equimolar concentration of manganese(II) and ethylenediamine yields about 40% of [Mn(en)]2+, 45% of ionic manganese(II) and 15% of the bis complex. Two molar equivalents of ethylenediamine and a molar equivalent of manganese yield about 35% of the bis-complex, 45% of the mono-complex and 20% of ionic manganese(II). A solution with an equimolar concentration of manganese(II) and 1,3-propanediamine yields about 70% of [Mn(pn)]2+, 20% of ionic manganese(II) and 10% of the bis complex. Two molar equivalents of 1,3-propanediamine and a molar equivalent of manganese yield about 40% of the bis-complex and 60% of the mono-complex. Additionally, a solution with an equimolar concentration of manganese(II) and 1,4-butanediamine yields about 40% of [Mn(bn)]2+, 40% of ionic manganese(II) and 20% of the bis complex. Finally, two molar equivalents of 1,4-butanediamine and a molar equivalent of manganese yield about 60% of the bis-complex, 30% of the mono-complex and 10% of ionic manganese(II). There is an increase in the abundance of [Mn(en)]2+ to [Mn(pn)]2+, possibly due to the chelate effect. Nevertheless, there is a decrease in the abundance of [Mn(bn)]2+, possibly due to chain length in which the chelate effect might decrease. An analogous behavior was reported before in the 1,4-butanediamine complexes with Ca2+ [20]. This effect can be comparable considering that Ca2+ and Mn2+ are very similar, since both are hard acids [44].

3. Experimental Section

3.1. Materials, Physical Measurements and Methods

For determination of the formation constants, Methanol HPLC grade (Fermont, Mexico) was used as a solvent; manganese(II) nitrate tetrahydrate Mn(NO3)2·4H2O (Sigma-Aldrich, St. Louis, MO, USA), ethylenediamine (Sigma-Aldrich, St. Louis, MO, USA), 1,3-propanediamine (Sigma-Aldrich, St. Louis, MO, USA) and 1,4-butanediamine (Sigma-Aldrich, St. Louis, MO, USA) were analytical grade and used without further purification. All spectral measurements were recorded using a quartz cell with 1 cm path length and 3 mL volume in a Shimadzu UV-vis-1800 spectroscopy system equipped with a Thermo Scientific thermostat system TPS-1500W, at 293 K. For the determination of formation constants, the analyzed spectral region was from 220 to 320 nm for all the experiments. The spectrophotometric data obtained were fitted with the software HypSpec [45]. To calculate the distribution diagrams of species, the software Hyperquad Simulation and Speciation (HySS2009) [46] was used, using the same methodology reported before [21]. In a typical spectral measurement of the manganese(II)-ligand complexes, stock solutions of manganese(II) and ligand (either ethylenediamine, 1,3-propanediamine or 1,4-butanediamine) were prepared and diluted to obtain a solution behaving according the Lambert–Beer law. The final concentration of the Mn(II) ion was kept as constant; the concentration of the ligand was varied within a range. This process was repeated twice, each experiment being carried out at a different concentration of Mn(II) ion and at two different ranges of ligand concentration.

3.2. Equilibrium Studies of the Manganese(II) with Ethylenediamine, 1,3-Propanediamine and 1,4-Butanediamine

For the manganese(II)–ethylenediamine system, two different stock solutions of ethylenediamine (1.80 or 3.00 mM) and Mn(NO3)2·4H2O (1.60 and 3.00 mM) were prepared. In each experiment, the final concentration of manganese(II) remained constant at 0.160 and 0.300 mM, where the ethylenediamine concentrations were varied from 0.054 to 0.344 mM and 0.120 to 0.570 mM, respectively. A total of 33 spectra were used for the refinement. For the manganese–1,3-propanediamine system, stock solutions of 1,3-propanediamine (1.44 and 2.88 mM) and Mn(NO3)2·4H2O (1.44 and 2.88 mM) were prepared. In each experiment, the final manganese(II) concentration remained constant at 0.144 and 0.288 mM; the 1,3-propanediamine concentrations were varied from 0.014 to 0.273 mM and from 0.028 to 0.547 mM, respectively. A total of 37 spectra were used for the refinement. For the manganese–1,4-butanediamine system, stock solutions of 1,4-butanediamine (1.60 and 3.20 mM) and Mn(NO3)2·4H2O (1.60 and 3.20 mM) were prepared. In each experiment, the final manganese(II) concentration was set constant at 0.16 and 0.32 mM; the 1,4-butanediamine concentrations were varied from 0.016 to 0.272 mM and from 0.032 to 0.512 mM, respectively. A total of 33 spectra were used for refinement.

4. Conclusions

The manganese complexes reported in this study show a spectral pattern that could be related to the chelate effect in which the molar absorbance is not directly related to the increase in the carbon chain of the ligand. The chelate effect may possibly decrease if the 1,4-butanediamine is used as ligand in the manganese complex. The mono- and bis- complexes with manganese(II) and ethylenediamine and 1,3-propanediamine might have a similar geometry. In order to understand this behavior and determine the true geometry of the complexes, a crystallographic study should be conducted. Testing several ligands will allow us to understand some spectral properties of the manganese complexes and possibly propose a ligand to promote an accurate model complex and mimic the electronic spectra of the oxygen-evolving complex at photosynthesis II.

Author Contributions

Conceptualization, J.J.N.S.-G. and G.A.Z.; methodology, F.Á.-R.; formal analysis, G.A.Z.; investigation, J.J.N.S.-G.; writing—original draft preparation, J.J.N.S.-G.; writing—review and editing, G.A.Z.; supervision, F.Á.-R. All authors have read and agreed to the published version of the manuscript.

Funding

This research was funded by IDEA-GTO: Innovación, Desarrollo, Emprendimiento, Aceleración, grant number IJ-19-4.

Institutional Review Board Statement

Not applicable.

Informed Consent Statement

Not applicable.

Data Availability Statement

Not applicable.

Conflicts of Interest

The authors declare no conflict of interest. The funders had no role in the design of the study, interpretation of data, in the writing of the manuscript, or in the decision to publish the results.

References

  1. Salomon, E.; Keren, N.; Kanteev, M.; Adir, N. Manganese in Biological Systems: Transport and Function in PATAI’S Chemistry of Functional Groups. Chem. Organomanganese Compd. 2011, 1–16. [Google Scholar] [CrossRef]
  2. Pfxoraro, V.L. Structural proposals for the manganese centers of the oxygen evolving complex: An inorganic chemists perspective. Photochem. Photobiol. 1988, 48, 249–264. [Google Scholar] [CrossRef] [Green Version]
  3. Bertini, I. Bioinorganic Chemistry; University Science Books: Mill Valley, CA, USA, 1994. [Google Scholar]
  4. Joliot, P.; Barbieri, G.; Chabaud, R. Un nouveau modele des centers photochimiques du systeme II. Photochem. Photobiol. 1969, 10, 309–329. [Google Scholar] [CrossRef]
  5. McConnell, I.; Li, G.; Brudvig, G.W. Energy Conversion in Natural and Artificial Photosynthesis. Chem. Biol. 2010, 17, 434–447. [Google Scholar] [CrossRef] [PubMed] [Green Version]
  6. Stochel, G.; Stasicka, Z.; Brindell, M.; Macyk, W.; Szacilowski, K. Bioinorganic Photochemistry; Wiley: West Sussex, UK, 2009. [Google Scholar]
  7. Nelson, N.; Ben-Shem, A. The complex architecture of oxygenic photosynthesis. Nat. Rev. Mol. Cell Biol. 2004, 5, 971–982. [Google Scholar] [CrossRef] [PubMed]
  8. Huang, P.; Högblom, J.; Anderlund, M.F.; Sun, L.; Magnuson, A.; Styring, S. Light-induced multistep oxidation of dinuclear manganese complexes for artificial photosynthesis. J. Inorg. Biochem. 2004, 98, 733–745. [Google Scholar] [CrossRef] [PubMed]
  9. Dasgupta, J.; Ananyev, G.M.; Dismukes, G.C. Photoassembly of the Water-Oxidizing Complex in Photosystem II. Coord. Chem. Rev. 2008, 252, 347–360. [Google Scholar] [CrossRef] [PubMed] [Green Version]
  10. Armstrong, F.A. Why did Nature choose manganese to make oxygen? Philos. Trans. R. Soc. Lond. B Biol. Sci. 2008, 363, 1263–1270. [Google Scholar] [CrossRef] [Green Version]
  11. Alstrum-Acevedo, J.H.; Brennaman, M.K.; Meyer, T.J. Chemical Approaches to Artificial Photosynthesis. 2. Inorg. Chem. 2005, 44, 6802–6827. [Google Scholar] [CrossRef] [Green Version]
  12. Han, G.; Li, J.; Chen, G.; Ling, L.; Li, S.; Khorobrykh, A.A.; Zharmukhamedov, S.K.; Klimov, V.V.; Kuang, T. Reconstruction of the water-oxidizing complex in manganese-depleted Photosystem II using synthetic manganese complexes. J. Photochem. Photobiol. B Biol. 2005, 81, 114–120. [Google Scholar] [CrossRef]
  13. Poulsen, A.K.; Rompel, A.; McKenzie, C.J. Water Oxidation Catalyzed by a Dinuclear Mn Complex: A Functional Model for the Oxygen-Evolving Center of Photosystem II. Angew. Chem. Int. Ed. 2005, 44, 6916–6920. [Google Scholar] [CrossRef]
  14. Magnuson, A.; Liebisch, P.; Högblom, J.; Anderlund, M.; Lomoth, R.; Meyer-Klaucke, W.; Haumann, M.; Dau, H. Bridging-type changes facilitate successive oxidation steps at about 1 V in two binuclear manganese complexes—Implications for photosynthetic water-oxidation. J. Inorg. Biochem. 2006, 100, 1234–1243. [Google Scholar] [CrossRef]
  15. Cady, C.W.; Crabtree, R.H.; Brudvig, G.W. Functional Models for the Oxygen-Evolving Complex of Photosystem II. Coord. Chem. Rev. 2008, 252, 444–455. [Google Scholar] [CrossRef] [Green Version]
  16. Zhang, C.; Chen, C.; Dong, H.; Shen, J.-R.; Dau, H.; Zhao, J. A synthetic Mn4Ca-cluster mimicking the oxygen-evolving center of photosynthesis. Science 2015, 348, 690–693. [Google Scholar] [CrossRef]
  17. Collomb, M.-N.; Deronzier, A. Manganese: Inorganic & Coordination Chemistry. In Encyclopedia of Inorganic Chemistry; John Wiley & Sons, Ltd.: West Sussex, UK, 2006. [Google Scholar]
  18. Pal, S.; Pal, S. Syntheses, structures and properties of trans-dichlororuthenium(II) complexes with N4-donor Schiff bases. Polyhedron 2003, 22, 867–873. [Google Scholar] [CrossRef]
  19. Kirk, A.D.; Ibrahim, A.M. Wavelength dependence of unquenchable photoaquation in the tris(1,3-diaminopropane)chromium(III) ion. Inorg. Chem. 1990, 29, 4848–4850. [Google Scholar] [CrossRef]
  20. González, J.G.; Nájera-Lara, M.; López-Ramírez, V.; Ramírez-Vázquez, J.A.; Segoviano-Garfias, J.J. Spectrophotometric determination of the formation constants of Calcium(II) complexes with 1,2-ethylenediamine, 1,3-propanediamine and 1,4-butanediamine in acetonitrile. Green Energy Environ. 2017, 2, 51–57. [Google Scholar] [CrossRef]
  21. Segoviano-Garfias, J.J.N.; Zanor, G.A.; Ávila-Ramos, F.; Bivián-Castro, E.Y. Stability of Manganese(II)-Pyrazine, -Quinoxaline or -Phenazine Complexes and Their Potential as Carbonate Sequestration Agents. Molecules 2022, 27, 1648. [Google Scholar] [CrossRef]
  22. Douglas, B.E.; Alexander, J.J. Conceptos y Modelos de Química Inorgánica; Reverté: Barcelona, Spain, 1994. [Google Scholar]
  23. Segoviano-Garfias, J.J.N.; Mendoza-Díaz, G.; Moreno-Esparza, R. Spectrophotometric determination of the formation constants of the cupric halogen complexes with 1,3-propanediamine and 1,4-butanediamine in methanol solution and their activity on the oxidative coupling of the 2,6-di-tert-butylphenol. Inorg. Chim. Acta 2013, 400, 184–190. [Google Scholar] [CrossRef]
  24. Tuck, D.G. A proposal for the use of a standard format for the publication of stability constant measurements. Pure Appl. Chem. 1989, 61, 1161. [Google Scholar] [CrossRef]
  25. Van Eldik, R.; Reedijk, J. Advances in Inorganic Chemistry: Homogeneous Biomimetic Oxidation Catalysis; Elsevier Science: Amsterdam, The Netherlands, 2006. [Google Scholar]
  26. Oms, M.; Forteza, R.; Cerdá, V.; Borrull, F. Thermometric study of metal-nitrogenated-ligand complexes. i. ethylenediamine complexes with Ag(I), Cu(II), Zn(II), Ni(II), Mn(II), Cd(II) and Co(II). Thermochim. Acta 1989, 138, 1–12. [Google Scholar] [CrossRef]
  27. Mui, K.-K.; McBryde, W.A.E.; Nieboer, E. The Stability of Some Metal Complexes in Mixed Solvents. Can. J. Chem. 1974, 52, 1821–1833. [Google Scholar] [CrossRef]
  28. Pool, K.H.; Sandberg, D.E. Potentiometric determination of successive stability constants of ethylenediamine complexes of several metals in dimethylsulphoxide. Talanta 1969, 16, 1319–1323. [Google Scholar] [CrossRef]
  29. Marcus, Y. The effectivity of solvents as electron pair donors. J. Solut. Chem. 1984, 13, 599–624. [Google Scholar] [CrossRef]
  30. Mayer, U. Solvent effects on ion-pair equilibria. Coord. Chem. Rev. 1976, 21, 159–179. [Google Scholar] [CrossRef]
  31. Fan, J.; Shen, X.; Wang, J. Determination of Stability Constants of Copper(II)-Glycine Complex in Mixed Solvents by Copper(II)-Selective Electrode. Electroanalysis 2001, 13, 1115–1118. [Google Scholar] [CrossRef]
  32. Gorelsky, S.I.; Basumallick, L.; Vura-Weis, J.; Sarangi, R.; Hodgson, K.O.; Hedman, B.; Fujisawa, K.; Solomon, E.I. Spectroscopic and DFT Investigation of [M{HB(3,5-(i)Pr(2)pz)(3)}(SC(6)F(5))] (M = Mn, Fe, Co, Ni, Cu, and Zn) Model Complexes: Periodic Trends in Metal-thiolate Bonding. Inorg. Chem. 2005, 44, 4947–4960. [Google Scholar] [CrossRef] [Green Version]
  33. Arifin, K.; Majlan, E.H.; Daud, W.R.W.; Kassim, M.B. Bimetallic complexes in artificial photosynthesis for hydrogen production: A review. Int. J. Hydrogen Energy 2011, 37, 3066–3087. [Google Scholar] [CrossRef]
  34. Miessler, G.L.; Tarr, D.A. Inorganic Chemistry; Pearson Prentice Hall: Upper Saddle River, NJ, USA, 2004. [Google Scholar]
  35. Pérez-Arredondo, M.d.; González-Ponce, M.d.; Zanor, G.A.; Vazquez, J.A.R.; Segoviano-Garfias, J.J.N. Complex formation equilibria of 2,2′-bipyridyl and 1,10-phenanthroline with manganese(II) in methanol. Karbala Int. J. Mod. Sci. 2015, 1, 178–186. [Google Scholar] [CrossRef] [Green Version]
  36. Melník, M.; Chemikovna, S.S. New Trends in Coordination, Bioinorganic and Applied Inorganic Chemistry: XXIII. In Proceedings of the International Conference on Coordination and Bioinorganic Chemistry, Smolenice, Slovakia, 5–10 June 2011; Book of Abstracts, Program; Slovak University of Technology Press: Bratislava, Slovakia, 2011. [Google Scholar]
  37. Rocha, J.C.D.; Poneti, G.; Ferreira, J.G.; Ribeiro, R.R.; Nunes, F.S. Spectroscopic, Electrochemical, Magnetic and Structural Investigations of Dimanganese-(II/II) and Mixed-Valence-(II/III)-Tetraiminodiphenolate Complexes. J. Braz. Chem. Soc. 2014, 25, 1528–1535. [Google Scholar] [CrossRef]
  38. Halverson, F.; Hirt, R.C. Near Ultraviolet Solution Spectra of the Diazines. J. Chem. Phys. 1951, 19, 711–718. [Google Scholar] [CrossRef]
  39. Hirt, R.C. and R.G. Schmitt, Observed n − π* Bands in the Ultraviolet Absorption Solution Spectra of Amino Asymmetric Triazines. J. Chem. Phys. 1955, 23, 600. [Google Scholar] [CrossRef]
  40. Ito, M.; Shimada, R.; Kuraishi, T.; Mizushima, W. Ultraviolet Absorption of Pyrazine Vapor Due to n − π Transition. J. Chem. Phys. 1957, 26, 1508–1515. [Google Scholar] [CrossRef]
  41. Lavergne, J. Improved UV-visible spectra of the S-transitions in the photosynthetic oxygen-evolving system. Biochim. Biophys. Acta (BBA) Bioenerg. 1991, 1060, 175–188. [Google Scholar] [CrossRef]
  42. Van Leeuwen, P.; Heimann, C.; van Gorkom, H. Absorbance difference spectra of the S-state transitions in Photosystem II core particles. Photosynth. Res. 1993, 38, 323–330. [Google Scholar] [CrossRef]
  43. Elizarova, G.L.; Zhidomirov, G.M.; Parmon, V.N. Hydroxides of transition metals as artificial catalysts for oxidation of water to dioxygen. Catal. Today 2000, 58, 71–88. [Google Scholar] [CrossRef]
  44. Pearson, R.G. Hard and soft acids and bases, HSAB, part 1: Fundamental principles. J. Chem. Educ. 1968, 45, 581. [Google Scholar] [CrossRef]
  45. Gans, P.; Sabatini, A.; Vacca, A. Hypspec 2008 Software; Protonic Software: Leeds, UK; Florence, Italy, 2008. [Google Scholar]
  46. Alderighi, L.; Gans, P.; Ienco, A.; Peters, D.; Sabatini, A.; Vacca, A. Hyperquad simulation and speciation (HySS): A utility program for the investigation of equilibria involving soluble and partially soluble species. Coord. Chem. Rev. 1999, 184, 311–318. [Google Scholar] [CrossRef]
Figure 1. Absorption spectra of manganese(II)–ethylenediamine system in methanol solution. For spectra 1 to 17, [Mn(II)] = 0.16 mM and ethylenediamine concentration (mM): (1) 0.054; (2) 0.072; (3) 0.09; (4) 0.108; (5) 0.126; (6) 0.144; (7) 0.16; (8) 0.18; (9) 0.198; (10) 0.216; (11) 0.234; (12) 0.252; (13) 0.27; (14) 0.288; (15) 0.306; (16) 0.324; (17) 0.342. For spectra 18 to 37, [Mn(II)] = 0.3 mM and ethylenediamine concentration (mM): (18) 0.03; (19) 0.06; (20) 0.09; (21) 0.12; (22) 0.15; (23) 0.18; (24) 0.21; (25) 0.24; (26) 0.27; (27) 0.3; (28) 0.33; (29) 0.36; (30) 0.39; (31) 0.42; (32) 0.45; (33) 0.48; (34) 0.51; (35) 0.54; (36) 0.57; (37) 0.60.
Molbank 2022 m1367 g001
Figure 2. Absorption spectra of manganese(II)-1,3-diaminopropane complexes in methanol solution. For spectra 1 to 20, [Mn(II)] = 0.144 mM and 1,3-diaminopropane concentration (mM): (1) 0.0144; (2) 0.0288; (3) 0.0432; (4) 0.0576; (5) 0.072; (6) 0.0864; (7) 0.1008; (8) 0.1152; (9) 0.1296; (10) 0.144; (11) 0.1584; (12) 0.1728; (13) 0.1872; (14) 0.2016; (15) 0.216; (16) 0.2304; (17) 0.2448; (18) 0.2592; (19) 0.2736; (20) 0.288. For spectra 20 to 40, [Mn(II)] = 0.288 mM and 1,3-propanediamine concentration from (mM): (21) 0.0288; (22) 0.0576; (23) 0.0864; (24) 0.1152; (25) 0.144; (26) 0.1728; (27) 0.2016; (28) 0.2304; (29) 0.2592; (30) 0.288; (31) 0.3168; (32) 0.3456; (33) 0.3744; (34) 0.4032; (35) 0.432; (36) 0.4608; (37) 0.4896; (38) 0.5184; (39) 0.5472; (40) 0.576.
Molbank 2022 m1367 g002
Figure 3. Absorption spectra of manganese(II)-1,4-diaminobutane complexes in methanol solution. For spectral 1 to 20, [Mn(II)] = 0.16mM and 1,4-diaminobutane concentration (mM): (1) 0.016; (2) 0.032; (3) 0.048; (4) 0.064; (5) 0.08; (6) 0.096; (7) 0.112; (8) 0.128; (9) 0.144; (10) 0.16; (11) 0.176; (12) 0.192; (13) 0.208; (14) 0.224; (15) 0.24; (16) 0.256; (17) 0.272; (18) 0.288; (19) 0.304; (20) 0.32. For spectra 21 to 38, [Mn(II)] = 0.32 mM and 1,4-butanediamine from (mM): (21) 0.032;(22) 0.064;(23) 0.096;(24) 0.128;(25) 0.16;(26) 0.192;(27) 0.224;(28) 0.256;(29) 0.288;(30) 0.32;(31) 0.352;(32) 0.384; (33) 0.416;(34) 0.448;(35) 0.48;(36) 0.512;(37) 0.544;(38) 0.576.
Molbank 2022 m1367 g003
Figure 4. Calculated electronic spectrum of the manganese(II)–ethylenediamine species in methanol: (1) Mn2+; (2) [Mn(en)]2+; (3) [Mn(en)2]2+.
Molbank 2022 m1367 g004
Figure 5. Calculated electronic spectrum of the Manganese(II)–1,3-propanediamine species in methanol: (1) Mn2+; (4) [Mn(pn)]2+; (5) [Mn(pn)2]2+.
Molbank 2022 m1367 g005
Figure 6. Calculated electronic spectrum of the manganese(II)–1,4-butanediamine species in methanol: (1) Mn2+; (6) [Mn(bn)]2+; (7) [Mn(bn)2]2+.
Molbank 2022 m1367 g006
Figure 7. (a) Formation curves of the manganese(II)-ethylenediamine system in methanol. [Mn]2+ = 0.3 mM and ethylenediamine range from 0.03 to 0.6 mM. (b) Formation curves of the manganese(II)-1,3-propanediamine system in methanol. [Mn]2+ = 0.288 mM and 1,3-propanediamine range from 0.0288 to 0.576 mM. (c) Formation curves of the manganese(II)-1,4-butanediamine system in methanol. [Mn]2+ = 0.16 mM y 1,4-butanediamine range from 0.032 to 0.64 mM.
Molbank 2022 m1367 g007
Table 1. Summary of experimental parameters for systems with manganese(II) and ethylenediamine, 1,3-propanediamine or 1,4-butanediamine, in methanol.
Solution composition[TL] range from 0.054 to 0.342 and 0.030 to 0.600 mM
[TM] constant at 0.16 and 0.3 mM
Ionic strength, electrolyteNot used
pH range Not used
Experimental methodSpectrophotometric titration
Temperature20 °C
Total number of data points Mn complexation: 37 solution spectra
Method of calculationHypSpec
SpeciesEquilibriumLog βσ
[Mn(en)]2+
[Mn(en)2]2+
Mn2++ en ⇄ [Mn(en)]2+
Mn2++2 en ⇄ [Mn(en)2]2+
log β110 = 3.98 ± 0.029
log β120 = 7.51 ± 0.021
0.003
Solution composition[TL] range from 0.014 to 0.288 and 0.028 to 0.576 mM
[TM] constant at 0.144 and 0.288 mM
Ionic strength, electrolyteNot used
pH rangeNot used
Experimental methodSpectrophotometric titration
Temperature20 °C
Total number of data pointsMn complexation: 40 solution spectra
Method of calculationHypSpec
SpeciesEquilibriumLog βσ
[Mn(pn)]2+
[Mn(pn)2]2+
Mn2+ + pn⇄ [Mn(pn)]2+
Mn2++2 pn⇄ [Mn(pn)2]2+
log β110 = 5.08 ± 0.033
log β120 = 8.66 ± 0.023
0.004
Solution composition[TL] range from 0.016 to 0.320 and 0.032 to 0.576 mM
[TM] constant at 0.160 and 0.320 mM
Ionic strength, electrolyteNot used
pH rangeNot used
Experimental methodSpectrophotometric titration
Temperature20 °C
Total number of data pointsMn complexation: 38 solution spectra
Method of calculationHypSpec
SpeciesEquilibriumLog βσ
[Mn(bn)]2+
[Mn(bn)2]2+
Mn2+ + bn⇄ [Mn(bn)]2+
Mn2++2 bn⇄ [Mn(bn)2]2+
log β110 = 4.36 ± 0.044
log β120 = 8.46 ± 0.020
0.007
Table 2. Stability constants of the complexes of manganese(II) with ethylenediamine under several conditions.
MethodSolventIonic StrengthT(K)Logβ110Logβ120Logβ130Ref.
Cal.Buffer NH4Cl-NH30.0510 N AgNO3-2.764.875.76[26]
Glass ElectrodeMethanol/Water (%)00.1 M KNO3 2982.854.75-[28]
553.035.11-
603.075.17-
653.115.26-
703.155.33-
753.235.51-
803.265.57-
Dioxane/Water (%)00.1 M NaClO42982.794.69-
202.934.94-
403.165.36-
503.335.73-
603.576.18-
703.906.858.55
754.067.198.99
804.277.569.66
Acetonitrile/Water (%)200.1 M of KNO32982.98--
403.295.59-
503.445.94-
603.656.35-
703.906.80-
754.107.20-
804.408.20-
DMF */Water200.1 M of KNO32982.98--
403.145.40-
503.265.607.00
603.405.877.45
703.596.257.83
753.716.478.28
803.956.849.01
DMSO *0.1 M of KClO4253.76.910.1
* Cal. = calorimetry; DMF = N,N-dimethylformamide; DMSO = dimethyl sulfoxide.
Publisher’s Note: MDPI stays neutral with regard to jurisdictional claims in published maps and institutional affiliations.

