Review

Methods to Estimate the Diversity in the Marine Photosynthetic Protist Community with Illustrations from Case Studies: A Review

by
Linda K. Medlin
1,2,* and
Wiebe H.C. F. Kooistra
3
1
UPMC Univ Paris 06, UMR 7621, LOMIC, Observatoire Océanologique, F-66651, Banyuls/mer, France
2
CNRS, UMR 7621, LOMIC, Observatoire Océanologique, F-66651 Banyuls/mer, France
3
Ecology and Evolution of Plankton, Stazione Zoologica Anton Dohrn, Villa Comunale, 80121 Naples, Italy
*
Author to whom correspondence should be addressed.
Diversity 2010, 2(7), 973-1014; https://doi.org/10.3390/d2070973
Submission received: 23 June 2010 / Revised: 9 July 2010 / Accepted: 10 July 2010 / Published: 16 July 2010
(This article belongs to the Special Issue Biological Diversity Assessed by Molecular Methods)

Abstract

:
We review the application of molecular methods to estimate biodiversity in the marine environment. All of the methods reviewed here, which are at the forefront of molecular research, can be applied to all organisms in all habitats, but the case studies used to illustrate the points are derived from marine photosynthetic eukaryotic protists. It has been accepted that we know less than 10% of the identified diversity in the marine microbial world and the marine micro- and pico-eukaryotes are no exception. Even the species that we think we can easily recognize are often poorly described, and even less is known of their life histories and spatial and temporal trends in their abundance and distribution. With new molecular and analytical techniques, we can advance our knowledge of marine biodiversity at the species level to understand how marine biodiversity supports ecosystem structure, dynamics and resilience. Biogeochemical reactions performed by marine photosynthetic microbial organisms constitute a major sustaining component of ecosystem functioning, and therefore, affect climate changes. New interpretations of how environmental, ecological and evolutionary processes control and structure marine ecosystem biodiversity can be made so that we can augment our understanding of biodiversity and ecosystem dynamics in especially the pico- and nano-fractions of the plankton as well as in the deep sea benthos, both of which are very difficult to study without good analytical methods.

1. Introduction

Understanding and preserving biodiversity has been one of the most important global challenges for the past 20 years, and will continue to be an important scientific issue during the next decades. There is a science plan for Europe to address the problems associated with a potential loss of biodiversity in the marine environment, which was formulated in 1999 by the Association of Marine Science Institutes (AMSI). A synopsis of the executive summary formulated for European research on marine biodiversity reflecting the joint opinions of scientists from AMSI is presented in the following paragraph.
The global environment is experiencing rapid and accelerating changes, largely originating from human activity, whether they come from local requirements or from the more dispersed effects of global climate change. Because biodiversity is strongly modified by these changes, there is now widespread realization that scientists must generate plans to conserve and protect biodiversity in many parts of the world that were heretofore subject to rampant scavenging for natural resources. How biodiversity is perceived and preserved right now will affect future biodiversity and ecosystem functioning and thus the continued use of the goods and services that ecosystems provide to humans. Knowing and recognizing biodiversity at all levels is an essential strategy for preserving it. Basic differences occur between terrestrial and marine ecosystems and the management of their biodiversity requires very different approaches. Marine scientists have extrapolated from terrestrial ecosystem generalizations concerning biodiversity patterns on both global and regional scales, the mechanisms that determine these patterns, and the consequences of biodiversity loss. Many of these extrapolations are not applicable to the marine environment, primarily because of the level of disturbances in the marine environment. Our understanding of marine biodiversity lags far behind that of terrestrial biodiversity, to such an extent that we do not have sufficient scientific information to design management plans, such as conservation and the sustainable use of coastal resources. Fundamental differences between marine and terrestrial biodiversity include the following points. The physical environment in the oceans is three-dimensional, whereas on land it is essentially two-dimensional. The vast majority of the biomass of marine primary producers is composed of minute and usually mobile microorganisms, with representatives from most of the eukaryotic crown lineages (sessile macroalgae are only minor players), whereas on land, macroscopic and sessile green plants carry out the bulk of the primary production. Climax communities never develop in the ocean, in the way they are believed to have developed on land. The bulk of primary production is consumed on a daily basis in the ocean, whereas on land, primary production is often stored in non-photosynthetic support tissues and if not, enters the detrital ecosystem at the end of the growing season. Higher-level carnivores often play key roles in structuring marine biodiversity and when exploited heavily, as in over-fishing, there are severe downward-cascading effects on biodiversity and on ecosystem functions. This no longer applies to terrestrial systems because man has dominated over the other higher level carnivores/herbivores, such that they no longer have major effects on structuring biodiversity, except in some isolated examples, i.e., elephants in local parts of Africa and India. Marine systems are more open than terrestrial, and dispersal of species occurs over much larger ranges than on land. Life originated in the sea and thus has a much longer evolutionary history in the sea than on land [1]. As a consequence, the diversity at higher taxonomic levels is much higher in the sea. For instance, there are 14 indigenous marine animal phyla, whereas only one phylum is unique to land. Four new algal classes/phyla have been described in the last twenty years [2,3,4,5]. New classes await formal descriptions [6]. The sum total of genetic resources in the sea is therefore inferred to be much more diverse in the sea than on land [1]. Also on average, genetic diversity within a species (i.e., below the species level) is higher in marine than in terrestrial species [7].
Biodiversity has been identified to have hierarchical levels: genetic diversity, species diversity, and ecosystem diversity. Each level has its own spatial scales ranging from single samples to regional and global ones, with temporal scales changing from short (days to weeks) to long (years to decades) time intervals. Each scale can be affected by loss but the consequences of loss or change at any of these scales is rarely calculated and the knock-on effect of loss at one scale to biodiversity at the next scale is unknown. Extrapolation from one level to another can lead to unrealistic and unsupported results. Biodiversity of the sea is more widely exploited than that on land because of the commercialization of species as food stocks from the marine environment, whereas fewer species are utilized on land. The reason for this is that large tracks of land are not longer used for “hunting and gathering”, but have been cleared altogether of their natural biodiversity and are now utilized for agriculture of just a few species, whereas exploitation of the marine biodiversity is still basically “hunting and gathering” and mariculture is still in its infancy. Exploitation of marine biodiversity is also far less regulated than that on land and “hunting and gathering” technology is becoming so advanced that many marine species are now driven to extinction.
Marine organisms play pivotal roles in many biogeochemical processes that sustain the biosphere, and provide a variety of goods and services that are essential to mankind’s existence, including food production, assimilation of waste and regulation of the global climate. Conservation efforts affect only marine reserves and specially protected areas and the species they contain, which cover at best only a small part of the world’s marine environment. Thus, adequate functioning of marine systems depends in turn on biodiversity and that fact dictates the need for a broader strategy in the management of biodiversity than conservation alone can accomplish. Any biodiversity project must begin with characterization of the biodiversity as fully as possible (from genetic to ecosystem level) in selected key (flagstone) habitats across broad geographical ranges. Compiling comprehensive inventories at a few sites should do this and less comprehensive surveys at a larger number of sites, using standardized methods and protocols. An important example of a project that addresses these requirements is the Census of Marine Life (http://www.coml.org/), a global network of researchers from over 70 countries that tries to answer the questions “What lived in the oceans?” “What lives in the oceans?” and “What will live in the oceans?” Molecular methods are indispensable tools in answering those questions.
The world’s oceans cover 70% of the Earth’s surface, and their dominant populations—both numerically and biomass-wise—belong to microscopic protists and prokaryotes. The marine phytoplankton are major components of both these groups and are, by definition, high dispersal taxa with large population sizes. Small photosynthetic organisms are responsible for the bulk of primary production in oceanic and neretic waters. Net samples and bulk process measurements, such as chlorophyll a and 14C biomass production estimates, have historically provided most of our knowledge about marine phytoplankton. However, whole water samplers and new analytical methods, e.g., flow cytometry, epifluorescence microscopy and HPLC (high pressure liquid chromatography) have found previously unrecognized groups (Prochlorococcus), size classes (the picoplankton <3 µm) and hidden biodiversity (new algal classes, e.g., Bolidophyceae, Pelagophyceae, picobiliphytes). In fact, up to 90% of the photosynthetic carbon in certain areas can come from the picoplankton. It is only in the last 30 years that the importance of the picoeukaryotes and the cyanobacteria taxa Prochlorococcus and Synechococcus in the open ocean oligotrophic ecosystems has been revealed [8,9,10]. Within the picoplanktonic size fraction, the photosynthetic eukaryotes are far more diverse taxonomically than the photosynthetic prokaryote component [see review in 11].
Because of these recent discoveries about phytoplankton biodiversity, we can question the accuracy of our knowledge about the genetic diversity of marine phytoplankton. In picoeukaryotes, where there are too few morphological markers explored upon which to determine species identification, α-level taxonomy is lacking. In addition, we know virtually nothing about the population structure of the phytoplankton. It is likely to be very different from that on land because marine planktonic organisms live in an ever-changing three-dimensional environment. Some taxa may have little genetic structure over very large geographic areas, whereas many others have highly fragmented populations. Further, recent evidence suggests that speciation and dispersal mechanisms in marine planktonic organisms may be very different from those on land [12]. Thus, it is unlikely that generalizations about terrestrial plant diversity and population structure can be extrapolated to marine ecosystems.
The advent of molecular biological techniques has greatly enhanced our ability to analyze all populations, not just the protists. Their small size and paucity of morphological markers, the inability to bring many into culture, and the difficulty of obtaining samples for long term seasonal studies in open ocean environments has hampered our knowledge of phytoplankton diversity and population structure. The idea of a single globally distributed species or of temporal stasis is no longer believed. Temporal genetic change may often be greater than spatial change or change between species [13,14,15,16] and may very well apply to bloom populations. The rate of genetic change can and does occur on ecological time scales (within a few generations) [12,17]. Why? We don’t know, but such changes may play a role in determining how local adaptations and speciation can occur in apparently homogeneous populations within a short period of time. Now molecular techniques can present a quantitative framework through which the diversity, structure and evolution of marine phytoplankton populations can be analysed, predictive models of the dynamics of ocean ecosystems formulated, and the idea of functional groups in the plankton proven.
The purpose of this review is to summarize various molecular methods that can be used to estimate biodiversity and to illustrate the use of these tools in selected photosynthetic protists.

2. Why Use Molecular Techniques?

Molecular tools, in general, offer the possibility to estimate biodiversity at all levels, e.g., kingdom/class/family/species level, in a comparatively small environmental sample. In some cases, even a few milliliters of seawater may be enough. Moreover, some of the techniques are very sensitive, e.g., they offer the possibility to detect single cells in a sample. Depending on the question(s) being asked, the molecular tools to answer them differ greatly. One may wish to detect as many species as possible in a given sample. In this case, the establishment of an rDNA clone library with subsequent sequencing of as many clones as possible can uncover the biodiversity in that sample in great detail.
A molecular marker is a genetic trait of DNA or in the case of proteins (isozymes) used to distinguish between individuals or groups by the marker's different alleles. There is no perfect molecular marker and every technique has its advantages and disadvantages and must be chosen considering the focus of: the scientific question to be solved, the species under investigation and one's previous knowledge about the species as well as available resources (time, equipment, costs). General assessment of comparative biodiversity in a larger number of samples can be achieved with DNA fingerprinting methods based on denaturing or temperature gradient gel electrophoresis (DGGE, TGGE) [18,90] or single strand conformation polymorphisms (SSCP) [19]. Presence or absence of a known species can be monitored with species-specific probes using chemiluminescent detection and DNA dot blot techniques or, more sophisticated, with fluorescent in-situ hybridization (FISH). Distinction of individuals at the species level can be obtained using highly variable molecular markers, such as ITS sequences (internal-transcribed spacer) or microsatellites. Finally, non-molecular techniques, such as flow cytometry that have already been used in the “pre-molecular age”, can be combined with DNA techniques (staining of the nucleus, hybridization with fluorescence-labeled specific oligonucleotide probes) to distinguish and quantify species in environmental samples.
In general, molecular techniques have some significant advantages over traditional methods:
  • Only very small samples (in the range of milliliters up to a liter) can be used for most analyses.
  • High sensitivity, enabling the researcher to detect even single specific cells among thousands of others.
  • Dead or non-culturable cells can be analyzed.
  • Species-specific data (such as sequences) can be obtained without the need to culture or even isolate a species.
As with all methods, molecular ones also contain certain biases. The harvesting of cells through filtration or centrifugation may be harmful for fragile organisms, which thus may escape the analysis. For many techniques, the lysis of organisms and subsequent isolation of DNA is a prerequisite. Both steps may not be equally effective in all organisms. In PCR-based approaches, biases are evident concerning the choice of (universal) primers, PCR conditions (e.g., the amount of DNA or primers used, annealing temperature, cycle number, etc.), machines or enzymes used, etc. The copy number of genes of interest (mostly ribosomal RNA genes) differs greatly among various organisms. If cloning steps are involved, then the choice of vectors, enzymes or bacterial strains may be relevant. Hybridization experiments are susceptible to hybridization conditions (temperature, salt concentration, time) or base composition and subsequent detection of fluorescence may be hampered by autofluorescence. All of the former are especially important when absolute quantification of results is desired.

3. Which Genes to Select?

Photosynthetic organisms usually contain three different genomes: the nuclear, the plastid and the mitochondrial genomes. Each has its own unique set of genes, each of which evolves at different rates. To use molecular techniques in phytoplankton analyses, one must be aware of certain biases and limits to the resolution of the genes [20,21]. Researchers working with photosynthetic organisms have more genomes/genes to access than do those working with heterotrophic organisms. However, many genes are found across all organisms irrespective of their trophic status, and these genes should be used if one needs to carry out very broad comparisons. Several questions should be considered when selecting a molecular marker for phylogenetic or population structure analyses. Answers to these will strongly influence the molecular markers selected for a study.
However, overriding any consideration of which region of the genome to select will be two other factors: Is the rate of evolution in the chosen molecular marker appropriate for the taxonomic level addressed and what is the geological age of the species or group of organisms investigated? If the algal group or any group, for that matter, diversified hundreds of millions of years ago, then only very slowly evolving markers may provide the appropriate resolution. Fast-evolving markers can be so saturated with substitutions that no phylogenetic signal can be recovered. In more recently evolved taxa, slow evolving genomic regions will lack resolution, and non-coding regions or third codon positions in protein coding genes may be the appropriate choice for resolving evolutionary relationships and these taxa can only be resolved with the fastest of markers, see Medlin et al. [22,23] for markers that can separate Emiliania from Gephyrocapsa in the coccolithophorid haptophytes, which diverged only ca. 250,000 years ago. These morphologically genera are identical in 18S, 16S and rbcL genes.
To explore differences among populations within a species, and even to assess variation among individuals within a population, one uses the fastest evolving markers available, for instance microsatellites, regions in which a duplet, e.g., AT or CT), or triplet, e.g., ATG or CCT, is repeated a number of times. These markers are usually neutral, i.e., experience no selection pressure for a particular number of copies. Replication mistakes can happen easily, leading to extremely high mutation frequencies. This is why these markers vary even among individuals within a population of a single species.
At higher taxonomic levels, slower evolving coding regions, such as the ribosomal RNA genes (small subunit or SSU, large subunit or LSU) and the large subunit of RUBISCO (ribulose 1,5-bisphosphate carboxylase, rbcL), are commonly used, but other genes, such as the plastid psaA, psaB, psbC and tufA genes, are increasing.
By far, the most sequences are available for the SSU rRNA gene. This molecule, besides the availability of a huge dataset (the current ARB database contains over 300,000 prokaryotic and eukaryotic sequences aligned by secondary structure), offers some advantages [24]:
  • Universally present with the same function in all organisms;
  • Variable regions of conservation, which enables design of primers or probes to be designed;
  • Many copies, which makes PCR easy or genome application for later PCR also easy;
  • No evidence for lateral gene transfer, so vertical descent is analyzed by phylogenetic methods.
One should be aware, however, also of some disadvantages of the SSU for phylogenetic reconstruction. Because it is a non-protein coding gene, its sequence can be aligned only at the nucleotide sequence level. Moreover, its more variable regions show length variation, rendering correct alignment of distantly related sequences in some regions open to debate. However, in these cases, the secondary structure of the ribosomal RNA molecule can guide alignment. Nearly all comments about the SSU also hold true for the large subunit rRNA (LSU), except that this molecule is significantly larger and contains more variable sites. Trees inferred with alignments made without guidance from the secondary structure can give very different results from those made with a secondary structure basis [25]. The ARB database for the ribosomal genes is based on a secondary structure alignment (www.arb-silva.de).
Despite the advantages of rRNA genes for some applications, the use of protein-coding genes may be more appropriate. For all photosynthetic, and also some chemosynthetic, organisms the gene for the large subunit of the key enzyme of the Calvin cycle, ribulose-1,5-bisphosphate carboxylase/oxygenase (RUBISCO), has become a keystone in phylogenetic comparisons. The gene is rather large (approximately 1,600 base pairs (bp)), i.e., contains many potentially informative sites, and is well conserved in length and in function, meaning that alignment bias is not an issue. However, the marker evolves somewhat faster than the SSU rDNA and is therefore less suited for exploring very deep phylogenetic relationships. Because it is a protein-coding gene it can be unambiguously aligned at the amino acid level. The tufA gene encodes a translation elongation factor, is present in all organisms, like the SSU gene, and is well conserved and easy to align. As the dataset for many genes grows, others, e.g., RNA polymerases, GAPDH, COX1, might also gain importance in the future.
Another approach that becomes more and more feasible through the growing number of available sequence information is to make multi-gene alignments. The use of concatenated genes in one alignment should help resolving inconsistencies and lead to more robust phylogenetic trees.
At lower taxonomic levels, non-coding spacer regions may be more appropriate, because these are not under the same functional constraints as those of the coding regions and they are free to evolve at a faster rate to provide greater resolution among closely related species. The best-studied examples are the internal transcribed spacer regions (ITS) within the ribosomal cistron, which are those regions separating the SSU, 5.8S and LSU rRNA gene regions. Sometimes, external spacers between ribosomal cistrons can offer an even greater variability than the ITS regions or introns. The spacer separating the large and small subunits of RUBISCO (only in the red algae and those containing chlorophyll c but not in the dinoflagellates), the spacer between the pet B and D genes, the spacer between the trnT and the trnF genes and the introns in the calmodulin genes have been used in many algal studies.

4. Methods for Determining Biodiversity in Environmental Samples by Sequence Analysis

The most exact method to assess biodiversity down to the species level in environmental samples is to sequence a particular DNA marker from all individuals in such a sample. The nuclear SSU rRNA gene, or a part of it, is the gene of choice and has become the phylogenetic yardstick by which molecular diversity is measured. The reason is the existence of a huge dataset of reference sequences, covering virtually every taxonomic group known to science. This diversity estimate is achieved by isolating total DNA from the sample followed by full-length SSU gene amplification using PCR and universal primers, then cloning and sequencing the entire marker or the part of it. The method allows the exhaustive description of biodiversity in a sample down to the species level. Also the resulting sequence information may serve as a basis for developing specific oligonucleotide probes necessary for subsequent methods, such as FISH. It should be noted though that even universal PCR primers may amplify only a subset of all organisms, or they may show a preference for amplifying some sequences above others, and therefore bias the result. It has been shown that different groups of organisms were detected when different primers have been used and if possible the analysis of an environmental sample should always include the use of different primers to get a more complete picture of its diversity [26]. Clone libraries made from ribosomal RNA instead of DNA can be different in terms of operational taxonomic units (OTUs) present and their abundances because different organismal groups have markedly different numbers of nuclear SSU rDNA copies, whereas the number of ribosomes in a cell is related to its activity [27].

4.1. 454 Sequencing and the Rare Biosphere

454-Pyrosequencing is a new method of sequencing that is rapidly gaining favor for environmental analysis because it allows rapid attainment of several hundreds of thousands of sequences of circa 400–500 bp in a 10-hour run from an exhaustive search of a library. 454 Sequencing starts with whole genome DNA or targeted gene fragments, which are broken into shorter double-stranded fragments of ca. 400-600 bp. Adapters are ligated to the DNA fragments. These adaptors provide priming sequences for both amplification and sequencing of the sample-library fragments. One adaptor (Adaptor B) contains a 5’-biotin tag for immobilization of the DNA library onto streptavidin-coated beads. After nick repair, the non-biotinylated strand is released and used to construct a single-stranded template DNA (sstDNA) library, by immobilization of the strands onto beads. The sstDNA library is assessed for its quality and the optimal amount (DNA copies per bead). The single stranded DNA library fragments along with capture beads and enzyme reagents, are injected into small, cylindrical plastic containers containing a synthetic oil, which are vigorously shaken causing the water mixture to form an emulsion of droplets around the beads. Typically, most droplets that contain DNA will contain only one DNA fragment. A PCR reaction then takes place in each well of the plate in which each single DNA fragment is amplified into approximately ten million identical copies that are immobilized on the capture beads. When the PCR reaction is complete, the beads are screened from the oil and cleaned. Those beads that do not hold DNA are eliminated. Those beads that hold more than one type of DNA fragment are easily filtered out during sequencing signal processing. The 454 Sequencing™ process uses a “sequencing by synthesis” approach to generate sequence data. In sequencing by synthesis, a single-stranded DNA fragment is copied with the use of an enzyme making the fragment double stranded. Starting at one end of the DNA fragment, the enzyme sequentially adds a single nucleotide that is the match of the nucleotide on the single strand and this method detects which base was added at each step. This is also called pyrosequencing, which is based on detecting the activity of DNA polymerase with another chemiluminescent enzyme. Light is produced only when a nucleotide is paired with its complementary base on the template.
Exhaustive searches of such massive datasets have revealed many sequences (operational taxonomic units, OTUs) that are represented by only a single clone in the library, and that are markedly different from the remainder of the sequences. With traditional methods of making and sequencing clone libraries, these single sequences would not have been recovered to a large extent. This plethora of single occurring OTUs has been termed the “rare biosphere” [28] and much effort is now being concentrated to recover this aspect from as many communities as possible with 454 sequencing.
The rare biosphere was demonstrated earlier in the 1950s and 1960s in the diatom surveys done by the Philadelphia Academy of Sciences in the rivers of North America [29,30]. The diatom laboratory routinely counted 60,000–130,000 diatoms valves per sampling site and their abundance graphs clearly show this rare biosphere for the diatom community. Normally, environmental studies with diatoms count to 500 valves to standardize comparisons across studies [31], which miss this rare biosphere just as does standard cloning and sequencing of communities.
The function of the rare biosphere is a current topic of discussion. It would appear that this rare biosphere remains rare and none of the individuals have been documented to become abundant in other locales or time frames.

4.2. Barcoding

A recent topic that is controversially discussed in the scientific community is the idea of “DNA Barcoding”. In this approach, a short gene sequence from a standardized region of the genome (“the barcode”) is used to discover, characterize, and distinguish species, and to assign unidentified individuals to species. Basically, this method is not different from the sequencing methods we mentioned before, but what is new here is the scale at which international consortia and scientists try to analyze biodiversity in a standardized way. The Consortium for the Barcode of Life (http://barcoding.si.edu/index_detail.htm), for example, has started initiatives to develop DNA barcodes for all fish and bird species on Earth, and many other groups of organisms are targeted the same way. The primary opposition to barcoding is that it could lead to the elimination of taxonomy but this is unfounded.
For this approach to work, the “barcoding community” needs to agree on the gene fragment to use so that barcodes from different species are comparable. So far, a fragment of the mitochondrial COI gene (cytochrome oxidase I) is most often used for DNA Barcoding, especially in animals, but it is not sure yet that this is the best choice for a range of organisms, including phytoplankton. Other gene fragments, i.e., of RUBISCO, might give a better resolution and identification in these groups but for the costs of a less standardized analysis; RUBISCO is only present in photoautotroph organisms. It might well be in the end though that DNA Barcodes have to be developed using a few different genes. Another possible disadvantage is the short length of the Barcoding sequence. Whereas this is deliberate to make development and analysis easier, it has the drawback that the information content of the sequence is limited and it might not be possible to distinguish between species based on these short sequences. DNA Barcoding can be a powerful tool in taxonomy and in analysing marine biodiversity. The high-throughput approach and the comparability of data will help to address a lot of questions regarding cryptic and invasive species, and might also help to identify quickly microbial diversity in a given water sample. We need to be careful though, as with all methods, in accessing the limits of this technique and not overestimating what DNA Barcodes can really tell us.
In order to make the procedure work, for example, to utilize it to obtain a semi-quantitative oversight of the diversity of an environmental sample, the barcodes of all possible organisms in the biosphere must be determined first. This implies that all organisms must be known first. We are unfortunately still very far removed from that state of our knowledge, and it is questionable if such knowledge will ever be achieved. Moreover, it is not sufficient to determine the barcode of a single individual as representative of the species because different individuals in a population, let alone individuals in different geographic populations may possess slightly different barcode sequences. So, we need to know the extent of intraspecific variation, and this variation should remain far less than differences among species.
Yet, if all these problems can be solved at least in part, barcoding provides a powerful tool for obtaining semi-quantitative data on the species composition of large numbers of environmental samples in a rapid and cost-effective way. The DNA can be extracted, the barcode marker of interest PCR-amplified and the obtained plethora of sequence copies sequenced by means of modern massive sequencing technologies (e.g., Solexa, 454), and the resulting sequence reads characterized taxonomically by automated means: samples in—semi-quantitative list of species out.

4.2.1. Case Studies

Diatoms: Perhaps the best studied example of cryptic speciation in diatoms and in which the use of a barcode has been empirically tested is in Sellaphora pupula, sensu lato, a common and cosmopolitan freshwater benthic species complex, for which many morphological, mating and sequence data have been generated (see review of all studies in [32]. Evans et al. [32] reviewed and tested the variability of several genes on their ability to discriminate the many pseudo- and semi-cryptic species that have been shown to exist in this species complex. Among COX1, rbcL, SSU and ITS rDNA, they found that COX1 had a higher degree of variability than any other gene for which they reviewed and tested, apart from ITS. It is not known exactly what type of inheritance of mitochondria exists in diatoms, which might be a problem. Moniz and Kaczmarska [33,34] have questioned the use of COX1 for the diatoms because the currently available primers do not readily amplify across all species. They found the ITS to be more reliable, but Evans et al. [32] were worried about the variability within the ribosomal cistron.
Red algae: Robba et al. [35] assessed the use of COX1 to identify red algae. Their data set spanned six orders of red algae: the Bangiales, Ceramiales, Corallinales, Gigartinales, Gracilariales and Rhodymeniales. Cryptic diversity was observed within morphologically delineated taxa in all the orders of red algae studied. Their results indicate that it is possible to discriminate between species of red algae using COX1 sequence data and the authors concluded that this marker has the potential to be a powerful tool for DNA barcoding in the red algae. Existing primers developed for red algae easily amplified all taxa studied.
Brown algae: McDevit and Saunders [36] have also explored Cox1 in these algae and found that it could be used to recover geographic groups in Laminariales species.

4.3. Molecular Probes for Identification and Characterization of Marine Phytoplankton

Oligonucleotide probes of varying specificity can be easily found within the vast amount of rapidly accumulating sequence data. Oligonucleotide probes or signature sequences are being developed as phylogenetic determinative tools in environmental microbiology. These oligonucleotide probes are normally 16–24 bp in length and are 100% homologous only to a complementary sequence in a gene of the species of interest and differ by at least one position to all other organisms and carry an attached label, e.g., Digoxigenin (DIG) or a fluorochrome, such as Fluorescein. Based upon taxon-specific regions of the RNA of the ribosomal small and large subunit (SSU, LSU rRNA), signature probes have been developed to identify phytoplankton at various taxonomic levels from classes down to species or strains [1]. Using DNA or mRNA as the target region, small, labeled oligonucleotide probes are normally not sufficiently sensitive to detect their target sequence, i.e., the gene or transcript of interest by in situ hybridization, even if some experiments showed otherwise. However, ribosomes occur in such high numbers in cells that probes bound to these molecules provide a strong signal. In FISH experiments, these probes can be used to identify species of interest by binding to the target's sequence in the ribosomal rRNA and can be detected by epifluorescence microscopy or automated detection systems, such as flow cytometers, giving the scientist the clear identification of the target cell(s) even in mixed populations together with all other information these instruments can deliver, such as cell size, shape autofluorescence, etc. (Figure 1).
Figure 1. Sample from a biofilm on a mesocosm tank (a) during the EU AIMS project experiment in Malaga. In situ hybridization of the sample with different class level probes showed only positive results with probe CHLO02 identifying algae from the class Chlorophyceae as the dominant algal population in the biofilm (b). Some diatom cells in the sample didn't hybridize and showed only yellow autofluorescence. Figures courtesy of R. Groben.
Diversity 02 00973 g001
Although these techniques have been largely used for bacteria [37,38,39], work is beginning for pico- and nanophytoplankton (0.2–2 and 2–20 μm) [40,41,42] and for larger plankton because of their importance as harmful algae (e.g., Pseudo-nitzschia, Prymenesium and Alexandrium, [43,44,45,46,47]. The fast and secure identification of phytoplankton, especially of toxic species, is important from an ecological and economic point of view, but pico- and nanoplankton (0.2–20 µm in diameter) often lack morphological features that are taxonomically useful for identification at the light microscopic level. These restraints usually necessitate other time and cost intensive techniques, such as electron microscopy, pigment analysis with high-performance liquid chromatography (HPLC) or sequencing of conserved genes, before a definitive identification can be made of particularly difficult taxa. Phytoplankton species identification by whole-cell hybridization with specific fluorochrome-labeled probes followed by fluorescence microscopy or flow cytometry offers a faster alternative for species identification. The broad diversity we face in the phytoplankton makes it difficult to develop an in situ protocol capable of analysing all kinds of algal cells. For example, different types of cell walls and membranes may require different conditions for probe penetration. Also, cell autofluorescence, especially from chlorophyll, can become a problem when it is very strong and therefore masks the probe signal. The application range of these probes extends from answering ecological questions like species composition and its change through space and time to the development of an early warning system for harmful algal blooms using probes for toxic species.
The use of rDNA sequences has other advantages for probe design. First, this molecule has regions with different degrees of conservation, which makes it possible to develop probes for higher taxonomic groups (class level probes, e.g., for prymnesiophytes [48], probes for groups of related species (“clades”) (e.g., clades of toxic or non-toxic Chrysochromulina/Prymnesium species [48], genus-specific probes (e.g., for Phaeocystis species, [49] down to species- or even strain-level probes (e.g., Chrysochromulina polylepis [48] and the toxic North American clade of Alexandrium tamarense [50].
These hierarchical probes make it easier to analyze field samples using an approach where first higher level probes can be applied to the samples and then, depending on these results, only probes of a corresponding lower level can be used, therefore, reducing the number of necessary experiments. Second, the thousands of ribosomes provide enough targets for probe binding and therefore, strong enough signals to be detected. If this is not the case, i.e., in picoplankton and also in bacterial cells, which often show weaker signals because of their small size and therefore lower ribosome content [51], techniques like Tyramide Signal Amplification (TSA, Figure 2) can be used to boost the signal strength up to a detectable level [52,53]. This method combined with FISH increases the intensity of fluorescence and thus raises the detection limit and the signal/noise ratio, which is critical for small cells and results in a strong signal enhancement of the hybridized cells up to 20 times compared to probes with a single fluorochrome. TSA has been shown to be very useful in the detection of cyanobacteria [52,53,54], picoplankton cells [55,56,57] and bacteria associated with micro algae [58,59].
When extracted DNA is available, the oligonucleotide probe can also be used as PCR primer. A specific oligonucleotide in combination with a matching primer from a highly conserved region of the same gene should only amplify a product if the DNA comes from the species the oligonucleotide probe was designed for. To be used successfully as a PCR primer, the mismatches should be shifted to the 3’ end of the molecule. Nevertheless, when a probe can be used this way, the method is much faster than a dot blot hybridization in detecting the presence of a certain type of organism, which can even be quantified through the use of real–time PCR. There are already examples where the combination of real–time PCR and species-specific primers/probes has been successfully applied, e.g., for the detection and enumeration of Alexandrium minutum [60], and with the rapid progress in technology this might be a promising method for routine monitoring of selected species.
Figure 2. Signal enhancement using Tyramide Signal Amplification. (a) and (c) show a cell hybridized with a FITC-labeled probe: dinoflagellate species level probe and a cryptomonad clade level probe, respectively; (b) and (d) show the application of the same probe for a dinoflagellate and a cryptomonad with FITC-TSA.
Diversity 02 00973 g002
Microscopy is not the only way to detect fluorescence in cells. Another method of detection is by flow cytometry, which is not a molecular biological method per se, but can be used in combination with molecular probes to great advantage to analyze large numbers of cells [61].
These techniques are powerful and highly quantitative tools for the identification of microbial organisms. However, they all have the drawback that they are single probe approaches that are limited to the analysis of only one or a few targets at a time. The introduction of the concept of DNA microarrays about ten years ago suggests a resolution of the limitations of single probe approaches. DNA microarray-experiments are multiplexed assays that provide the possibility for high throughput analysis of molecular probe based species identification without a cultivation step. This is of special interest for the identification of prokaryotic and eukaryotic cells with very small sizes and few distinct morphological features. As in all fields, the number of taxonomists has been steadily decreasing. Therefore, DNA microarrays are useful for phycological studies because they represent a tool that does not require a broad taxonomic knowledge to identify cells. Consequently, there are a growing number of publications that report the use of microarrays bearing molecular probes that target the rRNA for the identification of microbial species. They have been used successfully in combination with an amplification of the rRNA-gene for the identification of phytoplankton, bacteria, bacterial fish pathogens, and sulphate reducing prokaryotes [62,63,64,65]. DNA-microarrays allow the parallel analysis of an almost infinite numbers of probes at a time in just one experiment. The technology is based on a DNA-microchip that contains an ordered array of molecular probes on its surface (Figure 3).
All these methods have, despite their high setup costs for the machines, the disadvantage of requiring quite bulky pieces of equipment, hence, making them difficult to be used in the field and on-board ship. This is of particular interest for the monitoring programs for toxic algae, where samples are taken regularly at places that are not in close proximity to laboratories that host the relatively expensive microarray reader.
Figure 3. Image of a scanned DNA-microarray from a field sample taken in Galicia, Spain during a toxic algal bloom event. The DNA-chip contained probes for various toxic phytoplankton taxa. Photo taken by Dr. J. Chen in the EU MIDTAL project. Each cluster of four spots represents four replicates of a probe for a toxic species, at the specie level or above. The higher signal (red) indicates that more RNA was bound to that probe during the hybridization steps and therefore more cells of that species were present in the initial sample.
Diversity 02 00973 g003
DNA-biosensors could serve the needs of monitoring programs for an easy-to-handle and inexpensive tool. A biosensor is a device for the detection of an analyte that combines a biological component with a physicochemical detector component. The application of a DNA-biosensor for the identification of organisms is again based on taxon specific molecular probes, of which a large number already exists for toxic algae. There are a number of examples for the application of DNA-biosensors that have been developed for the identification of organisms. A DNA-biosensor has been adapted for the electrochemical detection of the toxic dinoflagellate Alexandrium ostenfeldii [66]. Electrochemical readings of DNA-biosensors are unambiguous and even for a scientific layperson easy to use and interpret. The DNA-biosensor detection reaction is a sandwich-hybridization that takes place on a carbon electrode on a disposable chip. A sandwich-hybridization is based on a set of two specific molecular probes that bind in close proximity to the target nucleic acid, e.g., the SSU rRNA of A. ostenfeldii. In the current assay, the capture probe is immobilized via biotin onto the carbon electrode, which is coated with avidin. The second probe, the signal probe, mediates the detection reaction, if target DNA is bound to the capture probe on the carbon electrode. The capture probe is recognized by an antibody that is coupled to a horseradish-peroxidase that catalyses the reduction of hydrogen peroxide to water. The electron-transfer during the red/ox-reaction can be measured as an electrical current, which is only possible if the target nucleic acid as a link between the two probes is present in the system. Experiments with RNA isolated from laboratory strains showed, that the electrochemical signal is proportional to the amount of target RNA applied to the sensor. The device was expanded in the EU ALGADEC project to regional chips for up to 14 harmful algal species at a time. In order to serve the needs of the monitoring programs that aim to count all potentially harmful algae in a geographic area it would be indispensable to adapt the present DNA-biosensor to a broader range of toxic algae. Whereas this device is not yet available to the general public, it has a high potential to become a powerful monitoring tool in the future.
As it can be realized, there are numerous techniques possible for analysing multiple samples with specific probes automatically and more are surely to come. With them the way is open for mass screening of water samples for the detection of interesting marine species like toxic algae, even as there are still some problems to be solved and methods to optimize before they can be routinely used for this kind of purpose.

5. Fingerprinting Methods as Applied to Environmental Samples

Often it is not possible or necessary to get a full assessment of biodiversity but instead it is sufficient to identify temporal changes or spatial differences among samples. In this case, DNA fingerprinting methods can be used. All those methods exploit differences in the length and base composition of specific gene segments, which result in different banding patterns after electrophoresis—“the fingerprint” of this sample.
Two well-established methods for assessing diversity in environmental samples are Temperature Gradient Gel Electrophoresis (TGGE) and Denaturing Gradient Gel Electrophoresis (DGGE) [18]. These methods allow the qualitative and semi-quantitative determination of biodiversity in environmental samples.
Limitations of DGGE/TGGE are:
  • The PCR fragment size is limited to some 500 bp because of the separation capacity of polyacrylamide gels. Therefore, these methods cannot handle full-length SSU genes;
  • It is difficult, if not impossible, to compare patterns across gels. Therefore the number of samples that can be reliably compared with one another is limited to the number of slots on the gel;
  • The methods are not trivial and have to be optimized for each primer pair and for new sample types. Therefore, the initial help of an experienced person is necessary to establish the methods. However, given the rapidly accumulating dataset on this method in the literature, this problem may become less relevant in the future;
  • Sometimes the methods are “too sensitive” because even pure cultures produce more than one band.
Single-stranded-conformation polymorphism (SSCP) [19] uses the fact that single stranded DNA fragments fold into secondary structures depending on their base composition. Fragments of identical length but different base composition can then be separated in non-denaturing polyacrylamide gels. As with DGGE/TGGE in principle the method works with all sequences that can form secondary structures. For some questions, the highly variable V4 and V5 region of the SSU rRNA has proven most useful. The major advantage of SSCP compared to DGGE or TGGE is that no GC-clamp needs to be generated and the electrophoresis method is more straightforward because ordinary equipment for PAGE (polyacrylamide gel electrophoresis) instead of gradient gels or temperature gradient electrophoresis can be used. GC clamps are stretches of Gs and Cs added to the primer that prevents the complete denaturation of the product to retard its electrophoretic movement and to increase the sensitivity of the method. Also the fact that one of the two strands is degraded reduces the variability obtained from communities because it avoids heteroduplex formation, a problem known in community analyses based on DGGE. A current disadvantage of SSCP relates to its novelty and thus, lack of applications in microbial ecology. However, because also automation is possible, SSCP may become more important during the next years.

5.1. Analysis of Population Structure Using Molecular Markers

5.1.1. Isozymes

The first molecular markers to be used in marine and terrestrial species were the isozymes. These are proteins that show only small differences in their size or iso-electric point and therefore can be separated by electrophoresis, but are still perfectly able to catalyse the same biochemical reaction. Their advantage of quick and easy isolation and detection made them the markers of choice for many early investigations. But the requirement that isozymes must still be functional in the biochemical pathways strongly limits the number of possible mutations and therefore the number of alleles and the heterozygosity of this marker type. Another disadvantage of this kind of marker is also that protein content of cells and the detectability of isozymes are strongly influenced by the environment and as a consequence, other marker types were developed that directly used environment-independent DNA.
The goal of most early molecular studies concerning microalgae using isozyme analysis was to resolve species-level issues among species with conflicting or little morphological resolution rather than to study genetic structure within bloom populations. The recognition of cryptic species or the recognition of previously discounted morphological markers that can be used for separation of a species complex was the most common results of early isozyme studies. For example, different in isozyme banding patterns in neritic, shelf and oceanic populations of Thalassiosira pseudonana prompted Murphy and Guillard [67] and Brand et al. [68] initially to suggest that this species was composed of clinal populations but later detailed morphological investigations separated each ecological population into a different species [69,70] viz., Thalassiosira guillardii, oceanica and pseudonana). In the PSP-toxin producing dinoflagellate Alexandrium tamarense/fundyense/catenella, the ciguatera-toxin producing dinoflagellate Gambierdiscus toxicus and the freshwater dinoflagellate Peridinium volzii, the complex nature of these microalgal species complexes was revealed using isozyme studies [71,72,73,74,75]. In the first study of Alexandrium, isozyme analyses showed a high degree of enzymatic heterogeneity among isolates from the West Coast of the United States with isolates from the same locality being most closely related [71]. A relative lack of enzymatic heterogeneity was revealed by a similar analysis of East Coast Alexandrium populations [73]. A common origin for the East Coast populations and a dispersal hypothesis along the east coast of the United States from Canada down to Massachusetts, which has been related to hydrographic events dissipating a massive red tide that occurred in 1972, was hypothesized from isozyme data. Alexandrium species have been studied in more detail using sequence analysis of rapidly evolving genomic regions, such as the ITS and the D1/D2 region of the LSU rRNA gene. Using these regions, isolates of the Alexandrium tamarense/fundyense/catenella species complex were shown to be related by geographic origin rather than by morphological affinities [45], which was originally indicated by the isozyme analysis. The worldwide biogeographic dispersal of ancestral population from the Pacific into the Atlantic has been inferred from these data. Furthermore, Alexandrium isolates will interbreed more successfully if they have similar isozyme patterns from two different locations than will isolates from the same locations but with different isozyme patterns [76]. Peridinium volzii isolates from the same location were also found to be closely related, although quite distinct between locations [74]. In contrast, other dinoflagellates, such as isolates of Gambierdiscus toxicus from similar geographical regions were not shown to be closely related, which suggested a multiclonal origin [75]. Populations of the green freshwater alga, Gonium pectorale, also appear from several locations to be multiclonal [76]. Similar results were obtained in studies assessing diversity in planktonic diatoms. For instance, Gallagher [15,77] observed marked population genetic differences between summer and winter populations of Skeletonema costatum in Narragansett Bay using isozymes, whereas subsequent studies by Sarno et al. [78,79] and Kooistra et al. [80] using faster evolving molecular markers suggest that the two populations were likely distinct species.

5.1.2. PCR-Based Population Markers

There are several PCR based methods of determining population structure. DNA polymorphisms between individuals can, e.g., be found by Restriction Fragment Length Polymorphism (RFLP), a technique in which DNA is digested by restriction enzymes and then the presence or absence of restriction sites in different individuals is compared as well as insertions or deletions in their genome between these restriction sites. A slightly different RFLP method consists of the PCR amplification of a specific gene, e.g., the SSU rDNA, followed by restriction digestion with enzyme and gel electrophoresis. Because it uses only a limited number of fragments this method avoids the need of blotting and probing for visualization and is much faster and easier than the “classical” RFLP. On the other hand, the limited number of possible bands leads also to a very small number of possible polymorphisms and one needs luck to find a usable marker. Nevertheless, there are examples where this kind of RFLP marker has been used with success, e.g., for discriminating species and strains of the toxic dinoflagellate genus Alexandrium.
The first widely used PCR marker technique was Random Amplified Polymorphic DNA (RAPD) or Arbitrary Primed PCR (AP-PCR) with the former being the most commonly used name for this kind of method [81,82]. It uses a single short random primer in a PCR reaction, most often a decamer, to amplify the DNA to produce a fingerprint of multiple bands. Polymorphisms between individual samples are derived from single nucleotide changes that prevent or allow primer binding and therefore lead to different banding patterns between individuals. This method became quite popular because it could be carried out in a short time without previous knowledge of the organism under investigation. Nevertheless, RAPDs have been shown to have some drawbacks: The use of short primers gives not only the possibility of random binding in all kind of genomes and therefore makes this method working with all organisms, but it also makes it unreliable, too, and susceptible even to small changes in the PCR conditions. As a consequence, reproducibility of RAPD markers is hard to obtain. Also, RAPDs are normally dominant markers by which they give less information than other, mostly co-dominant markers. To summarize, RAPDs are only the method of choice when time and resources are limited and no previous information about the species under investigation are known, otherwise other marker techniques are preferred. Both spatial and temporal differences were found in populations of the dinoflagellate Gyrodinium catenatum among Australian and global populations using RAPD fingerprinting data [83]. Despite this, it was not possible to define the route of introduction into Australian waters, although the introduction was quite recent as judged from sediment records. Barker et al. [84] used RAPDs to assess populations of Emiliania huxleyi and their results were among the first to show that blooms were not clonal and that high diversity could be shown in relatively small bodies of water, i.e., in mesocosms.
A more recent marker technique for studying biodiversity in the marine environment is called AFLP (Amplified Fragment Length Polymorphism), which combines the advantages of RAPDs and RFLPs into a powerful tool [85]. First, genomic DNA is digested with two different restriction enzymes, a rare and a frequent cutter. Then matching adapters are ligated to the digested fragments. Afterwards, a PCR is performed with primers homologous to the adapters plus up to four additional random bases at its 3’ end. By using these selective bases, only a subset of digested DNA fragments is amplified, giving distinct bands instead of a smear and making it possible to analyze the bands on a polyacrylamide gel. The major advantage of this technique is the large number of bands it produces, giving a very good chance of finding a large number of polymorphic bands among them. The polymorphisms detected by this method come from the same sources as in RFLPs, insertions, deletions and point mutations leading to the presence or absence of restriction sites, but compared to RFLPs, AFLPs are normally scored only as dominant markers, even when some researchers give possible methods for using them co-dominantly. The use of longer PCR primers that anneal to the adapters and a few bases of the genomic DNA make the results much more reliable than those of RAPDs, because higher annealing temperatures can be used. The greatest advantage of the RAPD technology on the other hand remains, because no previous sequence information of the species under investigation is needed and PCR reactions are fast. Nevertheless, AFLPs are technically demanding, sensitive to the purity and quantity of DNA to be digested and need some experience to be performed. In addition, computers are needed to analyze the hundreds of amplified bands. Since 1995, when AFLPs were first introduced, there has been an increasing number of publications using this technique, but most of them deal with population studies or the development of genetic linkage maps for higher plants. Among algae, the multicellular red alga, Chondrus crispus, was the first organism to be analyzed by AFLPs, and more seaweeds have been investigated since then (e.g., Caulerpa, Chara and Porphyra species), but the method has since then also been used for phytoplankton, e.g., the marine dinoflagellate Alexandrium tamarense, the freshwater diatom Asterionella formosa and the freshwater chlorophyte Chlorella vulgaris. AFLP banding patterns in isolates of the dinoflagellate Alexandrium tamarense from the Orkney Islands were correlated with toxin patterns as determined by HPLC analysis [86], but a later study in the same area with more isolates and conducted on a different spatial scale, AFLP patterns did not correlate with alleopathic capabilities [87]. A preliminary study of Phaeocystis antarctica indicated that the gyres around the Antarctic were not isolated from one another and it was likely that the Antarctic Circumpolar Current (ACC) provided the vehicle for dispersal around the continent [88] More studies of algal taxa will definitely follow.
Microsatellites, also called simple sequence repeats (SSR), are now widely used as molecular markers both in applied genetics and in studying biodiversity in the marine field [89,90]. In the beginning, examples were mainly from the field of fisheries sciences with most if not all economically important species covered, but now microsatellite markers have been developed for macroalgae (e.g., Gracilaria gracilis, Laminaria digitata) and microalgae (e.g., Chlamydomonas reinhardtii, Emiliania huxleyi, Ditylum brightwellii, various Pseudo-nitzschia and Alexandrium species). Microsatellites are short sequences of one to six nucleotides, e.g., (CT)n or (CAG)n, that are repeated five to dozens and sometimes hundreds of times. They are found in great abundance dispersed all over the genomes of all organisms investigated so far. This abundance together with the large number of alleles, resulting from high mutation rates because of their special, regular structure, makes them highly useful molecular markers at the population level. Microsatellite polymorphisms can be revealed where other marker types have failed and therefore they are especially useful for species that otherwise lack a high degree of polymorphism, such as inbreeding species (soybean), or clonal species (planktonic algae that do not have a regular sexual cycle). Comparisons of different marker types have shown that microsatellites have the highest degree of polymorphism of all commonly used marker types. Both genetic diversity and gene flow can be calculated from this marker.

6. What Questions Can be Answered with Molecular Techniques?

In 1975, Doyle [91] hypothesized that microalgae must consist of a multitude of competing genotypes, but this study has been largely ignored because it has been assumed that microalgal taxa may have little genetic structure over very large geographic areas. It has been assumed that highly dispersed organisms at the mercy of the currents have no trace of genetic structure and so we find the microalgal organisms living in an ever-changing three-dimensional environment and it follows that they must be homogeneous. Speciation and dispersal mechanisms in microalgae may be very different from land plants as suggested by Palumbi [12], making our knowledge of microalgal genetic diversity becomes even less certain because generalizations about terrestrial plant diversity and population structure may not apply to aquatic ecosystems. With the possibilities of nucleic acid methods, however, these views on the absence of genetic structure in the marine phytoplankton have been seriously challenged. Genetic structure and physical, spatial partitioning within biogeographic regions are now known. The idea of a single globally distributed species is no longer adhered, especially not for coastal plankton, nor is the idea of temporal stasis. Temporal genetic changes can often be greater than spatial changes or changes between species. This may very well apply to bloom populations. The rate of genetic change can and does occur on ecological time scales (within generations) [17]. Reasons for this are unclear, but such changes may play a role in determining how local adaptations and speciation can occur in apparently homogeneous populations.
Plankton populations are typical ruderal (r)-strategists, as demonstrated by their rapid growth and high unpredictability of survival because of intense grazing. The high dynamics are familiar to monitoring agencies, observing a species to be common in one year and to be rare in the same plankton blooming period of another year. Especially if the life cycles of these organisms require a phase in which the species has to exceed a threshold density in order to find mates, failure to hit the threshold leads to failure to produce the next generation, leading to possible local extinction. The concept of a 'super species' with the ability to exploit a wide spectrum of environmental conditions may lay the groundwork for temporal genetic change. We hypothesize that a phytoplankton species consists of meta-populations composed of a scatter of geographical populations with intensity of gene flow among them depending on current patterns and geography, with possible frequent extirpation and subsequent immigration and re-establishment from elsewhere. Within this quilt of regional and local populations, there is ample possibility for genetic differentiation driven by different environmental conditions [9], random drift, geographical distance and barriers to gene flow. Given enough time, and depending one ones’ definition of what constitutes species, isolated populations might become biologically distinct entities [93]. A hierarchical arrangement of populations has now been demonstrated for the North American toxic clade of Alexandrium tamarense [87].
Another issue is whether adequate sampling strategies can be employed for phytoplankton populations to address spatial and/or temporal genetic variation questions. Pre-established cruise tracts may make the sampling of oceanic populations only possible at depth rather than in a hierarchical grid-like fashion that may be needed for population studies. A lack of knowledge about current regimes in the study area may also bias sampling strategies if samples are unknowingly taken from two water masses. At present most genetic studies must rely on clonal cultures for their analyses. These single-cell isolations are made from natural populations and can be difficult to perform at sea. The selective survival of only 10–30% of clones from natural populations may mean that the range of genetic diversity determined from a bank of clonal isolates may not be a true reflection of the genetic diversity in the original population and may not be adequate for the level of genetic diversity being addressed. In many algal groups, life histories are incomplete, and if the algae undergo sexual reproduction during culturing, then this may also affect the type of genetic analysis performed.
Much of our limited knowledge about phytoplankton genetic diversity stems from the difficulty of finding polymorphic markers for ecological genetic studies. Isozymes, the molecular genetic markers used in early studies, evolve so slowly that closely related populations appear identical. This fact has undoubtedly propagated the early ideas of the absence of genetic diversity in marine phytoplankton. The use of high resolution molecular marker techniques sensu lato circumvents these problems and has thus opened areas previously considered intractable.
Molecular techniques have made vast inroads into the estimation of marine biodiversity in terms of taxonomic affinities, the population structure of this diversity in modern times and historically (phylogeography). Each of these fields is discussed below with case studies from the marine phytoplankton.

6.1. Taxonomic Affinities

Plastid and flagellar apparatus characteristics are the features that define most microalgal classes, making them monophyletic taxa, although some surprises have been revealed by molecular analyses. For example, the Euglenophyceae are shown to be a very early eukaryotic radiation and not related to the Chlorophyceae, which is part of the major eukaryotic radiation, the so-called crown group radiation. The Kingdom Chromista did contain the bulk of eukaryotic microalgal taxa, i.e., the Stramenopiles (Heterokonta), Haptophyta, and Cryptophyta. But this kingdom is now recognized as a polyphyletic taxon [94,95], although a view difficult to relinquish [96]. Molecular analyses based on total evidence, which includes both morphological and molecular data from the rDNA data set, continue to reinforce the clear separation of the Haptophyta from the Stramenopiles [95], whereas those based on many other genes have distanced the cryptophytes from both the Stramenopiles and the haptophytes [97,98,99]. A fourth group, the Chlorarachniophytes, are now shown to be clearly related to the foliose amoeba [100] and cannot be placed in the Chromista where it was originally. Clearly the Kingdom Chromista is an idea whose time has passed. The Chromalveolata (chromists [cryptophytes, haptophytes, stramenopiles] and alveolates [apicomplexans, ciliates, and dinoflagellates]) is another grouping that has been difficult to find support for its monophyly [101]. In that study, a strong sister relationship was recovered between haptophytes and cryptophytes and Rhizaria was associated to the entire group. In some cases, commonly used external morphological features found in the microalgae have supported the molecular clades, e.g., in the Haptophyta [102] but in others, e.g., the diatoms, the internal structure of the cell has best supported the deeper branches in the molecular tree, whereas the more commonly taxonomically used feature of the siliceous cell wall support the younger branches [103]. The dinoflagellates have probably proven the most difficult to analyze, but are consistently placed sister to the alveolates. The phylogenetic outcome of any analyses is strongly dependent on the algorithm used [104,105].
Molecular techniques have wreaked the most havoc upon systematics, at the genus and species level, showing polyphyletic and paraphyletic lineages across many algal groups, not just the microalgae. Groups with few morphological markers, and where morphological species definitions have been too broad, have seen the most changes. More cryptic (morphologically indistinguishable sibling) species are being recognized by molecular data [106,107,108,109] and with these data biologists can better determine the taxonomic affinities of taxa with few or controversial morphological characters [3,110,111]. Our knowledge of microalgal biodiversity is likely to increase by an order of magnitude when we have true estimate of all sibling species and an identification of all the so–called hidden diversity present among the “little brown/green balls” and the “very small red fluorescing bodies” [16].

6.1.1. Case Studies at the Genus and Species Level

Skeletonema  costatum

The centric planktonic diatom genus Skeletonema constitutes an example of how diversity has been seriously underestimated, even in a common genus of large, conspicuous, diatoms with architecturally highly elaborate silica cell walls. Species usually form chains by means of tubes, termed strutted processes that emerge from the valve face and connect at their tips with one or two processes from the valve of the adjacent cell in the chain. Until the 1990s, only a few species were recognized, all conveniently identifiable in light microscopy or because they occurred in specific habitats: Skeletonema menzelii because it consisted of small cells that did not form chains, Skeletonema tropicum because it possessed multiple plastids per cell instead of a single one as in the remainder of the genus, Skeletonema subsalsum because it occurred in brackish water, Skeletonema potamos because it possessed cells of which the strutted processes were so short that the valves of the adjacent cells in a chain touched one another and because it existed only in freshwater. By far the commonest species was Skeletonema costatum, recognized as not belonging to any of the other species. Not surprisingly, the latter was found all over the world except in the Antarctic region, and was thus considered a truly cosmopolitan species and a model-example of the notion that in planktonic microbes, everything is everywhere. Yet, early work by Gallagher [15,77] showed genetically distinct groups within S. costatum in different seasons. Then, Medlin et al. [107] revealed two morphologically and genetically distinct species in the S. costatum group, one of which was described as S. pseudocostatum. In 2005, Sarno et al. [78] and Zingone et al. [112] revealed the existence of several additional ultrastructurally and genetically distinct taxa in the costatum group (S. dohrnii, S. grethae, S. grevillei, S. japonicum and S. marinoi) and refined the descriptions of the previously recognized species and Sarno et al. [79] added S. ardens to the known diversity in this genus and confirmed the existence of genetically distinct but morphologically cryptic entities in S. menzelii, S. pseudocostatum and S. tropicum. Studies exploring the biogeography of these species [80,113] have shown that S. marinoi and S. dohrnii may not hold up as genetically and morphologically distinct species because of considerable genetic variation among geographic samples in this group. Moreover, Sarno et al. [79] showed that ultrastructural differences in cingular bands between the two entities, the only discriminating character between the two species, did not always hold. In their global biogeographical study, Kooistra et al. [80] indicated that also the more narrowly defined species within what was formerly considered the cosmopolitan S. costatum (sensu lato) were generally very widely distributed, though confined by climate zones. For instance, S. japonicum was encountered in cool waters in the cold season or in upwelling areas, whereas its close relative, S. grethae was found in warm waters. The latter species was sampled in the Gulf of Mexico and Florida during the northern winter and further north along the US-East coast in the northern spring and summer. Notably, this species was found exclusively along the US southern and eastern shores and nowhere else. It was never encountered during extensive year-round sampling along the eastern Chinese coast [80,114] and in the Mediterranean Sea [80], which are climatologically comparable to the US-Atlantic coast. Apparently, some planktonic species can have geographically restricted distribution areas.

Pseudo-nitzschia delicatissima and Pseudo-nitzschia pseudodelicatissima

The planktonic pennate diatom genus Pseudo-nitzschia is also common in the plankton. Species in this genus form chains by means of sister cells that attach to one another by their apices. Upon division, each daughter cell slides along the valve of its adjacent sisters until only the tips remain in touch. The genus has gained notoriety because many of its species potentially produce domoic acid (DA), a potent neurotoxic amino acid that can accumulate in filter-feeding shellfish. When humans and other mammals consume these shellfish, the accumulated DA causes amnesic shellfish poisoning. Therefore, the coastal plankton is closely monitored for the occurrence of potentially toxic Pseudo-nitzschia species and to render that effective, it is crucial that the species diversity is properly known. Monitoring agencies screen for the occurrence of these species still mainly by light-microscopy, but Pseudo-nitzschia is, as in Skeletonema, much more diverse than can be appreciated in light microscopy. For example, two common species in the genus, Pseudo-nitzschia delicatissima and Pseudo-nitzschia pseudodelicatissima can be distinguished from one another in light microscopy, though only with training. Molecular investigations in these two species already revealed multiple distinct genetic entities, some of which co-existed in plankton blooms [115,116,117,118], suggesting that each one of these two species consists in their own right of multiple cryptic species. In a recent study, Amato et al. [119] compared light- and transmission electron microscopic observations with sequence differentiation in several DNA marker regions (plastid encoded rbcL, nuclear encoded LSU rDNA and internal transcribed spacer regions ITS-1 and ITS2] of several strains of the two entities and discovered in both species complexes several genetically distinct entities that could also be recognized based on differences in, poroid shape, and striae dimensions visible in scanning electron microscopy. Moreover, results of crossing experiments revealed that within the genetic entities as defined by ITS-2 sequences, strains of opposite mating types produced viable offspring, whereas strains with different ITS-2 sequences invariably failed to mate successfully. Sequence information of LSU and rbcL corroborated the observations based on ITS-2, but failed to identify the various biological species as inferred from the sexual reproduction experiments. Several of these genetic, biological and morphologically distinct taxa in the two species complexes have been described as species new to science [116,117,119,120]. Since the work of Amato et al., various research groups have detected additional genetically distinct entities in P. delicatissima sensu lato and P. pseudodelicatissima sensu lato [121]. The importance for the monitoring community is that some of these more narrowly defined species have been found to be DA-producers, whereas others never have revealed any trace of DA.

Alexandrium  tamarense

Within the genus Alexandrium, A. tamarense, A. fundyense and A. catenella comprise a closely related cosmopolitan toxigenic grouping of morphology-based species (“morpho-species”), the “Alexandrium tamarense” species complex, that play a prominent role in HABs. Individual morpho-species are identified by differences in cell shape and in the geometry of the apical pore complex (APC), by the presence or absence of a ventral pore on the apical plate [1’), and by the tendency to form chains or not. Phylogenetic studies of the A. tamarense species complex, based on SSU rDNA, the D1/D2 region of LSU rDNA and ITS sequences [see review in 122], have yielded results that contrast with the conventional morpho-species. Strains within the A. tamarense species complex are distributed geographically. Indeed, several of the geographic ribotypes contain specimens of each of the three morpho-species of the A. tamarense species complex. Thus, at least for molecular phylogenetic purposes, the three morpho-species are generally referred to collectively as the A. tamarense species complex. Within the A. tamarense species complex, six different ribotypes/geographic clades have been identified: Western European (WE), North American (NA), Mediterranean (ME) Temperate Asian (TA), Tasmanian (TASM), and Tropical Asian (TROP) clades. The WE, ME and TASM clades are exclusively non-toxic, whereas the NA, TA, and TROP clades consist only of toxic strains. These should all be recognized as different species, but the lack of clear morphological features has delayed their recognition as separate species. Many people still refer to fundyense and catenella as different species, although both morpho-species can be found in the same molecular clade and as such are the same species.

Sellaphora  pupula

D.G. Mann has investigated Sellaphora pupula for many years. Through mating studies, he was able to show [123] that small differences in valve morphology of six taxa, which were recognized either as varieties or forms by Hustedt, were in fact separate species as judged by a biological species concept. He and his co-workers have gone onto to characterize all of the new taxa molecularly and ecologically. Through this careful work, he has been able to claim that the diatoms are under described at the species level [124] and this has prompted better appreciation of minute variation in valve detail.

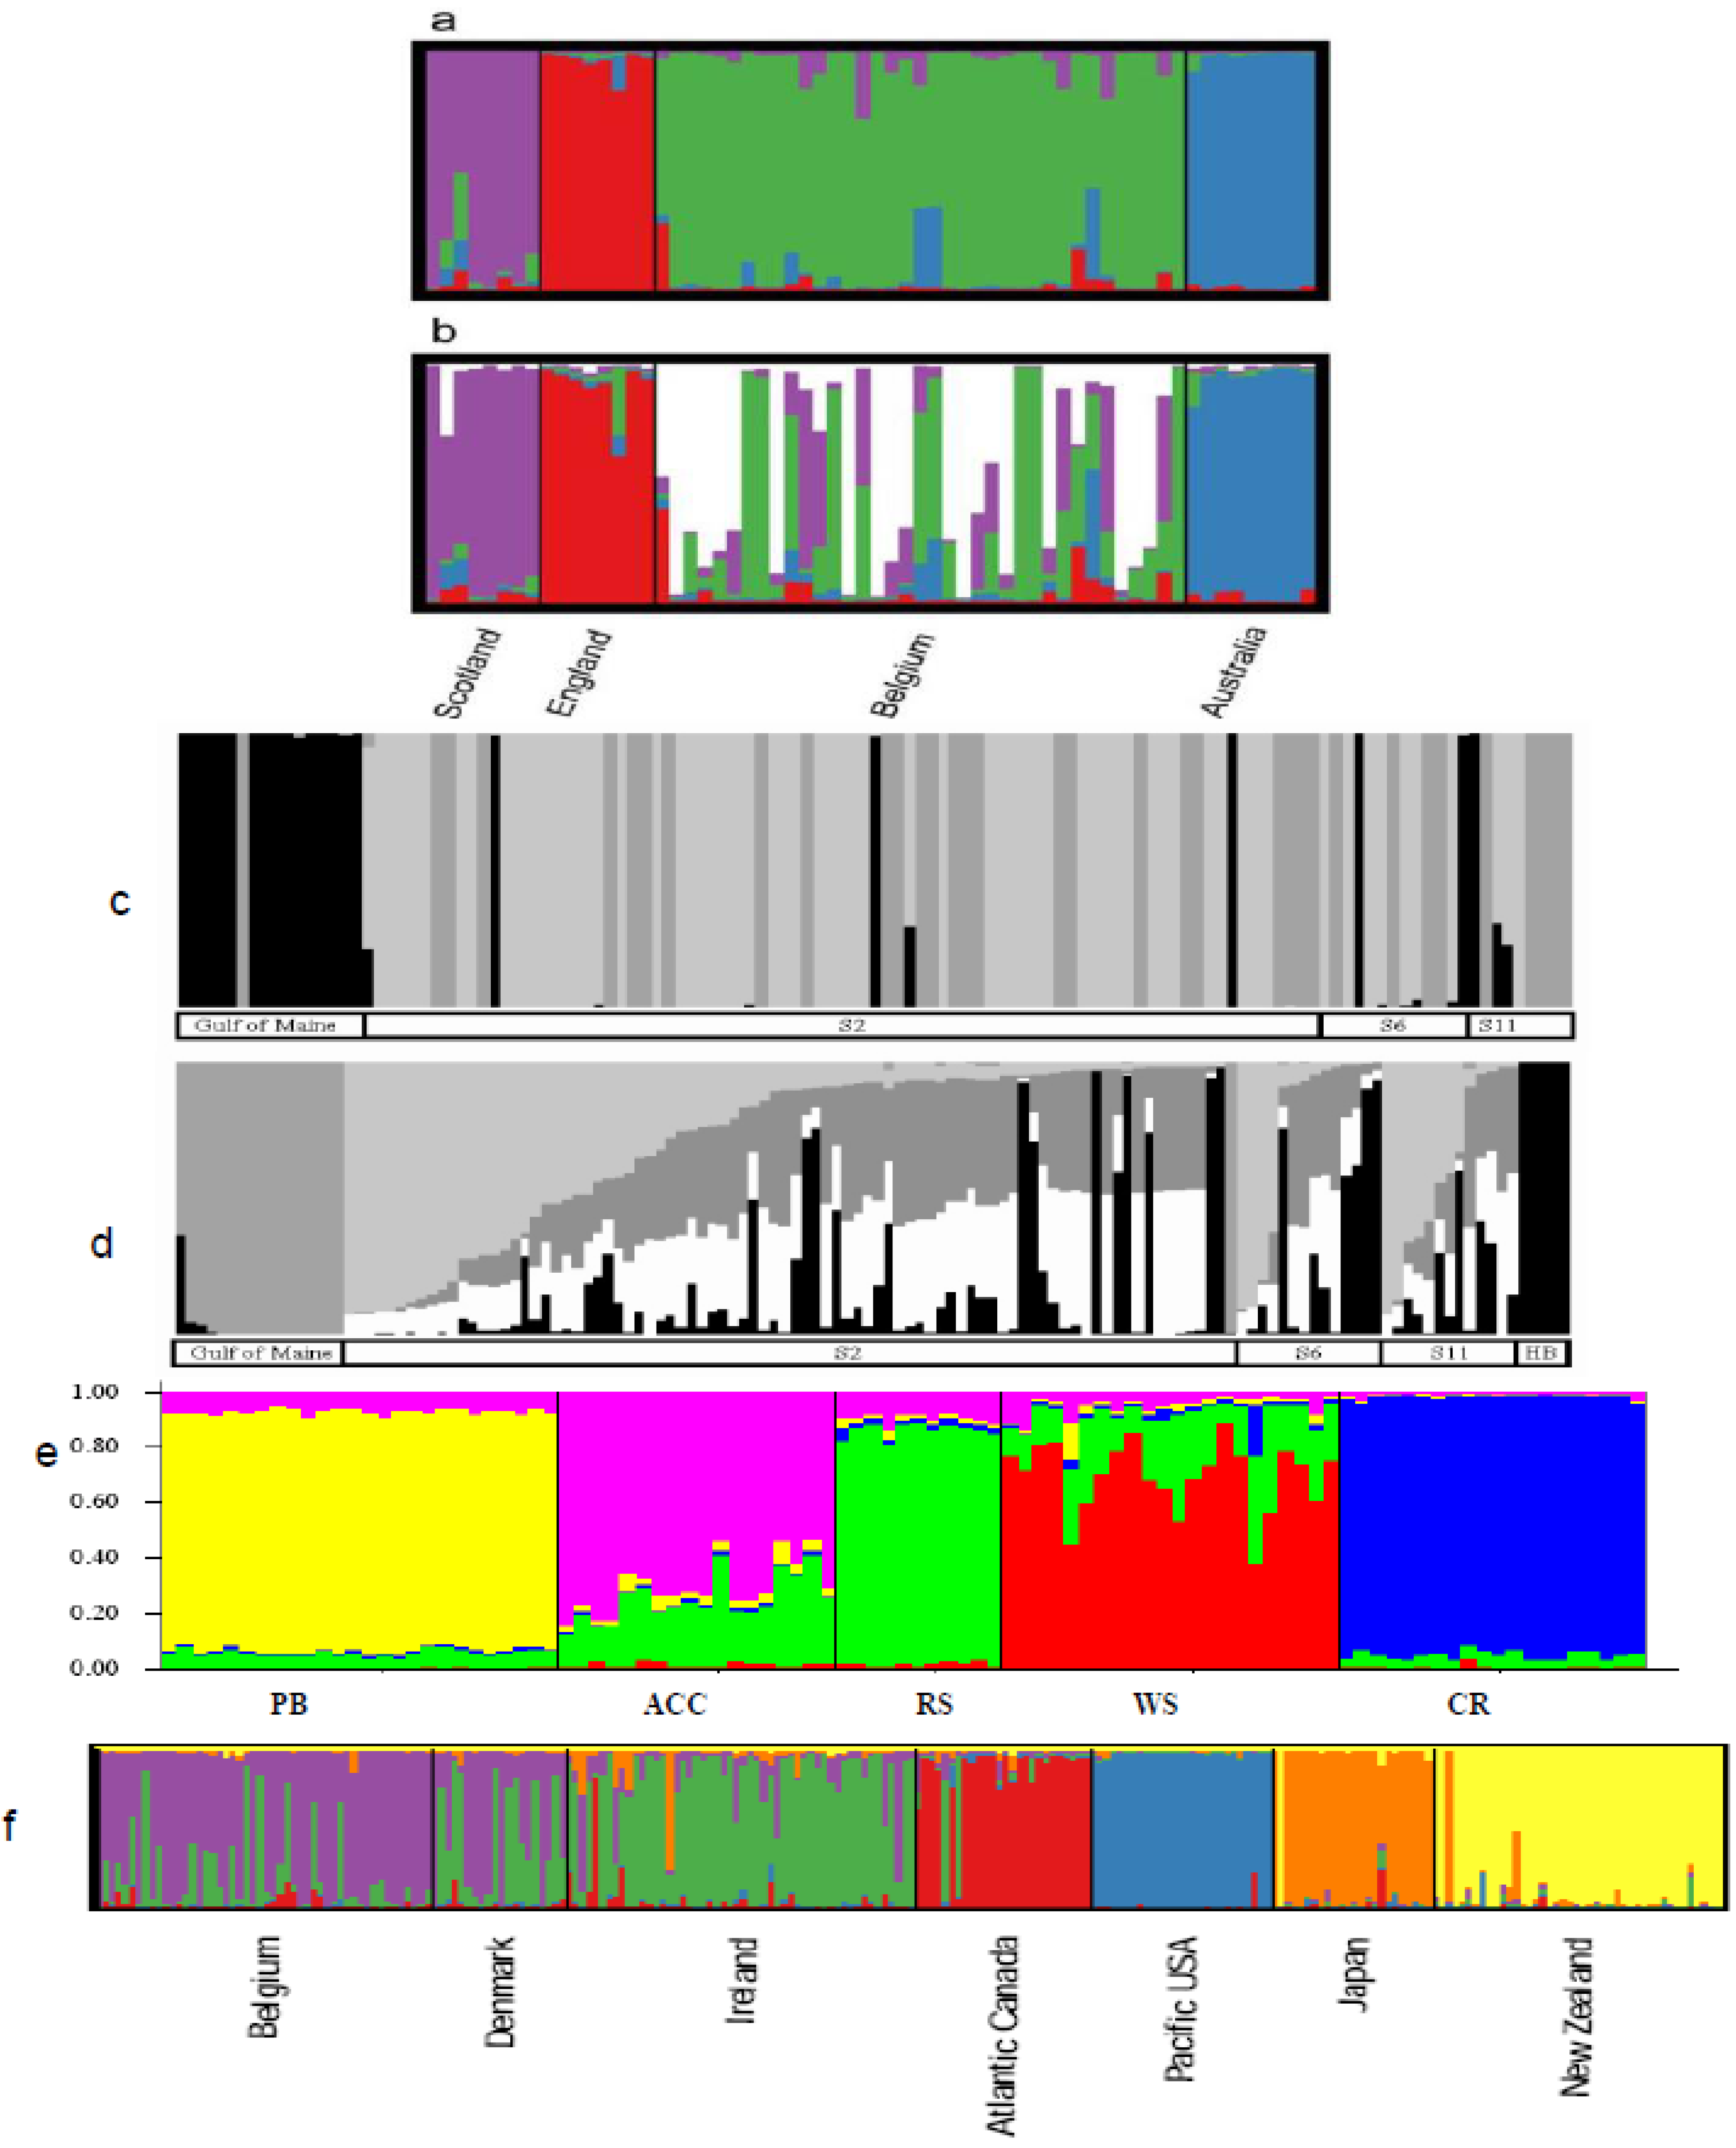
6.2. Population Structure

Molecular analysis of phytoplankton population structure has historically been inferred from physiological data determined from relatively few clones. This unfortunately is a naive approach because many physiological measurements have shown that no single clone of any phytoplankton species can be considered truly representative of that species [125]. For instance, within the domoic acid producing planktonic diatom Pseudo-nitzschia multistriata, only some of the specimens produce the toxin [126]. Even different F1 descendants from the same parental cell-lines reveal mixed toxicity levels. Despite this, physiological/biochemical measurements have been used to infer the existence of significant genetic diversity within and between phytoplankton populations [18,19]. These data have been used to speculate on hidden biodiversity and temporal and spatial structuring of genetic diversity or gene flow. Studies on phytoplankton population structure are perhaps 20 or more years behind those of other organisms because of this problem and also problems listed above. Isozyme analysis, performed for a few species, has revealed heterozygosity between some populations. In addition, fingerprinting analyses have shown that phytoplankton blooms are not clonal but are highly diverse with isolates being related by geographic origin.
The interaction of a species with environmental parameters is influenced by the genetic diversity at the population level of a species. Spatial and temporal partitioning of genetic diversity will occur as these interactions structure the ecosystem. Such structuring has seldom been measured in the marine planktonic community and studies of genetic diversity are virtually non-existent in pelagic ecosystems. All evidence of geographically isolated populations would be erased if we continue to assume that marine organisms with high dispersal capacities are genetically homogeneous over their entire range. Support for this assumption has come mainly from phenotypic comparisons based initially on net phytoplankton biogeographic studies and later on isozyme studies. Reason why studies of phytoplankton diversity and population structure have lagged behind those of other organisms is because of their small size and the lack of morphological markers, and the ability to bring into culture only a small part of the known biodiversity. The lack of knowledge of their breeding systems makes genetic or demographic studies difficult. Additional reasons are the logistical problems of collecting samples for long-term seasonal studies in open ocean environments or for doing fine-scale sampling.
Population structure in many microalgal species has been reconstructed from molecular data. Most molecular studies have shown that multiple isolates of a single species are related by geographic but sometimes the geographic groupings reveal polyphyletic or paraphyletic taxa [43,44,45,127,128,129]. Recognizing and separating polyphyletic or paraphyletic taxa can be controversial and are difficult taxonomic decisions to rectify. Often our species concept must be re-evaluated [7,22,125,129,130] along with a re-evaluation of the combined resolution that both molecular and morphological datasets can have [102,131].
Molecular tools provide the only means to estimate genetic diversity and gene flow, besides addressing the obvious questions about phylogenetic relationships and taxonomic affinity [132]. Spatial and temporal partitioning of genetic diversity can occur because species interactions with abiotic factors structure the ecosystem. It has long been assumed that marine organisms with high dispersal rates will be genetically homogeneous over their entire range, thus erasing traces of geographically isolated populations. Thus, such structuring has seldom been measured in the marine planktonic community. Allozyme (allelic variants of enzymes) analyses have generally shown the planktonic community to be homogeneous, whereas other molecular techniques have identified genetic structure within geographical regions. Physiological measurements detect ecological adaptations. The grouping of isolates from the same geographic region by using molecular markers that are amenable to tree building algorithms can provide strong evidence for population structure.
Two standard population genetic measurements for estimating genetic variation and gene flow are the Fst and Nm statistic [133,134,135]. FST is the proportion of the total genetic variance contained in a subpopulation (the S subscript) relative to the total genetic variance (the T subscript). Values can range from 0 to 1. High FST implies a considerable degree of differentiation among populations. The Nm statistic measures the numbers of individuals exchanged between two populations per generation, i.e., gene flow between populations. A high or low gene flow species can be identified by the distribution of genetic variation within and between populations. A high gene flow species is homogenous over its entire range; the low gene flow one not.
Medlin et al. [136] reviewed the diversity in marine phytoplankton as revealed by various fingerprinting methods and isozymes studies. In nearly every case, algal species isolated into culture were genetically distinct, and far more diversity and population structure was documented than previously imagined from species that were originally believed to be homogenously distributed along their entire range. Since that review, microsatellites have been developed for several microalgae [137,138,139,140,141,142,143,144,145]. These markers are far more powerful analytically and more sensitive than the earlier fingerprinting and isozyme techniques and can be used to calculate genetic diversity and gene flow between populations.
With gene flow statistics, we are able to estimate how much fragmentation of the populations has occurred and if they share a global or common gene pool even at a local level. All studies have shown high genetic diversity and highly fragmented populations in microalgae (Figure 4). In the program STRUCTUE as shown in all panels in Figure 4, each vertical bar along the horizontal axis represents the genotype of a single individual as measured from all of the microsatellite loci used to genotype the population. Alleles are color-coded for the population from which they are identified. If all alleles in one individual are from one population, then the vertical bar is a homogeneous color. If the alleles are from mixed populations, then the vertical bar is not homogeneous in color (the length of each colour represents the proportion of alleles from a population). In analyzing the data, one can allow the program to find its own grouping of genotypes or populations (without priors) or tell the program that there are a fixed number of populations (with priors). This is illustrated in Fig. 4a and b: showing the genotypic difference for each individual if there are four or five populations, respectively.

6.2.1. Case Studies

Rynearson and Armbrust [142,143,144,145] studied the genetic diversity of the diatom Ditylum brightwellii in the Puget Sound estuary. Four genetically distinct and highly diverse populations were identified. Population 1 developed blooms in early spring and occupied the entire estuarine system and also appeared in the fall bloom. In late spring, blooms in a different basin inside the estuary were replaced by a second population. Two other populations were identified inside the estuary in the fall: one in the upper basin of the estuary and the other in the lower basin. Population 1 has been identified repeatedly in both spring and fall blooms over the course of seven years. Populations 1 and 2 had identical SSU rDNA regions and their ITS regions differed by ~1%. Distinct physiological characteristics were associated with each genetically distinct population. Genetically distinct populations in the upper basin of the estuary were never found in the lower basin of the estuary despite a constant flushing rate from the upper basin to the lower basin.
In a study of more localized area, the flagellate Heterosigma akashiwo around Japan was composed of distinct populations and there was little evidence for gene flow between them even though tidal currents would permit natural dispersal of the cells from one area to another [141]. The global cosmopolitan coccolithophore, Emiliania huxleyi, is highly diverse [140] with disjunct global populations and little gene flow between populations in close geographic proximity (e.g., North Atlantic and Norwegian fjords). The Norwegian fjords were resampled 10 years apart and there was a shift in the genetic structure with only one genotype being shared by the population sampled in 1990 with the population sampled 10 years earlier. An estimate of the number of unique genotypes of E. huxleyi on a global basis was 9.4 × 10²⁰, a number scarcely believable when most oceanographers think that blooms are clonal and modelers only use one strain of a species in their models for climate change.
In the freshwater diatom, Sellaphora capitata, (a species in the Sellaphora pupula complex), microsatellite screening revealed that only a small number of alleles from water bodies in Scotland, England, Belgium and Australia could be found in all isolates [139], (Figure 4a,b), indicating a limited dispersal between populations, although all isolates could still interbreed.
A hierarchical study of genetic diversity has been made for Alexandrium tamarense (toxic North American clade) [87]. At ocean basin levels, West Atlantic (Bay of Fundy), East Atlantic (North Sea), West Pacific (Hiroshima Bay) each showed marked genetic diversity as well as significant genetic differences among these regions. Also the PSP toxin molecules differed markedly between the West Atlantic and East Atlantic populations. Within the North Sea basin, genetically differentiated subpopulations were recovered when studied with AFLP analysis but not with microsatellites. There were no significant differences in the toxin properties among the three subpopulations. It was proposed that significant genetic structure within subpopulations was a result of different year classes of cysts (zygotes) that had hatched to form these subpopulations.
In a study of Phaeocystis antarctica from Antarctic gyres, it was found that each gyre had its own native genotype, which was dispersed via the ACC into other gyres, except for the Weddell Sea (Figure 4e). Genotypes from other gyres entered the Weddell Sea and interbred with the native population but none of the genotypes from the Weddell Sea were released from the Weddell Sea [146]. It is certain that water can leave the Weddell Sea but unclear where ACC populations of Phaeocystis were dispersed or why they did not survive being transported into other gyres.
The planktonic cosmopolitan diatom Pseudo-nitzschia multiseries also contains genetically distinct and highly diverse and distinct gene pools between North American and European populations [137], whereas a morphologically similar cosmopolitan species, Pseudo-nitzschia pungens, is also highly diverse but with little population structure both spatially over similar geographic areas and temporally over two years [138]. A recent broader study of global populations has shown distinct populations corresponding to major oceanic water masses (147, Figure 4f). However, breeding studies from global isolates of this species show that all isolates can interbreed and thus this species is the only example of a protist so far tested with molecular and breeding techniques that shows a global gene pool with distinct population structure [93].
Figure 4. Comparison of population structure as determined by STRUCTURE of Sellaphora capitata over four geographical areas assuming (a) four populations and (b) five populations [139, reproduced courtesy of Elsevier], of Alexandrium tamarense as shown by MS (c) and AFLPs (d) analyses from the western north Atlantic (Gulf of Maine), eastern North Atlantic (S1,S6,S11), and western Pacific isolates (HB) [87 Alpermann, 2009], (e) of Pseudo-nitzschia pungens [147, reproduced courtesy of PNAS], and (f) of Phaeocystis antarctica from major gyres around the Antarctic (PB = Prydz Bay, ACC = Antarctic Circumpolar Current, RS = Amundsen Sea/Ross Sea, WS = Weddell Sea/Scotia Sea, CR = Coastal Region) [146].
Diversity 02 00973 g004
From Figure 4, it is obvious that not only lakes, but also oceans can harbor genetically distinct population structure with varying amounts of gene flow between closely and distantly separated populations.

6.3. Phylogeography

An objective framework with which to reconstruct the historical biogeographic distribution of taxa as well as recover recent dispersal events can be obtained by using molecular data [148] and to estimate divergence times [83,149]. It is possible to correlate present-day distributions of taxa with their biogeographic history by using the fossil record or geological events to date divergences between species. It is possible to correlate the divergence of taxa with palaeo-oceanographic and palaeo-climatic events to explain their present-day biogeographic distribution if there is no fossil record, and if the phylogenetic reconstruction of a group is congruent with a biogeographic history of the study area [127,128,148,149,150,151]. Phylogeography, a new field, has been termed for such studies reconstructing the biogeographic history of plants [152]. Dates for the opening and closing of oceans, for the movements of the continents relative to the water masses and for climate changes resulting in fluctuations in sea-level can be used for similar studies in microalgae communities [22,45,122,148]. But if the group has a detailed fossil record, e.g., the diatoms, coccolithophorids and the dinoflagellates, then these can be used for dating divergences [95,149,153,154]. Relative rates of evolution must be calculated [151,155] prior to estimating divergence times [156,157] to guarantee that fast-evolving species, which can bias the determination of divergence times, are eliminated from such interpretations.

6.3.1. Case Studies

Alexandrium  tamarense

John et al. [122] used a molecular clock to provide a hypothetical model for the biogeographic distribution of the A. tamarense ribotypes, because the present day relationships among the geographic clades exhibit vicariant events rather than dispersal events. They estimated that the average age of the genus Alexandrium is 77 Ma (million years ago) (Late Cretaceous), and no earlier than 119 Ma (mid Cretaceous); these dates do not conflict with the 105 Ma date for the closest dinoflagellates with similar tabulation and fossilizable cysts. At 120 Ma, climate and seawater temperature were much warmer than today. These continental areas were arranged such that there was a global circum-equatorial current within the Tethys Ocean. Between 65 and 55 Ma, two catastrophic events affected global biodiversity: the end Cretaceous mass extinction event [65 Ma); and the Late Paleocene thermal maximum [55 Ma), with a deep-sea temperature increase of 5–6 °C that killed benthic foraminifera and apparently caused planktonic microalgae, including dinoflagellates to proliferate. In the early Paleogene [40–65 Ma), the ocean basins were significantly rearranged as the Tethys Sea closed. Coastal regions became more heterogeneous in topological, hydrodynamic and climatic conditions, thus promoting regional differences.
Figure 5. Phylogeographic representation of the distribution of geographic ribotypes in the Alexandrium tamarense species complex at 5 MA (a) and today (b). Toxic Temperate Asian ribotype = yellow stars on map, yellow triangle in tree; Non-toxic Western European ribotype = black stars on map, black triangle on tree; North American ribotype = white pinnacles on map, white triangle on tree; Mediterranean ribotype = red starbursts on map red triangle on tree; Tropical Asian = black pinnacles on map, blue-dotted box on tree. Redrawn from [122] with updated modern distributions.
Diversity 02 00973 g005
Under these mid Cenozoic conditions, Alexandrium likely diverged into several taxa. The A. tamarense species complex likely diverged at the early Neogene [23 Ma), but no earlier than the late Paleogene [45 Ma). A global distribution of planktonic species was possible via a connection between the eastern Indian Ocean, Tethys and the Pacific Ocean, with counter currents for anti-clockwise distributions. Given mid Cenozoic paleoclimatic and geological changes over this time frame, John et al. [122] proposed the following scenario to account for the modern distribution of strains within the Alexandrium tamarense species complex. Their scenario starts with a globally distributed ancestral population, which splits first into eastern and western Pacific populations as a response to a relatively short but deep glacial maximum ca. 23 Ma. The eastern Pacific population was connected to Atlantic populations through the Central American Seaway and its counter currents, whereas the western Pacific population was connected to eastern Atlantic populations through the Tethys Sea (Figure 5a). The heterogeneous climatic and oceanic conditions between 40–65 Ma likely promoted genetic differentiation within the A. tamarense species complex. When the Tethys Ocean closed, the western Pacific population diverged into TA (yellow stars in Figure 5a) and WE clades (black stars in Figure 5a). Relict populations of the TA clade can be found today in the Western Mediterranean Sea. As the Isthmus of Panama uplifted, ancestral populations in the sub-tropical Atlantic (red starbursts in Figure 5a) were separated from those in the eastern Pacific (NA clade: white pinnacles in Figure 5). The closing of Tethys, the formation of the Mediterranean Sea, and the uplift of the Panama Isthmus created significant changes in circulation and paleoclimate. Around 5 Ma, the Mediterranean Sea repeatedly dried up and was refilled by tropical and sub–tropical Atlantic water with sub–tropical Atlantic A. tamarense populations. Eventually, indigenous sub-tropical Atlantic populations became extinct because of unfavourable environmental conditions, leaving relict populations, the ME clade (starbursts in Figure 5b), in the Mediterranean. Relict populations of its ancient sister group of the A. tamarense species complex can be found in tropical waters (black pinnacles in Figure 5b). It was hypothesized from sequence data the appearance of the NA clade in the North Sea and along the Norwegian coast was a recent introduction via the Gulf stream from the eastern side of North America [122] but we now know from microsatellite data that the introduction to the north sea came from the Arctic, likely at the same time that the species was introduced from the Arctic into the eastern side of North America [87]. Both introductions arose from Pacific Ocean populations.

Phaeocystis 

Phaeocystis Lagerheim is a cosmopolitan bloom-forming alga that is often recognized both as a nuisance alga and an ecologically important member of the phytoplankton [see review in 150]. Phaeocystis has a polymorphic life cycle with both colonial and flagellated cells. The colonial stage, with cells very loosely interconnected and enclosed in a thin skin is most easily recognized, although some new species may form mucilaginous colonies or do not seem to make a colonial stage. Because it is a gelatinous microalga, it has no fossil record and we have inferred the biogeographic history of its species using the molecular clock of the haptophytes calibrated with the coccolithophorid algae.
Phaeocystis is one of the first divergences in the Prymnesiales in the SSU rDNA tree. Unicellular species are the first to diverge following by the divergence of the larger colonial species, which fall into two groups. The warm water Phaeocystis species complex [158] diverged from the cold water species just after 30 Ma, which coincides with the time that the Drake Passage opened and the ACC system was formed (Figure 6). This would have effectively isolated ancestral populations in the Antarctic sufficiently to allow them to speciate from their warm water ancestors. The separation of the polar species P. pouchetii from P. antarctica is approximately 15 Ma, which coincides with a major warming event in the world’s oceans at this time. Before this time populations must have been able to cross the equator from the south to the north because water temperatures were cool enough to allow survival, but this warming event separated the two polar populations to allow them to diverge into the two species existing today at the poles. Similar results have been found for foraminifera. Isolates from the ACC gradually seed the continental gyres of the Antarctic Ocean to establish a cosmopolitan population of P. antarctica around the Antarctic.
Figure 6. Divergence of Phaeocystis spp.: A molecular tree drawn proportional to time and the temperature of Antarctic surface waters since the Cretaceous, redrawn from Crame [159]. Arrows mark the cooling event that opened the Drake Passage to commence the ACC and the warming event, which allowed Antarctic strains of Phaeocystis to pass the equator to establish themselves into the Arctic, followed by a cooling event, which isolated the two populations allowing them to speciate.
Diversity 02 00973 g006

6. Conclusions

Molecular techniques can enhance our understanding of phytoplankton biodiversity in an environment as vast as the world's oceans and in organisms so tiny that they can only be reliably counted using flow cytometry. Phylogenetic diversity can be recovered without dependence on more traditional, often biased, preservation or culturing methods. Molecular techniques can reconstruct the phylogenetic history of a group and can document the spatial and temporal structuring of genetic diversity, i.e., biodiversity below the species level. A variety of molecular tools may need to be invoked in order to find the resolution needed to separates species, populations or individuals. The incorporation of all facets of the biology of the phytoplankton is essential to formulate a multidisciplinary definition of a species and to reconstruct its phylogenetic history. The potential for recognizing genetic individuality at the DNA sequence level is only just being realized and its use in clustering individuals into biologically meaningful groups reflecting their overall relatedness will provide new avenues for understanding the role that phytoplankton play in structuring the marine ecosystem in both time and space. Phytoplankton populations are not homogeneous but are highly fragmented and the gene flow between these fragmented populations is highly variable. This structure to the marine ecosystem has been unexpected and how it is maintained over time is unknown.

Acknowledgements

LKM would like to acknowledge G. Casteleyn for use of her structure analysis from Pseudo-nitzschia pungens.

References and Notes

  1. Ormond, R.F.; Gage, J.D.; Angel, M.V. Marine Biodiversity, Patterns and Processes; Cambridge University Press: Cambridge, UK, 1987; p. 449. [Google Scholar]
  2. Moestrup, Ø. Further studies of presumedly primitive green algae, including the description of Pedinophyceae class. nov. and Resultor gen. nov. J. Phycol. 1991, 27, 119–133. [Google Scholar]
  3. Andersen, R.A.; Saunders, G.W.; Paskind, M.P.; Sexton, J.P. Ultrastructure and 18S rRNA gene sequence for Pelagomonas calceolata gen. et sp. nov. and the description of a new algal class, the Pelagophyceae classis nov. J. Phycol. 1993, 29, 701–715. [Google Scholar]
  4. Guillou, L.; Chretiennot-Dinot, M-J.; Medlin, L.K.; Claustre, H.; Loiseaux-De Goer, S; Vaulot, D. Bolidomonas, a new genus with two species belonging to a new algal class, The Bolidophyceae. J. Phycol. 1999, 35, 368–381. [Google Scholar]
  5. Kawachi, M.; Inouye, I.; Honda, D.; O’Kelly, C.J.; Bailey, J.C.; Bidigare, R.R.; Andersen, R.A. The Pinguiophyceae classis nova, a new class of chromophyte algae whose members produce large amounts of omega-3 fatty acids. Phycol. Res. 2002, 50, 31–47. [Google Scholar]
  6. Not, F.; Simon, N.; Biegala, I.C.; Vaulot, D. Application of fluorescent in situ hybridisation coupled with tyramide signal amplification (FISH-TSA) to assess eukaryotic picoplankton composition. Aquat. Microbial. Ecol. 2002, 28, 157–166. [Google Scholar]
  7. Gosling, E.M. Speciation and species concepts in the marine environment. In Genetics and Evolution of Aquatic Organisms; Beaumont, A.R., Ed.; Chapman & Hall: London, UK, 1994; pp. 1–15. [Google Scholar]
  8. Waterbury, J.B.; Watson, S.W.; Guillard, R.R.L.; Brand, L.E. Widespread occurrence of a unicellular, marine planktonic cyanobacterium. Nature London 1979, 345, 63–65. [Google Scholar]
  9. Waterbury, J.B.; Watson, S.W.; Valois, F.W.I.; Franks, D.G. Biological and ecological characterization of the marine unicellular cyanobacterium Synechococcus, in photosynthetic picoplankton. Can. Bull. Fish. Aquat. Sci. 1986, 214, 71–120. [Google Scholar]
  10. Chisholm, S.W.; Olson, R.J.; Zettler, E.R.; Goericke, R.; Waterbury, J.; Welschmeyer, N. A novel free-living prochlorophyte abundant in the oceanic euphotic zone. Nature 1988, 334, 340–343. [Google Scholar]
  11. Moon-van der Staay, S.Y.; van der Staay, G.W.M.; Guillou, L.; Claustre, H.; Medlin, L.K.; Vaulot, D. Abundance and diversity of Prymnesiophyceae in the picoplankton community from the equatorial Pacific Ocean inferred from 18S rDNA sequences. Limnol. Oceanogr. 2000, 45, 98–109. [Google Scholar]
  12. Palumbi, S.R. Marine speciation on a small planet. TREE 1992, 7, 114–118. [Google Scholar]
  13. Brand, L.E. Genetic variability and spatial patterns of genetic differentiation in the reproductive rates of the marine coccolithophores Emiliania huxleyi and Gephyrocapsa oceanica. Limnol. Oceanogr. 1982, 27, 236–245. [Google Scholar]
  14. Brand, L.E. Review of genetic variation in marine phytoplankton species and the ecological implications. Biol. Oceanogr. 1989, 6, 397–409. [Google Scholar]
  15. Gallagher, J.C. Population genetics of Skeletonema costatum (Bacillariophyceae), in Narragansett Bay. J. Phycol. 1980, 16, 464–474. [Google Scholar]
  16. Hedgecock, D. Population genetics of marine organisms. US GLOBEC News 1994, 6, 1-3, 11. [Google Scholar]
  17. Carroll, S.P.; Hendry, A.P; Reznick, D.N.; Fox, C.W. Evolution on ecological timescales. Funct. Ecol. 2007, 21, 387–393. [Google Scholar]
  18. Muyzer, G.; De Wall, E.C.; Uitterlinden, A.G. Profiling on complex microbial populations by denaturing gradient gel electrophoresis analysis by polymerase chain reaction-amplified genes coding for 16S rRNA. Appl. Env. Microbiol. 1993, 59, 695–700. [Google Scholar]
  19. Schwieger, F.; Tebbe, C.C. A new approach to utilize PCR-single-strand-conformation polymorphism for 16S rRNA gene-based microbial community analysis. Appl. Environ. Microbiol. 1998, 64, 4870–4876. [Google Scholar]
  20. Gillet, E.M. Which DNA Marker for Which Purpose? Final Compendium of the Research Project Development, optimisation and validation of molecular tools for assessment of biodiversity in forest trees in the European Union DGXII Biotechnology FW IV Research Programme Molecular Tools for Biodiversity; University of Groningen: Gronningen, NL, 1999; Available online: http://webdoc.gwdg.de/ebook/y/1999/whichmarker/index.htm (accessed on 15 July 2010).
  21. Karp, A.; Isaac, P.G.; Ingram, D.S. Molecular Tools for Studying Biodiversity; Chapman & Hall: London, UK, 1998; p. 498. [Google Scholar]
  22. Medlin, L.K.; Barker G.L.A., G.L.A.; Baumann, M.; Hayes, P.K.; Lange, M. Molecular biology and systematics. In The Haptophyte Algae; Green, J.C., Leadbeater, B.S.C., Eds.; Clarendon Press: Oxford, UK, 1994; pp. 393–412. [Google Scholar]
  23. Medlin, L.K.; Sáez, A.G.; Young, J.R. Did mixotrophy prevent phytoplankton extinctions across the K/T boundary? Mar. Micropaleon 2007, 67, 69–86. [Google Scholar]
  24. Woese, C.R. Bacterial evolution. Microbiol. Rev. 1987, 51, 221–271. [Google Scholar]
  25. Medlin, L.K.; Sato, S.; Mann, D.G.; Kooistra, W.C.H.F. Molecular evidence confirms sister relationship of Ardissonea, Climacosphenia, and Toxarium within the bipolar centric diatoms Bacillariophyta, Mediophyceae, and cladistic analyses confirm that extremely elongated shape has arisen twice in the diatoms. J. Phycol. 2008, 44, 1340–1348. [Google Scholar]
  26. Watanabe, K.; Kodama, Y.; Harayama, S. Design and evaluation of PCR primers to amplify bacterial 16S ribosomal DNA fragments used for community fingerprinting. J. Microbiol. Methods 2001, 44, 253–262. [Google Scholar]
  27. Lami, R.; Ghiglione, J-F.; Desdevieses, Y.; West, N.; Lebaron, P. Annual patterns of presence and activity of marine bacteria monitored by 16S rDNA-16SrRNA fingerprints in the coastal NW Mediterranean Sea. Aq. Micro. Ecol. 2009, 54, 199–210. [Google Scholar]
  28. Sogin, M.L.; Morrison, H.G.; Huber, J.A.; Welch, D.M.; Huse, S.M.; Neal, P.R.; Arieta, J.M.; Herndl, G.J. Microbial diversity in the deep sea and the underexplored “rare biosphere”. Proc. Natl. Acad. Sci. USA 2006, 103, 12115–12120. [Google Scholar]
  29. Patrick, R. Use of Algae, Especially Diatoms, in the Assessment of Water Quality; American Society for Testing Materials, Special Technical Publication 528; ASTM International: West Conshohocken, PA, USA, 1973; pp. 76–95. [Google Scholar]
  30. Patrick, R.; Hohn, M.H.; Wallace, J.H. A new method for determine the pattern of the diatom flora. Not. Nat. 1954, 259, 1–12. [Google Scholar]
  31. McIntyre, C.D.; Overton, W.S. Distributional pattern in assemblages of attached diatoms from Yaquina Estuary, Oregon. Ecology 1987, 52, 758–777. [Google Scholar]
  32. Evans, K.M.; Wortley, A.H.; Mann, D.G. An assessment of potential Diatom “Barcode” Genes: coxI, rbcL, 18S and ITS rDNA, and their effectiveness in determining relationships in Sellaphora (Bacillariophyta). Protist 2007, 158, 349–364. [Google Scholar]
  33. Moniz, M.B.J.; Kaczmarska, I. Barcoding diatoms, is there a good marker? Mol. Ecol. Res. 2009, 1, 65–74. [Google Scholar]
  34. Moniz, M.B.J.; Kaczmarska, I. Barcoding of diatoms, nuclear encoded ITS revisited. Protist 2010, 161, 7–34. [Google Scholar]
  35. Robba, L.; Russell, S.J.; Barker, G.; Broadie, J. Assessing the use of the mitochondrial Cox1 marker for use in DNA barcoding of Red Algae (Rhodophyta). Am J. Bot. 2006, 93, 1101–1108. [Google Scholar]
  36. McDevit, D.C.; Saunders, G.W. A DNA barcode examination of the Laminariaceae (Phaeophyceae) in Canada reveals novel biogeographical and evolutionary insights. Phycologia 2010, 49, 235–248. [Google Scholar]
  37. Amann, R.I. In situ identification of micro-organisms by whole cell hybridisation with rRNA-targeted nucleic acid probes. In Molecular Microbiology and Ecology Manual 3.3.6; Akkermans, A.D.L., van Elsas, J.D., de Brujin, F.J., Eds.; Kluwer Academic Publishers: Dordrecht, the Netherlands, 1995; pp. 1–15. [Google Scholar]
  38. Amann, R.I.; Ludwig, W.; Schleifer, K.-H. Phylogenetic identification and in situ detection of individual microbial cells without cultivation. Microbiol. Rev. 1995, 95, 143–169. [Google Scholar]
  39. Stahl, D.A.; Amann, R.I. Development and application of nucleic acid probes. In Nucleic Acid Techniques in Bacterial Systematics; Stackebrandt, E., Goodfellow, M., Eds.; John Wiley & Sons Ltd.: Chichester, UK, 1991; pp. 205–248. [Google Scholar]
  40. Knauber, D.C.; Berry, E.S.; Fawley, M.W. Ribosomal RNA-based oligonucleotide probes to identify marine green ultraplankton. J. Euk. Microbiol. 1996, 43, 89–94. [Google Scholar]
  41. Simon, N.; Lebot, N.; Marie, D.; Partensky, F.; Vaulot, D. Fluorescent in–situ hybridisation with rRNA-targeted oligonucleotide probes to identify small phytoplankton by flow cytometry. Appl. Environ. Microbiol. 1995, 61, 2506–2513. [Google Scholar]
  42. Simon, N.; Campbell, L.; Ornolfsdottir, E.; Groben, E.; Guilou, L.; Lange, M.; Medlin, L.K. Oligonucleotide probes for the identification of three algal groups by dot blot and fluorescent whole cell hybridisation. J. Euk. Micobiol. 2000, 47, 76–84. [Google Scholar]
  43. Scholin, C.A.; Anderson, D.M. Identification of group- and strain-specific genetic markers for globally distributed Alexandrium (Dinophyceae). I. RFLP analysis of SSU rRNA genes. J. Phycol. 1994, 29, 209–216. [Google Scholar]
  44. Scholin, C.A.; Hallegraeff, G.M.; Anderson, D.M. Identification of group- and strain-specific genetic markers for globally distributed Alexandrium (Dinophyceae). II. Sequence analysis of a fragment of the LSU rRNA gene. J. Phycol. 1994, 30, 999–1011. [Google Scholar]
  45. Scholin, C.A.; Hallegraeff, G.M.; Anderson, D.M. Molecular evolution of the Alexandrium tamarense species complex (Dinophyceae), dispersal in the North American and West Pacific regions. Phycologia 1995, 34, 472–485. [Google Scholar]
  46. Miller, P.E.; Scholin, C.A. Identification of cultured Pseudo-nitzschia Bacillariophyceae, using species-specific LSU targeted fluorescent probes. J. Phycol. 1996, 32, 646–655. [Google Scholar]
  47. Medlin, L.K.; Lange, M.; Edvardsen, B.; Larsen, A. Cosmopolitan flagellates and their genetic links. In The Flagellate Algae; Green, J.C., Leadbeater, B.S.C., Eds.; Francis and Taylor: London, UK, 2000; pp. 288–308. [Google Scholar]
  48. Simon, N.; Brenner, J.; Edvardsen, B.; Medlin, L.K. The identification of Chrysochromulina and Prymnesium species Haptophyta, Prymnesiophyceae, using fluorescent or chemiluminescent oligonucleotide probes, a means for improving studies on toxic algae. Eur. J. Phycol. 1997, 32, 393–401. [Google Scholar]
  49. Lange, M.; Simon, N.; Guillou, L.; Vaulot, D.; Amann, R.; Ludwig, W.; Medlin, L.K. Identification of the Class Prymnesiophyceae and the genus Phaeocystis with rRNA-targeted nucleic acid probes detected by flow cytometry. J. Phycol. 1996, 32, 858–868. [Google Scholar]
  50. John, U.; Cembella, A.; Hummert, C.; Elbrächter, M.; Groben, R.; Medlin, L.K. Discrimination of the toxigenic dinoflagellate species Alexandrium tamarense and Alexandrium ostenfeldii in co-occurring natural populations from Scottish Coastal waters. Eur. J. Phycol. 2003, 38, 25–40. [Google Scholar]
  51. Kemp, P.F.; Lee, S.; LaRoche, J. Estimating the growth rate of slowly growing marine bacteria from RNA content. Appl. Environ. Microbiol. 1993, 59, 2594–2601. [Google Scholar]
  52. Schönhuber, W.; Fuchs, B.; Juretschko, S.; Amann, R. Improved sensitivity of whole-cell hybridisation by the combination of horseradish perxidase-labeled oligonucleotides and Tyramide Signal Amplification. Appl. Environ. Microbiol. 1997, 63, 3268–3273. [Google Scholar]
  53. Schönhuber, W.; Zarda, B.; Eix, S.; Rippka, R.; Herdmann, M.; Ludwig, W.; Amann, R. In situ identification of cyanobacteria with horseradish peroxidise-labeled, rRNA-targeted oligonucleotide probes. Appl. Environ. Microbiol. 1999, 65, 1259–1267. [Google Scholar]
  54. West, N.J.; Schönhuber, W.A.; Fuller, N.; Amann, R.I.; Rippka, R.; Post, A.; Scanlan, D. Closely related Plochlorococcus genotypes show remarkably different depth distributions in two oceanic regions as revealed by in situ hybridisation using 16SrRNA-targeted oligonucleotides. Microbiology 2001, 147, 1731–1744. [Google Scholar]
  55. Biegala, I.C.; Not, F.; Vaulot, D.; Simon, N. Quantitative assessment of picoeukaryotes in the natural environment by using taxon-specific oligonucleotide probes in association with tyramide signal amplification-fluorescence in situ hybridisation and flow cytometry. Appl. Environ. Microbiol. 2003, 69, 5519–5529. [Google Scholar]
  56. Not, F.; Latasa, M.; Marie, D.; Cariou, T.; Vaulot, D.; Simon, N. A single species, Micromonas pusilla (Prasinophyceae), dominates the eukaryotic picoplankton in the western English channel. Appl. Environ. Microbiol. 2004, 70, 4063–4072. [Google Scholar]
  57. Not, F.; Valentin, K.; Romari, K.; Massana, R.; Vaulot, D.; Medlin, L.K. Picobiliphytes: A marine picoplanktonic algal group with unknown affinities to other eukaryotes. Science 2007, 315, 253–255. [Google Scholar]
  58. Biegala, I.C.; Kennaway, G.; Alverca, E.; Lennon, J.F.; Vaulot, D.; Simon, N. Identification of bacteria associated with dinoflagellates (Dinophyceae), Alexandrium spp. using tyramide signal amplification-fluorescent in situ hybridization and confocal microscopy. J. Phycol. 2002, 38, 404–411. [Google Scholar]
  59. Alverca, E.; Biegala, I.C.; Kennaway, G.M.; Lewis, J.; Franca, S. In situ identification and localization of bacteria associated with Gyrodinium instriatum (Gymnodiniales, Dinophyceae) by electron and confocal microscopy. Eur. J. Phycol. 2002, 37, 523–530. [Google Scholar]
  60. Galluzzi, L.; Penna, A.; Bertozzini, E.; Vila, M.; Garces, E.; Magnani, M. Development of a real-time PCR assay for rapid detection and quantification of Alexandrium minutum (a Dinoflagellate). Appl. Environ. Microbiol. 2004, 70, 1199–1206. [Google Scholar]
  61. Wallner, G.; Amann, R.; Beisker, W. Optimizing fluorescent in situ hybridisation with rRNA targeted probes for flow cytometric identification of microorganisms. Cytometry 1993, 14, 136–143. [Google Scholar]
  62. Manz, W.; Amann, R.; Ludwig, W.; Wagner, M.; Schliefer, K-H. Phylogenetic oligodeoxynucleotide probes for the major subclasses of proteobacteria, problems and solutions. Syst. Appl. Microbiol 1992, 15, 593–600. [Google Scholar]
  63. Giovanonni, S.J.; Britschgi, T.; Moyer, C.L.; Field, K.G. Genetic diversity in Sargasso Sea bacterioplankton. Nature 1990, 345, 60–63. [Google Scholar]
  64. Pace, N.R.; Stahl, D.A.; Lane, D.J; Olsen, G.J. The analysis of microbial populations with ribosomal RNA sequences. Adv. Microb. Ecol. 1986, 9, 1–55. [Google Scholar]
  65. Rehnstam, A-S.; Bäckman, S.; Smith, D.C.; Azam, F.; Hagström, Å. Blooms of sequence-specific culturable bacteria in the sea. FEMS Microbiol. Ecol. 1993, 102, 161–166. [Google Scholar]
  66. Metfies, K.; Hujic, S.; Lange, M.; Medlin, L.K. Electrochemical detection of the toxic dinoflagellate A. ostenfeldii with a DNA Biosensor. Biosen. Bioelec 2005, 20, 1349–1357. [Google Scholar]
  67. Murphy, L.S.; Guillard, R.R.L. Biochemical taxonomy of marine phytoplankton by enzyme electrophoresis. I. The centric diatoms Thalassiosira pseudonana Hasle Heimdal and Thalassiosira fluviatilis Hustedt. J. Phycol. 1976, 12, 9–13. [Google Scholar]
  68. Brand, L.E.; Murphy, L.S.; Guillard, R.R.L.; Lee, H.-T. Genetic variability and differentiation in the temperature niche component of the diatom Thalassiosira pseudonana. Mar. Biol. 1981, 62, 103–110. [Google Scholar]
  69. Hasle, G.R. Some fresh water and brackish water species of the diatom genus Thalassiosira Cleve. Phycologia 1978, 17, 263–292. [Google Scholar]
  70. Hasle, G.R. The marine planktonic diatom Thalassiosira oceanica sp. nov. and T. parthenia. J. Phycol. 1983, 19, 220–229. [Google Scholar]
  71. Cembella, A.D.; Taylor, F.J.R. Electrophoretic variability within the Protogonyaulax tamarensis/catenella species complex, Pyridine linked dehydrogenases. Biochem. Sys. Ecol. 1986, 143, 311–323. [Google Scholar]
  72. Cembella, A.D.; Taylor, F.J.R.; Therriault, J.C. Cladistic analysis of electrophoretic variants within the toxic dinoflagellate genus Protogonyaulax. Bot. Mar. 1988, 31, 39–51. [Google Scholar]
  73. Hayhome, B.A.; Anderson, D.M.; Kulis, D.M.; Whitten, D.J. Variation among congeneric dinoflagellates from the northeastern United States and Canada. I. Enzyme electrophoresis. Mar. Bio. 1989, 101, 427–435. [Google Scholar]
  74. Hayhome, B.A.; Whitten, D.J.; Harkins, K.R.; Pfiester, L.A. Intraspecific variation in the dinoflagellate Peridinium volzii. J. Phycol. 1987, 23, 573–580. [Google Scholar]
  75. Chinain, M.; Germain, M.; Sako, Y.; Pauillac, S.; Legrand, A.-M. Intraspecific variation in the dinoflagellate Gambierdiscus toxicus Dinophyceae, I. Isozyme analysis. J. Phycol. 1997, 33, 36–43. [Google Scholar]
  76. Sako, Y.; Kim, C.H.; Ninomiya, H.; Adachi, M.; Ishida, Y. Isozyme and cross analysis of mating populations in the Alexandrium catenella/tamarense species complex. In Toxic Marine Phytoplankton; Graneli, E., Sundstrom, B., Edler, L., Anderson, D.M., Eds.; Elsevier: New York, NY, USA, 1990; pp. 320–329. [Google Scholar]
  77. Gallagher, J.C. Physiological variation and electrophoretic banding patterns of genetically different seasonal populations of Skeletonema costatum (Bacillariophyceae). J. Phycol. 1982, 18, 148–162. [Google Scholar]
  78. Sarno, D.; Kooistra, W.H.C.F.; Medlin, L.K.; Percopo, I.; Zingone, A. Diversity in the genus Skeletonema (Bacillariophyceae), II. An assessment of the taxonomy of S. costatum-like species with the description of four new species. J. Phycol. 2005, 41, 151–176. [Google Scholar]
  79. Sarno, D.; Kooistra, W.H.C.F.; Hargraves, P.E.; Zingone, A. Diversity in the genus Skeletonema Bacillariophyceae, III. Phylogenetic position and morphology of Skeletonema costatum and Skeletonema grevillei, with the description of Skeletonema ardens sp. nov. J. Phycol. 2007, 43, 156–170. [Google Scholar]
  80. Kooistra, W.H.C.F.; Sarno, D.; Balzano, S.; Gu, H.; Andersen, R.A.; Zingone, A. Global diversity and biogeography of Skeletonema species (Bacillariophyta). Protist 2008, 59, 177–193. [Google Scholar]
  81. Hadrys, H.; Balick, M.; Schierwater, B. Application of random amplified polymorphic DNA RAPD. Mol. Ecol. 1992, 1, 55–63. [Google Scholar]
  82. Lynch, M.; Milligan, G. Analysis of population genetic structure with RAPD markers. Mol. Ecol. 1994, 3, 91–99. [Google Scholar]
  83. Boalch, C.J.; Haskard, K; Hallegraeff, G.M. Genetic variation among strains of the toxic dinoflagellate, Gymnodinium catenatum (Dinophyceae). J. Phycol. 1999, 35, 356–367. [Google Scholar]
  84. Barker, G.L.A.; Green, J.C.; Hayes, P.K.; Medlin, L.K. Preliminary results using the RAPD analysis to screen bloom populations of Emiliania huxleyi (Haptophyta). Sarsia 1995, 79, 301–306. [Google Scholar]
  85. Vos, P.; Hogers, R.; Bleeker, M.; Reijans, M.; Van De Lee, T.; Hornes, M.; Frijters, A.; Pot, J.; Peleman, J.; Kuiper, M.; Zabeau, M. AFLP: a new technique for DNA fingerprinting. Nucl. Acid. Res. 1995, 23, 4407–4414. [Google Scholar]
  86. John, U.; Groben, R.; Beszteri, B.; Medlin, L.K. Utility of Amplified Fragment Length Polymorphisms (AFLP) to analyse genetic structures within the Alexandrium tamarense species complex. Protist 2004, 155, 169–179. [Google Scholar]
  87. Alpermann, T. Evolutionary Ecology of Alexandrium (Dinophyceae) with Special Emphasis on Genotypic and Phenotypic Variation in the Toxigenic Species A. tamarense. PhD Thesis, University of Bremen, Bremen, Germany, 2009. [Google Scholar]
  88. Gaebler, S.; Hayes, P.K.; Medlin, L.K. Methods used to reveal genetic diversity in the colony forming prymnesiophyte Phaeocystis antarctica–preliminary results. Biogeochemistry 2007, 83, 19–27. [Google Scholar]
  89. Burke, T.; Hanotte, O.; Bruford, M.W. Multilocus and single locus minisatellite analysis in population biological studies. In DNA Fingerprinting, Approaches and Applications; Burke, T., Dolf, G., Jeffreys, A.J., Wolff, R., Eds.; Birkhaeuser: Basel, Switzerland, 1991; pp. 154–168. [Google Scholar]
  90. Wright, J.M.; Bentzen, P. Microsatellites, genetic markers for the future. Rev. Fish. Biol. Fish. 1994, 4, 384–388. [Google Scholar]
  91. Doyle, R.W. Upwelling, clone selection and the characteristic shape of nutrient uptake curves. Limnol. Oceanogr. 1975, 20, 487–489. [Google Scholar]
  92. Partensky, F.; Hoepffner, N.; Li, W.K.W.; Ulloa, O.; Vaulot, D. Photoacclimation of Prochlorococcus sp. Prochlorophyta, strains isolated from the North Atlantic and the Mediterranean Sea. Plant Physiol. 1993, 101, 285–296. [Google Scholar]
  93. Medlin, L.K. If everything is everywhere, do they share a common gene pool? Gene 2007, 405, 180–183. [Google Scholar]
  94. Bhattacharya, D.; Medlin, L.; Wainwright, P.O.; Ariztia, E.V.; Bibeau, C.; Stickel, S.K.; Sogin, M.L. Algae containing chlorophylls a + c are paraphyletic, molecular evolutionary analysis of the Chromophyta. Evolution 1992, 46, 1801–1817. [Google Scholar]
  95. Medlin, L.K.; Kooistra, W.H.C.F.; Potter, D.; Saunders, G.W.; Andersen, R.A. Phylogenetic relationships of the 'golden algae' and their plastids. Pl. Syst. Evol. 1997, 11, 187–219. [Google Scholar]
  96. Cavalier-Smith, T.; Allsopp, M.T.E.; Chai, E.E. Chimeric conundra, are nucleomorphs and chromists monophyletic or polyphyletic? Proc. Natl. Acad. Sci. USA 1994, 91, 11368–11372. [Google Scholar]
  97. Bhattacharya, D.; Medlin, L. The phylogeny of plastids, a review based on comparison of small–subunit ribosomal RNA coding regions. J. Phycol. 1995, 31, 489–498. [Google Scholar]
  98. McFadden, G.I.; Gilson, P.R.; Waller, R.F. Molecular phylogeny of Chlorarachniophytes based on plastid rRNA and rbcL sequences. Arch. für Prot. 1995, 145, 231–239. [Google Scholar]
  99. Rensing, S.A.; Rober, N.; Obrdlik, D.; Müller, S.B.; Hofman, C.J.B.; Maier, U-G. Molecular phylogeny of the stress—70 protein family with certain emphasis on algal relationships. Eur. J. Phycol. 1997, 3, 279–285. [Google Scholar]
  100. Bhattacharya, D.; Helmchen, T.; Melkonian, M. Molecular evolutionary analyses of nuclear-encoded small subunit ribosomal RNA identify an independent rhizopod lineage containing the Euglyphina and the Chlorarachniophyta. J. Eukaryot. Microbiol. 1995, 42, 65–69. [Google Scholar]
  101. Hackett, J.D.; Yoon, H.D.; Li, S.; Reyes-Prieto, A.; Rümmele, S.E.; Bhattacharya, D. Phylogenomic analysis supports the monophyly of cryptophytes and haptophytes and the association of Rhizaria with Chromalveolates. Mol. Biol. Evol. 2007, 24, 1702–1713. [Google Scholar]
  102. Edvardsen, B.; Eikrem, W.; Green, J.C.; Andersen, R.A.; Moon-Van Der Staay, S.Y.; Medlin, L.K. Phylogenetic reconstructions of the Haptophyta inferred from rRNA sequences and available morphological data. Phycologia 2000, 39, 19–35. [Google Scholar]
  103. Medlin, L.K.; Kooistra, W.C.H.F.; Schmid, A-M. A review of the evolution of the diatoms—a total approach using molecules, morphology and geology. In The Origin and Early Evolution of the Diatoms; Wittkowski, A., Sieminska, J., Eds.; Polish Academy of Science: Cracow, Poland, 2000; pp. 13–35. [Google Scholar]
  104. McNally, K.L.; Govind, N.S.; Thomé, P.E.; Trench, R.K. Small subunit ribosomal DNA sequence analyses and a reconstruction of the inferred phylogeny among symbiotic dinoflagellates. J. Phycol. 1994, 30, 316–329. [Google Scholar]
  105. Kaczmarska, I.; Beaton, M.; Benoit, A.C.; Medlin, L.K. Molecular phylogeny of selected members of the Order Thalassiosirales (Bacillariophyta) and evolution of the fultoportula. J. Phycol. 2006, 42, 121–138. [Google Scholar]
  106. Nanney, D.L.; Meyer, E.B.; Simon, E.M.; Preparata, R.-M. Comparison of ribosomal and isozymic phylogenies of tetrahymenine ciliates. J. Protist. 1989, 36, 1–8. [Google Scholar]
  107. Medlin, L.K.; Elwood, H.J.; Stickel, S.; Sogin, M.L. Morphological and genetic variation within the diatom Skeletonema costatum (Bacillariophyta): evidence for a new species Skeletonema pseudocostatum. J. Phycol. 1991, 27, 514–524. [Google Scholar]
  108. Beam, C.A.; Preparata, R.-M.; Himes, M.; Nanney, D.L. Ribosomal RNA sequencing of members of the Crypthecodinium cohnii (Dinophyceae), species complex, comparison with soluble enzyme studies. J. Euk. Microbiol. 1993, 40, 660–667. [Google Scholar]
  109. Knowlton, N. Sibling species in the sea. Ann. Rev. Ecol. Syst. 1993, 24, 189–216. [Google Scholar]
  110. DeYoe, H.R.; Chan, A.M.; Suttle, C.A. Phylogeny of Aureococcus anophagefferens and a morphologically similar bloom–forming alga from Texas as determined by 18S ribosomal RNA sequence analysis. J. Phycol. 1995, 31, 413–418. [Google Scholar]
  111. Potter, D.; Lajeunesse, T.C.; Saunders, G.W.; Andersen, R.A. Convergent evolution masks extensive biodiversity among marine coccoid picoplankton. Biodiv. Cons. 1996, 5, 1–9. [Google Scholar]
  112. Zingone, A.; Percopo, I.; Sims, P.A.; Sarno, D. Diversity in the genus Skeletonema (Bacillariophyceae). I. A reexamination of the type material of S. costatum with the description of S. grevillei sp. nov. J. Phycol. 2005, 41, 140–150. [Google Scholar]
  113. Godhe, A.; Mcquoid, M.R.; Karunasagarb, I.; Karunasagarb, I.; Rehnstam-Holm, N.-S. Comparison of three common molecular tools for distinguishing among geographically separated clones of the diatom Skeletonema marinoi Sarno et Zingone Bacillariophyceae. J. Phycol. 2006, 42, 280–291. [Google Scholar]
  114. Chen, G.-F.; Wang, G.-C.; Zhang, B.-Y.; Fan, X.-L. Morphological and phylogenetic analysis of Skeletonema costatum—like diatoms (Bacillariophyta) from the China Sea. Eur. J. Phycol. 2007, 42, 163–175. [Google Scholar]
  115. Skov, J.; Lundholm, N.; Pockington, R.; Rosendahl, S.; Moestrup, O. Studies on the marine planktonic diatom Pseudo-nitzschia. 1. Isozyme variation among isolates of P. pseudodelicatissima during bloom in Danish coastal waters. Phycologia 1997, 36, 374–380. [Google Scholar]
  116. Lundholm, N.; Moestrup, Ø.; Hasle, G.R.; Hoef-Emden, K. A study of the Pseudo-nitzschia pseudodelicatissima/cuspidata complex Bacillariophyceae,, what is P. pseudodelicatissima? J. Phycol. 2003, 39, 797–813. [Google Scholar]
  117. Lundholm, N.; Moestrup, Ø.; Kotaki, Y.; Hoef-Emden, K.; Scholin, C.; Miller, P. Inter- and intraspecific variation of the Pseudo-nitzschia delicatissima complex Bacillariophyceae, illustrated by rRNA probes, morphological data and phylogenetic analyses. J. Phycol. 2006, 42, 464–481. [Google Scholar]
  118. Orsini, L.; Procaccini, G.; Sarno, D.; Montresor, M. Multiple rDNA ITS-types within the diatom Pseudo-nitzschia delicatissima Bacillariophyceae, and their relative abundances across a spring bloom in the Gulf of Naples. Mar. Ecol. Prog. Series 2004, 271, 87–98. [Google Scholar]
  119. Amato, A.; Kooistra, W.H.C.F.; Levialdi Ghiron, J.H.; Mann, D.G.; Pröschold, T.; Montresor, M. Reproductive isolation among sympatric cryptic species in marine diatoms. Protist 2007, 158, 193–207. [Google Scholar]
  120. Amato, A.; Montresor, M. Morphology, phylogeny, and sexual cycle of Pseudo-nitzschia mannii sp. nov. Bacillariophyceae,, a pseudo–cryptic species within the P. pseudodelicatissima complex. Phycologia 2008, 47, 487–497. [Google Scholar]
  121. Orive, E.; Laza-Martinez, A.; Seoane, S.; Alonso, A.; Andrade, R.; Miguel, I. Diversity of Pseudo-nitzschia in the Southeastern Bay of Biscay. Diatom Res. 2010, 25, 125–145. [Google Scholar]
  122. John, U.; Fensome, R.A.; Medlin, L.K. The application of a molecular clock based on molecular sequences and the fossil record to explain the biogeographic distribution within the Alexandrium tamarense “species complex”. Mol. Biol. Evol. 2003, 20, 1015–1027. [Google Scholar]
  123. Mann, D.G. The species concept in diatoms. Phycologia 1999, 38, 437–495. [Google Scholar]
  124. Mann, D.G. The species concept in diatoms, evidence for morphologically distinct, sympatric gamodemes in four epipelic species. Plant Syst. Evol. 1989, 164, 215–237. [Google Scholar]
  125. Wood, A.M.; Leatham, T. The species concept in phytoplankton ecology. J. Phycol. 1992, 28, 723–729. [Google Scholar]
  126. Amato, A.; Lüdeking, A.; Kooistra, W.H.C.F. Intracellular domoic acid production in Pseudo-nitzschia multistriata isolated from the Gulf of Naples (Tyrrhenian Sea, Italy). Toxicon 2010, 55, 157–161. [Google Scholar]
  127. Bakker, F.T.; Olsen, J.L.; Stam, W.T. Global phylogeography in the cosmopolitan species Cladophora vagabunda (Chlorophyta), based on nuclear DNA ITS sequences. Eur.J. Phycol. 1995, 30, 187–210. [Google Scholar]
  128. Bakker, F.T.; Olsen, J.L.; Stam, W.T.; Van Den Hooke, C. Nuclear ribosomal DNA internal transcribed spacer regions ITS1 and ITS2, define discrete biogeographic groups in Cladophora albida (Chlorophyta). J. Phycol. 1992, 28, 839–845. [Google Scholar]
  129. Medlin, L.K.; Lange, M.; Barker, G.L.A.; Hayes, P.K. Can molecular techniques change our ideas about the species concept? In Molecular Ecology of Aquatic Microbes; Joint, I., Falkowski, P., Carr, N., Eds.; Springer Verlag: Berlin, Germany, 1995; Volume 38, pp. 133–152. [Google Scholar]
  130. Cracraft, J. Speciation and its ontology, the empirical consequences of alternative species concepts for understanding patterns and process of differentiation. In Speciation and Its Consequences; Otte, D., Endler, J.A., Eds.; Sinauer Associates: Sunderland, MD, USA, 1989; pp. 28–59. [Google Scholar]
  131. Costas, E.; Zardoya, R.; Bautista, J.; Garrido, A.; Rojo, C.; Lopez-Rodas, V. Morphospecies vs. genospecies in toxic marine dinoflagellates, an analysis of Gymnodinium catenatum/Gyrodiniumimpudicum and Alexandrium minutum/A. lusitanicum using antibodies, lectins, and gene sequences. J. Phycol. 1995, 31, 801–807. [Google Scholar]
  132. Parker, P.G.; Snow, A.A.; Schug, M.D.; Booton, G.C.; Fuerst, P.A. What molecules can tell us about populations: choosing and using a molecular marker. Ecology 1998, 79, 361–382. [Google Scholar]
  133. Wright, S. Variability Within and Among Natural Populations, a Treatise in Four Volumes; University of Chicago Press: Chicago, IL, USA, 1978; Volume 4. [Google Scholar]
  134. Nei, M. Genetic distance between populations. Amer. Nat. 1972, 106, 283–292. [Google Scholar]
  135. Takezaki, N.; Nei, M. Genetic distances and reconstruction of phylogenetic trees from microsatellite DNA. Genetics 1996, 144, 389–399. [Google Scholar]
  136. Medlin, L.K.; Lange, M.; Noethig, E.V. Genetic Diversity of Marine Phytoplankton, A review and a look to Antarctic Phytoplankton. Ant. Sci. 2000, 12, 325–331. [Google Scholar]
  137. Evans, K.M.; Bates, S.S.; Medlin, L.K.; Hayes, P.K. Microsatellite marker development and genetic variation in the toxic marine diatom Pseudo-nitzschia multiseries (Bacillariophyceae). J. Phycol. 2004, 40, 911–920. [Google Scholar]
  138. Evans, K.M.; Kühn, S.F.; Hayes, P.K. High levels of genetic diversity and low levels of genetic differentiation in North Sea Pseudo-nitzschia pungens (Bacillariophyceae) populations. J. Phycol. 2005, 41, 506–514. [Google Scholar]
  139. Evans, K.M.; Chepurnov, V.A.; Sluiman, H.J.; Thomas, .S.J.; Spears, B.M.; Mann, D.G. Highly differentiated populations of the freshwater diatom Sellaphora capitata suggest limited dispersal and opportunities for allopatric speciation. Protist 2009, 160, 386–396. [Google Scholar]
  140. Iglesias-Rodriguez, M.D.; Schofield, O.M.; Batley, P.J.; Medlin, L.K.; Hayes, P.K. Extensive intraspecific genetic diversity in the marine coccolithophore Emiliania huxleyi: the use of microsatellite analysis in marine phytoplankton population studies. J. Phycol. 2006, 42, 526–536. [Google Scholar]
  141. Nagai, S.; Lian, C.; Yamaguchi, S.; Hamaguchi, M.; Matsuyama, Y.; Itakura, S.; Shimada, H.; Kaga, S.; Yamauchi, H.; Sonda, Y.; Nishikawa, T.; Kim, C.H.; Hogetsu, T. Microsatellite markers reveal population genetic structure of the toxic dinoflagellates (Dinophyceae) in Japanese coastal waters. J. Phycol. 2007, 43, 43–54. [Google Scholar] [CrossRef]
  142. Rynearson, T.A.; Armbrust, E.V. DNA fingerprinting reveals extensive genetic diversity in a field population of the centric diatom Ditylum brightwellii. Limnol. Oceanogr. 2000, 45, 1329–1340. [Google Scholar]
  143. Rynearson, T.A.; Armbrust, E.V. Genetic differentiation among populations of the planktonic marine diatom Ditylum brightwellii (Bacillariophyceae). J. Phycol. 2004, 40, 34–43. [Google Scholar]
  144. Rynearson, T.A.; Armbrust, E.V. Maintenance of clonal diversity during a spring bloom of the centric diatom Ditylum brightwellii. Mol. Ecol. 2005, 14, 1631–1640. [Google Scholar]
  145. Rynearson, T.A.; Newton, J.A.; Armbrust, E.V. Spring bloom development, genetic variation, and population succession in the planktonic diatom Ditylum brightwellii. Limnol. Oceanogr. 2006, 51, 1249–1261. [Google Scholar]
  146. Gaebler-Schwarz, S. Etimation of genetic diversity in the colony forming polar pymnesiophyte species Phaeocystis Antarctica. PhD Thesis, University of Bremen, Bremen, Germany, 2009; p. 2217. [Google Scholar]
  147. Casteleyn, G.; Leliaert, F.; Backeljau, T.; Debeer, A.E.; Kotaki, Y.; Rhodes, L.; Lundholm, N.; Sabbe, K.; Vyverman, W. Limits to gene flow in a cosmopolitan marine planktonic diatom. In Proc. Natl. Acad. Sci. USA; 2010; in press. [Google Scholar]
  148. Lange, M.; Chen, Y.-Q.; Medlin, L.K. Molecular genetic delineation of Phaeocystis species (Prymnesiophyceae), using coding and non-coding regions of nuclear and plastid genomes. Eur. J. Phycol. 2002, 37, 77–92. [Google Scholar]
  149. Medlin, L.K. Molecular clocks and inferring evolutionary milestones and biogeography in the microalgae. In Origin and Evolution of Natural Diversity; H. Okada, S.F., Mawatari, N., Suzuki, P., Gautam, P., Eds.; 21st Century COE: Sapporo, Japan, 2008; pp. 31–42. [Google Scholar]
  150. Medlin, L.K.; Zingone, A. A taxonomic review of the genus Phaeocystis. Biogeochem. 2007, 83, 3–18. [Google Scholar]
  151. Kooistra, W.H.C.F.; Medlin, L.K. The evolution of the diatoms. IV. The age of the diatoms (Bacillariophyta), based on 18S rDNA sequences. Mol. Phylogen. Evol. 1996, 6, 391–407. [Google Scholar]
  152. Avise, J.C.; Arnold, J.; Ball, R.M.; Bermingham, E.; Lamb, T.; Neigel, J.E.; Reeb, C.A.; Saunders, N.C. Intraspecific phylogeography, The mitochondrial DNA bridge between population genetics and systematics. Ann. Rev. Syst. Ecol. 1987, 18, 489–522. [Google Scholar]
  153. Costas, E.; Løpez-Rodas, V. Did the majority of the dinoflagellates perish in the great Permian extinction? Harmful Algal News 1995, 10/11, 8–9. [Google Scholar]
  154. Sáez, A.G.; Probert, I.; Geisen, M.; Quinn, P.; Young, J.R.; Medlin, L.K. Pseudo-cryptic speciation in Coccolithophores. Proc. Natl. Acad. Sci. USA 2003, 100, 6893–7418. [Google Scholar]
  155. Wu, C.-I.; Li, W.-H. Evidence for higher rates of nucleotide substitution in rodents than in man. Proc. Natl. Acad. Sci. USA 1985, 82, 1741–1745. [Google Scholar]
  156. Ochman, H.; Wilson, A.C. Evolution in bacteria, evidence for a universal substitution rate in cellular genomes. J. Mol. Evol. 1987, 26, 74–86. [Google Scholar]
  157. Olsen, J.L.; Stam, W.T.; Berger, S.; Menzel, D. 18S rDNA and evolution in the Dasycladales Chlorophyta, modern living fossils. J. Phycol. 1994, 30, 729–744. [Google Scholar]
  158. Vaulot, D.; Birrien, J-L.; Marie, D.; Casotti, R.; Velhuis, M.; Kraay, G.; Chretiennet-Dinet, M-J. Morphology, ploidy, pigment composition, and genome size of cultured strains of Phaeocystis Prymnesiophyceae. J. Phycol. 1994, 30, 1022–1035. [Google Scholar]
  159. Crame, J.A. Latitudinal range fluctuations in the marine realm through geological times. Trends Ecol. Evol. 1993, 8, 162–166. [Google Scholar]

