Article

The Effects of Salinity and pH on Fertilization, Early Development, and Hatching in the Crown-of-Thorns Seastar

1
College of William and Mary, Williamsburg, VA 23187, USA
2
School of Medical and Biological Sciences, University of Sydney, Sydney, NSW 2006, Australia
3
ARC Centre of Excellence for Coral Reef Studies, James Cook University, Townsville, QLD 4811, Australia
*
Authors to whom correspondence should be addressed.
Diversity 2017, 9(1), 13; https://doi.org/10.3390/d9010013
Submission received: 2 December 2016 / Revised: 4 February 2017 / Accepted: 10 February 2017 / Published: 22 February 2017
(This article belongs to the Special Issue Biology, Ecology and Management of Crown-of-Thorns Starfish)

Abstract

:
Understanding the influence of environmental factors on the development and dispersal of crown-of-thorns seastars is critical to predicting when and where outbreaks of these coral-eating seastars will occur. Outbreaks of crown-of-thorns seastars are hypothesized to be driven by terrestrial runoff events that increase nutrients and the phytoplankton food for the larvae. In addition to increasing larval food supply, terrestrial runoff may also reduce salinity in the waters where seastars develop. We investigated the effects of reduced salinity on the fertilization and early development of seastars. We also tested the interactive effects of reduced salinity and reduced pH on the hatching of crown-of-thorns seastars. Overall, we found that reduced salinity has strong negative effects on fertilization and early development, as shown in other echinoderm species. We also found that reduced salinity delays hatching, but that reduced pH, in isolation or in combination with lower salinity, had no detectable effects on this developmental milestone. Models that assess the positive effects of terrestrial runoff on the development of crown-of-thorns seastars should also consider the strong negative effects of lower salinity on early development including lower levels of fertilization, increased frequency of abnormal development, and delayed time to hatching.

1. Introduction

Coral reefs, among the world’s most diverse and valuable ecosystems, are under threat from global stressors associated with climate change and local stressors such as overfishing, pollution, and outbreaks of the coral-eating crown-of-thorns seastars, Acanthaster cf. solaris (COTS) [1,2]. The vulnerability of coral reef ecosystems to global change is seen in the mass bleaching and coral mortality across the tropics caused by the 2016 El Nino-driven ocean warming [3]. Australia’s Great Barrier Reef (GBR), and Indo-Pacific reefs in general, are in the midst of a multi-decadal decline in coral cover [4,5]. Outbreaks of COTS cause major damage to coral reefs [5,6,7], prompting large-scale removal programs of this seastar, albeit with equivocal effectiveness [8]. Analysis of data from the GBR monitoring program estimates that 30–40 percent of the decline in coral cover can be attributed to COTS predation [5,9]. In addition, coral recovery after bleaching and cyclones is greatly reduced if these events are followed by A. cf. solaris predation [9,10,11].
It is unclear whether outbreaks of COTS are becoming more common or are simply reported with increasing frequency [8]. However, there is evidence that COTS outbreaks on the GBR occurred historically every 50–80 years, while today they occur approximately every 15 years [12]. Regardless of their frequency, given the far-reaching consequences of COTS outbreaks (e.g., [13]), understanding the factors underlying increases in abundance of this species is critical to predicting when and where loss of coral cover due to COTS will occur. Despite decades of research, the factors behind the boom and bust population cycles of COTS are not understood. The very high fecundity (up to 200 million eggs/female) and resilient larval stage indicate that success in the plankton is a key consideration in determining the causes of recruitment pulses [14,15,16,17].
There are two primary hypotheses for the increasing frequency of COTS outbreaks: the predator removal hypothesis (top-down) and the terrestrial runoff (enhanced nutrients) hypothesis (bottom-up). While there is some evidence for both hypotheses (reviewed by [8]), a consensus seems to be emerging that the terrestrial runoff hypothesis best explains outbreak dynamics on the GBR, possibly combined with local hydrodynamic conditions that govern secondary outbreaks ([18], but see [19]). In brief, the terrestrial runoff hypothesis attributes outbreak events to increasing agricultural runoff, which in turn increases the abundance of nutrients in the waters surrounding the GBR. The addition of limiting nutrients enhances the growth of phytoplankton, providing more food for A. cf. solaris larvae, and thereby increasing larval survival and ultimately recruitment into the reproductive population [20].
In addition to increasing nutrients, freshwater runoff from terrestrial sources simultaneously reduces seawater salinity [20,21]. In large flood events that often occur around the time that COTS larvae are in the plankton, flood plumes can extend up to 100 km offshore in GBR waters causing pulses of low salinity extending to mid-shelf reefs [22,23,24]. These low salinity events are predicted to increase by recent projections of global climate change [25]. As most echinoderms have limited tolerance for low salinity as adults and larvae [26,27], even short-term exposure to low salinity may be detrimental to COTS development. For example, even small reductions in salinity cause abnormal developmental phenotypes in sand dollars and sea urchins, beginning at fertilization and continuing at least through hatching [25,26]. However, in experiments where larval COTS were transferred to a range of salinity treatments, reduced salinities of 30 ppt actually enhanced survival relative to 32 and 35 ppt treatments [27]. Lucas (1973) also found that development was completed in larval COTS transferred to 26 ppt, but not 22 ppt. Developmental resilience to reduced salinities might be another trait of the life history of COTS contributing to its success during flooding events. However, the tolerance of gametes and early developmental stages (e.g., zygotes, cleavage stage embryos, blastulae) of COTS to lower salinity has not been determined.
To understand the effects of freshwater runoff on COTS reproductive success, we examined the effects of reduced salinity conditions on fertilization, normal development, and hatching in this seastar across a salinity gradient (19 to 34 ppt). Based on previous studies demonstrating the negative effects of low salinity on echinoderm development [26,28,29], we predicted that decreased salinity would lower fertilization success and reduce the percentage of embryos exhibiting normal development. We also predicted that decreased salinity would cause a delay in hatching, as shown in other echinoderms [30,31]. The potential for polyembrony, the phenomenon where low salinity induces fission of early embryos to generate multiple embryos per egg, as described for echinoid embryos [32], was also investigated. Finally, we examined the effect of salinity reductions in combination with shifts in pH to explore how changes in water chemistry more generally could affect development to hatching. We use our data to address the possibility that the resilience of the planktonic phase of A. cf. solaris to decreased salinity may contribute to its success in runoff conditions.

2. Methods

2.1. Adult Collection and Maintenance

Crown-of-thorns seastars were collected on snorkel in December 2015 as encountered on reefs around Lizard Island (14°40′44.0″ S 145°26′53.7″ E), Northern Great Barrier Reef, Australia. Upon collection, the animals were transported by boat to the Lizard Island Research Station and the gender of each specimen was determined by gonad biopsy with the tissue removed using forceps through a small incision at the base of the arms. The males and females were placed in separate large tanks of ambient flow-through seawater at 28 °C and ~34 ppt salinity. Animals were kept in flow-through tanks and used within a week of collection for experiments.
To obtain gametes for fertilization, a small portion of gonad was removed through an incision. The ovaries were rinsed with 1 µm filtered seawater (FSW) and placed in 10−5 M 1-methyl adenine in FSW to induce ovulation. After 30–40 min the eggs were collected and placed in ~100 mL of FSW. Eggs were checked microscopically for quality and to confirm germinal vesicle breakdown. Sperm was collected directly from dissected testes and placed in a small dish at room temperature (~28 °C). Each sperm source was checked microscopically for motility and used promptly. For each fertilization, sperm from a single male was combined to fertilize the eggs of a single female (salinity only experiments) or sperm from two to three males was combined with eggs from two to three females (salinity plus pH experiments) at a sperm to egg ratio of 100:1. Sperm and egg concentrations were estimated using a hemocytometer. Fertilization was checked microscopically and confirmed to be >90% before the eggs were rinsed in FSW to remove excess sperm. For pH experiments, levels of salinity, pH, and DO (dissolved oxygen) were measured using a Hach Hqd portable temperature-compensated multiprobe (Hach Company, Loveland, CO, USA).

2.2. Effects of Salinity on Fertilization, Development, and Hatching

For all experiments where salinity was manipulated, FSW at ambient temperature (~28 °C) and salinity (34 ppt) was mixed with deionized water to create treatment salinities of 19, 23, 25, 27, 29, 31, and 34 ppt. New seawater was mixed each day for a complete water change in experiments, thereby minimizing changes in salinity due to evaporation. To determine the effects of salinity on fertilization success, development, and hatching, embryos from single females were reared in water at a range of salinities. Use of one female and two to three males for each fertilization generated populations of embryos for the salinity experiment. The eggs were pipetted into 250 mL plastic beakers with ~100 mL FSW at salinities of 19, 23, 25, 27, 29, 31, and 34 ppt. After adding eggs to each beaker, a few drops of dilute sperm solution were added to each beaker. After a brief stir, gametes were left for a few minutes before checking for fertilization. A subsample of eggs was photographed using a dissecting microscope to score the number of fertilized eggs as indicated by the presence of a fertilization envelope. All eggs in focus were scored (n = 39–97 per picture). Initial trials (two to three per salinity) revealed that development was inhibited at 19, 23, or 25 ppt, and so those salinities were not used in subsequent trials. We then conducted 11 fertilizations and for each of these had one well of embryos for each salinity level. Variable numbers of crosses were examined for measures of fertilization (n = 3–11 crosses), normal development (n = 2–9 crosses), and hatching (n = 5 crosses) for each salinity treatment.
Six-well plates were prepared with four wells in each plate filled with 10 mL of experimental seawater (27, 29, 31, or 34 ppt) and fertilized eggs from respective salinity treatments pipetted into individual wells. Plates were covered and left at ambient temperature (~28 °C). At 14, 16, and 18 h post-fertilization (hpf), a subsample of 30 embryos from each well were examined microscopically to score developmental stage. Scoring categories were as follows: unfertilized (no fertilization envelope), fertilized (one cell), dead, early cleavage (two cells to blastula), abnormal cleavage (blastomeres varying in size and shape), abnormal blastula (irregular shapes with blebbing cells), blastula, gastrula, and hatched. The frequency of normal development (the sum of blastula, gastrula, and hatched categories) was determined in counts of 30 embryos per well. The percentage of normal development was calculated by dividing the number of normally developing embryos by the total number of embryos that were fertilized, in order to avoid confounding the failed development of fertilized eggs with the previously observed failure of eggs to fertilize at low salinities. All cultures were examined closely for the incidence of polyembryony.

2.3. Effects of Salinity and pH on Development to Hatching

The salinity-pH experiment used four salinities (27, 29, 31, 34 ppt) and two pHNIST levels (Mean ± SE, control 8.07 ± 0.02, and 7.61 ± 0.01, n = 12). The pH treatments were within model projections for near-future (2300) conditions [25]. Unmanipulated FSW served as the control. The water was first conditioned to achieve the salinity levels as above and then the pH was adjusted. To achieve experimental pH levels, FSW was bubbled with 100% CO2 and pH adjustment was tracked using a Hach Hqd portable multiprobe. Probes were calibrated using NIST high precision buffers pH 4.0, 7.0, and 10.0 (ProSciTech, Kirwan, Queensland, Australia). To ground truth pHNIST values, pH on the total scale was checked for adjusted FSW samples across all salinities. The spectrophotometric approach was used with m-cresol purple indicator dye (Acros Organics lot AO321770) and a USB4000 spectrophotometer following the procedures outlined in Standard Operating Procedures (SOP) 6b of [33] and the equations of [34]. All values fell in the expected range, confirming the accuracy of the pHNIST values. Water samples (250 mL) collected for each pH level and fixed with 100 μL of saturated HgCl were used to determine total alkalinity (TA) by potentiometric titration. Experimental pCO2 was determined from pHNIST, TA, temperature, and salinity data using CO2SYS [35] (Table 1) applying the dissociation constants of [36] as refitted by [37].
Using gametes from multiple males and females (n = 2–3 each), males for each fertilization generated populations of embryos for the salinity-pH experiment. Thus, each experimental container was considered to be a replicate. Combined eggs of three females were placed in plastic beakers containing 50 mL of experimental salinity-pH seawater at 460 eggs/mL, as determined in egg counts, and fertilized with dilute sperm to achieve ~90% fertilization. Approximately 1 mL of these eggs was then pipetted into full 40–80 mL containers (~12 eggs/mL) of the same experimental water conditions and sealed. They were left in water baths maintained at ambient temperature (~28 °C).
At 14 and 24 hpf, 30 embryos were pipetted from each container and scored as dead, abnormal blastula, blastula, gastrula, or hatched (as above). They were sampled in order of replicate (all replicate one pots, then two, then three), so that time was not a confounding variable. This experiment was repeated three times with different gamete sources.

2.4. Statistical Analysis

Data describing the effects of salinity on fertilization success were analysed using a nonparametric Kruskal-Wallis test since the distribution of residuals resulting from ANOVA tests were non-normal, even following standard (arc-sine square root) transformations. The percentage of embryos that exhibited normal development at 14 h post-fertilization under different salinity conditions were normally distributed and were analysed using a mixed-model ANOVA where female was modelled as a random factor and salinity was modelled as a fixed factor. Data describing the effects of time and salinity on the percentage of embryos exhibiting normal development were non-normally distributed, preventing analysis in an ANOVA framework. Instead, we used a binomial logistic regression to analyse these data. A Hosmer-Lemeshow test was used to analyse the fit of our binomial regression model to the data, although the Hosmer-Lemeshow test is known to yield significant departures from a perfect fit when observations exceed a few hundred (our N = 2140) [38].
For the data on the percentage of hatching in salinity and pH treatments, a mixed-model ANOVA was used with data at two different time points (14 and 24 hpf). In this case, we modelled pH, salinity, time, and their interactions as fixed effects and block (different runs of the experiment) were modelled as a random effect. Each block was conducted on independent days using unique and non-overlapping combinations of male and female gametes. In all cases, normality of residuals was assessed using a Kolmogorov-Smirnov test with an alpha level of 0.05 and in all cases the test yielded a p ≥ 0.200, meeting this basic assumption of ANOVA. In cases where post-hoc tests were used to assess differences among levels of a significant main effect, we used the Bonferroni adjustment to correct p-values for multiple pairwise comparisons [39]. The one exception to this was analysis of pairwise comparisons following the Kruskal-Wallis nonparametric test where we used Dunn’s adjustment [40] to correct for family-wise type I error. All analyses were conducted using IBM SPSS Statistics (version 23, Armonk, NY, USA).

3. Results

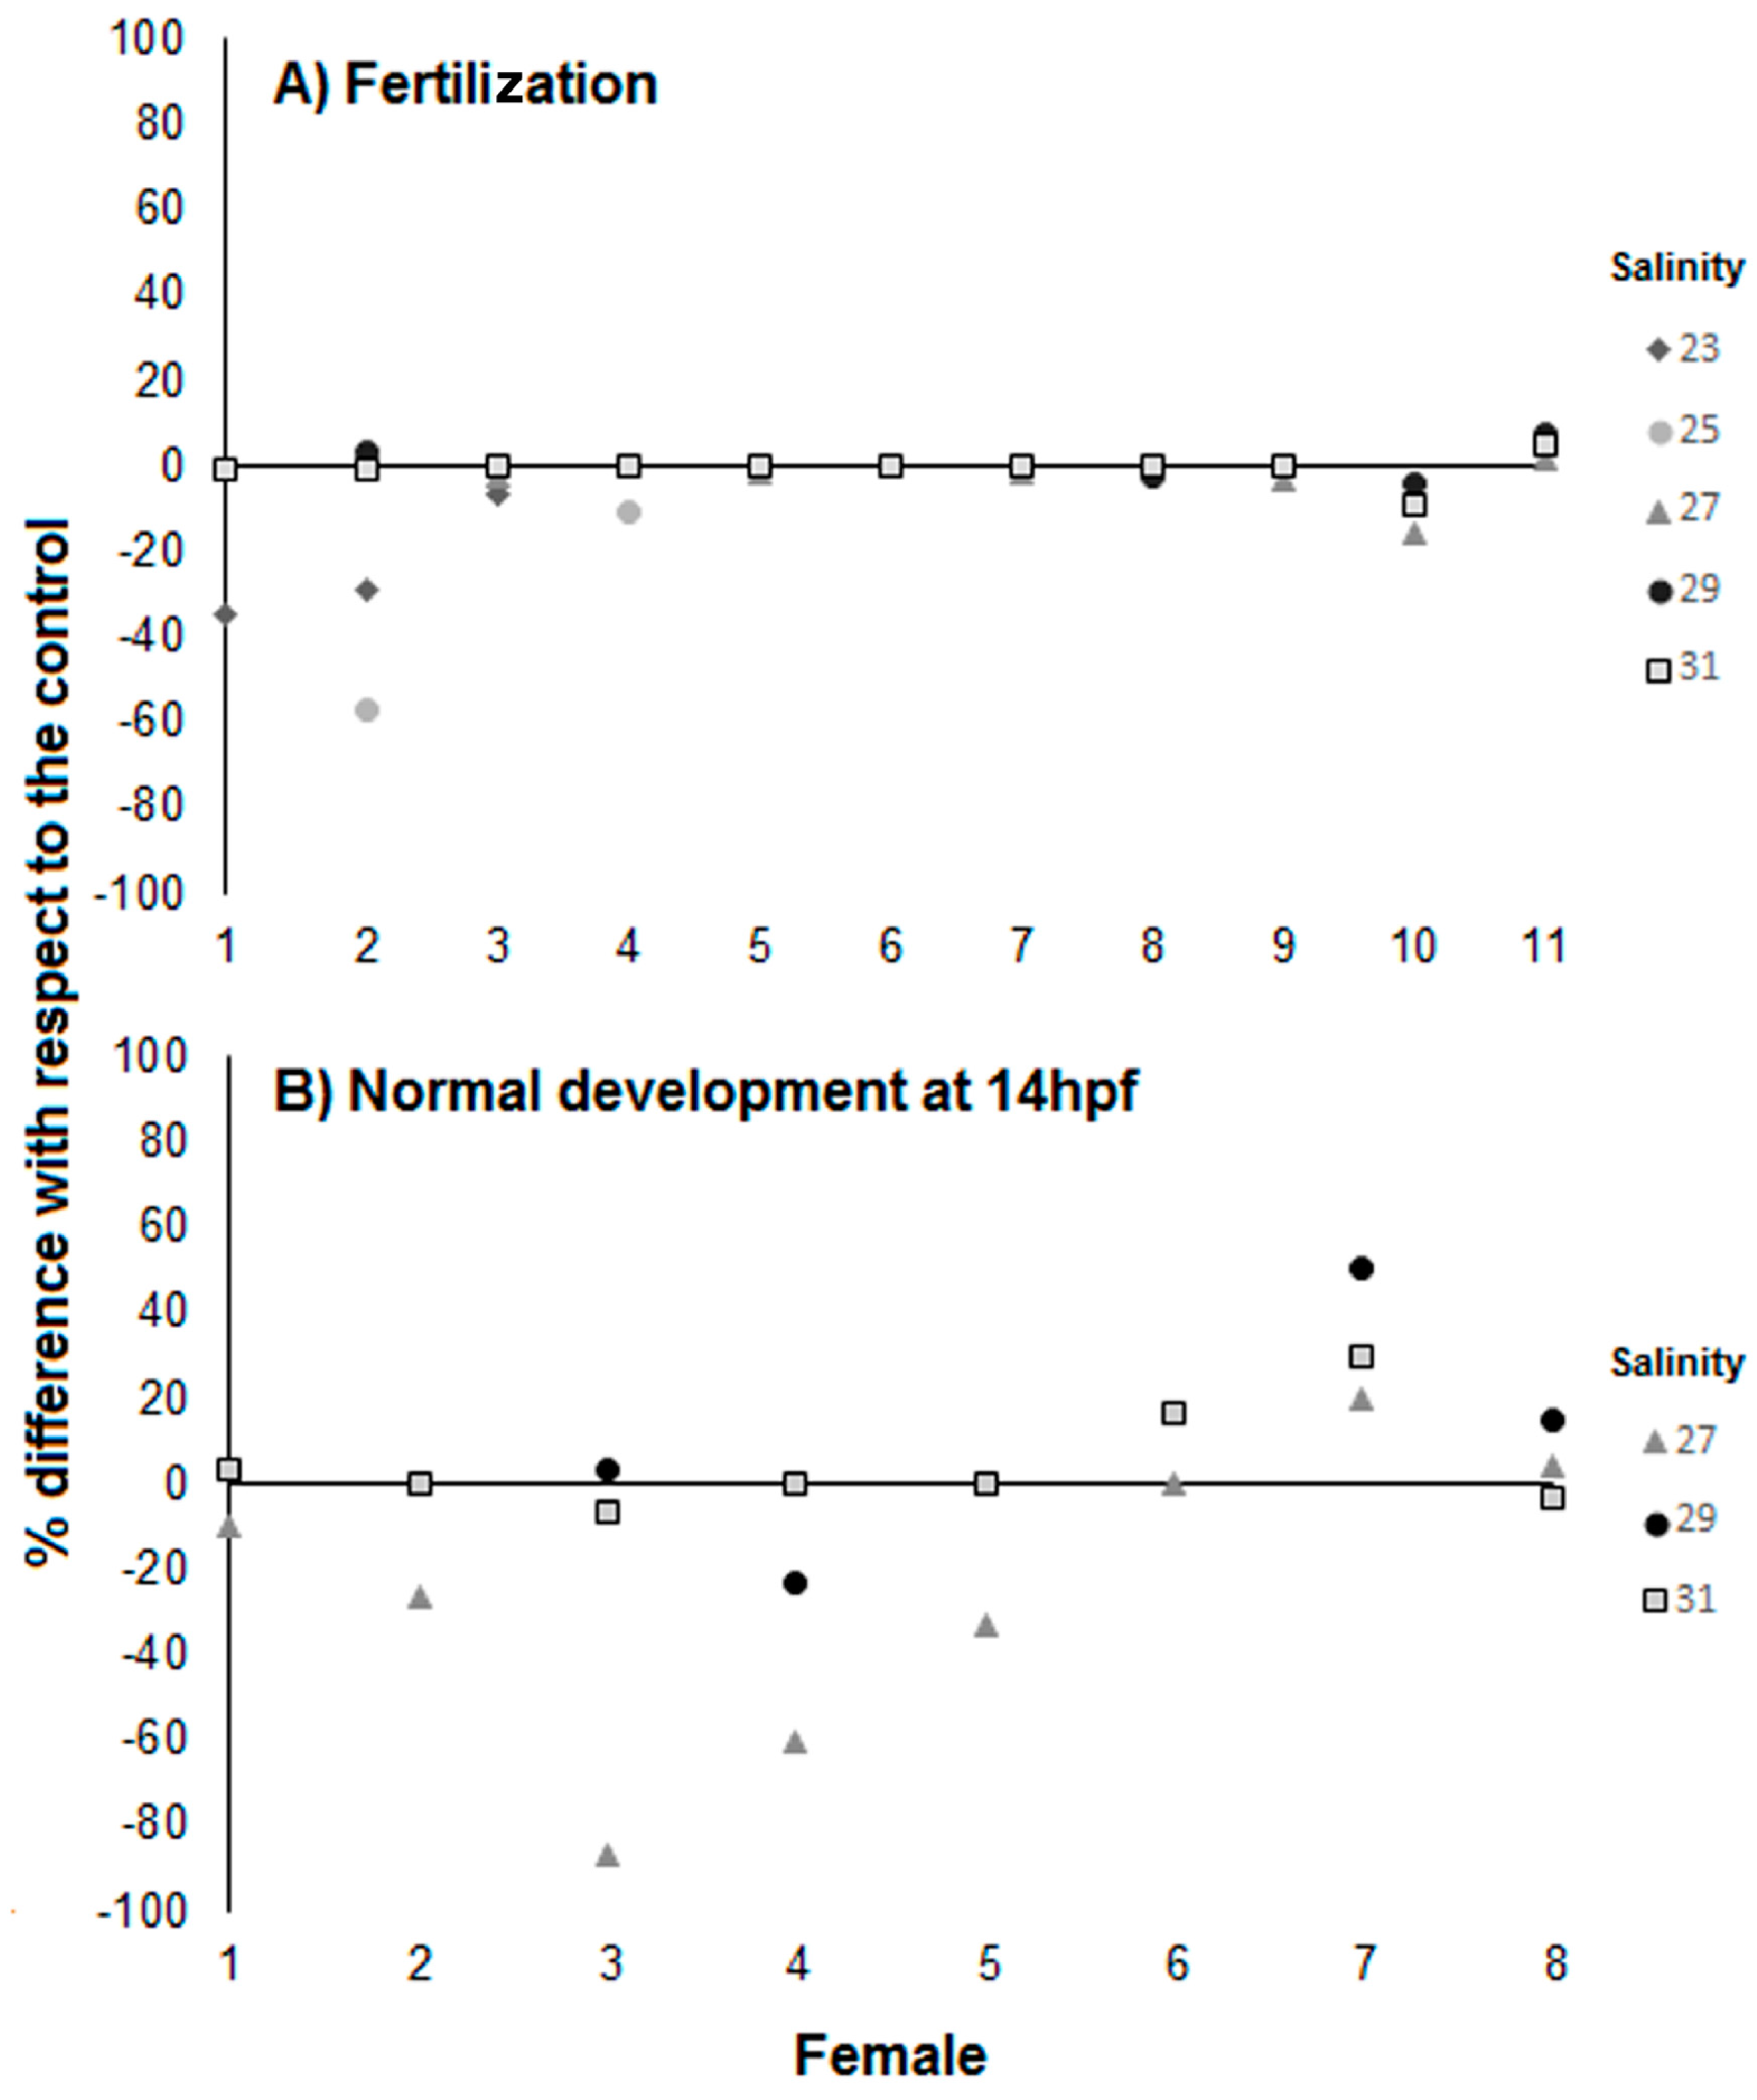
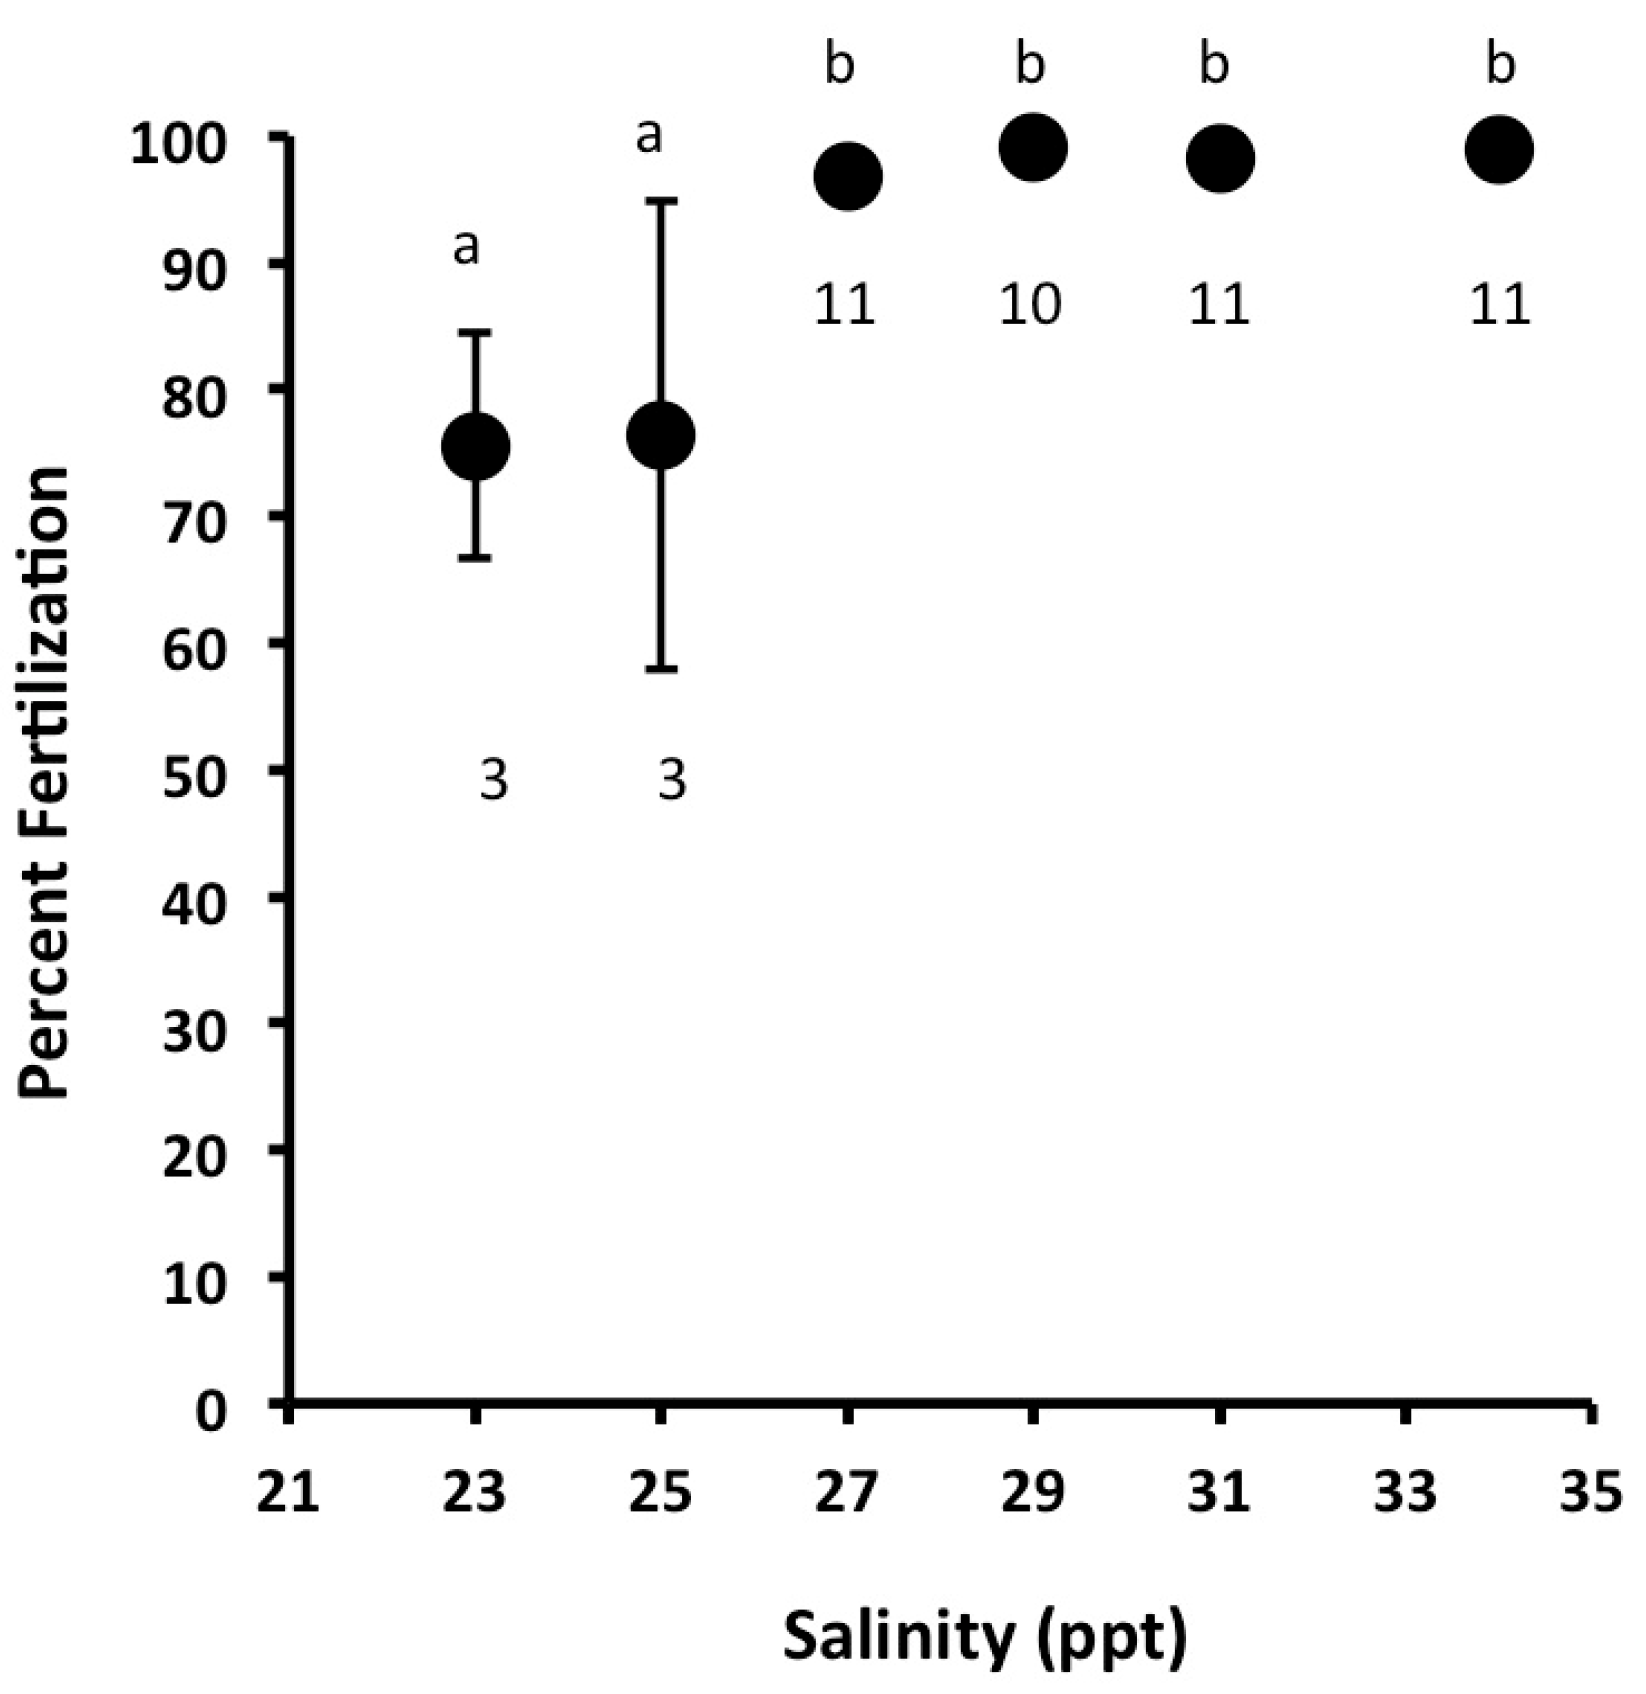
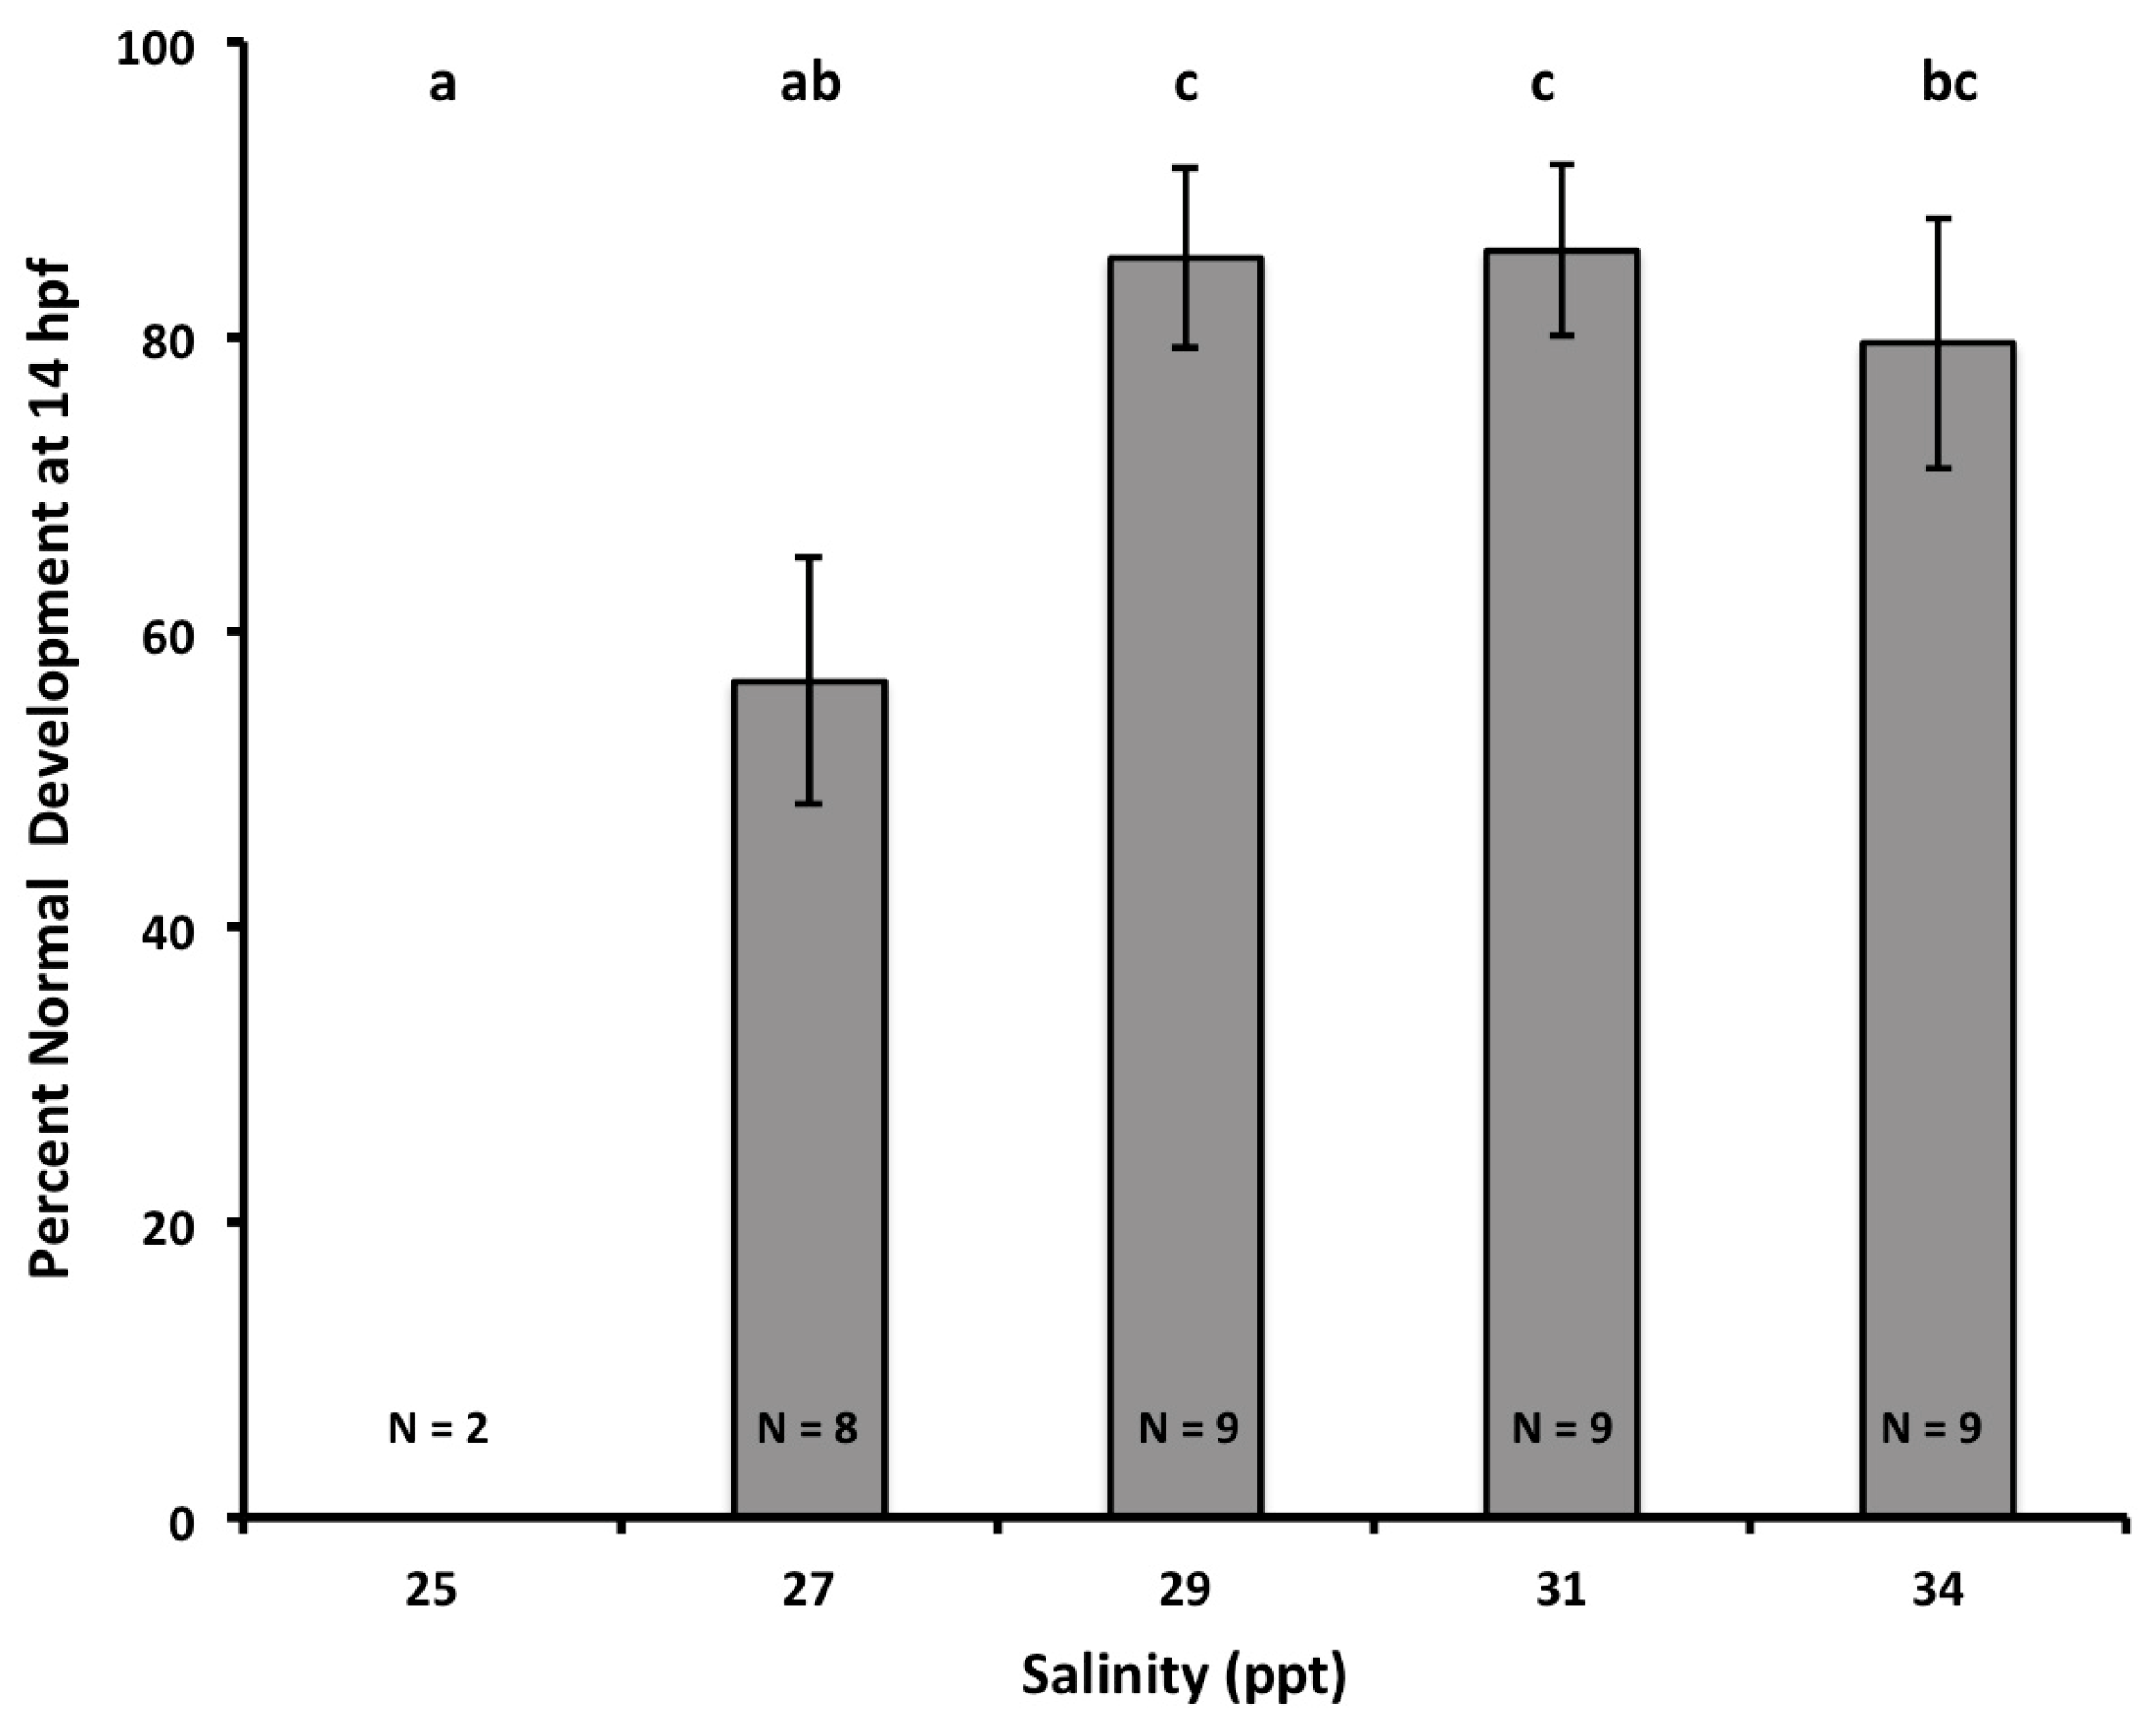
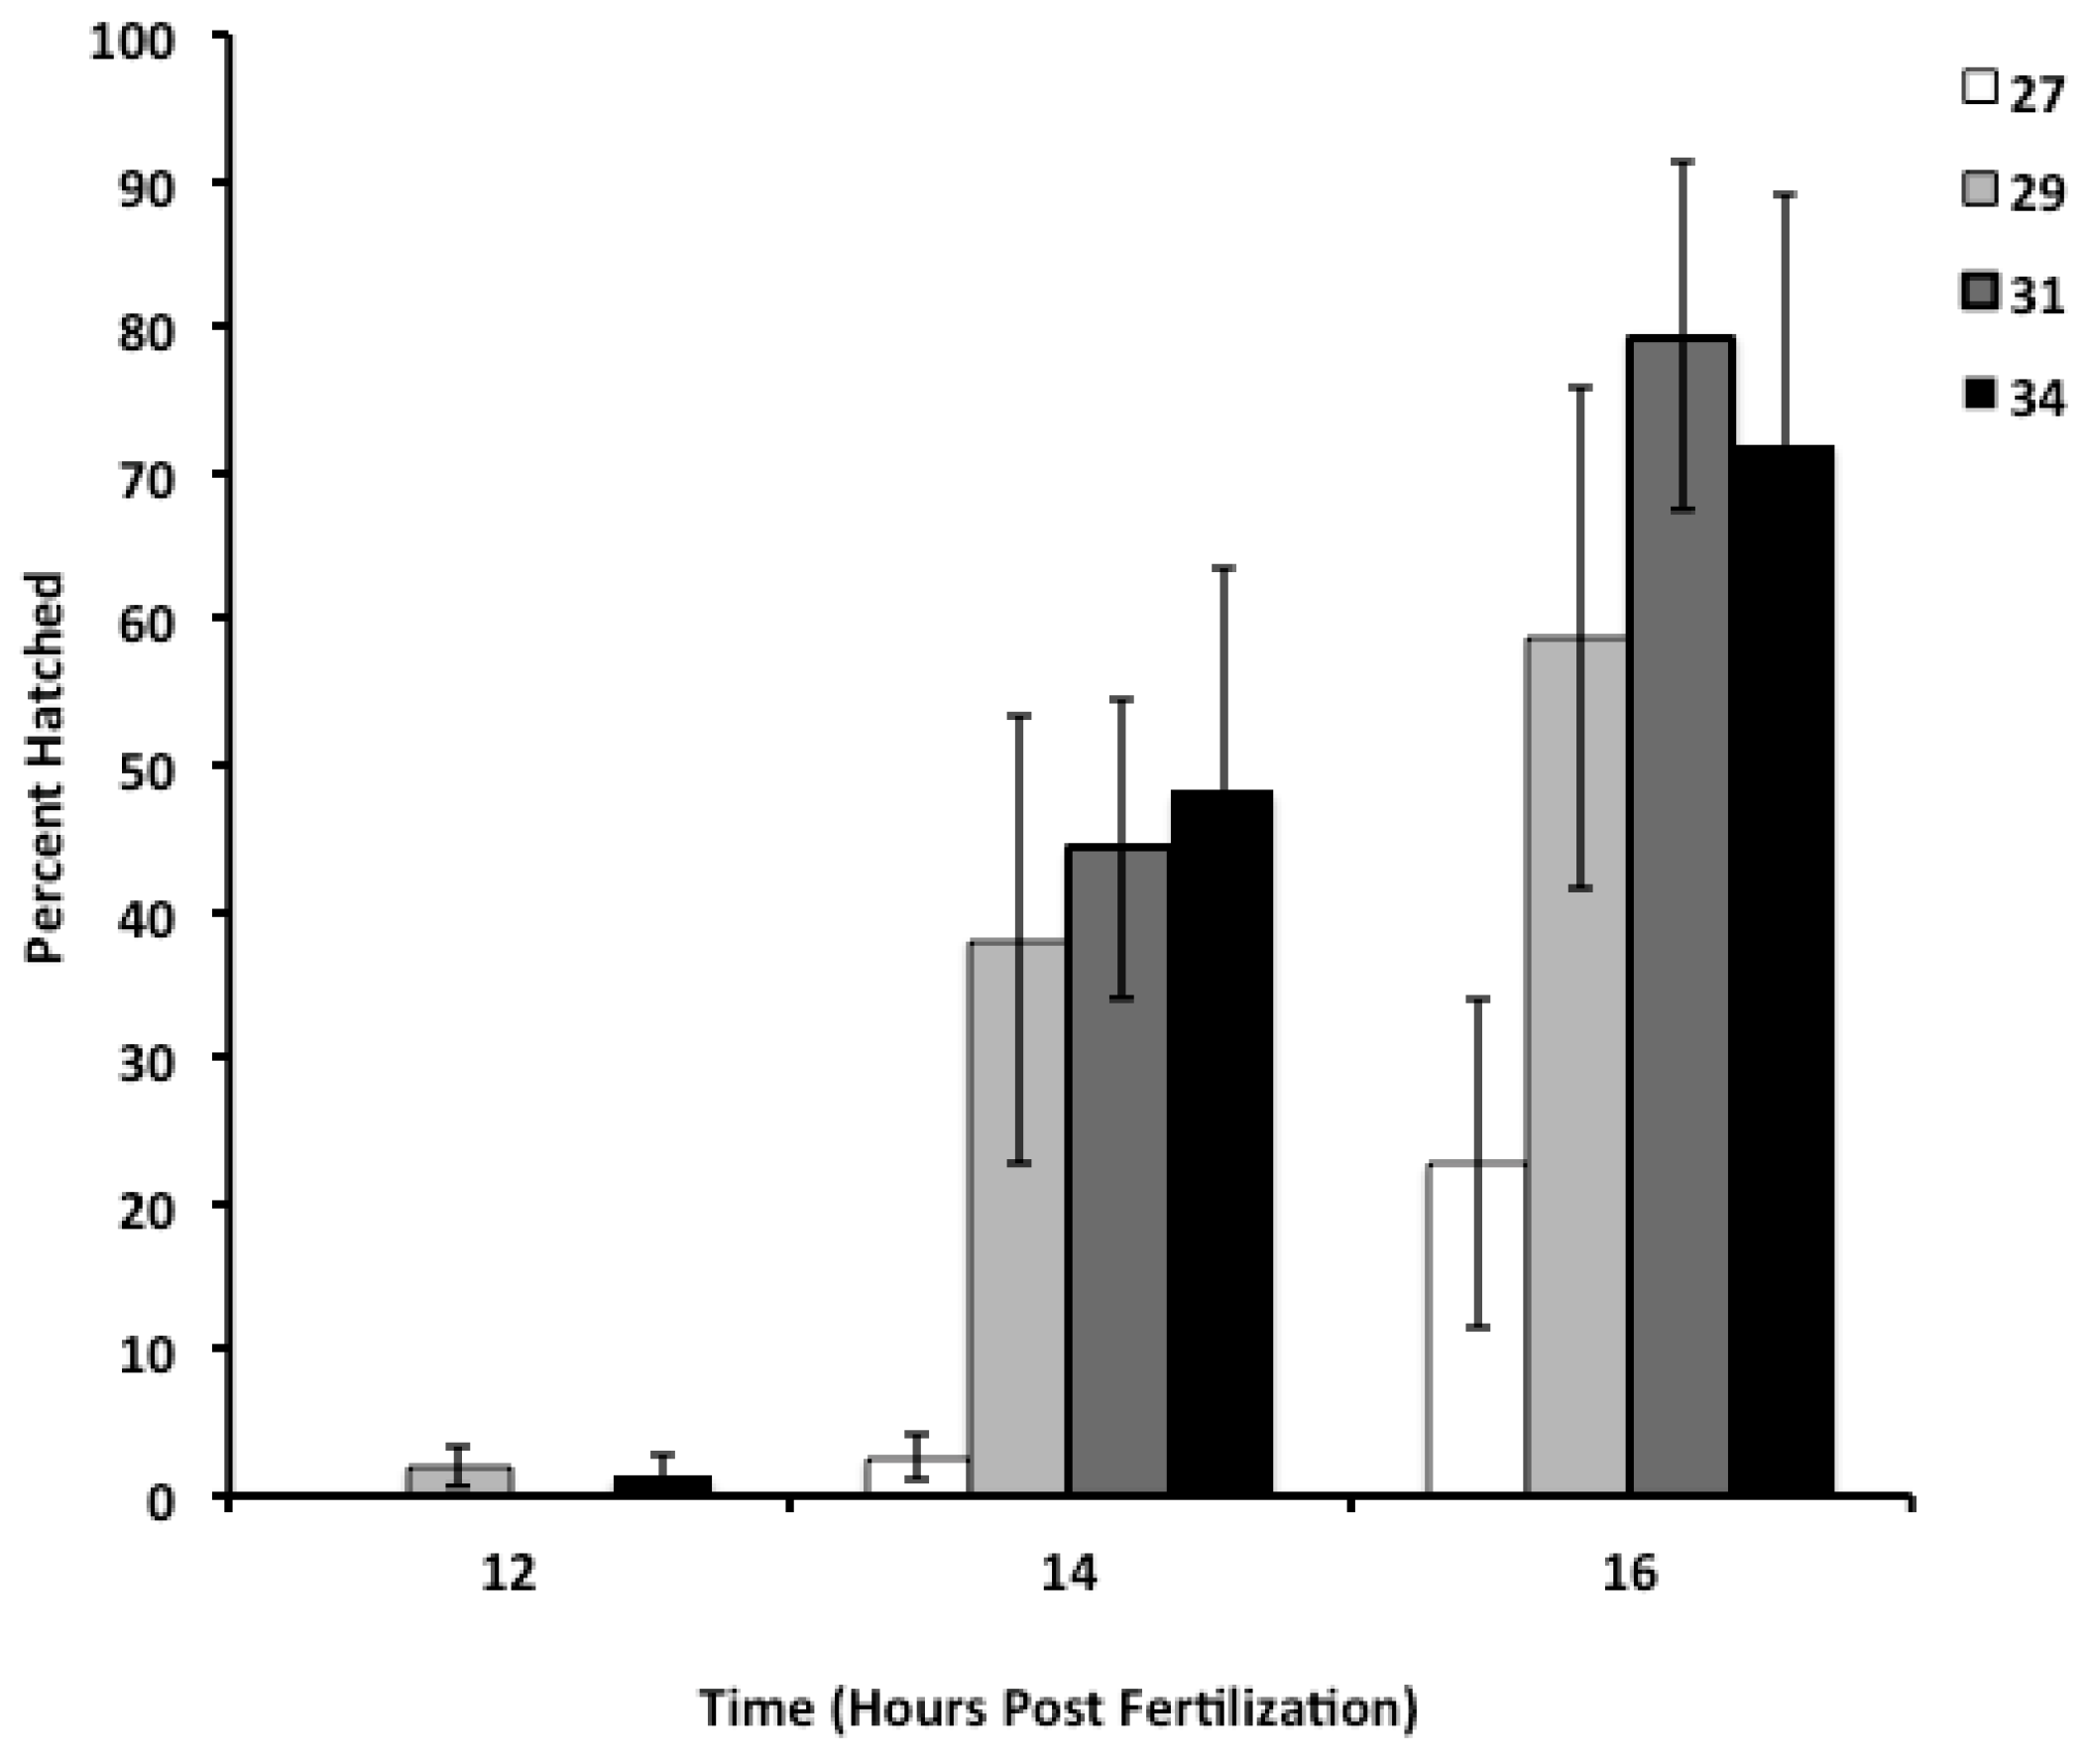
3.1. Effects of Salinity on Fertilization, Early Development, and Hatching Time of Crown-of-Thorns Seastars

Salinity had a significant effect on the percentage of eggs that were fertilized (Figure 1), as determined by a Kruskal-Wallis test (H = 14.636, d.f. = 5, p = 0.021). Multiple pairwise comparisons across all salinity levels revealed that fertilization at 23 ppt was significantly lower than fertilization success at 34 ppt. All other pairwise comparisons were not significantly different from one another after the p-values were corrected for multiple comparisons. While not statistically significant, the decrease in fertilization at 25 ppt in some crosses indicates that this salinity level may approach the threshold for fertilization success.
Salinity had a significant effect on the proportion of embryos that exhibited normal development. Using a mixed-model ANOVA, we found that the proportion of embryos exhibiting normal development was significantly reduced when salinity was reduced (F1,4 = 9.989; p < 0.001; Figure 2). Post-hoc tests with Bonferroni corrections revealed that the frequency of normal development at 25 ppt was significantly lower than at all other salinities (p < 0.001) except for 27 ppt (p = 0.070). The frequency of normal development at 27 ppt was also lower than the frequency at 29 ppt (p = 0.028) and 31 ppt (p = 0.039), but was not different from the frequency at 34 ppt (p = 0.110; Figure 2). The decrease in the frequency of normal development at 27 ppt indicates that this salinity level approximates the embryo tolerance levels for reduced salinity.
We found that salinity, time, and male/female cross all had significant effects on the percentage of embryos that hatched between 12 and 16 hpf (Figure 3). We initially tested for the main effects of salinity, time, and male/female cross using a full model with all two-way and three-way interactions included, but found that none of the interactions were significant and all exceeded a threshold p-value of 0.250 for removal from the model to create a reduced model focused on testing our main effects of interest [41]. The results of the reduced model are shown in Table 2 and show that all three main effects were highly significant predictors of hatching status in our experiments. We tested whether the fit of our model departed significantly from the data using a Hosmer-Lemeshow test, and found that it did (p < 0.002); however, our model correctly predicted hatching status in 82.3% of cases.
Plotting the mean success of fertilization and normal development by female shows different effects of salinity treatments across the male/female crosses (Figure 4). At fertilization, performance across all 11 females was reduced at all experimental salinity levels. At 14 hpf, however, it can be seen that developmental success was dependent on female identity where females 7 and 8 showed enhanced development with respect to the control salinity (Figure 4B).

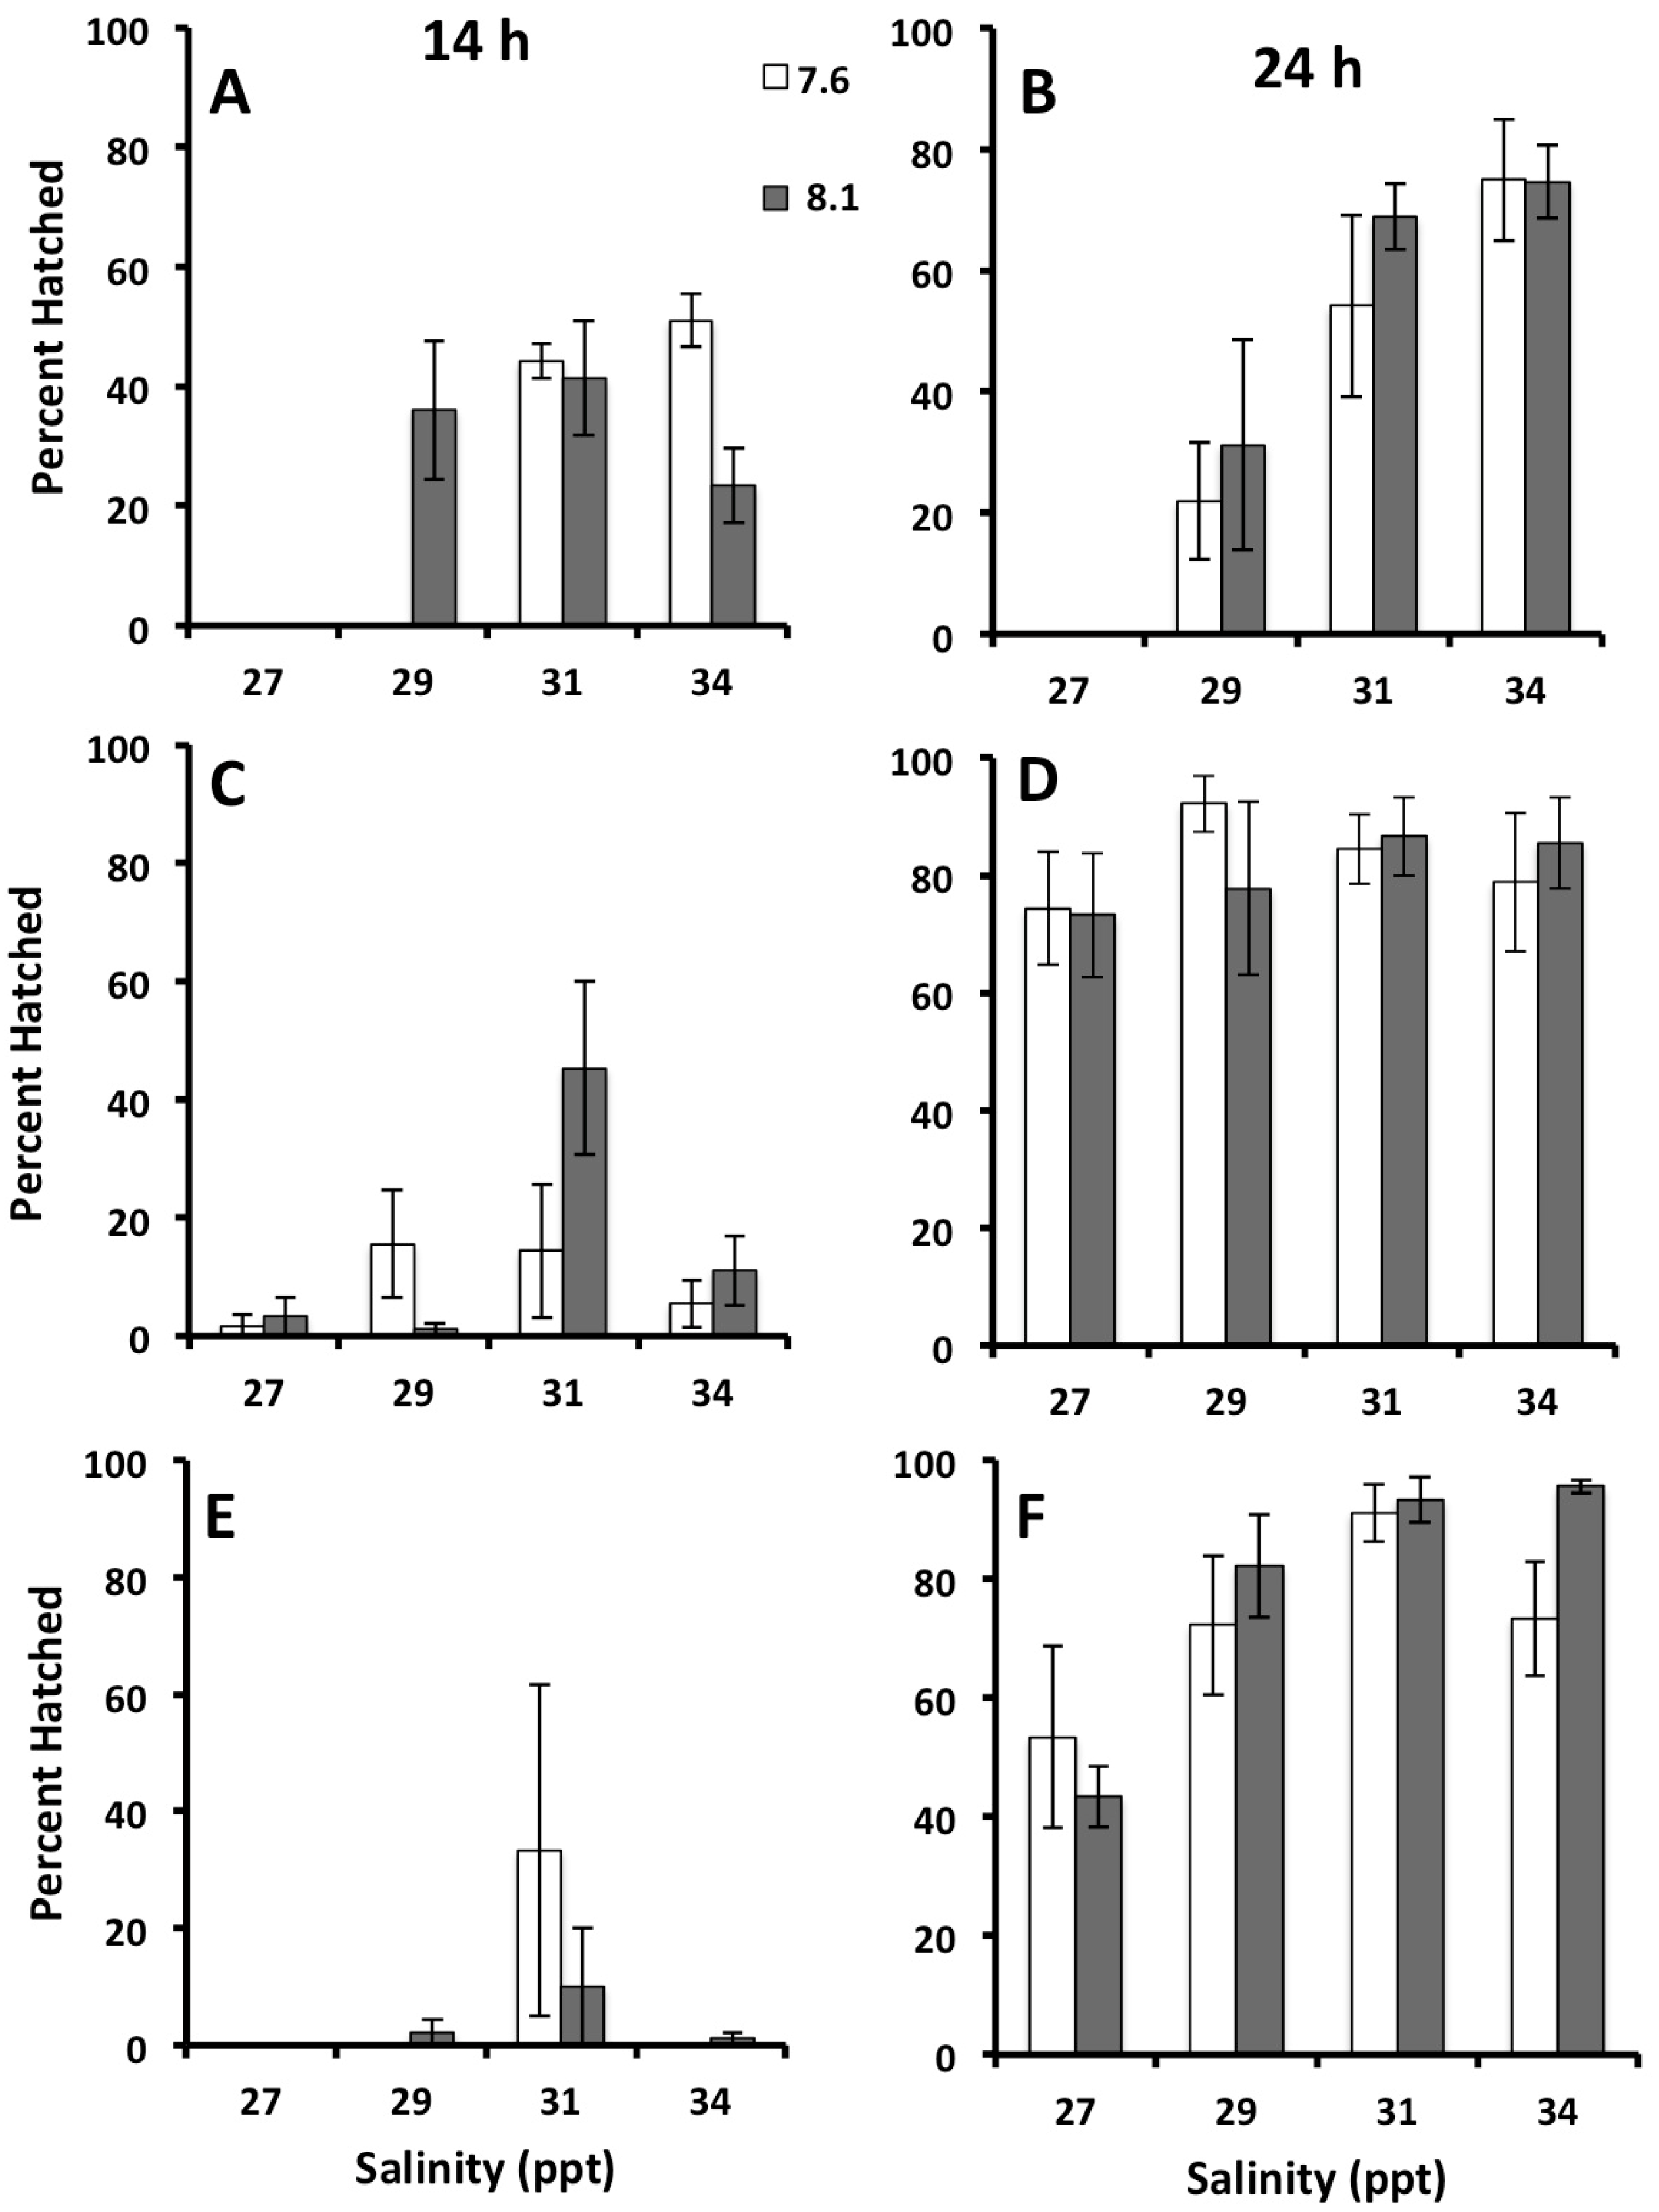
3.2. Effects of Salinity and pH on Early Development of Crown of Thorns Seastars

Salinity and time, but not pH, had a significant effect on the percentage of hatched embryos (Figure 5). We tested for the main fixed effects of salinity, pH, time, and for all possible interactions of these variables, along with the random effect of block. After running the full model described above, we removed all interactions where p > 0.250 and re-ran the reduced model presented in Table 3. The main effects of salinity and time both significantly affected the percent of embryos hatched (p < 0.001), but pH did not (Table 3). The random effect of block was also a significant factor affecting the percent of embryos hatched (F2,136 = 5.550; p = 0.005). For the main effect of salinity, 27 ppt yielded significantly lower percentages of hatching (p < 0.004) from all other levels, while 29 ppt was significantly lower (p < 0.005) than 31 ppt and the highest salinities of 31 and 34 ppt were not different from one another (p > 0.9).

4. Discussion

We found that salinity has a strong negative effect on the early development of COTS, beginning with fertilization and continuing through to hatching of embryos from the fertilization envelope. Fertilization was relatively resilient to reductions in salinity, remaining above 90% until salinity dropped to 25 ppt or below. However, by 14 hpf embryos began to exhibit sensitivity to salinity, as seen in the presence of high numbers of abnormal phenotypes at salinities <27 ppt. This pattern of increasing sensitivity to lower salinities continued into hatching. We detected negative effects of reduced salinity on the proportion of embryos hatching at <29 ppt, relative to embryos at 31 and 34 ppt. Overall, this suggests that salinity is an important factor to include in models of reproductive success in COTS, especially as it is likely to covary with other environmental conditions such as nutrient runoff and subsequent phytoplankton blooms that are currently associated with COTS outbreaks on the GBR [20].
As seen here for COTS development, echinoderms generally exhibit a narrow tolerance for decreased salinity during both planktonic and benthic life stages, although there is considerable variation among species [26,27]. Previous studies of the impact of lower salinity on fertilization (where gamete union was conducted in treatment water) in asteroids indicate that 24–26 ppt approximates the salinity when the percentage of fertilization decreases, and this is also influenced by temperature (e.g., 23% at 5 °C, 69% at 10 °C in Asterias amurensis) [42,43]. For COTS at 23–25 ppt, fertilization was fairly high (~75%), although it does appear that this level of decreased salinity approximates a threshold tolerance level. Similar results were obtained for fertilization in Acanthaster cf. solaris from Guam, where fertilization drops below 50% between 24 and 22 ppt [44]. By comparison, it appears that echinoid fertilization is more sensitive to decreased salinity, with significant deleterious effects at salinities below 28–29 ppt for sea urchins [45,46,47] and at 25 ppt for a sand dollar [28]. For Lytechinus variegatus, fertilization was reduced to ~10% at 25 ppt [42].
The percentage of normal development for COTS was significantly lower at 27 ppt and it appears that this level of reduced salinity may be a tipping point for deleterious effects. Similarly, increased embryo abnormality was observed in the asteroids Pisaster ochraceus and Asterias amurensis at ~ 25–26 ppt [42,43,44,45] and in the echinoid Evechinus chloroticus at 29 ppt [44]. While reduced salinity has been reported to induce polyembryony in echinoid species [32], the phenomenon of polyembryony was not observed in COTS under any experimental treatment. There was variation in the performance, with the progeny of some females showing enhanced development with respect to the control salinity. As seen in studies of other stressors, the variable performance of progeny with respect to parental source indicates that there may be standing genetic variation in tolerance to salinity and potential for adaptation [48].
In general, decreased salinity is well known to delay or retard development in echinoderms [26,28,29,45,47,49,50,51,52]. For COTS, hatching was significantly delayed in embryos reared from fertilization at 27 ppt. Similarly, for Lytechinus variegatus time to hatching time was delayed by ~5 days at 28 ppt (six days vs. one day) [45]. Although we did not rear our cultures to the larval stage, delayed hatching in COTS due to low salinity is likely to be associated with larval abnormality, as shown for Pisaster ochraceus and Echinaster sp. [49,53]. Despite our finding of delayed hatching of COTS, no signs of changes in stage at hatching were observed, as has been found in some echinoids [29]. Regardless, any delay of hatching would be expected to increase the time spent in the risky planktonic phase [54,55,56], as it delays the onset of larval feeding. However, the negative developmental effects of salinity reductions may be offset by positive developmental effects associated with runoff events, especially phytoplankton blooms, that are known to covary with outbreaks of COTS [20].
Our results suggest that decreased salinity has a greater deleterious effect on hatching than does decreased pH, as also found for Acanthaster cf. solaris in Guam [44]. Thus, it appears that the hatching stage is relatively resilient to lower pH while other time points in development are more vulnerable in both earlier (e.g., gametes) and later (e.g., larvae) life stages of COTS, creating potential life history bottlenecks [44,57,58,59], while there are potential benefits of near future ocean acidification for the early juvenile [60].
The degree to which COTS eggs, embryos, and larvae encounter lower salinity water in nature remains an open question. The eggs and sperm of COTS are neutrally buoyant (sperm) or nearly so (eggs), and thus their dispersion is largely dependent on hydrodynamic conditions at the time of spawning [61]. The vertical distribution of COTS larvae is unknown, but larvae are widely distributed horizontally on the GBR, and recently have been shown to be dispersed across most of the GBR during the spawning season, even at sites distant from known outbreaks [62]. This wide geographic coverage suggests that at least some embryos and larvae are likely to encounter low salinity waters from either river plumes or intense rain events, both of which have been demonstrated to reduce salinity over the GBR during the wet season [23,63,64]. Wet season flood events can create flood plumes that extend up to 100 km offshore in GBR waters, causing pulses of low salinity onto mid-shelf reefs [21,22,23]. Salinity exposure in the upper 50 m of the water column calculated using a hydrodynamic model (eReefs http://www.bom.gov.au/environment/activities/coastal-info.shtml) during the 2010–2016 wet seasons showed salinity minima of 27 and 29 extended up to ~65 and 80 km, respectively, off the north Queensland coast onto some mid-shelf reefs. In addition, freshwater impacts on the GBR have become more frequent since the time of European settlement, with high flow events occurring in one out of every six years since 1948 [24]. This leaves open the possibility that low salinity events on the GBR may continue to increase in frequency and/or intensity.
While we show that the embryonic stages of COTS are sensitive to low salinity, Lucas (1973) reported that larvae are less so [27]. Larvae transferred to 26 ppt, a salinity level deleterious to embryos, were capable of completing development. This indicates that COTS larvae that encounter plumes of lower salinity water in nature might be robust. Similarly, the bipinnaria larvae of Asterias amurensis tolerated being transferred from ambient salinity seawater to 20–32 ppt [42]. After initial osmotic shock these larvae were able to restore swimming activity, although they swam more slowly at decreased salinity. Larval tolerance to transfer to low salinity increased with larval age [42]. This indicates asteroid larvae, perhaps especially those of resilient boom and bust species such as Asterias amurensis and Acanthaster cf. solaris [14], can tolerate low salinity perturbations. An extreme example of salinity tolerance among asteroids is found in populations of the seastar Asteria rubens in brackish waters of the Baltic Sea, where it occurs at salinities from 15 to 35 ppt [65]. In some populations of this species, survival of fertilized eggs to embryos is actually highest at 24 ppt [65] and development to metamorphosis can be completed at salinities as low as 15 ppt [66].
Across all asteroids, even the extreme cases described above, there is a limit to low salinity tolerance in larvae that is likely to differ not only taxonomically, but also with respect to the duration of the perturbation and across larval ages. Pisaster ochraceus gastrulae and larvae exposed to low salinity (20 ppt) for 20 days, as occurs during precipitation events, developed into shorter and wider larvae, while those exposed to shorter pulses of lower salinity (three days) developed into longer and more slender larvae [67]. This salinity-induced morphological change in seastar larvae likely has consequences for swimming and feeding, as both of these functions are strongly influenced by larval size and shape [68]. The ability of asteroid larvae to change shape with respect to salinity treatments may indicate an ability to phenotypically adjust their body profile to maximize feeding and swimming efficiency with regard to salinity conditions, albeit with a lower limit [67]. For COTS and other asteroid and echinoid larvae, phenotypic plasticity with respect to their food environment is a key mechanism of resilience [15,69,70]. That larvae may also be able to adjust their phenotype in response to the salinity environment warrants further investigation. In addition, asteroid and echinoid larvae exhibit avoidance behaviour swimming away from, or not swimming into, low salinity water [71,72], and this ability has recently been shown to be affected by prior exposure to low salinity during early development [73]. This behavioural plasticity may increase larval survival and, given the plasticity of echinoderm larval growth, may also be associated with differing body profiles. Empirical data on the influence of the timing of exposure (with respect to larval stage/age) on low salinity tolerance of COTS larvae, the life stage most likely to encounter pulses of low salinity conditions during flooding periods, and the potential for salinity-induced phenotypic plasticity is needed to more fully understand the resilience of this species with respect to the influence of freshwater incursions.

Acknowledgments

The research was supported by an Ian Potter Foundation Grant from Lizard Island Research Station, a facility of the Australian Museum, a PhD scholarship from the University of Sydney (SF), a Yulgilbar Foundation Fellowship (S.-A.W.), a Reves Center International Grant and a Mary E. Ferguson Research Grant from William and Mary (K.R.S.). Thanks to Symon Dworjanyn, Kennedy Wolfe, Mailie Galle, and Juselyn Tupik for assistance. We gratefully acknowledge the assistance of the team of Morgan Pratchett in obtaining specimens, particularly Ciemon Caballes, Morgan Pratchett, and Vanessa Messmer.

Author Contributions

J.D.A., M.B., K.R.S., S.A.F., and S.-A.W. conceived and designed the experiments; K.R.S., S.A.F., M.B., and S.-A.W. performed the experiments; J.D.A. and S.A.F. analysed the data; M.B. and S.-A.W. contributed reagents/materials/analysis tools; J.D.A., M.B., K.R.S., S.A.F., and S.-A.W. wrote the paper.

Conflicts of Interest

The authors declare no conflict of interest.

References

  1. Anthony, K.R.N. Coral reefs under climate change and ocean acidification: Challenges and opportunities for management and policy. Ann. Rev. Environ. Resour. 2016, 41, 59–81. [Google Scholar] [CrossRef]
  2. Lough, J.M. Coral reefs: Turning back time. Nature 2016, 531, 314–315. [Google Scholar] [CrossRef] [PubMed]
  3. Normile, D. El Niño’s warmth devastating reefs worldwide. Science 2016, 352, 15–16. [Google Scholar] [CrossRef] [PubMed]
  4. Bruno, J.F.; Selig, E.R. Regional Decline of Coral Cover in the Indo-Pacific: Timing, Extent, and Subregional Comparisons. PLoS ONE 2007, 2, e711. [Google Scholar] [CrossRef] [PubMed]
  5. De’ath, G.; Fabricius, K.E.; Sweatman, H.; Puotinen, M. The 27—Year decline of coral cover on the Great Barrier Reef and its causes. Proc. Nat. Acad. Sci. USA 2012, 109, 17995–17999. [Google Scholar] [CrossRef] [PubMed]
  6. Baird, A.H.; Pratchett, M.S.; Hoey, A.S.; Herdiana, Y.; Campbell, S.J. Acanthaster planci is a major cause of coral mortality in Indonesia. Coral Reefs 2013, 32, 803–812. [Google Scholar] [CrossRef]
  7. Plass-Johnson, J.G.; Schwieder, H.; Heiden, J.; Weiand, L.; Wild, C.; Jompa, J.; Ferse, S.C.A.; Teichberg, M. A recent outbreak of crown-of-thorns starfish (Acanthaster planci) in the Spermonde Archipelago, Indonesia. Reg. Environ. Chang. 2015, 15, 1157–1162. [Google Scholar] [CrossRef]
  8. Pratchett, M.S.; Caballes, C.F.; Rivera-Posada, J.A.; Sweatman, H.P.A. Limits to Understanding and Managing Outbreaks of Crown-of-Thorns Starfish (Acanthaster spp.). Oceanogr. Mar. Biol. Annu. Rev. 2014, 52, 133–200. [Google Scholar]
  9. Osborne, K.; Dolman, A.M.; Burgess, S.C.; Kerryn, J.A. Disturbance and dynamics of coral cover on the Great Barrier Reef (1995–2009). PLoS ONE 2011, 6, e17516. [Google Scholar] [CrossRef] [PubMed]
  10. Lourey, M.J.; Ryan, D.A.J.; Miller, I.R. Rates of decline and recovery of coral cover on reefs impacted by, recovering from and unaffected by crown-of-thorns starfish Acanthaster planci: A regional perspective of the Great Barrier Reef. Mar. Ecol. Prog. Ser. 2000, 196, 179–186. [Google Scholar] [CrossRef]
  11. Halford, A.; Cheal, A.J.; Ryan, D.; Williams, D.M. Resilience to large-scale disturbance in coral and fish assemblages on the Great Barrier Reef. Ecology 2004, 85, 1892–1905. [Google Scholar] [CrossRef]
  12. Fabricius, K.E.; Okaji, K.; De’ath, G. Three lines of evidence to link outbreaks of the crown-of-thorns seastar Acanthaster planci to the release of larval food limitation. Coral Reefs 2010, 29, 593–605. [Google Scholar] [CrossRef]
  13. Kayal, M.; Vercelloni, J.; Lison de Loma, T.; Bosserelle, P.; Chancerelle, Y.; Geoffroy, S.; Stievenart, C.; Michonneau, F.; Penin, L.; Planes, S.; et al. Predator Crown-of-Thorns Starfish (Acanthaster planci) Outbreak, Mass Mortality of Corals, and Cascading Effects on Reef Fish and Benthic Communities. PLoS ONE 2012, 7. [Google Scholar] [CrossRef] [PubMed]
  14. Uthicke, S.; Schaffelke, B.; Byrne, M. A boom-bust phylum? Ecological and evolutionary consequences of density variations in echinoderms. Ecol. Monogr. 2009, 79, 3–24. [Google Scholar] [CrossRef]
  15. Wolfe, K.; Graba-Landry, A.; Dworjanyn, S.A.; Byrne, M. Larval phenotypic plasticity in the boom-and-bust crown-of-thorns seastar, Acanthaster planci. Mar. Ecol. Prog. Ser. 2015, 539, 179–189. [Google Scholar] [CrossRef]
  16. Wolfe, K.; Graba-Landry, A.; Dworjanyn, S.A.; Byrne, M. Larval starvation to satiation: influence of nutrient regime on the success of Acanthaster planci. PLoS ONE 2015, 10, e0122010. [Google Scholar] [CrossRef] [PubMed]
  17. Babcock, R.C.; Milton, D.A.; Pratchett, M.S. Relationships between size and reproductive output in the crown-of-thorns starfish. Mar. Biol. 2016, 163, 234. [Google Scholar] [CrossRef]
  18. Wooldridge, S.A.; Brodie, J.E. Environmental triggers for primary outbreaks of crown-of-thorns star fish on the Great Barrier Reef, Australia. Mar. Pollut. Bull. 2015, 101, 805–815. [Google Scholar] [CrossRef] [PubMed]
  19. Wolfe, K.; Graba-Landry, A.; Dworjanyn, S.A.; Byrne, M. Superstars: Assessing nutrient thresholds for enhance larval success of Acanthaster planci, a review of the evidence. Mar. Pollut. Bull. 2017. [Google Scholar] [CrossRef] [PubMed]
  20. Brodie, J.; Fabricius, K.; De’ath, G.; Okaji, K. Are increased nutrient inputs responsible for more outbreaks of crown-of-thorns starfish? An appraisal of the evidence. Mar. Pollut. Bull. 2005, 51, 266–278. [Google Scholar] [CrossRef] [PubMed]
  21. Wolanski, E.; Jones, M. Physical properties of Great Barrier Reef lagoon waters near Townsville. I. Effects of Burdekin River floods. Mar. Freshw. Res. 1981, 32, 305–319. [Google Scholar] [CrossRef]
  22. King, B.A.; McAllister, F.A.; Wolanski, E.J.; Done, T.J.; Spagnol, S.B. River plume dynamics in the central Great Barrier Reef. In Oceanographic Processes of Coral Reefs: Physical and Biological Links in the Great Barrier Reef; Wolanski, E.J., Ed.; CRC Press: Boca Raton, FL, USA, 2001; Chapter 10; pp. 145–160, 356. [Google Scholar]
  23. Brodie, J.E.; Kroon, F.J.; Schaffelke, B.; Wolanski, E.C.; Lewis, S.E.; Devlin, M.J.; Bohnet, I.C.; Bainbridge, Z.T.; Waterhouse, J.; Davis, A.M. Terrestrial pollutant runoff to the Great Barrier Reer: An update of issues, priorities and management responses. Mar. Pollut. Bull. 2012, 65, 81–100. [Google Scholar] [CrossRef] [PubMed]
  24. Lough, J.M.; Lewis, S.E.; Cantin, N.E. Freshwater impacts in the central Great Barrier Reef: 1648–2011. Coral Reefs 2015, 34, 739–751. [Google Scholar] [CrossRef]
  25. Intergovernmental Panel on Climate Change (IPCC). Climate Change 2014: Synthesis Report. Contribution of Working Groups I, II and III to the Fifth Assessment Report of the Intergovernmental Panel on Climate Change; IPCC: Geneva, Switzerland, 2014. [Google Scholar]
  26. Stickle, W.B.; Diehl, W.J. Effects of salinity on echinoderms. In Echinoderm Studies; Jangoux, M., Lawrence, J.M., Eds.; Balkema: Rotterdam, The Netherlands, 1987; Volume 2, pp. 235–285. [Google Scholar]
  27. Lucas, J. Reproductive and larval biology of Acanthaster planci (L.) in Great Barrier Reef waters. Micronesica 1973, 9, 197–203. [Google Scholar]
  28. Russell, M.P. Echinoderm responses to variation in salinity. Adv. Mar. Biol. 2013, 66, 171–212. [Google Scholar] [PubMed]
  29. Allen, J.D.; Pechenik, J.A. Understanding the effects of low salinity on fertilization success and early development in the sand dollar Echinarachnius parma. Biol. Bull. 2010, 218, 189–199. [Google Scholar] [CrossRef] [PubMed]
  30. Armstrong, A.F.; Blackburn, H.N.; Allen, J.D. A novel report of hatching plasticity in the phylum Echinodermata. Am. Nat. 2013, 181, 264–272. [Google Scholar] [CrossRef] [PubMed]
  31. Yu, P.C.; Sewell, M.A.; Matson, P.G.; Rivest, E.B.; Kapsenberg, L.; Hofmann, G.E. Growth attenuation with developmental schedule progression in embryos and early larvae of Sterechinus neumayeri raised under elevated CO2. PLoS ONE 2013, 8, e52448. [Google Scholar] [CrossRef] [PubMed]
  32. Allen, J.D.; Armstrong, A.F.; Ziegler, S.L. Environmental induction of polyembryony in echinoid echinoderms. Biol. Bull. 2015, 229, 221–231. [Google Scholar] [CrossRef] [PubMed]
  33. Dickson, A.G.; Sabine, C.L.; Christian, J.R. Guide to Best Practices for Ocean O2 Measurements; PICES Special Publication: Sidney, Canada, 2007; Volume 3, p. 119. [Google Scholar]
  34. Liu, X.; Patsavas, M.C.; Byrne, R.H. Purification and characterization of meta-cresol purple for spectrophotometric seawater pH measurements. Environ. Sci. Technol. 2011, 45, 4862–4868. [Google Scholar] [CrossRef] [PubMed]
  35. Pierrot, D.; Lewis, E.; Wallace, D.W.R. MS Excel Program Developed for CO2 System Calculations. ORNL/CDIAC-105a; Carbon Dioxide Information Analysis Center, Oak Ridge National Laboratory, US Department of Energy: Oak Ridge, TE, USA, 2006.
  36. Mehrbach, C.; Culberson, C.H.; Hawley, J.E.; Pytkowicz, R.M. Measurement of the apparent dissociation constants of carbonic acid in seawater at atmospheric pressure. Limnol. Oceanogr. 1973, 18, 897–907. [Google Scholar] [CrossRef]
  37. Dickson, A.G.; Millero, F.J. A comparison of the equilibrium constants for the dissociation of carbonic acid in seawater media. Deep Sea Res. 1987, 34, 1733–1743. [Google Scholar] [CrossRef]
  38. Kramer, A.A.; Zimmerman, J.E. Assessing the calibration of mortality benchmarks in critical care: The Hosmer-Lemeshow test revisited. Crit. Care Med. 2007, 35, 2052–2056. [Google Scholar] [CrossRef] [PubMed]
  39. Dunn, O.J. Multiple Comparisons among Means. J. Am. Stat. Assoc. 1961, 56, 52–64. [Google Scholar] [CrossRef]
  40. Dunn, O.J. Multiple Comparisons Using Rank Sums. Technometrics 1964, 6, 241–252. [Google Scholar] [CrossRef]
  41. Quinn, G.P.; Keough, M.J. Experimental Design and Data Analysis for Biologists; Cambridge University Press: Cambridge, UK, 2002. [Google Scholar]
  42. Kashenko, S.D. Responses of embryos and larvae of the starfish Asterias amurensis to changes in temperature and salinity. Russ. J. Mar. Biol. 2005, 31, 294–302. [Google Scholar] [CrossRef]
  43. Kashenko, S.D. The combined effect of temperature and salinity on development of the sea star Asterina pectinifera. Russ. J. Mar. Biol. 2006, 32, 37–44. [Google Scholar] [CrossRef]
  44. Caballes, C.F.; Pratchett, M.S.; Raymundo, M.L.; Rivera-Posada, J.A. Environmental tipping points for sperm motility, fertilization, and embryonic development in the Crown-of-Thorns starfish, Acanthaster cf. solaris. Diversity 2017, 9, 10. [Google Scholar]
  45. Roller, R.A.; Stickle, W.B. Effects of temperature and salinity acclimation of adults on larval survival, physiology, and early development of Lytechinus variegatus. Mar. Biol. 1993, 116, 583–591. [Google Scholar] [CrossRef]
  46. Carballeira, C.; Martin-Diaz, L.; DelValls, T.A. Influence of salinity on fertilization and larval development toxicity tests with two species of sea urchin. Mar. Environ. Res. 2011, 72, 196–203. [Google Scholar] [CrossRef] [PubMed]
  47. Delorme, N.J.; Sewell, M.A. Temperature and salinity: Two climate change stressors affecting early development of the New Zealand sea urchin Evechinus chloroticus. Mar. Biol. 2014, 161, 1999. [Google Scholar] [CrossRef]
  48. Foo, S.A.; Byrne, M. Acclimatization and adaptive capacity of marine species in a changing ocean. Adv. Mar. Biol. 2016, 74, 69–116. [Google Scholar] [PubMed]
  49. Roller, R.A.; Stickle, W.B. Effects of salinity on larval tolerance and early developmental rates of 4 species of echinoderms. Can. J. Zool. 1985, 63, 1531–1538. [Google Scholar] [CrossRef]
  50. Metaxas, A. The effect of salinity on larval survival and development in the sea urchin Echinometra lucunter. Invertebr. Reprod. Dev. 1998, 34, 323–330. [Google Scholar] [CrossRef]
  51. Schiopu, D.; George, S.B. Diet and salinity effects on larval growth and development of the sand dollar Mellita isometra. Invertebr. Reprod. Dev. 2004, 45, 69–82. [Google Scholar] [CrossRef]
  52. Cowart, D.A.; Ulrich, P.N.; Miller, D.C.; Marsh, A.G. Salinity sensitivity of early embryos of the Antarctic sea urchin Sterechinus neumayeri. Pol. Biol. 2009, 32, 435–441. [Google Scholar] [CrossRef]
  53. Watts, S.A.; Scheibling, R.E.; Marsh, A.G.; McClintock, J.B. Effect of tempertature and salinity on larval development of sibling species of Echinaster (Echinodermata, Asteroidea) and their hybrids. Biol. Bull. 1982, 163, 348–354. [Google Scholar] [CrossRef]
  54. Morgan, S.G. Life and death in the plankton: Larval mortality and adaptation. In Ecology of Marine Invertebrate Larvae; McEdward, L.R., Ed.; CRC Press: Boca Raton, FL, USA, 1995; pp. 279–321. [Google Scholar]
  55. Lamare, M.; Barker, M.F. In situ estimates of larval development and mortality in the New Zealan sea urchin Evechinus chloroticus (Echinodermata: Echinoidea). Mar. Ecol. Prog. Ser. 1999, 180, 197–211. [Google Scholar] [CrossRef]
  56. Vaughn, D.; Allen, J.D. The peril of the plankton. Int. Comp. Biol. 2010, 50, 552–570. [Google Scholar] [CrossRef] [PubMed]
  57. Uthicke, S.; Pecorino, D.; Albright, R.; Negri, A.P.; Cantin, N.; Liddy, M.; Dworjanyn, S.; Kamya, P.; Byrne, M.; Lamare, M. Impacts of ocean acidification on early life-history stages and settlement of the coral-eating sea star Acanthaster planci. PLoS ONE 2013, 8, e8293. [Google Scholar] [CrossRef] [PubMed]
  58. Byrne, M. Global change ecotoxicology: Identification of early life history bottlenecks in marine invertebrates, variable species responses and variable experimental approaches. Mar. Environ. Res. 2012, 76, 3–15. [Google Scholar] [CrossRef] [PubMed]
  59. Kamya, P.Z.; Dworjanyn, S.A.; Hardy, N.; Mos, B.; Uthicke, S.; Byrne, M. Larvae of the coral eating crown-of-thorns starfish, Acanthaster planci in a warmer high CO2 ocean. Glob. Chang. Biol. 2014, 20, 3365–3376. [Google Scholar] [CrossRef] [PubMed]
  60. Kamya, P.Z.; Byrne, M.; Graba-Landry, A.; Dworjanyn, S.A. Near-future ocean acidification enhances the feeding rate and development of the herbivorous juveniles of the Crown of Thorns Starfish, Acanthaster planci. Coral Reefs 2016. [Google Scholar] [CrossRef]
  61. Benzie, J.; Black, K.; Moran, P.; Dixon, P. Small-Scale Dispersion of Eggs and Sperm of the Crown-of Thorns Starfish (Acanthaster planci) in a Shallow Coral Reef Habitat. Biol. Bull. 1994, 186, 153–167. [Google Scholar] [CrossRef]
  62. Uthicke, S.; Logan, M.; Liddy, M.; Francis, D.; Hardy, N.; Lamare, M. Climate change as an unexpected co-factor promoting coral eating seastar (Acanthaster planci) outbreaks. Sci. Rep. 2015, 5, 8402. [Google Scholar] [CrossRef] [PubMed]
  63. Wolanski, E.; Van Senden, D. Mixing of Burdekin river flood waters in the Great Barrier Reef. Mar. Freshw. Res. 1983, 34, 49–63. [Google Scholar] [CrossRef]
  64. Schroeder, T.; Devlin, M.J.; Brando, V.E.; Dekker, A.G.; Brodie, J.E.; Clementson, L.A.; McKinna, L. Inter-annual variability of wet season freshwater plume extent into the Great Barrier Reef lagoon based on satellite coastal ocean colour observations. Mar. Pollut. Bull. 2012, 65, 210–223. [Google Scholar] [CrossRef] [PubMed]
  65. Sarantchova, O.L. Research into tolerance for the environment salinity in sea starfish Asterias rubens L. from populations of the White Sea and Barentz Sea. J. Exp. Mar. Biol. Ecol. 2001, 264, 15–28. [Google Scholar] [CrossRef]
  66. Casties, I.; Clemmesen, C.; Melzner, F.; Thomsen, J. Salinity dependence of recruitment success of the sea star Asterias rubens in the brackish western Baltic Sea. Helgol. Mar. Res. 2015, 69, 169–175. [Google Scholar] [CrossRef]
  67. Pia, T.S.; Johnson, T.; George, S.B. Salinity-induced morphological changes in Pisaster ochraceus (Echinodermata: Asteroidea) larvae. J. Plankton Res. 2012, 34, 590–601. [Google Scholar] [CrossRef]
  68. Strathmann, R.R. The feeding behavior of planktotrophic echinoderm larvae: mechanisms, regulation, and rates of suspension-feeding. J. Exp. Mar. Biol. Ecol. 1971, 6, 109–160. [Google Scholar] [CrossRef]
  69. George, S.B. Phenotypic plasticity in the larvae of Luidia foliolata (Echinodermata: Asteroidea). In Echinoderms through Time; David, B., Guille, A., Roux, M., Eds.; A.A. Balkema: Rotterdam, The Netherlands, 1994; pp. 297–307. [Google Scholar]
  70. George, S.B. Egg quality, larval growth and phenotypic plasticity in a forcipulate seastar. J. Exp. Mar. Biol. Ecol. 1999, 237, 203–224. [Google Scholar] [CrossRef]
  71. Sameoto, J.A.; Metaxas, A. Can salinity-induced mortality explain larval vertical distribution with respect to a halocline? Biol. Bull. 2008, 214, 329–338. [Google Scholar] [CrossRef] [PubMed]
  72. Sameoto, J.A.; Metaxas, A. Interactive effects of haloclines and food patches on the vertical distribution of 3 species of temperate invertebrate larvae. J. Exp. Mar. Biol. Ecol. 2008, 367, 131–141. [Google Scholar] [CrossRef]
  73. Bashevkin, S.M.; Lee, D.; Driver, P.; Carrington, E.; George, S.B. Prior exposure to low salinity affects the vertical distribution of Pisaster ochraceus (Echinodermata: Asteroidea) larvae in haloclines. Mar. Ecol. Prog. Ser. 2016, 542, 123–140. [Google Scholar] [CrossRef]
Figure 1. Fertilization percentage of A. cf. solaris eggs across a range of salinities (ppt). Circles represent the mean (±SE) percent fertilization of 3–11 independent, replicate crosses for each salinity treatment. Numbers beneath each data point indicate the number of replicate females for that point. Letters above each data point indicate significant differences in percent fertilization among salinities based on a Kruskal-Wallis H test and post-hoc tests (see text for details). For symbols where error bars are not visible, the error bars are contained within that symbol.
Diversity 09 00013 g001
Figure 2. The percentage of embryos exhibiting normal development 14 h post fertilization (hpf) across a range of salinities (ppt). Bars represent the means (±SE) for N = 2–9 independent, replicate crosses. The number of crosses tested for a given salinity is recorded within each bar. At low salinity (25) only two crosses were conducted as no normal development was seen in either of the first two replicates. Letters above each bar denote statistically significant differences in the percentage of embryos completing normal development based on a mixed model ANOVA and post-hoc tests (see text for details).
Diversity 09 00013 g002
Figure 3. The relationship between percent hatching, salinity, and time in A. cf. solaris. Percent hatching increases with both time and salinity and varied significantly with male/female cross (see Table 1). Each bar represents the mean (±SE) for each of five replicate crosses, measured at three time points (12, 14, and 16 h post-fertilization).
Diversity 09 00013 g003
Figure 4. The difference in fertilization and early developmental success with respect to the control treatment (salinity of 34 ppt) grouped by female across experimental salinity treatments. Mean success per female is displayed for the different salinity levels across fertilization (A) and normal development 14 h post fertilization (B). Symbols above the line display higher success than the control, while success was lower than the control for those symbols below the line.
Diversity 09 00013 g004
Figure 5. The effect of salinity (ppt) and pH on the percent of hatched A. cf. solaris embryos at 14 and 24 h post fertilization. Each bar represents the mean (±SE) of three replicate blocks. Panels (A,B) represent the first block. Panels (C,D) represent the second block and panels (E,F) represent the third block. The colour of the bars represents the pH treatments. Dark grey = pH 8.1 and white = pH 7.6.
Diversity 09 00013 g005
Table 1. Experimental pH conditions in experiments with A. cf. solaris. Mean values for pHNIST (±SE, n = 3) for each salinity across experimental runs is presented, as well as the overall mean pHNIST (n = 12). pCO2 was calculated in CO2SYS using data on total alkalinity (TA, n = 2–4 per salinity), salinity, and pHNIST.
pH 8.1pH 7.6
2729313427293134
8.08 ± 0.028.07 ± 0.028.07 ± 0.028.07 ± 0.017.61 ± 0.017.61 ± 0.017.61 ± 0.017.61 ± 0.02
pHNIST8.09 ± 0.017.61 ± 0.00
TA (μmol/kg)1968.3±12.02026.9±7.12166.4±12.92309.4±2.01968.3±12.02026.9±7.12166.4±12.92309.4±2.0
pCO2 (ppm)492.4493.1514.3529.91682.11696.21779.61851.0
Table 2. Binomial logistic regression of hatching probability in A. cf. solaris. A full model found that all possible interactions yielded p > 0.250, and so the results of a reduced model using only main effects are presented. Significant effects are in bold.
Variableβp-ValueExp(β)
Salinity0.295>0.0011.343
Male/Female Cross−0.146>0.0010.864
Time1.025>0.0012.788
Table 3. ANOVA for the effects of salinity, pH, time, block (male/female cross), and their interactions on the percent of embryos hatched. Data were arcsine-square root transformed prior to analysis. Significant effects (p < 0.05) are in bold.
Dependent VariableFixed EffectsdfFp
Percent embryos hatchedSalinity313618.244<0.001
Time1136196.418<0.001
pH21361.0940.298

