Article

Microsatellites Reveal Genetic Homogeneity among Outbreak Populations of Crown-of-Thorns Starfish (Acanthaster cf. solaris) on Australia’s Great Barrier Reef

by
Hugo B. Harrison
1,*,
Morgan S. Pratchett
1,
Vanessa Messmer
1,
Pablo Saenz-Agudelo
2 and
Michael L. Berumen
3
1
Australian Research Council Centre of Excellence for Coral Reef Studies, James Cook University, Townsville, QLD 4811, Australia
2
Instituto de Ciencias Ambientales y Evolutivas, Universidad Austral de Chile, Valdivia 5090000, Chile
3
Red Sea Research Center, King Abdullah University of Science and Technology, Thuwal 23955-6900, Saudi Arabia
*
Author to whom correspondence should be addressed.
Diversity 2017, 9(1), 16; https://doi.org/10.3390/d9010016
Submission received: 30 November 2016 / Revised: 5 March 2017 / Accepted: 7 March 2017 / Published: 10 March 2017
(This article belongs to the Special Issue Biology, Ecology and Management of Crown-of-Thorns Starfish)

Abstract

:
Specific patterns in the initiation and spread of reef-wide outbreaks of crown-of-thorns starfish are important, both to understand potential causes (or triggers) of outbreaks and to develop more effective and highly targeted management and containment responses. Using analyses of genetic diversity and structure (based on 17 microsatellite loci), this study attempted to resolve the specific origin for recent outbreaks of crown-of-thorns on Australia’s Great Barrier Reef (GBR). We assessed the genetic structure amongst 2705 starfish collected from 13 coral reefs in four regions that spanned ~1000 km of the GBR. Our results indicate that populations sampled across the full length of the GBR are genetically homogeneous (G’ST = −0.001; p = 0.948) with no apparent genetic structure between regions. Approximate Bayesian computational analyses suggest that all sampled populations had a common origin and that current outbreaking populations of crown-of-thorns starfish (CoTS) in the Swains are not independent of outbreak populations in the northern GBR. Despite hierarchical sampling and large numbers of CoTS genotyped from individual reefs and regions, limited genetic structure meant we were unable to determine a putative source population for the current outbreak of CoTS on the GBR. The very high genetic homogeneity of sampled populations and limited evidence of inbreeding indicate rapid expansion in population size from multiple, undifferentiated latent populations.

1. Introduction

Crown-of-thorns starfish (CoTS; Acanthaster spp.) naturally occur on coral reefs throughout the Indo-Pacific [1,2] While normally found at low densities [3], sporadic population outbreaks of CoTS cause significant localised coral loss and are a major contributor to the ongoing degradation of coral reefs throughout the Indo West-Pacific [4,5,6,7]. Numerous hypotheses have been put forward to explain the occurrence of CoTS outbreaks (reviewed by [1,2,8]), most of which incite an anthropogenic basis for the purportedly recent and increasing occurrence of outbreaks. While their inherent life-history characteristics (most notably their high fecundity [9]) predisposes CoTS to major fluctuations in abundance [10], there are two prominent theories proposed to trigger outbreaks; the larval survival hypothesis suggests that anthropogenic eutrophication of nearshore waters dramatically increases the survival of planktonic larvae [11,12,13], whereas the predator removal hypothesis postulates that overfishing of natural predators has allowed more CoTS to reach sexual maturity [1]. Tests of either hypothesis require improved knowledge of when and where outbreaks start and corresponding research on environmental conditions and population demographics of CoTS at these locations.
Outbreaks of CoTS on Australia’s Great Barrier Reef (GBR) were first documented in 1962 [14], though there are earlier reports of high densities of starfish (which may or may not have constituted an “outbreak”) on the GBR e.g., [15,16]. Since 1962, there have been three additional outbreak episodes on the GBR, starting in 1979, 1993 and 2009. However, each outbreak has followed a reasonably consistent pattern where primary outbreaks were first recorded on mid-shelf reefs between Lizard Island and Cairns (the ‘initiation box’; Fabricius et al. [13]), followed by a wave of ‘secondary outbreaks’ that tend to propagate southwards [17,18]. Biophysical modelling of larval dispersal patterns suggests that reefs within the initiation box are highly connected [19], thereby explaining why outbreaks that initiate in this region inevitably lead to reef-wide outbreaks. However, limited temporal and spatial resolution of monitoring e.g., [20], as well as inevitable delays in responding to new outbreaks mean that it is still unclear where exactly outbreaks arise. It is also unknown whether outbreaks start from a small cluster of reefs within this area or arise simultaneously on widely separated reefs [2]. Resolving the exact timing and location where outbreaks start is important to establish environmental triggers [13] or changes in population demographics [21] that cause outbreaks. This could also lead to improved management and containment strategies to stop outbreaks before they spread.
Although native to the GBR, the spatial distribution of CoTS following an outbreak closely resembles the spread of invasive species and infectious diseases [22]. Historical and observational data have previously identified invasion routes or disease vectors e.g., [23], but direct observations have proven ineffective for CoTS e.g., [20], where it is still unclear whether outbreaks start from a single reef or arise simultaneously from separate locations [24]. The rapid expansion of populations following biological invasions can, however, lead to distinct patterns of genetic structure and diversity. Genetic data have increasingly been used as an indirect method to describe the spread of invasive species [25,26] and infer the relationship between discrete populations or possible migration routes [27]. Elaborating on these patterns, model-based statistics can provide probabilistic estimations of the demographic and genetic history that are necessary to generate observed patterns of genetic structure e.g., [28,29]. Approximate Bayesian computation (ABC) approaches that incorporate the divergence and admixture of populations, as well as changes in population size and structure [30] can provide important information on the likely initiation and spread of species e.g., [31,32].
This study examines genetic diversity and structure, based on sampling of crown-of-thorns starfish during the current outbreak on the GBR. Over four thousand starfish were sampled at 13 reefs spanning ~1000 km. The spatial genetic structure of a CoTS outbreak will depend on the history of the source population(s), the size of the initial population(s), the dispersal of individuals that led to a primary outbreak and successive secondary outbreaks. While the demographic factors contributing to each stage of an outbreak are unclear, a recent review clarifies many aspects of their population dynamics and life-history characteristics [2]. A model-based approach would therefore allow us to take into account the stochasticity of these demographic processes and test multiple scenarios that would have generated the observed spatial population structure of CoTS on the GBR. Specifically, we test whether the outbreak was generated from a single source population in the ‘initiation box’ or multiple populations. If a small number of individuals from a single source population caused a localised primary outbreak, we would expect successive secondary outbreaks to be affected by a single bottleneck, be composed of highly related individuals and have low genetic diversity. If the primary outbreak originated from multiple populations, we would expect multiple bottlenecks, founding a widespread admixed population, and high genetic diversity. Using a model-based Bayesian approach, we explore the likelihood of competing outbreak scenarios against the observed spatial genetic structure of CoTS to determine the most parsimonious origin of primary outbreaks on the GBR.

2. Materials and Methods

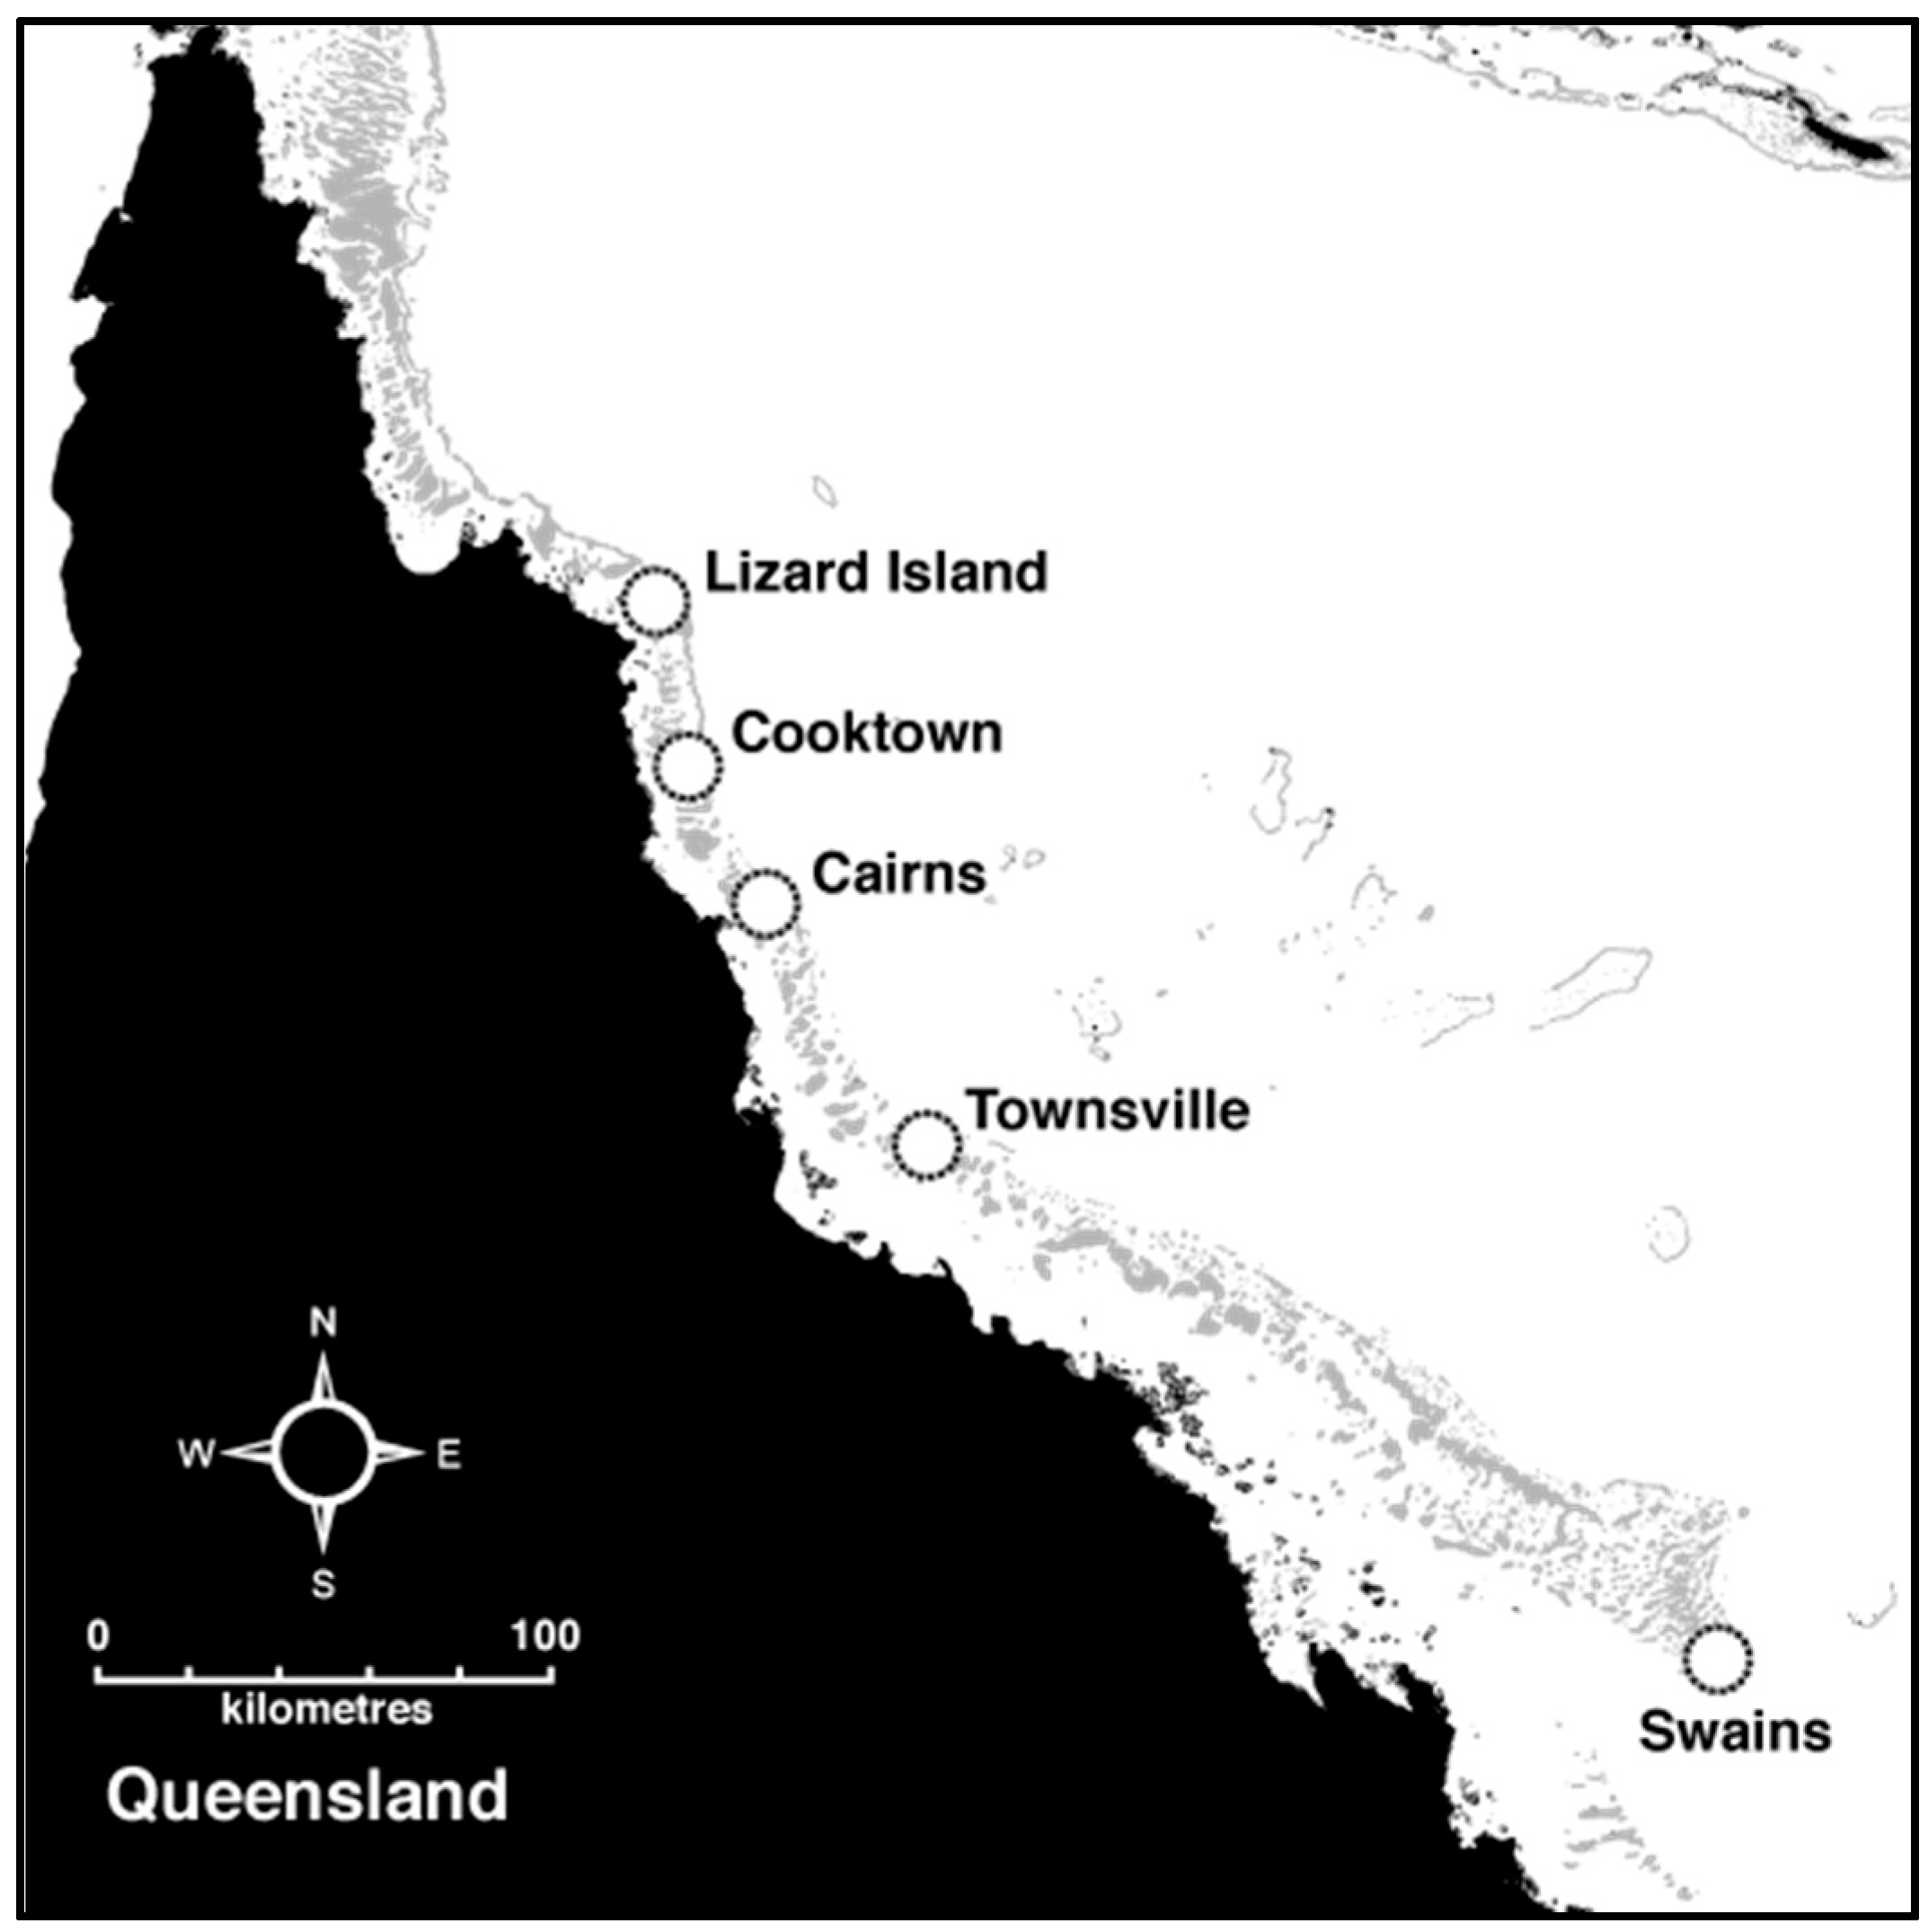
2.1. Sample Collection

Crown-of-thorns starfish (Acanthaster cf. solaris) were collected between April 2013 and May 2015 from 13 reefs between Lizard Island (S 14.7; E 145.4) and the Swains reefs (S 22.3; E 1527) (Figure 1). Starfish were collected whilst snorkelling or SCUBA diving (depending on working depths). All starfish were kept alive in 500 L tanks connected to high flow-through seawater systems on live-aboard boats or at the Lizard Island research station for a maximum of 20 h before being processed. Starfish were placed on their aboral surface to remove tube feet for genetic analyses; 5–10 tube feet (depending on size) were removed using fine scissors to cut the tube feet close to their base. Multiple tube feet from each individual were placed together in 2-mL vials of 100% ethanol. Later, a single foot was taken, frozen and transported in dry ice for processing at King Abdullah University of Science and Technology (KAUST). All equipment used during sampling and processing was sterilised using a three-step rinse procedure involving bleach, water and ethanol.

2.2. Microsatellite Genotyping and Locus Characteristics

The genetic diversity amongst sample populations was assessed using 26 previously-described microsatellite loci [33,34,35,36]. Full details of microsatellite development and screening are available in Harrison et al. [36]. DNA extractions were performed from single tube feet following procedures described in the Nucleospin-96 Tissue kit (Macherey-Nagel, Germany), and microsatellites were amplified in four multiplex reactions of 6 or 7 loci. All PCR were performed using the QIAGEN Microsatellite Type-it kit (QIAGEN, Germany) and screened on an ABI 3370xl DNA Analyzer (Applied Biosystems). PCRs were repeated on 96 individuals to estimate locus-specific genotyping error. Individual genotypes were scored in Genemapper v4.0 (Applied Biosystems), and unique alleles were distinguished using marker specific bin sets in the R package ‘msatallele’ [37].
The numbers of genotyped individuals (N), number alleles (Na), observed heterozygosity (Ho) and expected heterozygosity (He) were estimated for each locus using GenAlEx v6.5 [38,39]. The exact test of Hardy–Weinberg and the score test for heterozygote deficiency were performed in Genepop on the web [40,41] alongside Weir and Cockerham’s estimate of FIS [42]. The probability test for linkage disequilibrium was performed for each pair of loci in Genepop on the web based on 10,000 dememorisations, 5000 batches and 10,000 iterations. Significance levels of 0.05 were adjusted for a given false discovery rate of 10% to account for multiple testing [43]. The presence of null alleles was determined from 700 randomly selected individuals in Microchecker [44] based on the estimator of Brookfield [45].

2.3. Diversity Analysis of Sampled Populations

Allelic richness, observed and expected heterozygosities within populations were calculated in GenoDive 2.0 [46]. To assess population structure, we estimate global and pairwise genetic differences among sampled reefs within regions. Given the high level of heterozygosity in microsatellite markers, the degree of global genetic differentiation among populations was estimated from Hedrick’s standardised fixation index G’ST [47]. Population structure among reefs was estimated from an analysis of molecular variance (AMOVA) with reefs nested in regions. Significance was assessed from 9999 permutations, and the standard deviation of genetic variance was obtained through jack-knifing over loci. The significance of population differentiation between all pairs of populations was assessed from 9999 permutations over populations. We tested for isolation by distance (IBD) by comparing the pairwise matrix of linearised genetic distance (Hedrick’s G’ST) and geographic distance (km) between all sampled reefs. Statistical significance was assessed using a Mantel test with 9999 permutations, and significance values are shown.

2.4. Spatial Genetic Clustering

We applied a model-based Bayesian clustering method implemented in Structure v2.3.2 [48,49] to evaluate the most parsimonious allocation of samples to distinct genetic clusters following the method described by Evanno et al. [50]. If population outbreaks of CoTS stem from the successful fertilisation of multiple populations, we would expect the likelihood probability of the data to depart from its expected distribution of a single homogenous population. We performed three short runs for each number of populations K, from K = 1 to 10, and calculated the mean posterior probability for each value of K. Each run assumed population admixture for correlated allele frequencies and no a priori population assignment. The burn-in length was 30,000 followed by a Markov chain Monte Carlo (MCMC) length of 50,000 repetitions. The initial Dirichlet parameter for the degree of admixture ‘alpha’ was fixed to 1.0 in all simulations.
The statistical power to detect genetic structure amongst sampled populations was evaluated in the software Powsim v4.1 [51]. Three tests were performed to determine whether the number of sampled individuals, the number and diversity of loci could detect FST values of 0.0010 and 0.0005 and 0.0001. Each test assumed an effective population size of 5000 individuals and divergence times of 10, 5 and 1 generations, respectively. Due to software limitations in the number of alleles per locus, Apl19 was excluded from these analyses. The numbers of dememorisations, batches and iterations were set at 1000, 100 and 1000, respectively. A total of 1000 replicates were run for each test.

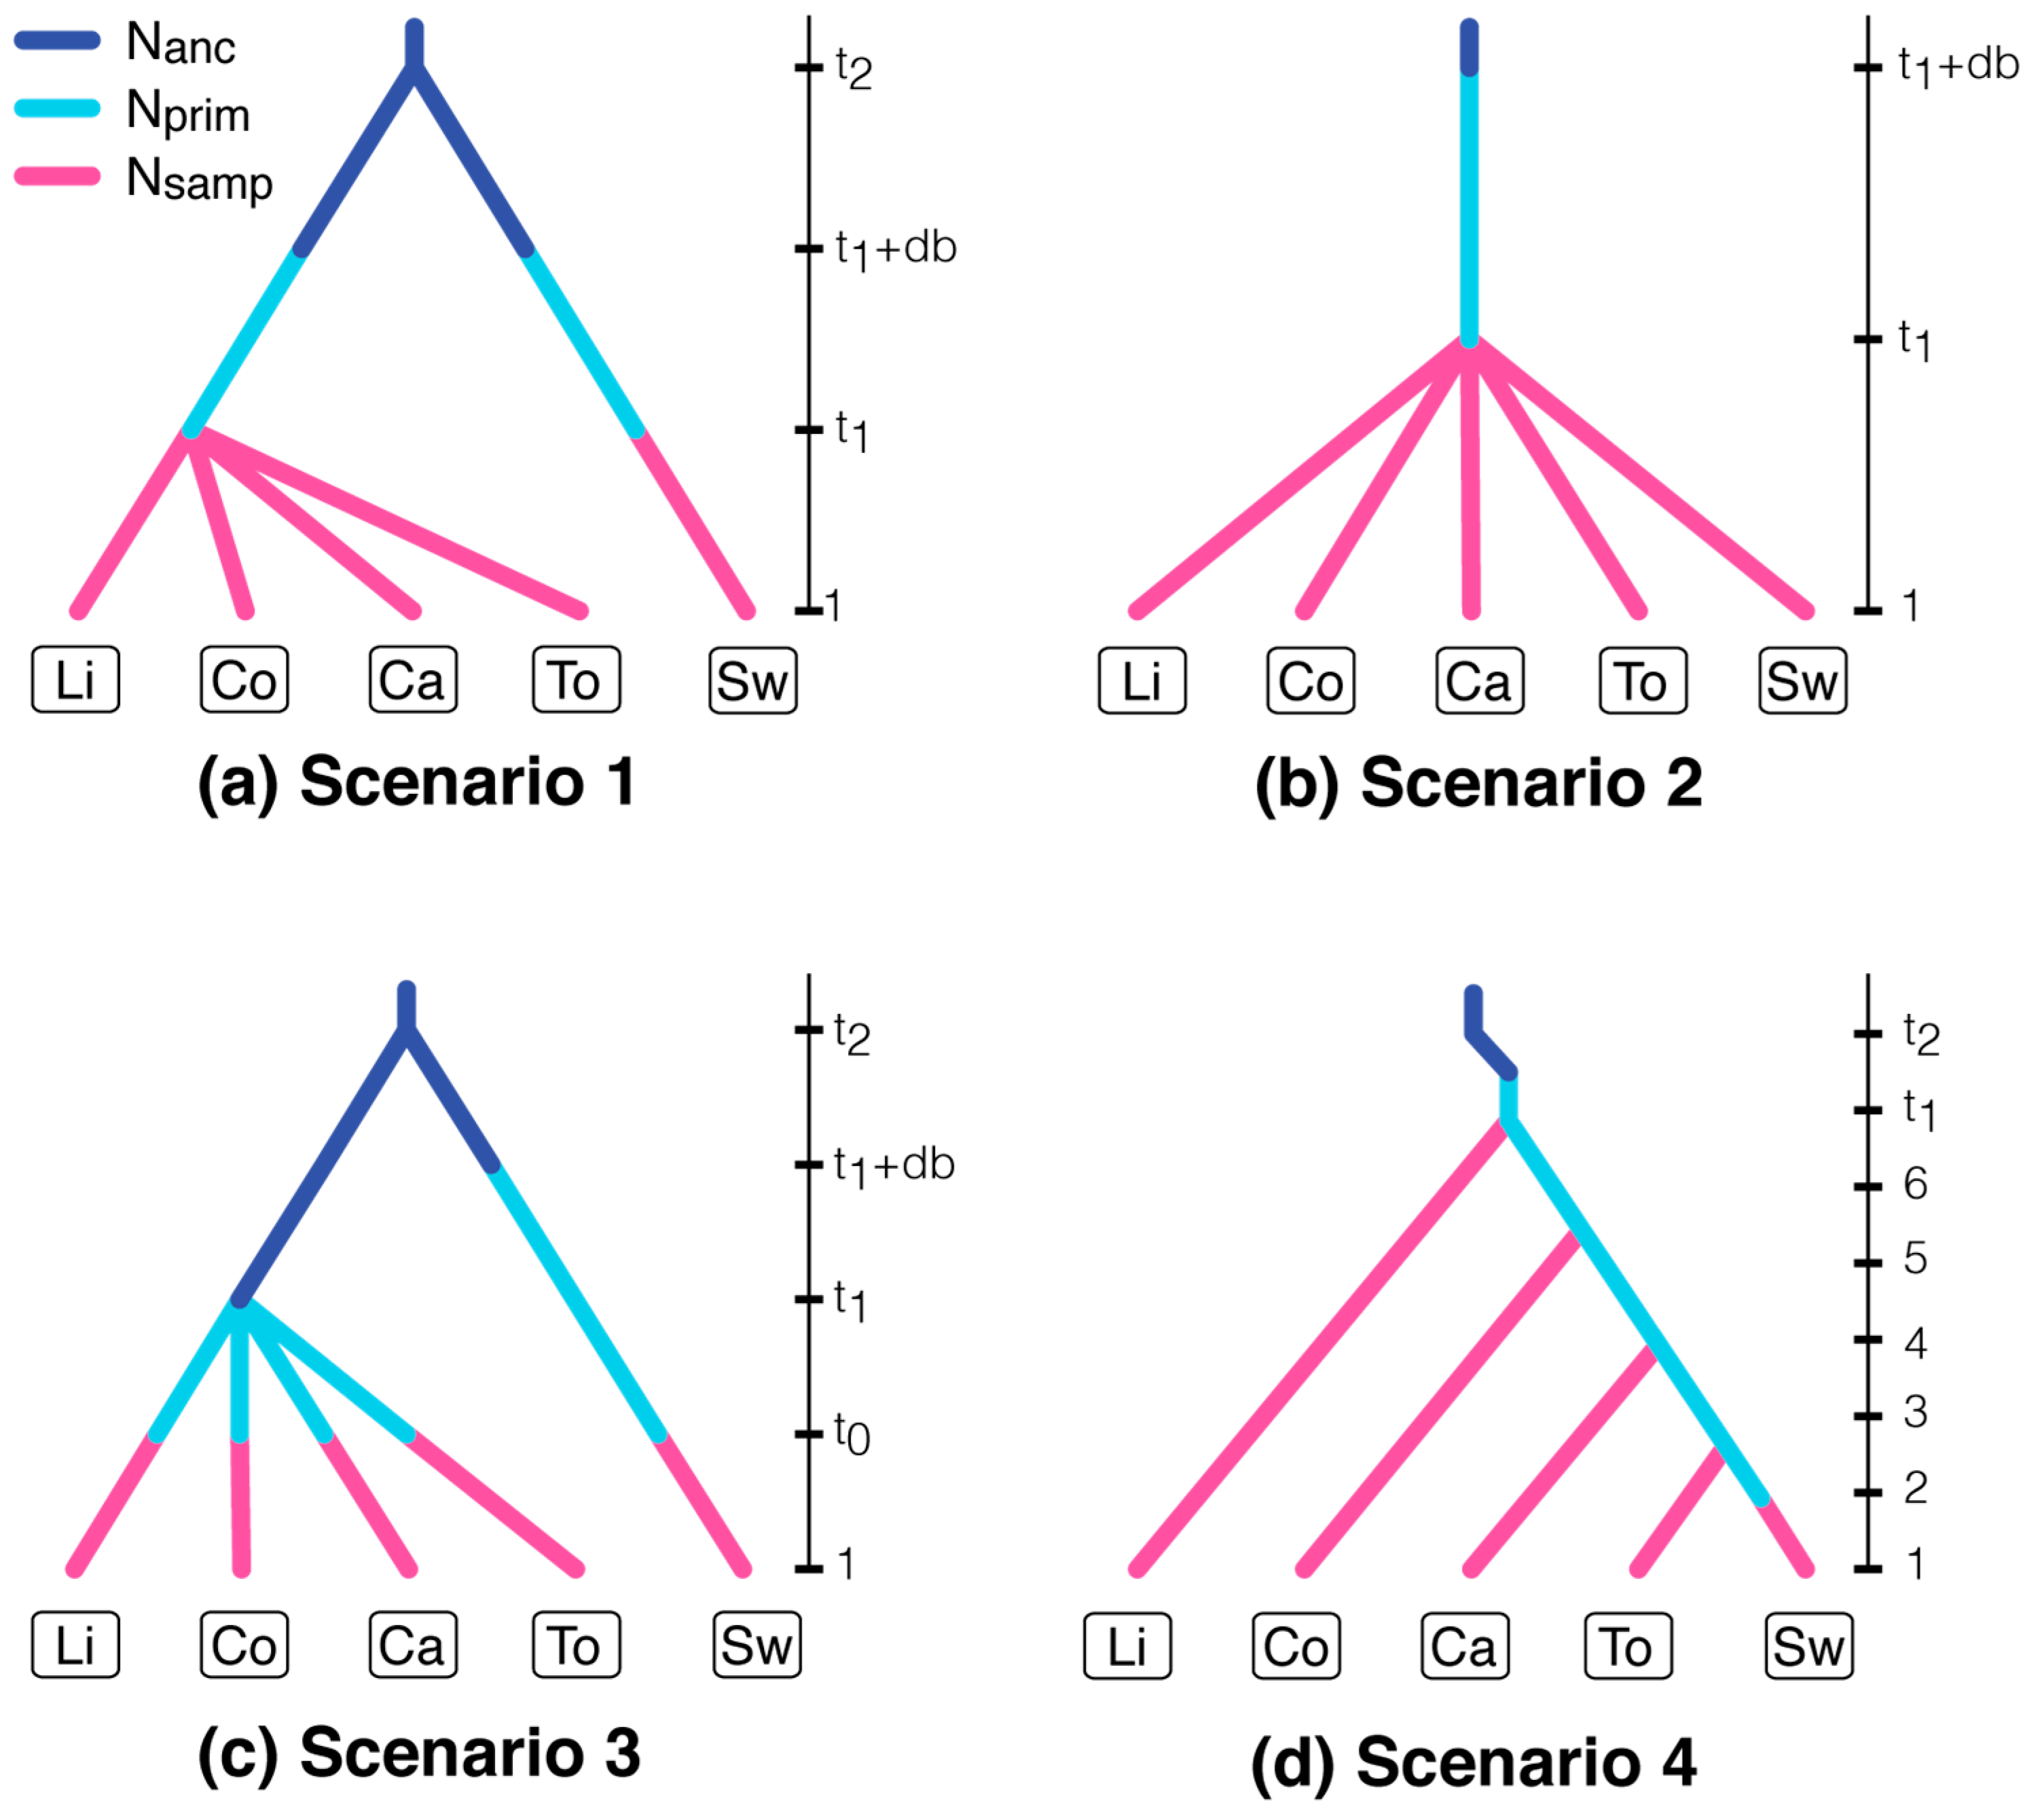
2.5. Approximate Bayesian Computation of Source Populations

We developed four scenarios to represent the possible origins and subsequent spread of CoTS outbreaks on the GBR and used an approximate Bayesian computation approach to determine the probability of each scenario to generate observed patterns of genetic diversity. All analyses were developed using DIYABC 2.1.0 [52,53]. Each scenario was defined to represent possible historical events and demographic changes, including possible population bottlenecks, the effective population sizes of ancestral populations, as well the number of individuals that would have contributed to primary outbreaks, the effective population size of sampled populations and possible divergence times. The four scenarios represent: (i) independent primary outbreaks in the northern and southern GBR, which led to separate secondary outbreaks in the northern and southern GBR (Figure 2a); (ii) a single primary outbreak, which led to secondary outbreaks with a common origin (Figure 2b); (iii) divergence of the northern and southern GBR populations followed by independent primary outbreaks in each of the five focal regions and subsequent secondary outbreaks (Figure 2c); and (iv) sequential secondary outbreaks starting from a common population at Lizard island (Figure 2d).
In order to make the ABC approach computationally feasible, we performed all tests on a subset of 68 randomly selected individuals from Lizard Islands, Cooktown, Cairns and Townsville and all 68 individuals from the Swains. All 17 loci were kept in the analysis. Parameters of mutation models of microsatellite loci were drawn from a set of 10,000 simulations generated for each putative scenario. The posterior probability value of each scenario was determined following 100,000 simulations of each scenario. The details of the ABC parameters and analyses are described in Figure S3.

2.6. Inbreeding

The mating of closely-related individuals, or closely-related groups of individuals, can result in an increase in the frequency of homozygote loci and, thus, heterozygote deficiency. The coefficient of inbreeding f is the probability that two alleles at any one locus are identical by descent (IBD) [54] Wright 1943) so that the progeny of close relatives will have many autozygous genotypes. We measured the multilocus heterozygosity (MLH) [55,56] to investigate the occurrence of inbred individuals in our sample. MLH is the proportion of loci at which an individual was heterozygous divided by the mean heterozygosity across all samples. If individuals are in fact inbred, all loci should exhibit signs of excess heterozygosity deficiency, and estimates of MHL from two random sets of loci should be similar. Furthermore, our sample should exhibit lower estimates of MLH than a random population generated from the observed allelic frequencies. We estimated MLH of CoTS sampled and tested the correlation between randomly selected sets of loci in the R package ‘Rhh’ [57]. Ninety-five percent confidence intervals around the mean were estimated from 999 iterations. Simulated genotypes were generated from observed allelic frequencies using R packages ‘gstudio’ [58] and ‘adegenet’ [59], and MLH between groups were compared used a paired t-test. Inbreeding should result in a significant over-representation of individuals with a low MLH when compared to randomly-assorted genotypes.

3. Results

A total of 4082 individual CoTS were collected between April 2013 and May 2015 from 13 reefs between Lizard Island and the Swains reefs (Figure 1). All individuals were genotyped at 26 microsatellite loci, and the final dataset was curated to focus on five focal regions (Table 1). Individuals removed from the data included 642 individuals sampled prior to September 2013 or less than 80 mm in length and 121 individuals that were sampled from reefs where less than 50 individuals were sampled.
Poor DNA quality or the possible presence of PCR inhibitors in DNA extractions led to a large amount of missing data and genotyping error. A training dataset [36] identified four loci (Apl21, Apl36, Apl39 and Maki12) with over 3% genotyping error and five loci (Apl01, Apl25, Apl27, Apl29 and Apl37) with over 30% missing data, which were all discarded prior to analysis. In addition, 600 individuals with four or more missing loci were discarded from further analyses along with 14 duplicate genotypes associated with the presence of missing data.
Of an initial 4082 samples, our final data included 2705 unique individuals from 13 reefs from Lizard Island (n = 1002), Cooktown (n = 692), Cairns (n = 802), Townsville (n = 137) and the Swains (n = 68). Individuals ranged from 90 mm to 510 mm (mean = 282 mm ± 66 mm SD) with no statistical difference in the size of individuals between regions. Amongst all genotyped individuals, 1925 were identified as either mature male or mature female with 1.34 males for every female. This ratio was used to parameterise the ABC models.

3.1. Microsatellite Data

Data presented here contained 17 polymorphic loci with 1.7% missing data (Table 2). The mean number of alleles per locus was 17.4 and ranged from four to 62 alleles. Similarly, the average observed heterozygosity was 0.67 and ranged from 0.21 to 0.95. Each locus was tested for departure from Hardy-Weinberg equilibrium, and nine loci showed non-random association of alleles after correction for multiple testing. A specific test for heterozygous deficiency highlighted 12 loci with a higher than expected frequency of heterozygotes after correction for multiple testing. Estimates of Weir and Cockerham’s FIS were positively skewed with an average FIS of 0.017 ± 0.004 SE across all loci, which suggests some degree of inbreeding in these populations. Amongst 136 pairwise comparisons, two locus pairs measured linkage disequilibrium after correction for multiple testing, and no locus showed evidence of null alleles.

3.2. Spatial Patterns of Genetic Diversity

The mean allelic richness (AR) and genetic diversity (HS) within sampled reefs were high (AR = 5.5; HS = 0.687) and consistent among reefs (Table 1). There was no evidence for genetic differentiation amongst sampled reefs with global estimates of G’ST = −0.001 (p = 0.948) and no genetic variance amongst regions (FCT = 0.000 ± 0.000 SD) or amongst populations nested in regions (FSC = 0.000 ± 0.000 SD; Table 3). Pairwise genetic differences amongst populations were not significantly different from zero (Table 4), and showed no evidence of isolation by distance (Mantel test: p = 0.9).
There was, however, evidence of low, but significant heterozygote deficiency within the sample. Individual heterozygosity was lower than would be expected in a large, randomly-mating population with a global estimate of GIS = 0.022 (p = 0.001) and amongst individuals within individuals reefs (FIS = 0.021 ± 0.004 SD). Such patterns are commonly associated with evidence of the mixing of different source populations (Wahlund effect), inbreeding due to the mating of close relatives or the non-random sampling of a limited number of familial pools. The level of heterozygote deficiency also varied amongst reefs, ranging from −0.004 to 0.048 and an average GIS of 0.021 ± 0.012 SD amongst reefs.
Using the whole sample of individuals without prior information of sampling location, the population could not be partitioned into independent populations, indicating that the sample has a common origin. The largest mean log-likelihood values of the data were for K = 1 population and decreased with increasing values of K (Figures S1 and S2). The result provided by the analysis of spatial genetic clustering could not unambiguously detect separate groups of individuals in the sample, indicating a homogenous population, and does not support a Wahlund effect as a source of heterozygote deficiency. The power of the tests suggest that the number of sampled individuals, the number of loci and the allelic diversity at these loci were sufficient to detect genetic structure amongst sampled populations. At a level of differentiation of FST = 0.0005, the power to detect genetic heterogeneity with 95% confidence was 100%. At the lowest level of differentiation (FST = 0.0001), the power was reduced to 53.7%. Analyses were repeated after excluding nine loci that did not meet equilibrium assumptions (AP12QS, Hisayo01, Maki03, Sayo03, AP30QS, Yukina06, AP5QS, Apl07, Etsuko01). Results from these runs were not different from runs with the full dataset.

3.3. Inbreeding

We measured low, but significant levels of heterozygote deficiency in most screened loci, which could indicate the presence of inbred individuals in our sample. However, the mean multilocus heterozygosity correlation was −0.003 (CI 95% −0.025 to 0.019) indicating that the heterozygote deficiency was not significantly different across loci. To confirm that inbreeding was not the cause of heterozygote deficiency in sampled CoTS, we compared the MLH between sampled and simulated genotypes. Amongst all CoTS sampled in the GBR, the average MLH was 0.29 ± 0.11 SD, which was not significantly different from simulated genotypes (0.26 ± 0.10 SD, t = −9.41, df = 2704, p-value = 1).

3.4. ABC Framework

The most likely scenario supported by the ABC analyses was Scenario 4 (Figure 2d), whereby all sampled populations originated sequentially from a single common primary outbreak (Figure S4). However, the outcomes of this scenario could not be distinguished from Scenario 2, whereby sampled populations originated from a single common primary outbreak at the same time point (Figure 2b). Both scenarios were more representative of the observed data than alternative scenarios that incorporated a divergence between the Swains and the northern populations (Figure 2a,c). In all simulated scenarios, ABC analyses were particularly sensitive to the effective population size for the ancestral population (Nanc). The posterior distribution of Nanc was however consistent amongst scenarios, and estimates suggest that the effective population size that would have led to a primary outbreak would be ~5000 individuals (Table 5; Figure S3).

4. Discussion

Assessing a species’ dispersal ability and capacity to colonise new habitats is critical for our understanding of their population biology and ecology [60,61], particularly where species have ecological or economic importance. CoTS outbreaks represent the single most important biological disturbance on coral reefs throughout the Indo West-Pacific [62] and often account for up to 50% of coral loss recorded on coral reefs over the last few decades [5,6,7]. For these starfish, knowledge of population structure and the movement of individuals among reefs can greatly influence management decisions e.g., [19], leading to improved detection and understanding of the patterns of outbreaks, as well as prioritisation of reefs for direct intervention (culling) in an attempt to contain outbreaks. In the current study, we investigated the genetic diversity and structure of CoTS on the GBR with the specific intention of identifying the origin and the direction of subsequent spread for current outbreaks apparent at reefs between Cooktown and Townsville, as well as at Swains reefs, in the southernmost portion of the GBR. This would have further important management ramifications, whereby containment of future outbreaks would be most effective by concentrating monitoring and control on the reef(s) where outbreaks initiate. Our results indicate that populations sampled across the full length of the GBR are genetically homogeneous, highly diverse and have no apparent genetic structure. Furthermore, model-based Bayesian analyses showed that the current outbreaking population of CoTS in the Swains is not independent of the outbreak populations in the northern GBR, but share a common origin.
We found no evidence of genetic structure amongst CoTS genotyped from 13 reefs and five regions spanning over 1000 km along the GBR. While the genetic diversity in our sample was high, there was no variance in diversity among reefs. Power analysis confirms that our data were sufficient to detect even very low degrees of genetic differentiation (FST > 0.0005) had there been any structure in the sampled population. The results indicate that CoTS from Lizard Island to the Swains are genetically homogenous. There was a small but significant deficiency in heterozygosity amongst individuals that could have arisen from: (i) the successful reproduction among differentiated populations (Wahlund effect); (ii) the mating of close relatives (inbreeding) or (iii) the sampling of close relatives. We could not distinguish independent clusters in our sample, and therefore, a Wahlund effect is unlikely (sensu [63]). Moreover, multilocus genotypes did not provide consistent evidence of inbreeding. We did find evidence that some individuals were highly related, which would result in a small but significant deficit in heterozygosity (data not shown). The strength and number of relationships between individuals from the same or different reefs could not, however, distinguish between alternative explanations for deficiencies in heterozygosity. Furthermore, a spatial autocorrelation analysis did not identify any relationship between the relatedness of individuals and their spatial distribution. Previous sampling during non-outbreak periods reported small but significant genetic structure among latent CoTS populations on the GBR (FST = 0.003, [64]), even though they also found limited structure when sampling each outbreak population.
Our ability to determine a putative source population for the current outbreak of CoTS on the GBR is significantly constrained by the limited genetic structure (sensu [65,66]), despite hierarchical sampling and large numbers of CoTS genotyped from individual reefs and regions. Very high levels of homogeneity across the 2705 individual starfish points to the recent and very rapid increase in population size of CoTS across the GBR, which has arisen from either a single source population or multiple undifferentiated populations. A single origin would be expected to generate some inbreeding and highly related individuals, which the data do not support. A more parsimonious explanation, therefore, is that the current outbreak arose almost simultaneously across a number of reefs, but with largely undifferentiated latent populations. This is consistent with reports during the last major outbreak in 1994, whereby increasing CoTS densities occurred almost simultaneously at Lizard Island and several nearby reefs (including Linnet Reef, North Direction Island and Rocky Islet) before being reported on reefs to the south [20]. High levels of gene flow amongst these closely-positioned populations would have likely resulted in admixture and high levels of genetic homogeneity, as recorded in this study. However, given the lack of genetic structure between regions, we are unable to unequivocally state whether the current outbreak did or did not originate in the northernmost sector of the initiation box, nor can we establish the directionality in the spread of individuals between regions. It is also likely that the latent population of CoTS is sufficiently large and sufficiently diverse to prevent genetic drift from occurring within regions and therefore maintaining the genetic homogeneity in the latent population. We cannot, therefore, dismiss the possibility that outbreaks arise almost simultaneously and/or independently across the entire area of the initiation box, as suggested by Fabricius et al. [13].
While our genetic analyses did not resolve competing hypotheses about the initiation and spread of CoTS outbreaks on the GBR, these data could be used in conjunction with demographic information and/or fine-scale monitoring data to better resolve the patterns of initiation and spread. Extensive and intensive monitoring of CoTS populations was undertaken across the northern GBR throughout the period of this study, recording the extent and severity of outbreaks at every reef between Lizard Island and Cairns (P. Doherty, unpublished data), as well as documenting the size-structure of CoTS populations at select reefs throughout this range [67]. However, these surveys were undertaken (in 2014 to 2015) only after outbreaks had become well established throughout the entire area, such that sequential (cf. simultaneous) occurrence of outbreaks will only be apparent based on spatial variation in the size and abundance of CoTS. In the future, systematic and intensive monitoring should be undertaken across a range of reefs within the initiation box to unequivocally establish the sequence and inter-dependence of outbreaks within this area [2]. It is also possible (but not certain) that next generation sequencing might reveal greater genetic structure among existing samples and thereby provide meaningful differences among sub-populations to explicitly test for directionality in spread. The recent compilation and publication of an entire mitochondrial genome for Acanthaster cf. solaris collected from Japan [68] certainly paves the way for much more detailed studies of population genetics for CoTS. Ongoing genetic sampling and re-analyses of existing genetic samples from the GBR are underway.
An unexpected outcome of this study was that outbreak populations of CoTS in the southern GBR (Swains reefs) were not significantly differentiated and have a similar origin to outbreak populations sampled in the northern and central GBR during 2014/2015. For the most part, CoTS outbreaks in the Swains have been thought to occur independently of outbreaks in the northern GBR and have an altogether different origin (e.g., [19]), though the appearance of high CoTS densities at Swains reefs in 2014 is consistent with continual and progressive southerly spread of the outbreak that started at and near Lizard Island in 1993/1994 [69]. Model-based Bayesian analyses resulted in a higher posterior probability of selected scenarios that considered a common origin for outbreaks in both the Swains reefs and northern GBR, as opposed to two independent primary outbreaks (sensu [19]). Both scenarios that represent a single common primary outbreak indicate a strong goodness-of-fit to our genetic data, though we could not distinguish whether secondary outbreaks originated from a single time point or sequentially. It is possible that the limited time (in generations) elapsed between primary and secondary outbreaks, and even between successive waves of outbreaks, would result in minimal observable genetic differences.

5. Conclusions

Resolving the specific location where reef-wide outbreaks of CoTS actually originate on the GBR remains a high priority, both to understand potential causes or triggers of outbreaks and to develop more effective and highly targeted management responses [2]. However, our capacity to establish the origin of the current outbreak was significantly constrained by the limited genetic structure apparent based on 17 microsatellite loci. Very high homogeneity observed within the current outbreak population, with limited evidence of inbreeding, suggests that rapid expansion in population size most likely arose from multiple and undifferentiated latent populations. Indeed, our data suggest that CoTS outbreaks may have occurred almost simultaneously and independently across the entire area of the ‘initiation box’, from Cairns to Lizard Island. The priority, therefore, is to undertake intensive sampling on reefs throughout the ‘initiation box’ in the lead up to the next outbreak of CoTS on the GBR. However, ongoing sampling should be combined with testing of alternative molecular markers (e.g., SNPs) and the application of new techniques to sample larvae [70] and newly settled starfish [71] to further resolve the origin of reef wide outbreaks.

Supplementary Materials

The following are available online at www.mdpi.com/1424-2818/9/1/16/s1, Figure S1: Mean likelihood probability of describing the population structure of CoTS in the Great Barrier Reef into K clusters with standard deviation around the mean. Three runs were performed for each value of K and compiled in Structure Harvester (Earl et al. [1]); Figure S2: Change in the mean likelihood probability of K clusters describing the population structure of CoTS in the Great Barrier Reef. Three runs were performed for each value of K and compiled in Structure Harvester (Earl et al. [1]; Figure S3. Parameter posterior density estimates from Scenario 4. Nanc: the effective population size of an ancestral population. NP and NS correspond to Nprim and Samp in table 5, the the effective population size of the primary and secondary outbreaks, respectively. t1: the divergence time of outbreaks. db: the foundation time of primary outbreaks. All time priors are represented in number of generations. μmic: the mean mutation rate. pmic the mean distribution of the number of repeats of microsatellite markers. snimic: mean rate of single nucleotide insertions and deletions. Figure S4. Comparing the posterior probabilities of modelled scenarios using direct estimates—the number of times a given scenario is chosen to best represents the observed data.

Acknowledgments

We are grateful to those who assisted us in the collection of crown-of-thorns starfish: Kristen Anderson, Zara-Louise Cowan, Karen Chong-Seng, Jacob Johansen, Elmar Messmer, Kirsty Nash, Laura Richardson, Robert Streit, Stuart Watson, Simon Wever; Lizard Island Research Staff; Tim Godfrey; and the crew of Reef Connection and Capricorn Star. We also wish to thank Manalle Al-Salamah for assistance in processing samples. This research was supported by the Commonwealth Government of Australia, through the Caring for Country and Reef Rescue Program. P.S.-A. and H.B.H. were partially funded by CONICYT, programa FONDECYT Grant 11140121.

Author Contributions

H.B.H. and M.S.P. conceived of and designed the experiments. M.S.P. and V.M. collected samples. H.B.H. and P.S.-A. analysed the data. M.L.B. contributed reagents/materials/analysis tools. All authors contributed to writing the paper.

Conflicts of Interest

The authors declare no conflict of interest.

References

  1. Birkeland, C.E.; Lucas, J.S. Acanthaster. planci: Major Management Problem of Coral Reefs; CRC Press: Boca Raton, FL, USA, 1990. [Google Scholar]
  2. Pratchett, M.; Caballes, C.; Posada, J.R.; Sweatman, H. Limits to Understanding and Managing Outbreaks of Crown-of-Thorns Starfish (Acanthaster. spp.). Oceanogr. Mar. Biol. 2014, 52, 133–200. [Google Scholar]
  3. Moran, P.J.; De’ath, G. Estimates of the abundance of the crown-of-thorns starfish Acanthaster planci in outbreaking and non-outbreaking populations on reefs within the Great Barrier Reef. Mar. Biol. 1992, 113, 509–515. [Google Scholar] [CrossRef]
  4. Bruno, J.F.; Selig, E.R. Regional Decline of Coral Cover in the Indo-Pacific: Timing, Extent, and Subregional Comparisons. PLoS ONE 2007, 2, e711. [Google Scholar] [CrossRef] [PubMed]
  5. Trapon, M.L.; Pratchett, M.S.; Penin, L. Comparative Effects of Different Disturbances in Coral Reef Habitats in Moorea, French Polynesia. J. Mar. Biol. 2011, 1–11. [Google Scholar] [CrossRef]
  6. De’ath, G.; Fabricius, K.E.; Sweatman, H.; Puotinen, M. The 27-year decline of coral cover on the Great Barrier Reef and its causes. PNAS 2012, 104, 17995–17999. [Google Scholar] [CrossRef] [PubMed]
  7. Pisapia, C.; Burn, D.; Yoosuf, R.; Najeeb, A.; Anderson, K.D.; Pratchett, M.S. Coral recovery in the central Maldives archipelago since the last major mass-bleaching, in 1998. Sci. Rep. 2016, 6, 34720. [Google Scholar] [CrossRef] [PubMed]
  8. Moran, P.J. The Acanthaster phenomenon. Oceanogr. Mar. Biol. 1986, 24, 379–480. [Google Scholar]
  9. Babcock, R.C.; Milton, D.A.; Pratchett, M.S. Relationships between size and reproductive output in the crown-of-thorns starfish. Mar. Biol. 2016, 163, 234. [Google Scholar] [CrossRef]
  10. Uthicke, S.; Schaffelke, B.; Byrne, M. A boom–bust phylum? Ecological and evolutionary consequences of density variations in echinoderms. Ecol. Monogr. 2009, 79, 3–24. [Google Scholar] [CrossRef]
  11. Lucas, J.S. Reproductive and larval biology of Acanthaster planci (L.) in Great Barrier Reef waters. Micronesica 1973, 9, 197–203. [Google Scholar]
  12. Birkeland, C. Terrestrial runoff as a cause of outbreaks of Acanthaster. planci (Echinodermata: Asteroidea). Mar. Biol. 1982, 69, 175–185. [Google Scholar] [CrossRef]
  13. Fabricius, K.E.; Okaji, K.; De’ath, G. Three lines of evidence to link outbreaks of the crown-of-thorns seastar Acanthaster planci to the release of larval food limitation. Coral Reefs 2010, 29, 593–605. [Google Scholar] [CrossRef]
  14. Pearson, R.G.; Endean, R. A Preliminary Study of the Coral Predator Acanthaster. planci (L.)(Asteroidea) on the Great Barrier Reef; Fisheries Notes; Queensland Department of Harbours and Marine: Brisbane, Australia, 1969; Volume 3, pp. 27–55. [Google Scholar]
  15. Vine, P.J. Crown of thorns (Acanthaster planci) plagues: The natural causes theory. Atoll Res. Bull. 1973, 166, 1–10. [Google Scholar] [CrossRef]
  16. Ganter, R. Oral History of Human Use and Experience of Crown of Thorns Starfish on the Great Barrier Reef; Report to the Great Barrier Reef Marine Park Authority; Great Barrier Reef Marine Park Authority: Townsville, Australia, 1987. [Google Scholar]
  17. Kenchington, R.A. Acanthaster planci on the Great Barrier Reef: Detailed surveys of four transects between 19° and 20°S. Biol. Conserv. 1976, 9, 165–179. [Google Scholar] [CrossRef]
  18. Kenchington, R.A. Growth and recruitment of Acanthaster planci (L.) on the Great Barrier Reef. Biol. Conserv. 1977, 11, 103–118. [Google Scholar] [CrossRef]
  19. Hock, K.; Wolff, N.H.; Condie, S.A.; Anthony, K.; Mumby, P.J. Connectivity networks reveal the risks of crown-of-thorns starfish outbreaks on the Great Barrier Reef. J. Appl. Ecol. 2014, 51, 1188–1196. [Google Scholar] [CrossRef]
  20. Sweatman, H.; Bass, D.K.; Cheal, A.J.; Coleman, G.; Miller, I.R.; Ninio, R.; Osborne, K.; Oxley, W.G.; Ryan, D.A.J.; Thompson, A.A.; et al. Long-Term Monitoring of the Great Barrier Reef. Status Report Number 3; Australian Institute of Marine Science: Townsville, Australia, 1998. [Google Scholar]
  21. Moore, R.J. Persistent and Transient Populations of the Crown-of-Thorns Starfish, Acanthaster Planci. In Acanthaster and the Coral Reef: A Theoretical Perspective; Springer: Berlin/Heidelberg, Germany, 1990. [Google Scholar]
  22. Crowl, T.A.; Crist, T.O.; Parmenter, R.R.; Belovsky, G.; Lugo, A.E. The spread of invasive species and infectious disease as drivers of ecosystem change. Front. Ecol. Environ. 2008, 6, 238–246. [Google Scholar] [CrossRef]
  23. Suarez, A.V.; Holway, D.A.; Case, T.J. Patterns of spread in biological invasions dominated by long-distance jump dispersal: Insights from Argentine ants. PNAS 2001, 98, 1095–1100. [Google Scholar] [CrossRef] [PubMed]
  24. Pratchett, M.S. Dynamics of an outbreak population of Acanthaster planci at Lizard Island, northern Great Barrier Reef (1995-1999). Coral Reefs 2005, 24, 453–462. [Google Scholar] [CrossRef]
  25. Guillemaud, T.; Ciosi, M.; Lombaert, E.; Estoup, A. Biological invasions in agricultural settings: Insights from evolutionary biology and population genetics. Comptes Rendus Biol. 2011, 334, 237–246. [Google Scholar] [CrossRef] [PubMed]
  26. Handley, L.J.L.; Estoup, A.; Evans, D.M.; Thomas, C.E.; Lombaert, E.; Facon, B.; Aebi, A.; Roy, H.E. Ecological genetics of invasive alien species. BioControl 2011, 56, 409–428. [Google Scholar] [CrossRef]
  27. Lowe, W.H.; Allendorf, F.W. What can genetics tell us about population connectivity? Mol. Ecol. 2010, 19, 3038–3051. [Google Scholar] [CrossRef] [PubMed]
  28. Lombaert, E.; Guillemaud, T.; Thomas, C.E.; Lawson Handley, L.J.; Li, J.; Wang, S.; Pang, H.; Goryacheva, I.; Zakharov, I.A.; Jousselin, E.; et al. Inferring the origin of populations introduced from a genetically structured native range by approximate Bayesian computation: Case study of the invasive ladybird Harmonia axyridis. Mol. Ecol. 2011, 20, 4654–4670. [Google Scholar] [CrossRef] [PubMed]
  29. Estoup, A.; Lombaert, E.; Marin, J.-M.; Guillemaud, T.; Pudlo, P.; Robert, C.P.; Cornuet, J.-M. Estimation of demo-genetic model probabilities with Approximate Bayesian Computation using linear discriminant analysis on summary statistics. Mol. Ecol. Res. 2012, 12, 846–855. [Google Scholar] [CrossRef] [PubMed]
  30. Beaumont, M.A.; Zhang, W.; Balding, D.J. Approximate Bayesian Computation in Population Genetics. Genetics 2002, 162, 2025–2035. [Google Scholar] [PubMed]
  31. Yalcindag, E.; Elguero, E.; Arnathau, C.; Durand, P.; Akiana, J.; Anderson, T.J.; Aubouy, A.; Balloux, F.; Besnard, P.; Bogreau, H.; et al. Multiple independent introductions of Plasmodium falciparum in South America. PNAS 2012, 109, 511–516. [Google Scholar] [CrossRef] [PubMed]
  32. Fontaine, M.C.; Austerlitz, F.; Giraud, T.; Labbé, F.; Papura, D.; Richard Cervera, S.; Delmotte, F. Genetic signature of a range expansion and leap-frog event after the recent invasion of Europe by the grapevine downy mildew pathogen Plasmopara. viticola. Mol. Ecol. 2013, 22, 2771–2786. [Google Scholar] [CrossRef] [PubMed]
  33. Yasuda, N.; Nagai, S.; Hamaguchi, M.; Lian, C.L.; Nadaoka, K. Development of microsatellite markers for the crown-of-thorns starfish Acanthaster planci. Mol. Ecol. Notes 2006, 6, 141–143. [Google Scholar] [CrossRef]
  34. Yasuda, N.; Nagai, S.; Hamaguchi, M.; Nadaoka, K. Seven new microsatellite markers for crown-of-thorns starfish Acanthaster planci. Plank 2007, 2, 103–106. [Google Scholar] [CrossRef]
  35. Wainwright, B.J.; Arlyza, I.S.; Karl, S.A. Eighteen microsatellite loci for the crown-of-thorns starfish, Acanthaster planci. Conserv. Genet. Res. 2012, 4, 861–863. [Google Scholar] [CrossRef]
  36. Harrison, H.B.; Saenz-Agudelo, P.; Al-Salamah, M. Microsatellite multiplex assay for the coral-eating crown-of-thorns starfish, Acanthaster. cf. planci. Conserv. Genet. 2015, 7, 627–630. [Google Scholar] [CrossRef]
  37. Peakall, R.; Smouse, P.E. GENALEX 6: Genetic analysis in Excel. Population genetic software for teaching and research. Mol. Ecol. Notes 2006, 6, 288–295. [Google Scholar] [CrossRef]
  38. Alberto, F. MsatAllele_1.0: An R package to visualize the binning of microsatellite alleles. J. Heredity 2009, 100, 394–397. [Google Scholar] [CrossRef] [PubMed]
  39. Peakall, R.; Smouse, P.E. GenAlEx 6.5: Genetic analysis in Excel. Population genetic software for teaching and research-an update. Bioinformatics 2012, 28, 2537–2539. [Google Scholar] [CrossRef] [PubMed]
  40. Raymond, M.; Rousset, F. An exact test for population differentiation. Evolution 1995, 49, 1280–1283. [Google Scholar] [CrossRef]
  41. Rousset, F. genepop’007: A complete re-implementation of the genepop software for Windows and Linux. Mol. Ecol. Res. 2008, 8, 103–106. [Google Scholar] [CrossRef] [PubMed]
  42. Weir, B.; Cockerham, C. Estimating F-statistics for the analysis of population structure. Evolution 1984, 38, 1358–1370. [Google Scholar] [CrossRef]
  43. Benjamini, Y.; Hochberg, Y. Controlling the False Discovery Rate: A Practical and Powerful Approach to Multiple Testing. J. R. Stat. Soc. B 1995, 57, 289–300. [Google Scholar]
  44. Van Oosterhout, C.; Hutchinson, W.; Wills, D.; Shipley, P. MICRO-CHECKER: Software for identifying and correcting genotyping errors in microsatellite data. Mol. Ecol. Notes 2004, 4, 535–538. [Google Scholar] [CrossRef]
  45. Brookfield, J.F. A simple new method for estimating null allele frequency from heterozygote deficiency. Mol. Ecol. 1996, 5, 453–455. [Google Scholar] [CrossRef] [PubMed]
  46. Meirmans, P.G.; van Tienderen, P.H. genotype and genodive: Two programs for the analysis of genetic diversity of asexual organisms. Mol. Ecol. Notes 2004, 4, 792–794. [Google Scholar] [CrossRef]
  47. Hedrick, P. Large variance in reproductive success and the Ne/N ratio. Evolution 2005, 59, 1596–1599. [Google Scholar] [CrossRef] [PubMed]
  48. Pritchard, J.K.; Stephens, M.; Donnelly, P. Inference of population structure using multilocus genotype data. Genetics 2000, 155, 945–959. [Google Scholar] [PubMed]
  49. Falush, D.; Stephens, M.; Pritchard, J.K. Inference of population structure using multilocus genotype data: Dominant markers and null alleles. Mol. Ecol. Notes 2007, 7, 574–578. [Google Scholar] [CrossRef] [PubMed]
  50. Evanno, G.; Regnaut, S.; Goudet, J. Detecting the number of clusters of individuals using the software structure: A simulation study. Mol. Ecol. 2005, 14, 2611–2620. [Google Scholar] [CrossRef] [PubMed]
  51. Ryman, N.; Palm, S. POWSIM: A computer program for assessing statistical power when testing for genetic differentiation. Mol. Ecol. Notes 2006, 6, 600–602. [Google Scholar] [CrossRef]
  52. Cornuet, J.-M.; Pudlo, P.; Veyssier, J.; Dehne-Garcia, A.; Gautier, M.; Leblois, R.; Marin, J.-M.; Estoup, A. DIYABC v2.0: A software to make approximate Bayesian computation inferences about population history using single nucleotide polymorphism, DNA sequence and microsatellite data. Bioinformatics 2014, 30, 1187–1189. [Google Scholar] [CrossRef] [PubMed]
  53. Cornuet, J.-M.; Ravigné, V.; Estoup, A. Inference on population history and model checking using DNA sequence and microsatellite data with the software DIYABC (v1.0). BMC Bioinform. 2010, 11, 401. [Google Scholar] [CrossRef] [PubMed] [Green Version]
  54. Wright, S. Isolation by Distance. Genetics 1943, 28, 114–138. [Google Scholar] [PubMed]
  55. Coltman, D.W.; Pilkington, J.G.; Smith, J.A.; Pemberton, J.M. Parasite-Mediated Selection against Inbred Soay Sheep in a Free-Living, Island Population. Evolution 1999, 53, 1259. [Google Scholar] [CrossRef]
  56. Amos, W.; Worthington Wilmer, J.; Fullard, K.; Burg, T.M.; Croxall, J.P.; Bloch, D.; Coulson, T. The influence of parental relatedness on reproductive success. Proc. R. Soc. Lond. Biol. 2001, 268, 2021–2027. [Google Scholar] [CrossRef] [PubMed]
  57. Alho, J.S.; Välimäki, K.; Merilä, J. Rhh: An R extension for estimating multilocus heterozygosity and heterozygosity-heterozygosity correlation. Mol. Ecol. Res. 2010, 10, 720–722. [Google Scholar] [CrossRef] [PubMed]
  58. Dyer, R.J.; Nason, J.D. Population Graphs: The graph theoretic shape of genetic structure. Mol. Ecol. 2004, 13, 1713–1727. [Google Scholar] [CrossRef] [PubMed]
  59. Jombart, T. adegenet: A R package for the multivariate analysis of genetic markers. Bioinformatics 2008, 24, 1403–1405. [Google Scholar] [CrossRef] [PubMed]
  60. Clobert, J.; Danchin, E.; Dhondt, A.A.; Nichols, J.D. Dispersal; Oxford University Press: Oxford, UK, 2001. [Google Scholar]
  61. Sax, D.F.; Stachowicz, J.J.; Gaines, S.D. Species Invasions: Insight into Ecology, Evolution and Biogeography; Sinauer Associates Incorporated: Sunderland, Massachusetts, 2005. [Google Scholar]
  62. Pearson, R.G. Recovery and Recolonization of Coral Reefs. Mar. Ecol. Prog. Ser. 1981, 4, 105–122. [Google Scholar] [CrossRef]
  63. Francois, O.; Durand, E. Spatially explicit Bayesian clustering models in population genetics. Mol. Ecol. Res. 2010, 10, 773–784. [Google Scholar] [CrossRef] [PubMed]
  64. Benzie, J.A.H.; Wakeford, M. Genetic structure of crown-of-thorns starfish (Acanthaster. planci) on the Great Barrier Reef, Australia: Comparison of two sets of outbreak populations occurring ten years apart. Mar. Biol. 1997, 129, 149–157. [Google Scholar] [CrossRef]
  65. Muirhead, J.R.; Gray, D.K.; Kelly, D.W.; Ellis, S.M.; Heath, D.D.; Macisaac, H.J. Identifying the source of species invasions: Sampling intensity vs. genetic diversity. Mol. Ecol. 2008, 17, 1020–1035. [Google Scholar] [CrossRef] [PubMed]
  66. Geller, J.B.; Darling, J.A.; Carlton, J.T. Genetic perspectives on marine biological invasions. Ann. Rev. Mar. Sci. 2010, 2, 367–393. [Google Scholar] [CrossRef] [PubMed]
  67. MacNeil, M.A.; Chong-Seng, K.M.; Pratchett, D.J.; Thompson, C.A.; Messmer, V.; Pratchett, M.S. Age and Growth of An Outbreaking Acanthaster cf. solaris Population within the Great Barrier Reef. Diversity 2017. accepted. [Google Scholar]
  68. Yasuda, N.; Hamaguchi, M.; Sasaki, M.; Nagai, S.; Saba, M.; Nadaoka, K. Complete mitochondrial genome sequences for Crown-of-thorns starfish Acanthaster planci and Acanthaster brevispinus. BMC Genom. 2006, 7, 17. [Google Scholar] [CrossRef] [PubMed]
  69. Vanhatalo, J.; Hosack, G.R.; Sweatman, H. Spatiotemporal modelling of crown-of-thorns starfish outbreaks on the Great Barrier Reef to inform control strategies. J. Appl. Ecol. 2016, 1–10. [Google Scholar] [CrossRef]
  70. Uthicke, S.; Doyle, J.; Duggan, S.; Yasuda, N.; McKinnon, A.D. Outbreak of coral-eating Crown-of-Thorns creates continuous cloud of larvae over 320 km of the Great Barrier Reef. Sci. Rep. 2015, 5, 16885. [Google Scholar] [CrossRef] [PubMed]
  71. Wilmes, J.; Matthews, S.; Schultz, D.; Messmer, V.; Hoey, A.; Pratchett, M. Modelling Growth of Juvenile Crown-of-Thorns Starfish on the Northern Great Barrier Reef. Diversity 2016, 9, 1. [Google Scholar] [CrossRef]
Figure 1. Sampling locations of crown-of-thorns starfish (CoTS) on the Great Barrier Reef. Over four thousand CoTS were collected between April 2013 and May 2015 from reefs between Lizard Island (S 14.7; E 145.4) and the Swains reefs (S 22.3; E 1527).
Diversity 09 00016 g001
Figure 2. Graphical representation of competing scenarios used in an approximate Bayesian computation (ABC) framework. Each scenario represents a possible outbreak history of crown-of-thorns starfish (CoTS) on the Great Barrier Reef. (a) Independent primary outbreaks in the northern and southern GBR, which led to separate secondary outbreaks in the northern and southern GBR; (b) a single primary outbreak, which led to secondary outbreaks with a common origin; (c) divergence of the northern and southern GBR populations followed by independent primary outbreaks in each of the five focal regions and subsequent secondary outbreaks; (d) sequential secondary outbreaks starting from a common population at Lizard island. The Y-axis indicates the number of generations between events (not to scale). Populations have been abbreviated as follows: Lizard Island (Li), Cooktown (Co), Cairns (Ca), Townsville (To) and Swains (Sw).
Diversity 09 00016 g002
Table 1. Sampling locations of 2705 crown-of-thorns starfish collected on the Great Barrier Reef that were then genotyped with 17 microsatellite loci. Table includes collection period, the number of genotyped individuals (N), allelic richness (AR) and the observed (Ho) and expected heterozygosity of each sampled population (Hs).
RegionSampling SiteLatitudeLongitudeDate of CollectionNARHoHs
Lizard IsLizard Island reefs−14.6916145.4479Oct 2013–Feb 20153855.60.6730.685
Lizard IsMacGillivray Reef−14.6524145.4892Oct 20131925.40.6750.685
Lizard IsNth Direction−14.7445145.5399Oct 20132475.60.6740.690
Lizard IsSth Direction−14.8562145.4825Oct 20131825.30.6720.684
CooktownEmily Reef−15.6325145.6511Feb 20142785.50.6870.688
CooktownEndeavour Reef−15.7823145.5847Feb 20142085.60.6830.692
CooktownPickersgill Reef−15.8838145.5640Feb 20141515.60.6700.693
CooktownSpitfire Reef−16.1148145.6424Oct 20131555.40.6730.688
CairnsArlington Reef−16.7749145.9767Sept 20142625.40.6700.685
CairnsHedley Reef−17.2474146.4637Sept 20142755.40.6660.684
CairnsMcCulloch Reef−17.2996146.4257Sept 20142655.40.6730.686
TownsvilleTownsville reefs−18.4303146.8209Nov 20141375.50.6510.682
SwainsSwains reefs−22.3112152.6720May 2015685.50.6850.694
Table 2. Characteristics of 17 microsatellite used in the analysis of genetic diversity in crown-of-thorns starfish, Acanthaster cf. solaris. The number of genotyped individuals (N), number of alleles (Na), observed (HO) and expected (HE) heterozygosity were measured from 2705 unique individual from the Great Barrier Reef. The exact test of Hardy–Weinberg (HWE-p) and a specific test for heterozygosity deficiency (HWE-h) were measured alongside Weir and Cockerham’s measure of FIS (F). Significant values following correction for multiple comparisons are shown in bold.
Locus nameNNaHoHeMissing Data (%)HWE-pHWE-hF
AP1270540.6480.6570.00.3990.1590.0091
AP12QS270360.4900.5140.10.0020.0010.0321
AP6542689110.6850.7020.60.3890.0470.0089
AP92702230.8450.8430.10.4710.3600.0009
Hisayo012688320.8040.8290.60.0100.0030.0179
Maki032701280.7750.7920.10.0010.0050.0123
Sayo03265990.4920.5191.70.0100.0060.0273
AP11QS2703110.7510.7620.10.1710.1190.0056
AP30QS270590.6170.6250.00.0100.0010.0635
AyU032704290.8850.8760.00.2760.917−0.0041
Yukina062681320.8780.9170.90.0000.0000.0287
AP5QS270570.5900.6000.00.0000.0140.0211
Apl07244070.3900.4099.80.0400.0090.0269
Apl192474620.9490.9658.50.6440.0100.0066
Etsuko012657100.7720.7771.80.0010.1830.0045
Sayo01270470.2140.2200.00.0950.0350.0148
Apl022577100.6530.6694.70.3350.0320.0108
Table 3. Analysis of molecular variance amongst crown-of-thorns starfish collected from 12 reefs in 4 regions of the Great Barrier Reef. The significance of F-statistics was measured from 9999 permutations.
Source of VariationNested in% var 1F-statF-valueSD 2CI 2.5%CI 97.5%p-Value 3
Within Individual 0.98Fit0.0200.0040.0120.028-
Among IndividualPopulation0.02Fis0.0200.0040.0120.0280.000
Among ReefsRegion0Fsc0.0000.0000.0000.0000.903
Among Region 0Fct0.0000.0000.0000.0000.830
1 Per cent of total genetic variance; 2 Standard deviations of F-statistics were obtained through jack-knifing over loci; 3 95% confidence intervals of F-statistics were obtained through bootstrapping over loci.
Table 4. Pairwise differentiation between crown-of-thorns starfish collected from 13 reefs of the Great Barrier Reef (lower diagonal). The significance of p-values (upper diagonal) was measured from 9999 permutations.
Lizard IslandMacGillivrayNorth DirectionSouth DirectionEmilyEndeavourPickersgillSpitfire ArlingtonHedleyMcCullochTownsvilleSwains
Lizard Island 0.2100.9580.3910.7210.9900.7070.3020.7520.3330.8260.7300.952
MacGillivray0.000 0.3800.7490.3800.6570.9880.4070.3580.2100.7640.5850.634
North Direction0.0000.000 0.3160.6620.9920.7840.1580.3310.4800.7000.9540.949
Soutth Direction0.0000.0000.000 0.8270.7640.2480.3800.6220.9600.8210.9800.857
Emily0.0000.0000.0000.000 0.9120.6780.5700.6720.4250.8450.9480.854
Endeavour−0.0010.000−0.0010.000−0.001 0.8760.5510.6370.8500.8890.9911.000
Pickersgill0.000−0.0010.0000.0000.000−0.001 0.3490.5530.0960.4840.6010.745
Spitfire 0.0000.0000.0010.0000.0000.0000.000 0.0600.2020.7120.7030.874
Arlington0.0000.0000.0000.0000.0000.0000.0000.001 0.7170.8650.8540.739
Hedley0.0000.0000.000−0.0010.0000.0000.0010.0000.000 0.8920.9480.952
McCulloch0.0000.0000.0000.0000.0000.0000.0000.0000.0000.000 0.8220.895
Townsville0.0000.000−0.001−0.001−0.001−0.0010.0000.000−0.001−0.0010.000 0.986
Swains−0.0010.000−0.001−0.001−0.001−0.002−0.001−0.001−0.001−0.001−0.001−0.002
Table 5. Prior distribution of historic and genetic data associated with evolutionary scenarios in the ABC analysis.
ParameterDefinitionDistribution (Interval, Mean, SD)
NancEffective population size of an ancestral populationNormal (103 to 104, 5 × 10³, 103)
NprimEffective population size of a primary outbreakNormal (103 to 104, 4 × 10³, 8 × 10²)
NsampEffective population size of a sampled populationNormal (5 × 10⁴ to 2 × 10⁵, 8 × 10⁴, 104)
t1Divergence time of independent outbreaksUniform (1 to 10)
dbFoundation time of a primary outbreakUniform (1 to 10)
t2Divergence time of northern and southern populationsUniform (102 to 1.5 × 10³)
Mean μMean mutation rateGamma (10−4 to 10−3, 10−4, 2)
Mean PMean of the geometric distribution of the number of repeatsGamma (10−2 to 10−0, 5.5 × 10⁻¹, 3)
Mean μSNIMean single nucleotide insertion/deletion mutation rateGamma (10−8 to 5 × 10⁻⁵, 1.5 × 10⁻⁵, 3)

