Article

Optimal Clinical Time for Reliable Measurement of Transcutaneous CO2 with Ear Probes: Counterbalancing Overshoot and the Vasodilatation Effect

1
Pneumology Service, Hospital de Sabadell, Corporació Parc Taulí, Sabadell 08208, Spain
2
Department of Medicine, Autonomous University of Barcelona (UAB), Cerdanyola del Valles, Barcelona 08193, Spain
*
Author to whom correspondence should be addressed.
Sensors 2010, 10(1), 491-500; https://doi.org/10.3390/s100100491
Submission received: 23 November 2009 / Revised: 20 December 2009 / Accepted: 21 December 2009 / Published: 11 January 2010
(This article belongs to the Section Chemical Sensors)

Abstract

:

OBJECTIVES:

To determine the optimal clinical reading time for the transcutaneous measurement of oxygen saturation (SpO2) and transcutaneous CO2 (TcPCO2) in awake spontaneously breathing individuals, considering the overshoot phenomenon (transient overestimation of arterial PaCO2).

EXPERIMENTAL SECTION:

Observational study of 91 (75 men) individuals undergoing forced spirometry, measurement of SpO2 and TcPCO2 with the SenTec monitor every two minutes until minute 20 and arterial blood gas (ABG) analysis. Overshoot severity: (a) mild (0.1–1.9 mm Hg); (b) moderate (2–4.9 mm Hg); (c) severe: (>5 mm Hg). The mean difference was calculated for SpO2 and TcPCO2 and arterial values of PaCO2 and SpO2. The intraclass correlation coefficient (ICC) between monitor readings and blood values was calculated as a measure of agreement.

RESULTS:

The mean age was 63.1 ± 11.8 years. Spirometric values: FVC: 75.4 ± 6.2%; FEV1: 72.9 ± 23.9%; FEV1/FVC: 70 ± 15.5%. ABG: PaO2: 82.6 ± 13.2; PaCO2: 39.9.1 ± 4.8 mmHg; SaO2: 95.3 ± 4.4%. Overshoot analysis: overshoot was mild in 33 (36.3%) patients, moderate in 20 (22%) and severe in nine (10%); no overshoot was observed in 29 (31%) patients. The lowest mean differences between arterial blood gas and TcPCO2 was −0.57 mmHg at minute 10, although the highest ICC was obtained at minutes 12 and 14 (>0.8). The overshoot lost its influence after minute 12. For SpO2, measurements were reliable at minute 2.

CONCLUSIONS:

The optimal clinical reading measurement recommended for the ear lobe TcPCO2 measurement ranges between minute 12 and 14. The SpO2 measurement can be performed at minute 2.

1. Introduction

During the last 50 years, there has been a growing interest in arterial blood gas measurements for calculating PaO2 [1,2] and PaCO2 [3,4]. Non-invasive measurement of both PaCO2 and PaO2 has presented major technical and practical problems [2], but pulse oximetry, introduced in 1985, proved to be effective for the non-invasive assessment of oxygenation during sleep [1] and exercise [2]. No techniques were available for non-invasive continuous monitoring of PaCO2.
At the turn of the century, Rohling and Biro [5] and Tschupp and Fanconi [6] published the first descriptions of a monitor that combined the elements of an optical pulse oximetry sensor with a Severinghaus-type PaCO2 sensor, which has been used in several clinical situations [7]. One of the key points that remain to be determined is the time at which the monitor offers the most reliable measurement.
In a previous study, we validated the combined oximetry and transcutaneous CO2 (TcPCO2) ear-lobe monitor (Sentec Corporation, Inc) designed for SpO2 and TcPCO2 measurements [3]. In that study we established empirically that the monitor needed a maximum stabilization time of 17 minutes in order to perform the reading of the PaCO2 value. Considering that SpO2 reading is much faster than PaCO2, the purpose of this study was to determine the optimal time for the TcPCO2 reading of the Sentec monitor in a cohort of clinically stable individuals including patients and normal controls.

2. Experimental Section

Based on our previous results, we hypothesized that the stabilization time at which the Sentec monitor was reliable for SpO2 and PaCO2 measurements would be <17 minutes [3].

Patients

Inclusion criteria: (a) a consecutive Caucasian adult population referred to the respiratory function testing clinic of our hospital for forced spirometry and arterial blood gas analysis.
Exclusion criteria: (a) active smoking habit; b) jaundice; (c) recent hospital admission (<3 months); d) clinical hypotension; (e) refusal to participate. Since our previous validation study had shown that the over- and underestimation by the monitor was not clinically relevant [3], patients were not stratified and grouped according to pulmonary function, even though this variable was measured.

Methods

The study was observational and cross-sectional. All patients underwent forced spirometry (System 1070, Series 2E/1085, MedGraphics, St. Paul, MI, USA) on the day of the study. Spirometry was carried out in accordance with the guidelines of the Spanish Society for Pulmonology and Thoracic Surgery (SEPAR) [8]. Reference values used were those published for a Mediterranean population [9]. SpO2 and TcPCO2 were then measured with the V-SignTM combined monitor (SenTec Inc, Therwil, Switzerland). A screen reading of the Sentec monitor for SpO2 and TcCO2 was performed every two minutes until minute 20. We defined the overshoot phenomenon as the transient overestimation of arterial PaCO2 by the monitor at least during two consecutive readings (2 minutes). The severity of overshoot was classified as follows: (a) mild: transient overestimation of arterial PaCO2 between 0.1 and 1.9 mm Hg; (b) moderate: transient overestimation of arterial PaCO2 between 2 and 4.9 mm Hg; c) severe: transient overestimation of arterial PaCO2 > 5 mm Hg.
After the stabilization period and once screen monitor readings were completed, arterial blood gas (ABG) analysis was performed in accordance with SEPAR guidelines [10] which include the use of subcutaneous anaesthesia before puncture. The sample for arterial blood gas analysis was processed in two analyzers and hemoximeters belonging to the respiratory function testing laboratory (Radiometer ABL 500 series, Copenhagen, Denmark; Radiometer OSM3 hemoximeter) and immediately afterwards using the instruments at our intensive care unit (ICU) (Radiometer ABL 700 series; Radiometer OSM3 hemoximeter). Although the two laboratories are on the same floor and close to one another, the blood samples were transported between the two sites on ice. At least two readings were taken with each analyzer for each blood sample. The optimal value was always taken (highest PaO2 and lowest PaCO2) when the values differed by less than 1 mm Hg; otherwise a third reading was recorded. The arithmetic mean of the readings from the two analyzers was calculated and the result was taken as the reference value from the arterial blood gas analysis. The body temperature of the patient was specified on analysis of the blood sample.

Statistical Analysis
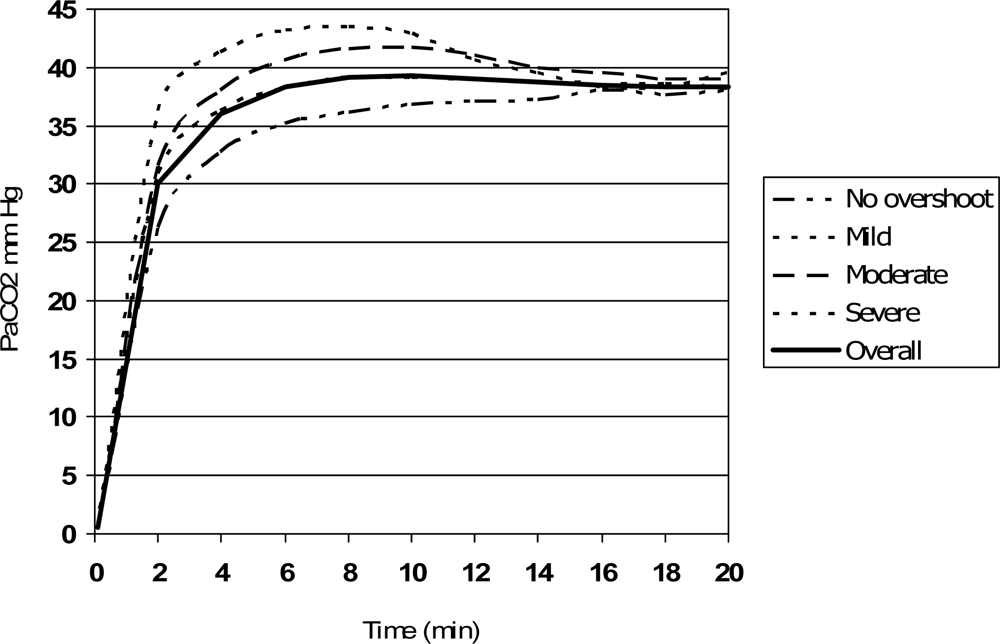
Anthropometric, spirometric and ABG data were expressed as means (SD). ABG values processed in the respiratory function testing unit were compared with the ICU values by calculating the mean differences for PaCO2 and oxygen saturation (SpO2). The Pearson correlation coefficients (r) between PaCO2 and TcPCO2 and between SaO2 and SpO2 were determined. Finally, a concordance study was performed by calculating the single measure intraclass correlation coefficient (ICC). An ICC > 0.71 indicates a good concordance between the two measures, and a very good concordance when it is >0.9. The ANOVA test was used to compare TcPCO2 at different measurement times. The study was approved by the ethics committee of our hospital.

3. Results

Ninety-one patients (75 men) were included in the study. Demographic data, pulmonary function testing (PFTs) and ABG values are shown in Table 1.
The heterogeneity of the cohort of patients reflects the presence of normal controls as well as COPD patients with different degrees of airway obstruction.
As Table 2 shows, the mean differences between arterial and transcutaneous CO2 in the first two readings were substantial (4 min). Mean differences were below 1 mm Hg after minute 6, but the maximum agreement with an ICC > 0.8 was achieved after minute 12 of measurement. These agreement values did not worsen in the following minutes. Regarding oximetry saturation values, the agreement between oximeter amd arterial oxygen saturation was very good even in the first reading (minute 2: Table 3).
Overshoot analysis: overshoot was mild in 33 (36.3%) patients, moderate in 20 (22%) and severe in 9 (10%); no overshoot was observed in 29 (31%) patients. No association was found between demographics or baseline levels of PaCO2 and overshoot. As Table 4 shows, early readings (first 10 minutes) showed statistical significant differences in patients with moderate-to severe overshoot and those without. These differences disappear after minute 12, at which point ICC was >0.8 (Table 2). Figure 1 shows the relationship between the different groups at each time measurement.
When patients with severe overshoot are excluded from the analysis, readings before minute 14 improved slightly, with ICC values of 0.240 (m2), 0.521 (m4) 0.655 (m6), 0.736 (m8), 0.782 (m10), 0.804 (m12) and 0.838 (m14). After minute 14 no relevant differences were observed.

4. Discussion and Conclusions

The stabilization time had been established empirically in a previous study [3] on the basis of the opinion of the nurse who considered the correct reading to be at about 14 ± 3 minutes. The next step was to establish the optimal (shortest and reliable) screen monitor reading time for the TcPCO2 and for the SpO2. We decided to use an interval of two minutes between measurements since previous experience had shown that this was the time taken by the monitor to detect the occurrence of an event [11]. As in our previous study [3] we took readings until 20 minutes after attaching the sensor to the ear lobe. None of our patients had dark skin, were smokers or had jaundice, and so the possible effects of these factors on the results of pulse oximetry could be ruled out. Arterial blood gas analysis was performed in accordance with SEPAR guidelines [10]. To avoid systematic calibration errors of the analyzers, we processed our samples in two different analyzers and took the mean of the values obtained as the reference arterial blood gas value, as in our previous study [3].
As Table 2 shows, the mean differences between arterial and transcutaneous CO2 are substantial in the first two readings (4 min). By minute 6 the mean differences fell below 1 mm Hg, but the maximum agreement with a ICC > 0.8 was achieved after measurement at minute 12; the fact that these agreement values did not worsen in the following readings suggest that there was no drift during these first 20 minutes of monitoring. Regarding oximetry saturation values, the agreement between oximeter and arterial oxygen saturation was excellent from minute 2 onwards.
Two opposite phenomena may interfere with TcPCO2 readings during the first minutes of monitoring. First, the arterialization of capillary blood due to vasodilatation lasts several minutes. Second, the metabolism of the cells on the skin surface is increased by the application of heat, which increases the release of CO2 from the cells, thus causing a transient overestimation of true PaCO2 (the “overshoot phenomenon”). It is believed that the overshoot usually precedes the complete vasodilatation of subdermal tissue. Kagawa et al. [12] confirmed the overshoot phenomenon during the early stages of TcPCO2 measurement. Hirabashi et al. [13] examined a method for avoiding overshoot in eight adult patients under general anaesthesia, and found that their device prevented it if the probe was heated to 45 °C rather than to 42°. Since overshoot is temperature-dependent, it might be thought that heating patients’ tissue to a lower temperature would reduce the phenomenon, but Hirabashi et al. observed the opposite: by heating the tissue to a higher temperature in the early stages, overshoot and vasodilatation tended to coincide in time, thus minimizing the problem. We should stress that Hirabashi’s patients were under general anaesthesia, whereas our patients were awake and breathing spontaneously.
The device we tested heats the tissue to 41 °C. Under these conditions, we observed severe overshoot (>5 mm Hg) in 10% of patients. Interestingly, mean TcPCO2 between patients with or without overshoot (Table 4) was not statistically different after minute 12, suggesting that this phenomenon interferes with readings only in the first 12 minutes. Moreover, when patients with severe overshoot were excluded from the analysis, the intraclass correlation coefficient after minute 12 did not change. Overshoot seems to be an individual phenomenon that is unpredictable before monitoring. High early TcPCO2 readings may alert the clinician to its presence (Table 4) although the interpretation of this value depends on the patient’s baseline PaCO2. We were unable to identify a cut-off point that was sufficiently sensitive and specific for use in clinical practice.
Measurements are a fundamental part of both clinical practice and investigation. Repeated measurements of the same variable in the same subject do not usually yield the same value. This may be due to natural variations in the subject, variations in the measurement process, or both [14]. Therefore, statistical methods to calculate the error are important. As previously discussed [3], although the Pearson correlation coefficient is useful as a first approach, it measures the strength of linear association of two variables and indicates how the values of one vary as a function of the other; so it only allows us to rule out the negative hypothesis, that is, that there is no linear association between the two measurements (the reference measurement and the measurement for validation). A strong correlation, however, does not necessarily mean that the two measurements agree [1516]. To validate a technique, we must not only show that the two variables vary in the same direction but that they do so in the same way.
The reliability of a device or method of analysis should thus be evaluated with tests of agreement. We used the ICC in our study because a number of authors have suggested that it provides a measure of agreement for continuous variables. This coefficient is not subject to the problems inherent in the linear correlation coefficient: it does not depend on the range of values of the sample, and the result is unaffected by the order in which the readings are presented or by inter-subject variability, although changes in measurement scales do have an effect [3]. It is also an excellent indicator of reliability of the measurement [3].
Besides the mathematical results, in clinical practice we have to take the decision which is most clinically useful, and which does not always coincide with the most exact measurement. Kagawa and Severinghaus underlined [17] that the best moment to take a TcPCO2 measurement was at minute 30 after placing the ear probe, but in many clinical situations, the prompt availability of the result is at least as important as the value itself – for instance, in the emergency room or in ambulatory care when visits tend to be scheduled very frequently. In these cases, shortening the time required to obtain the measurement is crucial. We observed that, at minutes 8 and 10, the mean differences between arterial and transcutaneous CO2 values were clinically insignificant and that the intraclass correlation coefficient was very good, showing that in most measurements at this time the correlation between the two techniques would be reliable. Taking into consideration the overshoot phenomenon, what happens in these early readings is that some values compensate the others and make the mean differences for the whole group very low. Beyond minute 12, although the mean differences are not lower, the ICC is higher, thus illustrating the compensation of the overshoot phenomenon by vasodilatation. Figure 1 shows that at minute 12 readings tend to converge, thus minimizing the error.
Although direct measurement of PaCO2 remains the gold standard, it provides only a single measurement of what is often a rapidly changing and evolving clinical picture. As a result, the clinical need remains for a means to continuously monitor PaCO2 without the need for repeated blood gas analysis. Transcutaneous CO2 monitoring can be applied in situations [18,19] that generally preclude end tidal CO2 monitoring such as high frequency ventilation, apnea testing, and noninvasive ventilation [20]. Moreover, the technique has shown to be more reliable than capnometry [4,21].
This study has several limitations. First, we had only one value for the PaCO2 and we assumed that it did not change throughout the study. The second limitation is that our patients were awake and spontaneously breathing, which makes it difficult to compare our results with other studies with anaesthetized patients. Finally, our monitor is different from others frequently used in other papers. Therefore, our conclusions apply to the monitor and circumstances described and may not be applicable to all situations.
In our setting, ambulatory care of COPD patients [22] in specialized units [23] is very frequent. Repeated arterial punctures for the measurement of ABG have remained one of the most important patient concerns. A solution for oxygenation measurement was found many years ago with arterial pulse-oximetry, but the approach to PaCO2 with non-invasive methods has remained a problem until recently. Since a single measurement is needed for every outpatient, it is crucial to establish the optimal time at which to perform the reading. Transcutaneous carbon dioxide monitoring may be a useful adjunct in various clinical scenarios and may help to improve control and therapy in many patients in the coming years [24].

Abbreviations:

SpO2:
oxygen saturation
TcPCO2:
transcutaneous partial pressure of carbon dioxide
PaCO2:
arterial pressure of carbon dioxide
PaO2:
arterial oxygen pressure
ABG:
arterial blood gas analysis
SpO2:
transcutaneous arterial oxygen saturation
FEV1:
forced spirometry value in the first second
FVC:
forced vital capacity
PFTs:
pulmonary function testings

Acknowledgments

The authors thank Michael Maudsley of the University of Barcelona's Language Service for revising the English.

References

  1. Domingo, Ch.; Roig, J.; Coll, R.; Klamburg, J.; Izquierdo, J.; Ruiz-Manzano, J.; Morera, J.; Domingo, E. Evaluation of the use of three different devices for nocturnal oxygen therapy in COPD patients. Respiration 1996, 63, 230–235. [Google Scholar]
  2. Domingo, Ch.; Klamburg, J.; Roig, J.; Coll, R.; Izquierdo, J.; Morera, J.; Serés, L.; Domingo, E. Acute and long-term haemodynamic response to home oxygen therapy: nasal prongs versus oxygen saving devices. J. Appl. Res 2004, 4, 149–163. [Google Scholar]
  3. Domingo, Ch.; Canturri, E.; Luján, M.; Moreno, A.; Espuelas, H.; Marín, A. Transcutaneous measurement of partial pressure of carbon dioxide and oxygen saturation: validation of the SenTec monitor. Arch. Bronconeumol 2006, 42, 245–250. [Google Scholar]
  4. Lujan, M.; Canturri, E.; Moreno, A.; Arranz, M.; Vigil, L.; Domingo, Ch. Capnometry in spontaneously breathing patients: influence of chronic obstructive pulmonary disease and expiration manoeuvres. Med. Sci. Mon 2008, 14, 485–492. [Google Scholar]
  5. Rohling, R.; Biro, P. Clinical investigation of a new combined pulse oximetry and carbon dioxide tension sensor in adult anesthesia. J. Clin. Monit 1999, 15, 23–27. [Google Scholar]
  6. Tschupp, A.; Fanconi, S. A combined ear sensor for pulse oximetry and carbon dioxide tension monitoring: accuracy in critically ill children. Anesth. Analg 2003, 96, 82–84. [Google Scholar]
  7. Janssens, J.P.; Perrin, E.; Bennani, I.; de Muralt, B.; Titelion, V.; Picaud, C. Is Continuous transcutaneous monitoring of PCO2 (TcPCO2) over 8 h reliable in adults? Respir. Med 2001, 95, 331–335. [Google Scholar]
  8. Sanchis, J.; Casán, P.; Castillo, J.; Gonzalez, N.; Palenciano, L.; Roca, J. Normativa para la practica de la espirometria forzada. Arch. Bronconeumol 1989, 25, 132–142. [Google Scholar]
  9. Roca, J.; Sanchis, J.; Agusti-Vidal, A.; Segarra, F.; Navajas, A.; Rodriguez-Roisin, R.; Casan, P.; Sans, S. Spirometric reference values from a Mediterranean population. Bull. Eur. Physiopathol. Respir 1986, 22, 217–224. [Google Scholar]
  10. Agustí, A.G.N.; Burgos, F.; Casán, P.; Perpiñá, M.; Rodríguez-Roisín, R.; Sánchez, L.; Sobradillo, V.; Togores, B. Normativa de la gasometría arterial. Arch. Bronconeumol. 1998, 34, 142–153. [Google Scholar]
  11. Storre, J.H.; Steurer, B.; Kabitz, H.J.; Dreher, M.; Windisch, W. Transcutaneous PCO2 monitoring during initiation of noninvasive ventilation. Chest 2007, 132, 1810–1816. [Google Scholar]
  12. Kagawa, S.; Otani, N.; Kamide, M.; Gisiger, P.A.; Eberhard, P.; Severinghaus, J.W. Initial transcutaneous PCO2 overshoot with ear probe at 42 degrees. C. J. Clin. Monit. Comput 2004, 18, 343–345. [Google Scholar]
  13. Hirabayashi, M.; Otani, N.; Kagawa, S.; Kamide, M. Method of evading the overshoot phenomenon of transcutaneous P (CO2) measurement at the ear lobe. Masui 2006, 55, 1018–1022, (abstract in English).. [Google Scholar]
  14. Bland, J.M.; Altman, D.G. Statistics notes: Measurement error. BMJ 1996, 313, 744–745. [Google Scholar]
  15. Bland, J.M.; Altman, D.G. Statistical Methods for assessing agreement between two methods of clinical measurement. Lancet 1986, 1, 307–310. [Google Scholar]
  16. Molinero, L. Errores de medida en variables numéricas: Correlación y Concordancia. Available online: http://www.seh-lelha.org/stat1.htm/ (accessed on 18 August 2009).
  17. Kagawa, S.; Severinghaus, J.W. Errors in monitoring transcutaneous PCO2 in the ear. Crit. Care Med 2005, 3, 2414–2415. [Google Scholar]
  18. McBride, D.S., Jr.; Johnson, J.O.; Tobias, J.D. Noninvasive carbon dioxide monitoring during neurosurgical procedures in adults: end-tidal versus transcutaneous techniques. South Med. J 2002, 95, 870–874. [Google Scholar]
  19. Tobias, J.D. Transcutaneous carbon dioxide monitoring in infants and children. Paediatr. Anaesth 2009, 19, 434–444. [Google Scholar]
  20. Luján, M.; Moreno, A.; Veigas, C.; Montón, C.; Pomares, S.; Domingo, Ch. Non-invasive home mechanical ventilation: effectiveness and efficiency of an outpatient initiation protocol compared with the standard in-hospital model. Respir. Med 2007, 101, 1177–1182. [Google Scholar]
  21. Hirabayashi, M.; Fujiwara, C.; Ohtani, N.; Kagawa, S.; Kamide, M. Transcutaneous C02 monitors are more accurate than end-tidal C02 monitors. J. Anesth 2009, 23, 198–202. [Google Scholar]
  22. Domingo, Ch.; Sans-Torres, J.; Solà, J.; Espuelas, H.; Marín, A. Effectiveness and efficiency of a specialized unit in the care of patients with chronic obstructive pulmonary disease and respiratory insufficiency. Arch. Bronconeumol 2006, 42, 104–112. [Google Scholar]
  23. Domingo, Ch.; Ortún, V. Design and analysis of health products and services. An example at a specialized COPD unit. Open Resp. Med. J 2008, 2, 7–15. [Google Scholar]
  24. Domingo, Ch. Home oxygen therapy for the 21st century. Curr. Respir. Med. Rev 2006, 2, 237–251. [Google Scholar]
Figure 1. The TcPCO2 values tend to converge after minute 10. At minutes 12 and 14, the overshoot phenomenon seems to disappear.
Sensors 10 00491f1
Table 1. Demographic data and pulmonary function testing and arterial blood gas values (mean ± SD) of 91 patients included in the study.
VariableMean ± SDRange

Age (years)63.1 ± 11.837–86
FEV1 (l)2.21 ± 0.870.51–4.33
FEV1%72.92 ± 23.917–124
FVC (l)3.13 ± 0.921.23–5.14
FVC %75.4 ± 16.237–107
FEV1/FVC70 ± 15.624–88
pH7.41 ± 0.027.35–7.48
PaCO2 (mm Hg)39.91 ± 4.8529–55
PaO2 (mm Hg)82.6 ± 13.2349.2–126
HCO3 (mmol/L)25.5 ± 2.1419–32
SaO2 (%)95.7 ± 2.3085–99
Hb (g/L)14.26 ± 1.799.2–19
Table 2. Values of TcPCO2 readings, mean differences between PaCO2 and TcPCO2, correlation and intraclass correlation coefficient for individual measures each 2 minutes.
2’4’6’8’10’12’14’16’18’20’

Mean TcPCO2 (SD)30.1 (7.5)36.04 (6.7)38 (7.5)39.2 (6.2)39.3 (5.8)39 (5.6)38.7 (5.5)38.6 (5.3)38.2 (5.3)38.15 (5.1)
Mean PaCO2-TcPCO2 (SD)9.6 (7.6)3.8 (5.8)1.8 (6)0.7 (4.2)0.57 (3.5)0.87 (3.3)1.14 (3)1.28 (2.91.6 (3)1.7 (2.8)
95 % CI8.0–11.22.5–50.5–3−0.2–1.5−0.17–1.320.17–1.560.5–1.80.6–1.90.9–2.21.1–2.3
Pearson correlation coefficients (r)0.2920.5490.5940.7410.7910.8100.8340.8340.8220.838
ICC0.2670.5190.540.7180.7770.8010.8270.8300.8190.836
The upper row shows the time in minutes. TcPCO2: Transcutaneous CO2. SD: standard deviation. CI: confidence interval. ICC: intraclass correlation coefficient for individual measures
Table 3. Values of SpO2 readings, mean differences between SaO2 and SpO2, correlation and intraclass correlation coefficient for individual measures each 2 minutes.
2’4’6’8’10’12’14’16’18’20’

Mean SpO2 (SD)96.8 (2.1)96.4 (2.2)96.38 (2.1)96.33 (2.18)96.24 (2.3)96.3 (2.3)96.3 (2.1)96.2 (2.4)96.3 (2.1)96.4 (2.1)
Mean SaO2-SpO2 (SD)−1.14 (1.32)−0.71 (1.5)−0.7 (1.49)−0.68 (1.6)−0.59 (1.69)−0.61 (1.72)−0.68 (1.46)−0.52 (2)−0.61 (1.45)−0.78 (1.48)
95 % CI−0.86; −1.42−0.4; −1.02−0.38; −1.01−0.34; −1.01−0.23; −0.94−0.24; −0.97−0.37; −0.99−0.09; −0.94−0.3; −0.9−0.46; −1.09
Pearson correlation coefficients (r)0.8220.7820.7720.7380.7210.7100.7800.6340.7880.776
ICC0.8180.7800.7680.7350.7210.7090.7750.6330.7850.772
The upper row shows the time in minutes. SpO2: pulsoximeter oxygen saturation. SD: standard deviation. CI: confidence interval. ICC: intraclass correlation coefficient for individual measures
Table 4. Mean baseline PaCO2 and transcutaneous CO2 readings every 2 minutes (in mm Hg) in patients with and without several degrees of overshoot.
OvershootPaCO2 (mmHg)2’4’6’8’10’12’14’16’18’20’

None (n = 29)40.2 ± 4.926.3 ± 8.732.7 ± 8.235.2 ± 7.136.2 ± 6.436.9 ± 5.737.1 ± 5.537.3 ± 5.638 ± 5.637.6 ± 5.538 ± 5
Light (n = 33)39.5 ± 4.330.9 ± 6.336.3 ± 538.4 ± 4.839.1 ± 4.939.2 ± 4.839 ± 4.738.7 ± 4.738.5 ± 4.738.6 ± 4.738.2 ± 4.6
Moderate (n = 20)39.9 ± 6.131.5 ± 5.338.0 ± 5.6b40.7 ± 6.3 b41.6 ± 6.6 b41.7 ± 6.9b41 ± 740.0 ± 639.5 ± 6.539 ± 6.439 ± 6.2
Severe (n = 9)40.2 ± 3.636.3 ± 6.5a41.3 ± 4.8b43.3 ± 4.6 b43.5 ± 5 b42.9 ± 4.2 b40.7 ± 3.739.5 ± 3.438.4 ± 3.538.4 ± 3.939.5 ± 4.1
The upper row shows the values of arterial PCO2 and the time in minutes.
a)p < 0.05 between severe overshoot and no overshoot (ANOVA test, Bonferroni post hoc analysis).
b)p < 0.05 between no overshoot vs. moderate and severe overshoot.

