Hedonic Judgments of Chemical Compounds Are Correlated with Molecular Size


Abstract
: Different psychophysical works have reported that, when a wide range of odors is assessed, the hedonic dimension is the most salient. Hence, pleasantness is the most basic attribute of odor perception. Recent studies suggest that the molecular size of a given odorant is positively correlated with its hedonic character. This correlation was confirmed in the present study, but further basic molecular features affecting pleasantness were identified by means of multiple linear regression for the compounds contained in five chemical sets. For three of them, hedonic judgments are available in the literature. For a further two chemical sets, hedonic scores were estimated from odor character descriptions based on numerical profiles. Generally speaking, fairly similar equations were obtained for the prediction of hedonic judgments in the five chemical sets, with R2 values ranging from 0.46 to 0.71. The results suggest that larger molecules containing oxygen are more likely to be perceived as pleasant, while the opposite applies to carboxylic acids and sulfur compounds.
1. Introduction
Electronic noses are comprised of an array of non-specific chemical sensors that provide a characteristic response pattern for odorous samples. With proper calibration, these devices can be used to assess odor intensity [1] and perform discrimination tasks. Plenty of literature is available on this subject (for a review, see [2]), but the prediction of odor character according to molecular structure is still a challenge. Although olfactory perception space is highly dimensional due to the large number of different olfactory receptors involved in odorant recognition [3], it is widely accepted that pleasantness is the most salient dimension when a wide range of smells is assessed at a similar odor intensity. Evaluation of whether one likes or dislikes an odor is known as hedonic valence (from the Ancient Greek: hçdonç = pleasure). The idea that odors could be classified in three main categories: pleasant, intermediate and unpleasant, was first proposed long ago [4,5].
In a recent study, the pleasantness of 76 odorants was rated by human appraisers as well as by an electronic nose. A significant correlation was found comparing the hedonic estimations from the electronic nose, calibrated with the 76 initial odorants, as compared with the human hedonic judgments of 21 odorants (r = 0.45, p < 0.0001) and 22 essential oils (r = 0.64, p < 0.0001) [6]. Similar works have also used electronic noses to predict hedonic assessments of various odorous samples [7,8].
Although the prediction of the hedonic tone of aroma chemicals by means of electronic noses has not yet been given much attention, recent studies suggest a link between odorant pleasantness and molecular structure. These studies are reviewed below, as well as different psychophysical olfactory studies supporting the hypothesis that pleasantness is the most basic attribute for the classification of odors.
1.1. The Hedonic Dimension of Odor Perception
One procedure for characterizing the smell of a set of odorants is to assess the similarity of all pairwise combinations of samples using a numerical scale (e.g., zero if the smell is completely different, up to 9 if it is almost identical). The resulting data structure is a symmetrical matrix that can be analyzed using multidimensional scaling (MDS). This method was applied by Yoshida [9], who selected 20 pure chemicals and asked a panel of five naive subjects to rate the odor similarity of all possible pairs of compounds. The first factor of the MDS solution was interpreted as a hedonic dimension, and the second factor as a sweet/pungent dimension.
Using a panel of 20 subjects, Woskow [10] obtained odor similarities for a set of 25 odorants and analyzed the data with MDS. Two dimensions were identified: one intensive (weak or strong odor sensation) and one hedonic. Davis [11] analyzed the same data using different techniques, and similar conclusions were drawn. These results suggest that odor strength will probably be the first attribute to emerge if someone is asked to describe the most dissimilar aspect of different odorants, unless they are all assessed at a similar odor intensity. Berglund and coworkers applied MDS to the similarities of odor quality comparison of 21 chemical compounds, and pleasantness came forward as the most salient dimension of olfactory perception [12].
In another study, 20 students assessed the odor of 40 essential oils that were selected to cover a broad spectrum of perfumery odors [13]. Panelists were asked to rate the similarity of each sample according to 32 reference test odorants on a 0–8 scale. A principal components analysis (PCA) performed on the average ratings yielded seven factors. The first one accounted for the average profile, revealing that the most unpleasant reference odors were rated with a lower frequency. The second component was related to the hedonic dimension. Similar results appeared using MDS [13].
Schiffman and coworkers [14] asked a panel of 12 subjects to smell 19 chemicals and rate the similarity of odor character for all possible pairs of odorants. Each odorant was also scored according to 22 semantic differential scales. The first factor of the MDS analysis was related to pleasantness and discriminated odorants described as fragrant and good from those regarded as foul, bad, and putrid. The second factor was determined by the descriptors “sharp” and “burning”, and was interpreted as a “tactile” dimension. A similar two-dimensional space was obtained in a previous study [15,16].
Coxon and coworkers [17] obtained numerical odor profiles for 23 compounds according to nine relevant odor descriptors. Each compound was rated on a 0–10 scale based on how it exemplified each of the nine selected descriptors. An MDS analysis yielded a four-dimensional solution, and the first dimension was related to hedonic aspects. In a similar study, 37 aroma chemicals were rated on a 7-point scale according to 55 descriptive characteristics, and the first principal component (PC1) was interpreted as pleasantness [8].
Stevens and O’Connell [18] asked a panel of 42 volunteers to smell a set of 15 odorants matched for intensity and to sort them into groups of samples with a similar odor. Next, pairwise similarity estimates between odors were derived by counting the number of times that two odors were sorted into the same group, which led to a co-occurrence matrix suitable for MDS analysis. In a similar experiment, three panels conducted a sorting task with 40 odorants [19]. In both studies, the first dimension of the MDS solution discriminated the most unpleasant odorants.
This odor sorting methodology, first proposed by Lawless [20], was also used by Sicard and coworkers [21], who asked a group of 40 subjects to assess 20 odorants and to group them according to odor resemblance. The results led to a co-occurrence matrix that was analyzed using factorial correspondence analysis. The first factor discriminated three odorants that were described as unpleasant. Dubois [22] conducted an experiment on a set of 16 familiar odorants. Two panels of 40 subjects were instructed to sort the odorants freely. Four classes of odorants were identified, and the most unpleasant odors were clustered together.
In another reported experiment, three panels of 30 students assessed 40 samples representative of familiar odors and rated odor character on a numerical scale according to 11 categories [23]. In a recent analysis of these numerical odor profiles, PC1 was interpreted as the hedonic dimension, and PC2 basically discriminated between food versus non-food odors [24].
1.2. Relationship of Hedonic Perception and Molecular Size
The Atlas of Odor Character Profiles [25] contains numerical olfactory descriptions for 144 monomolecular compounds and 16 additional samples. From this database, usually referred to as Dravnieks’ Atlas, nine odorants were selected in a recent study and the pairwise distance between two odorants along PC1 was found to be correlated with the pairwise distance in odorant pleasantness perceived by a panel [26]. Based on the results, PC1 was interpreted as the hedonic dimension. Hence, the projections of compounds along the direction determined by PC1 could be interpreted as estimated scores of pleasantness. In the same work, 1,513 physicochemical molecular descriptors were generated for 1,565 odorants. The 144 chemicals of the Atlas were projected over PC1 of this physicochemical database, and a significant correlation (r = 0.49, p < 0.001) was found between these projections and the scores for pleasantness. Similar results were obtained in a confirmatory experiment. Based on the correlation observed, the authors suggested that the perception of pleasantness (i.e., the primary axis of olfactory perception) reflects the major axis of physicochemical properties. One of the variables with highest loading in PC1 was the number of non-hydrogen atoms, which accounts for molecular size [26].
The present work further investigates the correlation between the number of non-hydrogen atoms and hedonic judgments deduced from Dravnieks’ Atlas. Olfactory data from four additional psychophysical studies reported in the literature was also analyzed, and a procedure for estimating hedonic scores from odor character profiles was proposed. This issue is of relevant interest because recent studies further support a relationship between hedonic perception of odorants and their molecular structure [6,27–31], which suggests that hedonic perception is partly innate, in contrast to the more common view that hedonic aspects are predominantly shaped by experience.
2. Materials and Methods
2.1. Hedonic Scores from the Literature
Different research works have reported hedonic ratings of odorants. Harper and coworkers [32] asked different sensory panels to smell 53 monomolecular odorants and describe the odor character as well as the hedonic tone. Based on the hedonic ratings, the authors labeled each compound on a semantic scale from very unpleasant to very pleasant. I coded these hedonic descriptions on a numerical scale as follows: −4 (very unpleasant), −2.67 (moderately unpleasant), −1.33 (slightly unpleasant), 0 (neutral, i.e., neither pleasant nor unpleasant), 1.33 (slightly pleasant), 2.67 (moderately pleasant), and 4 (very pleasant). Two chemicals were basically odorless and were disregarded. The variable containing the hedonic scores rated by the panel for the 51 chemical odorants was called HHarper.
In the first experiment conducted by Harper et al. [32], a panel of inexperienced subjects assessed the odor character of the 53 compounds. Odor description was essentially spontaneous and most subjects used only one word. Odor profiles were obtained by the authors in terms of the percentage of subjects using particular descriptors. For example, in the case of benzaldehyde, 84% of respondents described it as “almond.” Thus, the odor description of this compound can be regarded as a numerical profile containing a value of 84 for “almond”, and zero for the other terms. According to this criterion, a matrix was arranged containing 51 observations (odorants, in rows) by 57 variables (odor descriptors, in columns), which was called Harper’s matrix. A given element of this matrix, xij, indicates the percentage of subjects in the panel that labeled the i-th chemical with the j-th descriptor. This method applied here to transform semantic odor descriptions directly obtained from a panel into numerical odor profiles was proposed by Dravnieks et al. [33] and later used in the compilation of Dravnieks’ Atlas [25]. This Atlas actually also contains the percentage of panelists who used each descriptor for each sample, which is correlated with the average score obtained from the panel.
Six of the 57 descriptors in Harper’s matrix (“estery”, “cough mixture”, “methylated spirits”, “p-dichlorobenzene”, “pyridine”, and “formalin”) are not included in Dravnieks’ comprehensive list of 146 terms and were discarded. “Wintergreen” was assumed to be equivalent to “medicinal” because they are related odors [24]. For the remaining 51 descriptors, the hedonic tones are available from the work of Dravnieks et al. [34]. In the reported study, a panel of about 120 individuals rated the hedonic tone of 146 odor descriptors on a numerical scale ranging from −4 for the most unpleasant to +4 for the most pleasant. These hedonic tones, which will be called HTD84, are useful to estimate the hedonic score of a given odorant when only the odor character profile is known. The procedure applied for estimating hedonic scores from Harper’s matrix is explained for benzyl acetate as an example. This odorant was described by 36% of panelists as “fruity” and by 8% of panelists as “sweet.” Taking into account the hedonic tone of both descriptors (2.23 for “fruity”; 2.03 for “sweet”), the hedonic score of this chemical was calculated as the weighted average of HTD84 according to the odor profile as: 2.23·(36/44) + 2.03·(8/44). Hence, the hedonic score of the i-th chemical in Harper’s matrix was estimated according to Equation (1):
Hedonic information of chemical compounds is also available from the work of Moncrieff [35], who obtained hedonic rankings for 132 odorant materials by means of a panel of 12 individuals. Each panelist assigned a preference ranking for each odorous sample. Next, the rankings assigned by panelists were averaged for each odorant. These preference rankings obtained by Moncrieff will be called PRM.
Wright and Michels [36] asked a group of 8 4 subjects to rate 50 odorous samples (45 monomolecular compounds and five replicates) on a 6-point scale according to their similarity to each of nine odorant standards which covered a wide range of olfactory quality. The 50 odorants were then correlated with each other across the nine standards. The resulting 50 × 50 correlation matrix was studied using factor analysis methods, and eight factors were obtained. The same matrix was re-analyzed by Schiffman [15,16] using MDS. A two-dimensional map was obtained, showing that the first dimension discriminated two clusters of compounds, one being more pleasant than the other. The projections of the 45 chemicals over the first dimension can therefore be regarded as hedonic scores. These values were obtained from Figure 3 of Schiffman [15], which is equivalent to Figure 1 of Schiffman [16], and then these were multiplied by a constant to express them in a scale from −4 to 4. The resulting variable was called HW&M.
2.2. Hedonic Scores from Dravnieks’ Atlas
Dravnieks’ Atlas contains numerical odor descriptions for 160 samples, that were assessed at a similar odor intensity by a panel of about 120 subjects. The panel was provided with a list of 146 commonly used odor descriptors. Panelists were requested to smell each sample and to score each descriptor on a numerical scale from 0 to 5, reflecting “absent” to “extremely” representative. For each odorant and each descriptor, the Atlas indicates the percentage applicability parameter. This ranges from 0 to 100 and was calculated according to the average score from the panel and the percentage of panelists who used the term. I arranged these data in a matrix containing 160 odorant samples (in rows) by 146 variables (odor character descriptors, in columns). A preliminary multivariate analysis of this matrix (unpublished data) suggested that percentage applicability values under 4 (i.e., under 4% of the maximum limit) are basically random noise, and setting these to zero is therefore convenient. This threshold of significance was also established by Dravnieks [25], and a similar value was obtained in a reported analysis of odor profile databases [37]. Applying this procedure, six variables resulted with all null values and were excluded (“apple”, “laurel leaves”, “beery”, “rope”, “eggy”, and “soupy”). The values corresponding to “cheesy” were also excluded because these were found to be identical to “caraway” for all samples, which is nonsense. Equation (1) was applied to the resulting matrix with 139 variables in order to estimate hedonic scores for the 160 odorous samples, which were called HAt-eq1. Reported evidence suggests that PC1 of Dravnieks’ Atlas can be interpreted as the hedonic dimension [26,38]. The projections of odorants over this direction, which are often called t1 scores, can therefore be regarded as an indirect estimation of hedonic ratings. In order to obtain these values, which were referred to as HAt-t1, a PCA was carried out with Dravanieks’ matrix, using the SIMCA-P 10.0 software ( www.umetrics.com). Variables were autoscaled (i.e., mean-centered and scaled to unit variance) prior to the analysis, which is a common data pretreatment in PCA.
PC1 is the direction of maximum data variance obtained as a linear combination of the original variables. The contribution of variables to the formation of PC1 is called p1 loadings. The correlation between these loadings and the hedonic tones HTD84 of the corresponding reference descriptors was studied, as well as the correlation between HAt-eq1 and HAt-t1.
2.3. Hedonic Scores from the Amoore and Venstrom Database
Another olfactory database of chemical compounds was put forward by Amoore and Venstrom [39] (referred to hereafter as the A&V database). A panel of 29 members assessed 107 chemicals that had been equated for perceived odor intensity. Panelists smelled each sample and rated the smell similarity to seven standard odorants on a numerical scale from 0 to 8. Each standard was selected as a reference for a primary odor: “ethereal”, “camphoraceous”, “musky”, “floral”, “minty”, “pungent”, and “putrid”. Data from the original publication [39] was arranged in a matrix containing 107 observations by seven variables. The elements of this matrix, xij, represent the similarity of odorant i compared with the j-th odor reference, according to the panel. Taking into account that hedonic tone HTD84 is known for these seven descriptors, Equation (1) was applied to estimate hedonic scores, which were called HA&V-eq1.
2.4. Correlation between Hedonic Scores and Molecular Size
According to the methodology described above, hedonic scores were obtained for five sets of chemical stimuli: (i) the set of 51 odorous compounds used by Harper et al. [32], (ii) chemical odorants used by Moncrieff [35], (iii) the 45 compounds used by Wright and Michels [36], (iv) chemicals contained in Dravnieks’ Atlas [25], and (v) the 107 compounds in the A&V database [39].
Among the 132 odorant materials used by Moncrieff [35], there are 68 monomolecular chemicals. Seven isomers were excluded because they contain information which is redundant for the purpose of this work. The remaining 61 chemicals were regarded as the second chemical set.
Dravnieks’ Atlas comprises 160 odorous samples: 144 single chemical compounds, eight natural oils, two simple mixtures, five complex mixtures, and one blank. Obviously, the comparison of hedonic character versus molecular size can only be made with the monomolecular compounds. Hence, all mixtures as well as the blank (dipropylene glycol), which was basically odorless, were disregarded. Moreover, six replicates of the chemical compounds that had been evaluated at a higher concentration were also excluded.
Among the natural materials included in the Atlas, the odor of five of them is basically determined by a major component (shown in brackets): eucalyptus oil (eucalyptol), garlic oil (allicin), onion oil (n-propyl disulfide), oenanthic ether (ethyl heptanoate), and patchouli oil (patchouli alcohol). The resulting group of 143 compounds (i.e., 144 − 6 + 5) was considered to be the fourth chemical set.
The following variables describing basic molecular features were obtained for all chemicals in the five sets: molecular weight, total number of atoms, total number of atoms except hydrogen, number of carbon atoms, number of nitrogen atoms, and so on for each atom. Indicator variables providing information about the presence or absence of a particular type of atom were also considered. Additional indicator variables were used for carboxylic acids and amines. Next, multiple linear regression was applied in order to study the relationship between these molecular descriptors and the hedonic scores. Regression models were developed using the Statgraphics 5.1 software. In all cases, it was verified that residuals followed an approximately normal distribution and no outliers were identified.
2.5. Searching for the Hedonic Dimension in Two Odor Profile Databases
Given that the A&V database contains odor similarities to only seven standard odors that were assumed to account for independent dimensions of odor character [39], it is of interest to determine if pleasantness is also a salient dimension in this case. For this purpose, a PCA was carried out after applying the autoscaling pretreatment. The correlation between p1 loadings and the hedonic tones HTD84 of the corresponding reference descriptors was studied.
One of the largest databases of numerical odor profiles was obtained by Boelens and Haring [40]. A panel of six perfumers smelled 309 chemical compounds and rated the odor similarity to 30 standards on a scale from 0 to 9. This database was analyzed in recent studies [38,41], and the hedonic dimension did not show up clearly. The reason is somewhat uncertain, but one hypothesis is that this database basically contains pleasant odorants. In order to further investigate this issue, the hedonic scores of the 309 compounds were estimated using the Equations obtained from the other chemical sets.
3. Results
3.1. Hedonic Scores from the Literature and Estimated Values
In the experiment reported by Harper et al. [32], odorants were carefully chosen in order to provide as representative as possible a selection of all odors, ranging from very pleasant to very unpleasant. Actually, the average value of HHarper is nearly zero (0.08). The linear relationship between HHarper and the hedonic scores estimated from Equation (1), which were called HHarp-eq1, is indicated in Equation (2), resulting r = 0.824:
The slope is statistically significant (p < 0.0001), but not the constant (p = 0.092). If it is removed, the slope becomes 1.007 (i.e., HHarper ≈ HHarp-eq1) which is intuitively appealing, because both variables are expressed in the same scale from −4 to 4. Given this correspondence between HHarper and HHarp-eq1, it was assumed that hedonic scores estimated by means of Equation (1) for the Atlas and the A&V database (i.e., HAt-eq1 and HA&V-eq1) are also directly comparable with HHarper values.
Values of PRM range from 5.1 to 121.3. Among the chemical compounds assessed by Moncrieff [35], 17 of them were verified as also having been used by Harper et al. [32]. For these compounds, the linear regression between HHarper and PRM is indicated in Equation (3). The correlation coefficient is negative (r = −0.726, p = 0.001) because lower rankings correspond to pleasant odors:
PC1 of Dravnieks’ matrix accounts for 13.1% of the total data variability. The contributions of variables in the formation of PC1 (i.e., p1 loadings) are correlated with the hedonic tones HTD84 (r = 0.74). By conducting a multiple lineal regression, it was found that the quadratic effect was also statistically significant (p = 0.014), but the constant was not (p = 0.30). Thus, a new model was fitted without the constant (Equation (4)), resulting R2 = 0.57 (Figure 1):
This quadratic Equation crosses the origin of coordinates and, hence, descriptors with p1 > 0 can be considered pleasant (HTD84 > 0) while the opposite applies to those with p1 < 0. Hence, p1 loadings can be regarded as unbiased estimations of the hedonic tone of descriptors. The four highest residuals (see Figure 1) come forward as moderate outliers and they interestingly correspond to the pleasant descriptors with highest average (i.e., the ones most frequently scored): “light”, “sweet”, “aromatic”, and “fragrant.”
Hedonic scores HAt-eq1, obtained by applying Equation (1), are strongly correlated (r = 0.93) with those calculated as the projection of observations over PC1, HAt-t1. Nonetheless, Equation (5) describes this relationship better because the coefficient associated with the quadratic term is statistically significant (p < 0.0001), resulting R2 = 0.895:
In this equation, the constant is not clearly significant (p = 0.060), which indicates that it could be removed from the model. This result suggests that both procedures for estimating hedonic scores are not biased, that is, if one method predicts a given odorant as unpleasant, the other one will do the same on average. The HAt-eq1 variable ranges from −2.60 to 2.14, i.e., with a similar range for positive and negative values. By contrast, HAt-t1 ranges from −13.5 to 6.5, which means that the range for unpleasant odors is twice as large as for pleasant odors. Similarly, the range of p1 for unpleasant descriptors is also broader than the one for most pleasant descriptors, as deduced from the fitted model in Figure 1. For this reason, HAt-t1 values were disregarded.
Among the 51 compounds in Harper’s matrix, 25 of them are also included in the Atlas. For these compounds, the linear relationship between HHarper and HAt-eq1 (Equation (6)) is statistically significant (r = 0.884, p < 0.0001), but not the constant (p = 0.34):
The slope does not differ significantly from unity (95% confidence interval, 0.95 to 1.51), which supports the assumption that HAt-eq1 values are directly comparable with HHarper, as mentioned above. Equations (4), (5) and (6) confirm that the hedonic dimension is the most salient in Dravnieks’ Atlas.
3.2. Correlation between Hedonic Scores and Molecular Size
After obtaining the hedonic tone of compounds in the different databases, multiple linear regression was applied in order to study the relationship between perceived pleasantness and the basic molecular features.
Hedonic scores of the 51 odorants used by Harper et al. [32], HHarper, are correlated with molecular weight (r = 0.425, p = 0.002), but a higher correlation was obtained with the number of atoms except hydrogen, which will be referred to hereafter as Nat (r = 0.591, p < 0.0001). Interestingly, a similar result was obtained by Khan et al. [26], because PC1 of the physicochemical molecular data was correlated with hedonic character, and the number of non-hydrogen atoms was the eighth variable with highest loadings in PC1. After trying several models, the highest coefficient of determination (R2 = 0.537) was achieved with Equation (7):
For the 61 chemicals used by Moncrieff [35], the best regression model that relates preference ratings and molecular features is Equation (8), resulting R2 = 0.707. All variables are statistically significant (p ≤ 0.003). Taking into account Equation (3) that relates HHarper and PRM, Equation (8) turns into Equation (9), which is equivalent. Interestingly, the coefficients of Equations (7) and (9) are similar:
For the 45 odorants used by Wright and Michels [36], Equation (10) relates hedonic scores and molecular features (R2 = 0.711). The indicator variable Isul is moderately significant (p = 0.012) probably because there are only four sulfur compounds, but the other variables are clearly significant (p ≤ 0.003). Schiffman [15] also studied this chemical set and observed that carboxylic acids and sulfurs fell in the less pleasant space, as reflected by Equation (10):
The coefficients of Nat in Equations (7), (9) and (10) are very similar, but the one associated with Iox is higher in Equation (10). The reason seems to be that none of the 12 unpleasant odorants in this chemical set contain oxygen, except the carboxylic acids. Hence, the model indicates that Iox has a high predictive power of pleasantness, but the results from the other models suggest that a lower coefficient should be considered in order to estimate the hedonic score of any given molecule. This chemical set is somewhat different from the rest because odorants were perceived by the panel as clearly pleasant or unpleasant [15], and it does not contain chemicals with a neutral pleasantness. For this reason, I would not recommend Equation (10) for prediction. According to Moskowitz et al. [42], perceived pleasantness varies with concentration, and odors are described less frequently with a neutral valence if they are assessed at a higher intensity. But it is uncertain if this is the reason for the lack of neutral odorants in this case.
Data was fitted for the 143 chemicals in the Dravnieks’ Atlas according to Equation (11), resulting R2 = 0.503. A moderate significance was found for the quadratic term (p = 0.023), but the remaining variables are statistically significant (p ≤ 0.003). The interaction Iox·Nat modifies the coefficient associated with Nat for molecules containing oxygen. The largest molecule (Nat = 29) acts as an influential point in the model and it was excluded:
For the 107 odorants in the A&V database, the highest goodness-of-fit (R2 = 0.458) was obtained with Equation (12). All coefficients are statistically significant (p < 0.004):
Although the effect of Isul and Iacid could not be studied in this case because this database only contains one sulfur compound and one carboxylic acid, it is interesting that Equations (11) and (12) are rather similar, because hedonic scores were obtained in both cases using Equation (1) and consequently both are expressed in the same scale.
3.3. Searching for the Hedonic Dimension in the A&V Database
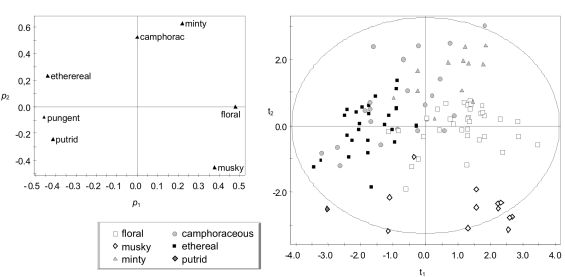
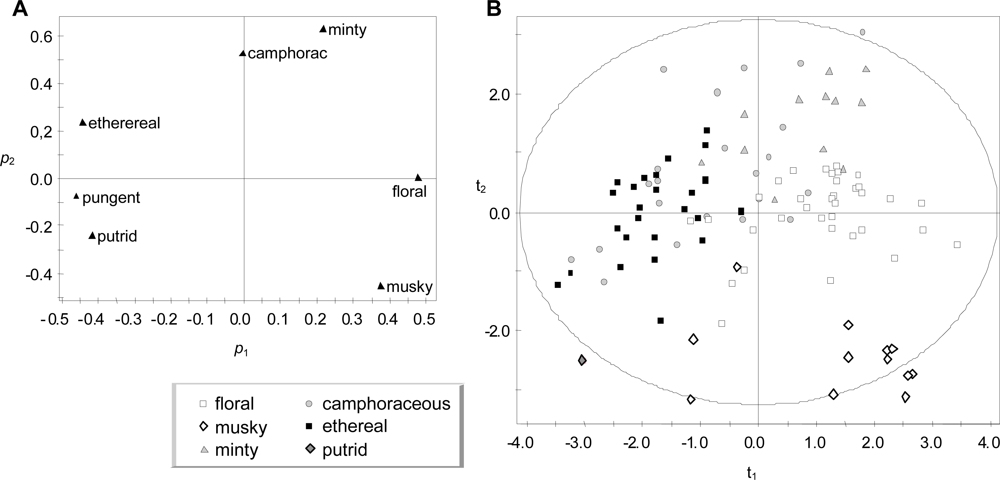
The Amoore & Venstrom database [39] was analyzed with PCA in an attempt to identify correlation structures among the seven variables. One criterion usually applied is to focus on those PCs with an eigenvalue λ > 1. This condition is satisfied by PC1 (λ = 2.4), PC2 (λ = 1.6) and PC3 (λ = 1.2). Another criterion is based on the goodness-of-fit by cross-validation (Q2). In this case, Q2 is lower than the threshold value considered by the software (for PC1, Q2 = 0.07 < 0.13; for PC2, Q2 = −0.01 < 0.15). The results of PCA are usually easier to interpret if variables are normally distributed. Using a normal probability plot, it was observed that the seven variables follow a positive skewed distribution. In order to normalize the distribution, the logarithmic transformation was applied to three variables (“ethereal”, “musky” and “minty”), and the square-root transformation to the remaining ones. If a new PCA is carried out with the transformed variables, PC1 satisfies the cross-validation criterion (Q2 = 0.14 > 0.13) and accounts for 39.3% of the total data variance. This is not the case for PC2 (Q2 = 0.08 < 0.15), which explains 24.6% of the variance. Thus, PC1 can be considered as a relevant underlying dimension of the database.
A scatter plot of the loadings corresponding to PC1 and PC2 [Figure 2(A)] highlights the similarities and dissimilarities among descriptors. “Minty” and “camphoraceous” present the highest loadings in PC2 and appear close to each other in this loading plot, but in a position opposite to “musky.” This observation suggests that minty and camphoraceous odors are related but clearly different from musky smells, which is consistent with other reported studies [43,44]. Hence, PC2 also provides relevant information, though it does not satisfy the cross-validation criterion of significance.
Hedonic tones HTD84 were assigned to the seven descriptors of the A&V database. The correlation between these values and p1 loadings is statistically significant (r = 0.88, p = 0.010). It might be argued that this observed significance level (p-value) is not low enough to interpret PC1 as the hedonic dimension because hedonic judgments are affected by many factors such as age, gender and personal experience (for review see [35,45]). In order to further investigate PC1, the projections of the 107 chemicals over this component (i.e., t1 scores) were obtained. If these values are compared with the estimated hedonic scores HA&V-eq1, the correlation turns out to be statistically significant (r = 0.932, p < 0.0001). This p-value is much lower than in the previous case, which supports the interpretation of PC1 as the hedonic dimension. Taking into account this correlation, t1 scores can be interpreted as an indirect estimation of the hedonic character of the chemicals. However, if Equation (12) is modified using t1 as dependent variable instead of HA&V-eq1, a slightly lower goodness-of-fit (R2 = 0.432) is obtained.
It is worth noting that the hedonic dimension is even salient in the A&V database, though it contains just seven variables that were regarded by Amoore and Venstrom [39] as independent dimensions of odor character. This database was also analyzed by Wise et al. [46], who computed a dendogram that highlights the relationships between odorants. However, the results did not clearly reflect the hedonic dimension.
3.4. Hedonic Aspects of the Boelens and Haring Database
In the database obtained by Boelens and Haring [40], the average value of Nat is 13, which proves higher than in the other chemical sets studied here (Table 1). In order to estimate the hedonic scores of the 309 compounds in this database, it therefore seems more appropriate to apply Equation (11) or (12), given that both models take into account the quadratic effect of Nat observed for large molecules.
Applying Equation (11), the estimated hedonic tone is positive (i.e., hedonic character predicted as pleasant) in 94.2% of the compounds, and a percentage of 98.4% was obtained using Equation (12). This result suggests that chemicals in this database are biased towards pleasant odors, which would explain why pleasantness was not found as a salient dimension in this database [38]. This hypothesis seems reasonable because odor profiles in the database of Boelens and Haring were obtained in the context of perfumery. The perfumer’s raw materials form a sample which is heavily biased towards pleasant items because the perfumer’s ultimate objective is, in general, a balanced product which is basically pleasant and appealing [47]. Nonetheless, some aroma chemicals may be unpleasant at higher concentrations.
4. Discussion
4.1. What Makes an Odorant Smell Pleasant or Unpleasant?
Although many psychophysical studies reviewed in the introduction have shown that the hedonic dimension is the most salient when a wide range of smells are assessed, a fundamental question still unsolved in the field of olfaction is what makes an odorant smell pleasant or unpleasant. One theory is that acquired semantic knowledge is one of the important factors that determines odor hedonic valence [35,45,48]. It is well established that hedonic odor perception is strongly influenced by odorant concentration [42], experience [35,45], learning [49], familiarity [50], culture [23,50], context, etc.
An alternative view derived from the work of Khan et al. [26] is that, in humans, the pleasantness of odors may partly be explained by the physicochemical properties of the odorant molecules themselves. A recent study has used Khan’s model to classify 20 odorants as pleasant or unpleasant, and a panel of human appraisers found that the perceived pleasantness of both groups was statistically different [30]. Thus, the olfactory system seems to be predisposed to discriminate environmental olfactory stimuli on the basis of their chemical structure. The fact that electronic noses are able to assess hedonic valence [6–8] is consistent with this hypothesis.
If hedonic odor value is indeed partly predetermined by odorant structure, then it could be hypothesized that other mammal species might have similar odor preferences to humans. Mandairon et al. [31] found a statistically significant correlation between odor investigation time in mice for 19 compounds and odor hedonic ratings in humans, which implies that the same odorants were similarly attractive to both species.
Studies with newborns also suggest that at least some aspects of olfactory pleasantness may be innate. Actually, human neonates (i.e., with no exposure to culture or learning) are able to exhibit behavioral markers of repulsion in response to unpleasant odors [51]. Such predisposition in odor preference may be underlain by genetically programmed neural circuits, as has been suggested in the olfactory systems of mammals [52], and would explain why rodents bred for generations in predator-free laboratories are nevertheless averse to the smell of predators [53]. To sum up, experimental evidence supports the view that the hedonic perception of odorants is a complex process which involves both innate and learned components (for further discussion see [29]).
4.2. Effect of the Functional Group on Odor Character and Hedonic Perception
The fact that particular atoms or molecular features might affect the perceived hedonic character is not a new idea, because hedonic tones are associated with odor character descriptors [34], and chemists observed long ago that certain functional groups determine a specific odor character [54,55]. This issue was studied by Schafer & Brower [56], who found that a panel of 73 organic chemists were reasonably successful in identifying the functional groups of 36 unknown and unfamiliar odorants. Correct identifications of functional groups were made in 50–86% of the time for odorants containing amines, sulfur, esters, phenols, and carboxylic acids. The ability of human appraisers to distinguish between aliphatic odorants sharing the same number of carbon atoms but differing in their functional group has also been tested [57].
In the five chemical sets considered in the present study, the percentage of molecules containing oxygen is similar, about 73% (Table 1). The models obtained here indicate that the presence of oxygen (except in carboxylic acids) is likely to increase perceived pleasantness. This result is consistent with the fact that esters, ketones and lactones generally smell pleasant, which led to the suggestion that an oxygen linkage in a molecule is frequently associated with a pleasant odor [54].
Equations (7,9–11) are consistent with the well-known rule that molecules containing sulfur often have offensive smells [54]. These molecules generally smell “sulfidic”, which is an unpleasant descriptor (HTD84 = −2.45). Apart from sulfur, other particular atoms such as selenium, tellurium, phosphorus, bismuth, or arsenic are also likely to give an unpleasant odor [35]. Fourteen of the 107 compounds in the A&V database contain chlorine, which is a number high enough to study the effect of chlorine in hedonic character. However, this effect was not statistically significant (p = 0.66). A similar result (p = 0.65) was obtained in Moncrieff’s chemical set, which contains four chlorine compounds.
Carboxylic acids smell pungent and consequently tend to be described as unpleasant, as reflected by Equations (9–11). This effect was not identified in Harper’s nor in the A&V chemical sets because they contain too few carboxylic acids (Table 1). Actually, the descriptor “sour, vinegar” is unpleasant (HTD84 = −1.26) as well as “sharp, pungent, acid” (HTD84 = −2.34). The latter basically describes trigeminal sensation, which strongly depends on concentration. Nevertheless, many carboxylic acids, including medium to longer-chain acids, can smell unpleasant at sub-trigreminal concentrations (may smell cheesy or like body odor, for example).
It is also well known by chemists that amines produce a fishy-urinous odor, which results somewhat unpleasant (“ammonia”, HTD84 = −2.47; “fishy”, HTD84 = −1.98; “urinous”, HTD84 = −3.34). The negative effect of the indicator variable Iamine was statistically significant (p = 0.003) in Moncrieff’s chemical set (Equation (9)), which contains five amines, but not in the case of Dravnieks’ Atlas (p = 0.15). The remaining chemical sets do not contain enough amines to study this effect (Table 1). Apart from amines, no significant effect was found for the presence of nitrogen in the molecule. Further research will be required with a higher number of nitrogen compounds.
4.3. Correlation between Hedonic Scores and Molecular Size
Although recent experimental evidence supports the idea that odor pleasantness may partly be explained by odorant structure [6,27–31], the relationship between hedonic perception and molecular size has not been studied in depth. Khan et al. [26] found that the hedonic dimension was correlated with PC1 of the physicochemical molecular data, which accounted for 32% of the total variance. One of the variables with highest loading in PC1 was the number of non-hydrogen atoms, which suggests that this dimension could be basically interpreted as molecular size. Similar results were obtained by Schiffman [15,16], who calculated different molecular properties for the 45 compounds used by Wright and Michels [36] and found that molecular weight was the variable that best explained the discrimination of pleasant versus unpleasant odorants.
The results reported here confirm the positive correlation between Nat and hedonic character of a given molecule. Moreover, the coefficients of Nat in Equations (7), (9) and (10) are very similar. A quadratic effect of Nat was also observed, but only in the two chemical sets that contain a higher number of compounds (i.e., the A&V and Dravnieks’ databases) and a higher average value of Nat (Table 1). This quadratic effect suggests that the hedonic character asymptotically tends towards a maximum value that is reached at Nat of about 14 [Equation (12)] or 19 [Equation (11)] for molecules containing oxygen (except carboxylic acids) but not sulfur.
Considering Iox = 1 and other indicator variables equal to zero, Equations (7), (9), (11), and (12) become null for Nat = 5.7, 4.5, 7.5, and 5.9, respectively (average value, 5.9). A given molecule will thus be predicted as pleasant (i.e., with a positive hedonic score) if it contains oxygen and at least 6 additional non-hydrogen atoms. Sulfur compounds or carboxylic acids are likely to be perceived as unpleasant. This rule should be regarded as a general trend found in this study, but many exceptions can be encountered. For example, many steroid-type molecules such as androstenone possess a urinous-sweaty odor, though the predictive models obtained here would classify them as pleasant odorants based on their high molecular size. On the other hand, it is a common observation that very subtle molecular changes can have profound shifts both in odor quality and hedonic valence.
The best predictive model obtained by Khan et al. [26] for the 144 chemicals in Dravnieks’ Atlas was based on seven PCs from the physicochemical data, and the correlation coefficient between PC perceptual hedonic values and predicted values from molecular structure was r = 0.59 (p < 0.0001). The same chemical set was studied here, and the correlation between hedonic values HAt-eq1 and the ones predicted using Equation (11) was slightly higher (r = 0.71, p < 0.0001), although this Equation is based on very simple molecular features such as atom counts instead of complex dimensions of molecular descriptors. Models built with latent variables from a large matrix are difficult to interpret, and it is often advantageous to search for the best descriptor subset that improves the goodness-of-fit, as discussed in a latter study [27].
The main contribution of this paper is that a predictive model for hedonic tones was obtained with a similar goodness-of-fit to the model proposed by Khan et al. [26] despite using very simple molecular features. For this reason, better predictive models would probably have emerged if a detailed characterization of the molecular structure had been used by means of a large set of molecular descriptors, which encourages further studies aimed at understanding the relationship between molecular structure and hedonic odor character better. For this purpose, it would be necessary to use human assessors to obtain accurate hedonic ratings for a comprehensive set of compounds minimizing the effect of context, and the panelists’ culture and experience, which implies the use of large panels from different countries and cultures with participants of different ages, experience, etc. Moreover, given that odor intensity greatly affects pleasantness [42], it is also extremely important to assess all samples at the same odor intensity.
4.4. Role of the Hedonic Dimension of Odor Perception
Based on the finding that pleasantness is correlated with the most discriminating dimension of physicochemical molecular descriptors, Haddad et al. [28] suggested that, as with other senses, the olfactory system has evolved to exploit a fundamental regularity in the physical world. This hypothesis is appealing, but it still requires further investigation. The role of the hedonic dimension in olfaction was probably first discussed by Linnaeus [4], who suggested that fragrant and aromatic scents (i.e., the most pleasant odors) are perceived to be kindly and desirable to our nerves and even to life itself, while unpleasant odors are those repellent to life. Similarly, Beebe-Center [58] considered that pleasant stimuli are often those that are beneficial to the body. Anything that will tend to promote well-being, of the body or of the emotions, will also be pleasant: that what we need, we also like. This rule especially applies for food scents: what will be good for the body will usually be liked [35]. Emotional effects elicited by odors and the role of olfaction in well-being have recently been discussed [59].
From an evolutionary standpoint, Proetz [60] proposed that odor qualities regarded as pleasant or unpleasant were at one time beneficial or harmful, respectively. Based on this idea, some authors have suggested that the high sensitivity of human olfaction in detecting hydrogen sulfide and amines is an evolutionary adaptation for detecting decaying food and toxic gases, which have been present for evolutionarily significant time periods in the atmosphere [1]. Amines and thiols are associated with harmful conditions derived from putrid food, and maybe for this reason they smell unpleasant. Thus, putrid fish produces trimethylamine, while the degradation of meat releases thiols and hydrogen sulfide, given that two amino acids contain sulfur [61]. The physical repulsion one experiences when smelling rotten meat is likely to be due to human evolutionary legacy: it might be an avoidance mechanism or an alarm signal telling us not to eat this. Although the odors themselves may not be toxic, their association with decaying material indicates something that is best avoided, as the decaying material itself can represent a health risk [62]. The smell of predators is generally perceived as unpleasant by mammals as an innate signal of danger [53]. In contrast to this, a pleasant smell would be a sign of beneficial conditions such as an edible food, a safe environment, or a fertile mate, and they all indeed generally smell pleasant to mammals [29]. The function of human olfaction as a warning signal to avoid environmental hazards has recently been reviewed [63].
Acknowledgments
I would like to express my thanks to B. Murch and D. Stanton for introducing me to the exciting area of olfactory modeling.
References
- Doleman, BJ; Severin, EJ; Lewis, NS. Trends in odor intensity for human and electronic noses: Relative roles of odorant vapor pressure vs. molecularly specific odorant binding. Proc. Natl. Acad. Sci. USA 1998, 95, 5442–5447. [Google Scholar]
- Pearce, TC; Schiffman, SS; Nagle, HT; Gardner, JW. Handbook of Machine Olfaction: Electronic Nose Technology; Wiley-VCH: Weinheim, Germany, 2003. [Google Scholar]
- Zarzo, M. The sense of smell: Molecular basis of odorant recognition. Biol. Rev 2007, 82, 455–479. [Google Scholar]
- Linnaeus, C. Odores medicamentorum. In Amoenitates Academicae; Lars Salvius: Stockholm, Sweden, 1756; Volume 3, pp. 183–201. [Google Scholar]
- von Haller, A. Classes odorum. In Elementa Physiologiae; Grasset: Lausanne, Switzerland, 1763; Volume 5, Book 14, Section 2,; pp. 162–168. [Google Scholar]
- Haddad, R; Medhanie, A; Roth, Y; Harel, D; Sobel, N. Predicting odor pleasantness with an electronic nose. PloS Comput. Biol 2010, 6, e1000740. [Google Scholar]
- Williams, AL; Heinemann, PH; Wysocki, CJ; Beyer, DM; Graves, RE. Prediction of hedonic tone using an electronic nose and artificial neural networks. Appl. Eng. Agric 2010, 26, 343–350. [Google Scholar]
- Yokoyama, K; Ebisawa, F. Detection and evaluation of fragrances by human reactions using a chemical sensor based on adsorbate detection. Anal. Chem 1993, 65, 673–677. [Google Scholar]
- Yoshida, M. Studies in psychometric classification of odors. Jpn J Psychol 1964, 35, 1–17. (in Japanese). [Google Scholar]
- Woskow, MH. Multidimensional scaling of odors. In Theories of Odors and Odor Measurement; Tanyolac, N, Ed.; Robert College Research Center: Bebek: Istanbul, Turkey, 1968; pp. 147–188. [Google Scholar]
- Davis, RG. Olfactory perceptual space models compared by quantitative methods. Chem. Senses 1979, 4, 21–33. [Google Scholar]
- Berglund, B; Berglund, U; Engen, T; Ekman, G. Multidimensional analysis of twenty-one odors. Scand. J. Psychol 1973, 14, 131–137. [Google Scholar]
- Yoshida, M. Psychometric classification of odors. Chem. Senses Flavour 1975, 1, 443–464. [Google Scholar]
- Schiffman, SS; Robinson, DE; Erickson, RP. Multidimensional scaling of odorants: Examination of psychological and physicochemical dimensions. Chem. Senses Flavour 1977, 2, 375–390. [Google Scholar]
- Schiffman, SS. Contributions to the physicochemical dimensions of odor: A psychophysical approach. Ann. N. Y. Acad. Sci 1974, 237, 164–183. [Google Scholar]
- Schiffman, SS. Physicochemical correlates of olfactory quality. Science 1974, 185, 112–117. [Google Scholar]
- Coxon, JM; Gregson, RAM; Paddick, RG. Multidimensional scaling of perceived odour of bicyclo[2.2.1]heptane, 1,7,7-trimethylbicyclo[2.2.1]heptane and cyclohexane derivatives. Chem. Senses Flavour 1978, 3, 431–441. [Google Scholar]
- Stevens, DA; O’Connell, RJ. Semantic-free scaling of odor quality. Physiol. Behav 1996, 60, 211–215. [Google Scholar]
- Chrea, C; Valentin, D; Sulmont-Rossé, C; Ly-Mai, H; Nguyen, DH; Abdi, H. Culture and odor categorization: Agreement between cultures depends upon the odors. Food Qual. Preference 2004, 15, 669–679. [Google Scholar]
- Lawless, HT. Exploration of fragrance categories and ambiguous odors using multidimensional scaling and cluster analysis. Chem. Senses 1989, 14, 349–360. [Google Scholar]
- Sicard, G; Chastrette, M; Godinot, N. Des représentations de l’espace olfactif: des récepteurs à la perception. Intellectica 1997, 24, 85–107. [Google Scholar]
- Dubois, D. Categories as acts of meaning: The case of categories in olfaction and audition. Cognitive Sci. Quart 2000, 1, 35–68. [Google Scholar]
- Chrea, C; Valentin, D; Sulmont-Rossé, C; Nguyen, DH; Abdi, H. Semantic, typicality and odor representation: A cross-cultural study. Chem. Senses 2005, 30, 37–49. [Google Scholar]
- Zarzo, M. Psychologic dimensions in the perception of everyday odors: Pleasantness and edibility. J. Sens. Stud 2008, 23, 354–376. [Google Scholar]
- Dravnieks, A. Atlas of Odor Character Profiles, Data Series DS 61; American Society for Testing and Materials: Philadelphia, PA, USA, 1985. [Google Scholar]
- Khan, RM; Luk, CH; Flinker, A; Aggarwal, A; Lapid, H; Haddad, R; Sobel, N. Predicting odor pleasantness from odorant structure: Pleasantness as a reflection of the physical world. J. Neurosci 2007, 27, 10015–10023. [Google Scholar]
- Haddad, R; Khan, R; Takahashi, YK; Mori, K; Harel, D; Sobel, N. A metric for odorant comparison. Nat. Methods 2008, 5, 425–429. [Google Scholar]
- Haddad, R; Lapid, H; Harel, D; Sobel, N. Measuring smells. Curr. Opin. Neurobiol 2008, 18, 438–444. [Google Scholar]
- Yeshurun, Y; Sobel, N. An odor is not worth a thousand words: From multidimensional odors to unidimensional odor objects. Annu. Rev. Psychol 2010, 61, 219–241. [Google Scholar]
- Poncelet, J; Rinck, F; Ziessel, A; Joussain, P; Thévenet, M; Rouby, C; Bensafi, M. Semantic knowledge influences prewired hedonic responses to odors. PloS One 2010, 5, e13878. [Google Scholar]
- Mandairon, N; Poncelet, J; Bensafi, M; Didier, A. Humans and mice express similar olfactory preferences. PloS One 2009, 4, e4209. [Google Scholar]
- Harper, R; Bate-Smith, EC; Land, DG; Griffiths, NM. A glossary of odour stimuli and their qualities. Perfumery Essent. Oil Record 1968, 59, 22–37. [Google Scholar]
- Dravnieks, A; Bock, FC; Powers, JJ; Tibbetts, M; Ford, M. Comparison of odors directly and through profiling. Chem. Senses Flavor 1978, 3, 191–225. [Google Scholar]
- Dravnieks, A; Masurat, T; Lamm, RA. Hedonics of odors and odor descriptors. J. Air Pollut. Control Assoc 1984, 34, 752–755. [Google Scholar]
- Moncrieff, RW. Odour Preferences; Leonard Hill: London, UK, 1966. [Google Scholar]
- Wright, RH; Michels, K. Evaluation of far infrared relations to odor by a standards similarity method. Ann. N. Y. Acad. Sci 1964, 116, 535–551. [Google Scholar]
- Callegari, P; Rouault, J; Laffort, P. Olfactory quality: From descriptor profiles to similarities. Chem. Senses 1997, 22, 1–8. [Google Scholar]
- Zarzo, M. Relevant psychological dimensions in the perceptual space of perfumery odors. Food Qual. Preference 2008, 19, 315–322. [Google Scholar]
- Amoore, JE; Venstrom, D. Correlations between stereochemical assessments and organoleptic analysis of odorous compounds. In Olfaction and Taste II; Hayashi, T, Ed.; Pergamon Press: Oxford, UK, 1967; pp. 3–17. [Google Scholar]
- Boelens, H; Haring, HG. Molecular Structure and Olfactive Quality; Naarden International (Internal Report): Bussum, The Netherlands, 1981. [Google Scholar]
- Zarzo, M; Stanton, DT. Understanding the underlying dimensions in perfumers’ odor perception space as a basis for developing meaningful odor maps. Attention Percept. Psychophys 2009, 71, 225–247. [Google Scholar]
- Moskowitz, HR; Dravnieks, A; Klarman, LA. Odor intensity and pleasantness for a diverse set of odorants. Percept. Psychophys 1976, 19, 122–128. [Google Scholar]
- Chastrette, M; Elmouaffek, A; Sauvegrain, P. A multidimensional statistical study of similarities between 74 notes used in perfumery. Chem. Senses 1988, 13, 295–305. [Google Scholar]
- Zarzo, M; Stanton, DT. Identification of latent variables in a semantic odor profile database using principal component analysis. Chem. Senses 2006, 31, 713–724. [Google Scholar]
- Richardson, JT; Zucco, GM. Cognition and olfaction: A review. Psychol. Bull 1989, 105, 352–360. [Google Scholar]
- Wise, PM; Olsson, MJ; Cain, WS. Quantification of odor quality. Chem. Senses 2000, 25, 429–443. [Google Scholar]
- Harper, R; Bate-Smith, EC; Land, DG. Odour Description and Odour Classification: A Multidisciplinary Examination; Elsevier: New York, NY, USA, 1968. [Google Scholar]
- Rouby, C; Pouliot, S; Bensafi, M. Odor hedonics and their modulators. Food Qual. Preference 2009, 8, 545–549. [Google Scholar]
- Wilson, DA; Stevenson, RJ. Learning to Smell: Olfactory Perception from Neurobiology to Behavior; John Hopkins University Press: Baltimore, MD, USA, 2006. [Google Scholar]
- Distel, H; Ayabe-Kanamura, S; Martínez-Gómez, M; Schicker, I; Kobayakawa, T; Saito, S; Hudson, R. Perception of everyday odors—correlation between intensity, familiarity and strength of hedonic judgment. Chem. Senses 1999, 24, 191–199. [Google Scholar]
- Soussignan, R; Schaal, B; Marlier, L; Jiang, T. Facial and autonomic responses to biological and artificial olfactory stimuli in human neonates: Reexamining early hedonic discrimination of odors. Physiol. Behav 1997, 62, 745–758. [Google Scholar]
- Kobayawaka, K; Kobayakawa, R; Matsumoto, H; Oka, Y; Imai, T; Ikawa, M; Okabe, M; Ikeda, T; Itohara, S; Kikusui, T; Mori, K; Sakano, H. Innate versus learned odour processing in the mouse olfactory bulb. Nature 2007, 450, 503–508. [Google Scholar]
- Dielenberg, RA; McGregor, IS. Defensive behavior in rats towards predatory odors: A review. Neurosci. Biobehav. Rev 2001, 25, 597–609. [Google Scholar]
- Moncrieff, RW. The Chemical Senses, 2nd ed; Leonard Hill: London, UK, 1951. [Google Scholar]
- Beets, MGJ. Structure and odour. In Molecular Structure and Organoleptic Quality, SCI Monograph No 1; Society of Chemical Industry: London, UK, 1957; pp. 54–90. [Google Scholar]
- Schafer, R; Brower, KR. Psychophysical recognition of functional groups on odorant molecules. In Olfaction and Taste V; Denton, DA, Coughlan, JP, Eds.; Academic Press: New York, NY, USA, 1975; pp. 313–316. [Google Scholar]
- Laska, M; Ayabe-Kanamura, S; Hübener, F; Saito, S. Olfactory discrimination ability for aliphatic odorants as a function of oxygen moiety. Chem. Senses 2000, 25, 189–197. [Google Scholar]
- Beebe-Center, JG. The Psychology of Pleasantness and Unpleasantness; Van Nostrand: New York, NY, USA, 1932. [Google Scholar]
- Chrea, C; Grandjean, D; Delplanque, S; Cayeux, I; Calvé, B; Aymard, L; Velazco, MI; Sander, D; Scherer, KR. Mapping the semantic space for the subjective experience of emotional responses to odors. Chem. Senses 2009, 34, 49–62. [Google Scholar]
- Proetz, AW. Essays on the Applied Physiology of the Nose, 2nd ed; Annals Pub. Co: Saint Louis, MO, USA, 1953. [Google Scholar]
- Zarzo, M. The debate over rational design of odorants. Perfumer Flavorist 2007, 32(4), 20–26. [Google Scholar]
- Gostelow, P; Parsons, SA; Stuetz, RM. Odour measurements for sewage treatment works. Water Res 2001, 35, 579–597. [Google Scholar]
- Stevenson, RJ. An initial evaluation of the functions of human olfaction. Chem. Sense 2010, 35, 3–20. [Google Scholar]


| Chemical set | na | Natb | Number of molecules containingc | |||||||
|---|---|---|---|---|---|---|---|---|---|---|
| min | max | average | oxygen | nitrogen | sulfur | chlorine | acid | amine | ||
| Harper et al. [32] | 51 | 1 | 21 | 8.2 | 35 (69%) | 9 | 4 | 1 | 2 | 3 |
| Moncrieff [35] | 61 | 2 | 19 | 9.2 | 46 (75%) | 9 | 5 | 4 | 3 | 5 |
| Wright and Michels [36] | 45 | 1 | 15 | 8.4 | 30 (67%) | 4 | 4 | 2 | 5 | 0 |
| Dravnieks’ Atlas [25] | 143 | 4 | 29 | 10.7 | 112 (78%) | 22 | 13 | 1 | 8 | 5 |
| Amoore & Venstrom [39] | 107 | 3 | 21 | 10.3 | 79 (74%) | 7 | 1 | 14 | 1 | 0 |
| Boelens and Haring [40] | 309 | 3 | 22 | 13.0 | 287 (93%) | 14 | 0 | 1 | 4 | 0 |
aNumber of monomolecular compounds.bNumber of atoms in the molecule except hydrogen: minimum, maximum and average value.cNumber of molecules in the chemical set that contain an atom of oxygen, nitrogen, sulfur, chlorine, or molecules that are carboxylic acids or amines.
© 2011 by the authors; licensee MDPI, Basel, Switzerland. This article is an open access article distributed under the terms and conditions of the Creative Commons Attribution license (http://creativecommons.org/licenses/by/3.0/).
Share and Cite
Zarzo, M. Hedonic Judgments of Chemical Compounds Are Correlated with Molecular Size. Sensors 2011, 11, 3667-3686. https://doi.org/10.3390/s110403667
Zarzo M. Hedonic Judgments of Chemical Compounds Are Correlated with Molecular Size. Sensors. 2011; 11(4):3667-3686. https://doi.org/10.3390/s110403667
Chicago/Turabian StyleZarzo, Manuel. 2011. "Hedonic Judgments of Chemical Compounds Are Correlated with Molecular Size" Sensors 11, no. 4: 3667-3686. https://doi.org/10.3390/s110403667
APA StyleZarzo, M. (2011). Hedonic Judgments of Chemical Compounds Are Correlated with Molecular Size. Sensors, 11(4), 3667-3686. https://doi.org/10.3390/s110403667