Nanocrystalline SnO2:F Thin Films for Liquid Petroleum Gas Sensors

Abstract
: This paper reports the improvement in the sensing performance of nanocrystalline SnO2-based liquid petroleum gas (LPG) sensors by doping with fluorine (F). Un-doped and F-doped tin oxide films were prepared on glass substrates by the dip-coating technique using a layer-by-layer deposition cycle (alternating between dip-coating a thin layer followed by a drying in air after each new layer). The results showed that this technique is superior to the conventional technique for both improving the film thickness uniformity and film transparency. The effect of F concentration on the structural, surface morphological and LPG sensing properties of the SnO2 films was investigated. Atomic Force Microscopy (AFM) and X-ray diffraction pattern measurements showed that the obtained thin films are nanocrystalline SnO2 with nanoscale-textured surfaces. Gas sensing characteristics (sensor response and response/recovery time) of the SnO2:F sensors based on a planar interdigital structure were investigated at different operating temperatures and at different LPG concentrations. The addition of fluorine to SnO2 was found to be advantageous for efficient detection of LPG gases, e.g., F-doped sensors are more stable at a low operating temperature (300 °C) with higher sensor response and faster response/recovery time, compared to un-doped sensor materials. The sensors based on SnO2:F films could detect LPG even at a low level of 25% LEL, showing the possibility of using this transparent material for LPG leak detection.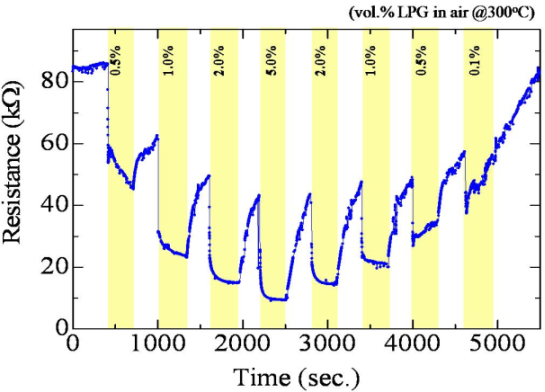
1. Introduction
Liquefied petroleum gas (LPG), which consists of hydrocarbons like CH4, C3H8, C4H10, etc., is widely used for many domestic and industrial purposes as well as used as a fuel for automobiles. Since it is potentially explosive, the detection of gas leaks has become very important for preventing the occurrence of such accidents [1]. Among the metal oxides, tin oxide (SnO2) is one of the most widely used materials for gas sensor application because of its ease of fabrication and its special properties such as chemical and thermal stability, natural non-stoichiometry and good ability to absorb oxygen. However, the gas-sensing properties of pure SnO2 are not sufficient to identify a given gas, due to its low sensitivity and selectivity [2]. To improve sensor response and selectivity for LPG detection, until now, various additives [3], such as Pt [4], Pd [4–6], Si [7], Sb [8] and Cs [9] or their oxides have been incorporated into the SnO2. Grain size reduction is another approach to enhance the gas response [6,9–11], and various techniques have been developed to reduce the grain size. A brief review of the results on doped SnO2 sensors reported by several groups is summarized in Table 1. Fluorine (F) doped SnO2 coated on glasses are now widely developed as transparent and conduction substrates for use in optical and electronic applications [12]. According to the literature survey, however, there are very few reports available [13–15] on the developing SnO2:F thin-film based gas sensors. Several deposition techniques have been used to grow un-doped and doped SnO2 films, including sputtering [7], E-beam evaporation [4], spray pyrolysis [8,9] and sol-gel [6]. Among them, a dip-coating deposition [16] is one of the most promising ones, due to the simplicity of the apparatus, cost-effectiveness, good uniformity of the films and well suitability for large-scale production.
In this paper, we report the deposition of F-doped nanocrystalline SnO2 thin films using the dip-coating technique and their application in LPG sensors. The effect of F concentration on the structural, surface morphological and LPG sensing properties of the SnO2 films was studied. To the best of our knowledge, this is the first report on the LPG sensing properties of SnO2 films modified by F doping.
2. Experimental Section
2.1. Sample Preparations
A tin oxide film was prepared by using a homemade dip-coating apparatus, which consists of a precursor container, a step motor and a heater. The layer-by-layer deposition cycle was done by alternating between dip-coating a thin layer and drying in air after each new layer. The precursor used was 0.25 M of stannous chloride (SnCl2:2H2O; Carlo Erba) prepared in ethanol (C2H5OH; Carlo Erba). The fluorine doping was achieved using ammonium fluoride (NH4F; Merck). A slide glass was used as a substrate. The dopant concentration of the precursor (as wt.% of NH4F to SnCl2:2H2O) was varied from 0 to 15 wt.%. The mixed solution was stirred for 2∼3 h and followed by ultrasonic agitation for ∼30 min before usage. A cleaned substrate was dipped into the solution and withdrawn at a constant speed of 2.4 mm/min, then annealed in air at ∼400 °C for ∼30 s after each cycle (one cycle). The deposition cycles were completely automated by computerized control system. Un-doped and F-doped SnO2 sensors were fabricated using a planar interdigital structure (sensing area: 10 mm × 8 mm). A finger electrode of aluminum (thickness: ∼500 nm) was fabricated through shadow mask using evaporation technique under a vacuum pressure of 1 × 10⁻³ Torr.
2.2. Characterizations
XRD patterns of SnO2 films were obtained using CuKα radiation at 30 kV and 30 mA and the crystallite size was estimated by the Scherrer’s equation. The morphology of the films was observed by SEM and AFM. Optical and electrical properties of the films were examined in the 0.3 to 1.1 μm spectral range using a UV/VIS spectroscopy and Hall Effect measurement, respectively. The film thickness was measured by a step profilemeter. The fourier transform infrared (FTIR) measurement was conducted over the range of 400 to 4,000 cm−1 in transmission mode at room temperature. Most of the spectra in this work were averaged over three different positions on the samples.
A SnO2 thin film sensor with finger interdigital electrodes was mounted tightly on a heater in a homemade test chamber whose temperature could be measured and controlled by a thermocouple. The sensing characteristic was examined by monitoring the changes in resistance, with a constant voltage of 1 V using Keithley source meter (model 2004). The sensor response to LPG was defined as |Ra − Rg| × 100/Ra, where Rg is the sensor resistance in the presence of LPG and Ra is that of baseline in N2 (or zero air) (TIG, Thailand; Industrial grade). The sensor response to 0.1∼6.4 vol.% of LPG was measured at 250∼400 °C. Commercially available LPG (PTT, Thailand) was used for this measurement. Varying LPG concentration was achieved by using a mass flow controller unit. The gas pressure over the sensor was 1 atm during the experiments. Data acquisition, storage and plotting in real time were realized using a personal computer with LabVIEW® software via a GPIB interface control.
3. Results and Discussion
3.1. Thin Film Properties
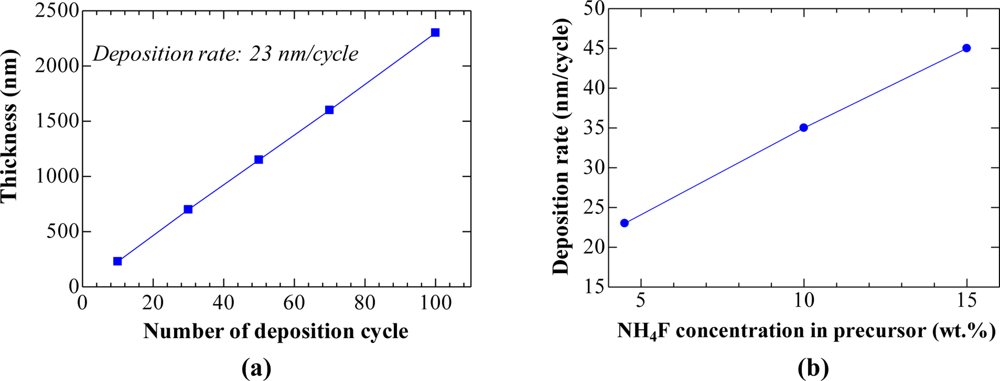
The variation of film thickness with the number of deposition cycles in Figure 1(a) reveals that this technique is superior to the conventional technique for improving the film thickness uniformity. The desired thickness could be easily adjusted since the film thickness is nearly linear with the number of deposition cycle. For the 4.5 wt.% NH4F precursor [Figure 1(a)], the deposition rate was ∼23 nm/cycle. When concentration increased to 10 wt.% and 15 wt.%, the deposition rate increased to ∼35 and ∼ 45 nm/cycle respectively, as shown in Figure 1(b). The increase in deposition rate with increasing the NH4F concentration has been found previously in NH4F/SnCl2 spray pyrolysis [18].
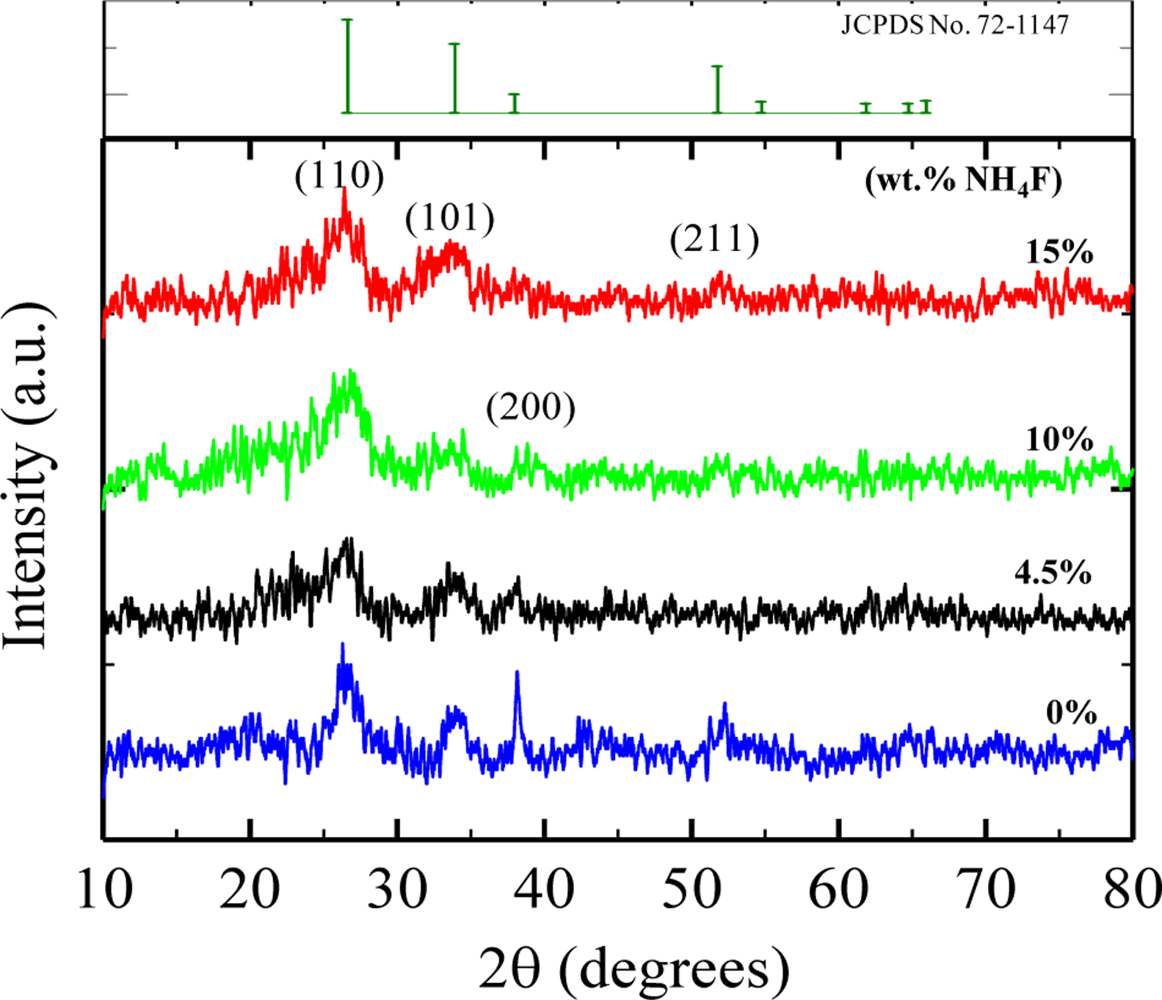
Figure 2 shows the X-ray diffraction patterns of the SnO2 films deposited at various NH4F concentrations (0, 4.5, 10, 15 at wt.%). For all deposited films, major peaks corresponding to the tetragonal SnO2 (JCPDS No. 72-1147) were observed.
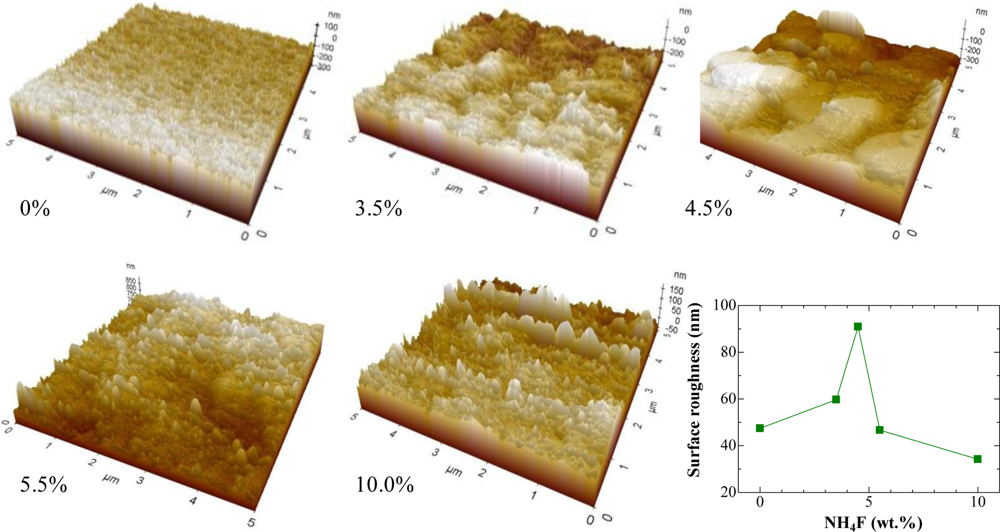
The peaks were broad, showing that the obtained films were small-sized nanocrystalline SnO2. The average crystalline size of SnO2 was estimated from XRD data using Scherrer’s equation [19] applied to the most intense 110, 101 and 200 diffraction lines. A broad size distribution ranging from 5.1 nm to 22.7 nm was found for the undoped film, however, the addition of NH4F into the precursor decreased the crystalline size and the size distribution became narrower (the calculated sizes were in the range of 3.7∼5.5 nm, 2.9∼3.9 nm and 2.7∼3.5 nm for 4.5 wt.%, 10 wt.% and 15 wt.%, respectively). Moreover, it was found that the crystalline size of films displayed very little dependence on the film thickness; the average size increased slightly from 4.3 nm for a 0.4 um-thick film to 5.0 nm for a 1.2 μm-thick film. Surface morphology of the films with different NH4F concentrations was examined by atomic force microscopy (AFM). The 3D images recorded at 5 μm × 5 m planar in contact mode are depicted in Figure 3.
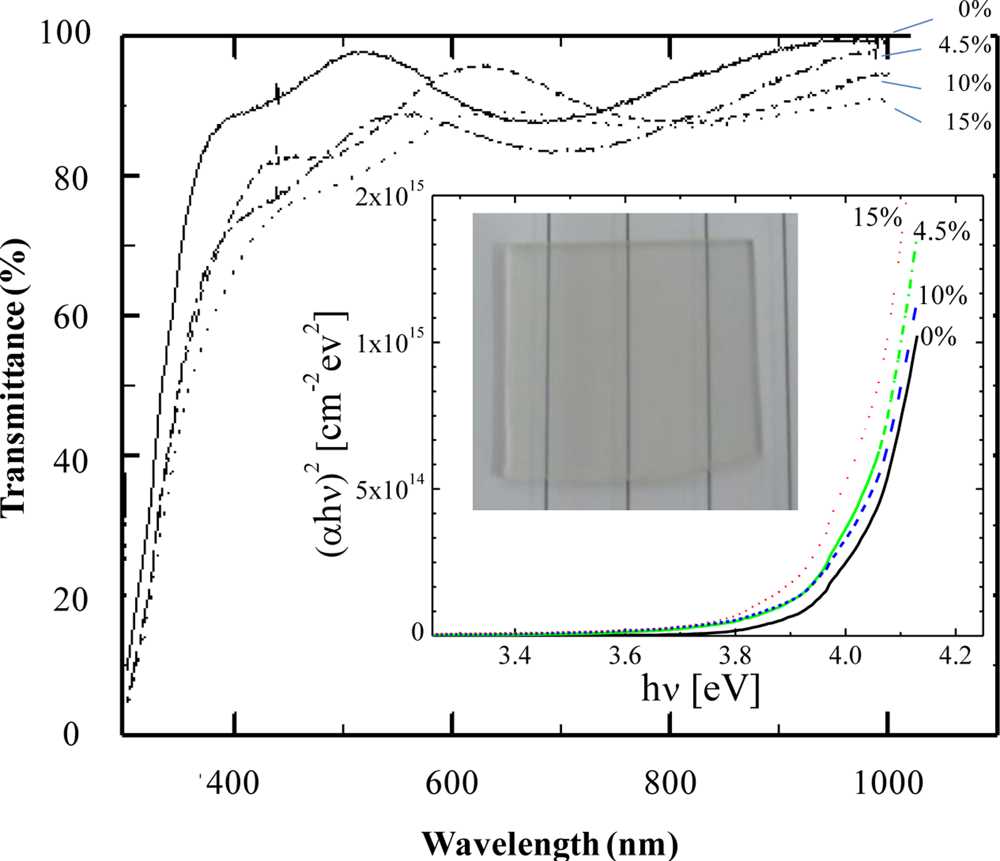
Root mean square (RMS) roughness of the films was obtained from the AFM data (inset in Figure 3). It was clearly seen that the oxide thin films deposited by dip-coating technique showed a nanoscale texture. AFM study reveals that the roughness of the films is dependent on the doping concentration. As shown in the figure, the surface roughness increased with increasing NH4F concentration and reached a maximum of 90 nm at 4.5 wt.%. However, it decreased with further increases in concentration (>4.5 wt.%). The change in the surface roughness with varying NH4F concentration may be due to the deep/shadow distribution of fluorine atoms in the tin oxide structure [20] and also the vaporization of fluorine from the films during the annealing process [21]. Figure 4 shows the wavelength dependence on optical transmittance of SnO2:F thin films deposited with various NH4F concentrations. The transmittance of all samples was more than 70% in the whole visible-light region (i.e., above 400 nm). The optical energy band gap (Eg) calculated from the optical transmission [22] was in the range of 3.95∼4.05 eV, and was found to slightly decrease for higher NH4F dopant (inset in Figure 4). The obtained Eg in this work was higher than those reported in previous works [23,24]. This could be due to the small grain size effect of the films [25].
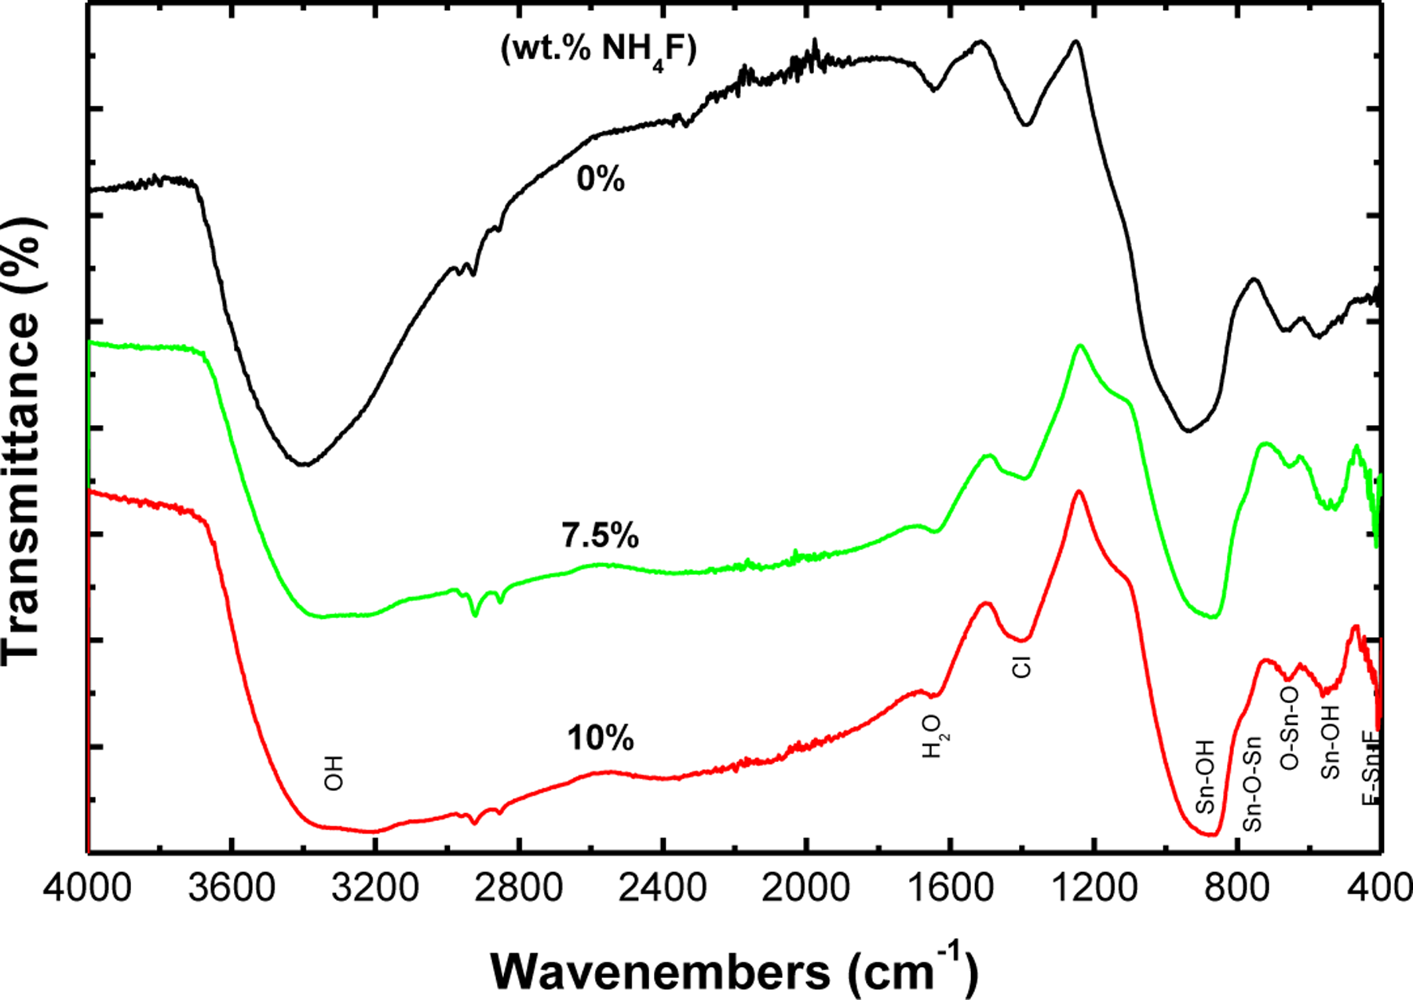
FTIR spectrometry was used for the determination of existing surface species. The FTIR spectra of un-doped and F-doped SnO2 films are illustrated in Figure 5. For all spectra, a band corresponding to the presence of adsorbed water (1,630∼1,640 cm−1) and hydroxide absorption bands in the range of 2,500∼3,700 cm−1 were observed. The band at 1,040 cm−1 was assigned to chloride contamination, which arises from chloride precursor used in this work. The peaks at the low wavenumbers (500∼1,000 cm−1) could be attributed to the SnO2. For the un-doped film, the peaks at 679, 784 and 968 cm−1 were assigned to O–Sn–O, Sn–O–Sn stretching vibrations and lattice vibrations, while the peaks at 570 and 866 cm−1 were due to Sn–OH bonds of the SnO2 crystalline phase [26–28].
The vibration frequencies of SnO2 were found to shift for the doped films. This shift can be ascribed to the increase in lattice disorder due to the in the lattice [29]. Moreover, it is interesting to note that an addition peak near 410 cm−1 was observed for the films doped with NH4F but absent for the un-doped SnO2 sample. This peak could be distributed to vibration frequency of F-Sn-F [29,30]. The FTIR spectra obtained in this work were comparatively broader in comparison with previous works [26,31]. This may be due to nanocrystalline nature of our films [28]. Auger electron spectroscopy (AES) analysis of the F-doped films was also carried out in order to determine the doping level of fluorine in the films (data not shown). It was found that no fluorine was detected for all studied films i.e., the concentration of the fluorine incorporated on the films in this case was less than 0.1% which is the detection limit of the analytical method. The low concentration of fluorine in the films could be due to the vaporization of fluorine from the films during the annealing-cycle process [21].
3.2. Gas Sensing Properties
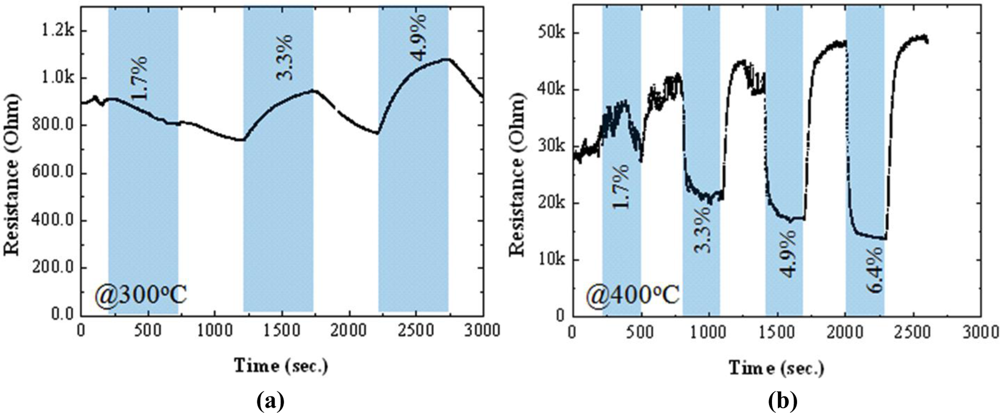
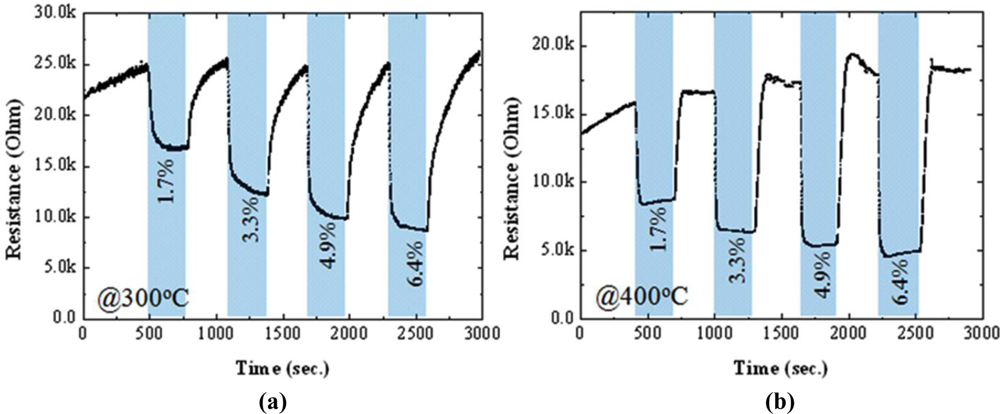
In order to investigate the effect of fluorine on sensor characteristics, the resistance change of the films deposited under different concentration of NH4F was evaluated in the presence of LPG gases. Figures 6 and 7 present the resistance changes of the un-doped and F-doped (4.5 wt.%) sensors, respectively, at operating temperatures of 300 °C (a) and 400 °C (b). According to the Hall Effect measurements, all of the studied films were n-type in ambient temperature. The resistivity of the doped films (2∼4 × 10⁻⁴ Ω cm) was about two times higher than that of the un-doped one (4∼9 × 10⁻⁴ Ω cm), in contrast to the previous findings [13,32]. This could be due to the high proportions of ammonia fluoride to stannous chloride in this work, compared to that used in Ref. [32]. Furthermore, in N2 atmosphere at 300 °C, the baseline resistance of the doped sensor was also ∼2 times higher than that of the un-doped sensor, as shown in Figures 6 and 7.
An increase in resistance of SnO2:F may be attributed the formation of insulating fluorine compounds (SnFx) at grain boundaries and surfaces [33], since ‘F’ has a higher binding energy to ‘Sn’ compared to ‘O’. However, these SnFx phases could not be detected by XRD analysis, probably containing very small crystallites for these phases.
A strong influence of F-doping on the gas sensitivity of SnO2 thin films could be found in Figures 6 and 7. At a high operating temperature (400 °C), the resistance of the un-doped sensor decreased in the presence of LPG and recovered to its baseline resistance after switching to N2, showing an n-type-like response to LPG [Figure 6(b)]. This is understandable because SnO2 sensors are known to behave as an n-type semiconductor. However, completely opposite behavior was observed for gas sensing at a low operating temperature (300 °C); the resistance of the sensor increased upon exposure to LPG, showing an p-type-like response, as displayed in Figure 6(a). It should be noted here that the transition between n-type and p-type responses could be reproducible under N2 atmosphere by changing the operating temperature. The p-type-like response to LPG was found in all un-doped SnO2 sensors only when the operating temperatures was lower than 300 °C, regardless of the film thickness (studied range: 250∼500 nm). The transition from n-type to p-type response and vice versa has been reported previously in some un-doped materials, such as In2O3 [34] and Fe2O3 [35]. The observed phenomena may be related to the small crystallite size of SnO2, which promotes the adsorption of catalytic water vapour [34] and/or band-bending-induced oxygen [35] at the surface of SnO2. In contrast to the un-doped sensors, F-doped sensors (Figure 7; for 4.5 wt.% of NH4F) showed n-type-like response, regardless of the operating temperature (studied range: 250–400 °C). As shown in Figures 6 and 7, the response of the sensors deposited both with and without F dopant increased with increasing the operating temperature. However, at a low temperature of 300 °C, F-doped sensors hold reasonably good response with high stability to LPG, compared to the un-doped one. Therefore, the temperature at 300 °C was taken as an operating temperature for further studies.
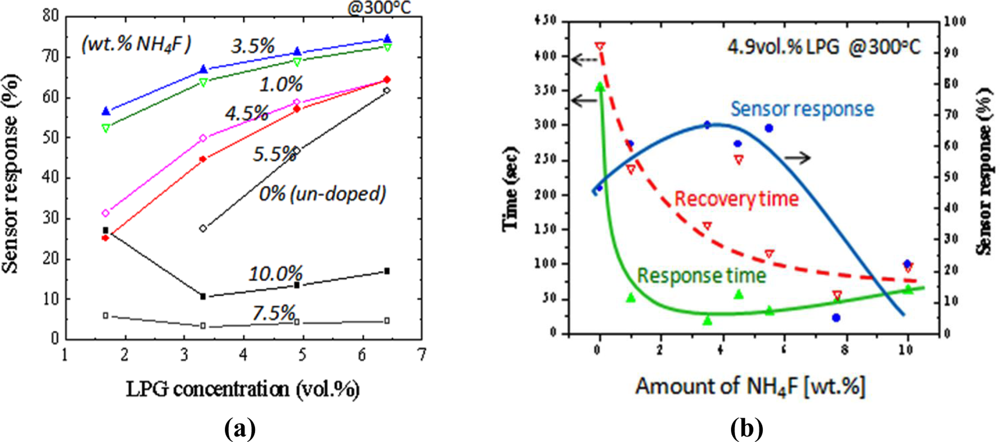
Figure 8(a) summarizes the results of sensor response at 300 °C to N2-diluted LPG (1.7∼6.4 vol.%) for the sensors prepared under different amount of NH4F. As can be seen for this result, the enhancement in sensor response to LPG could be achieved by adding F-dopant into the SnO2 materials. The response increased with an increase in NH4F concentration. The maximum response was obtained at 3.5 wt.% of NH4F. However, a decrease in response was observed when the NH4F in the precursor was more than 5.5 wt.%. It is well known that the sensor response of the sensor increases with increasing roughness of the film, because of the increase in the number of the active adsorption sites for oxygen or hydrocarbon molecules on the sensor surfaces [36]. This could explain the maximum response of the sensor doped at 3.5 wt.% of HN4F. Figure 8(b) shows the sensor response time, recovery time and sensor response as a function of NH4F concentration. The sensors were tested under 4.9 vol.% of LPG at 300 °C. It was shown that not only the response magnitude, but the response speeds were also enhanced by increasing the NH4F concentration. Compared to the un-doped sensors, the response and the recovery time (0–90% of final value) of the doped sensors decreased 7 times (from ∼350 to ∼50 s) and 2.5 times (from ∼400 to ∼150 s), respectively. The enhancement of the sensing properties observed for the F-doped films could be due to the decrease in grain size and the increase in surface roughness in the resulting metal oxide films.
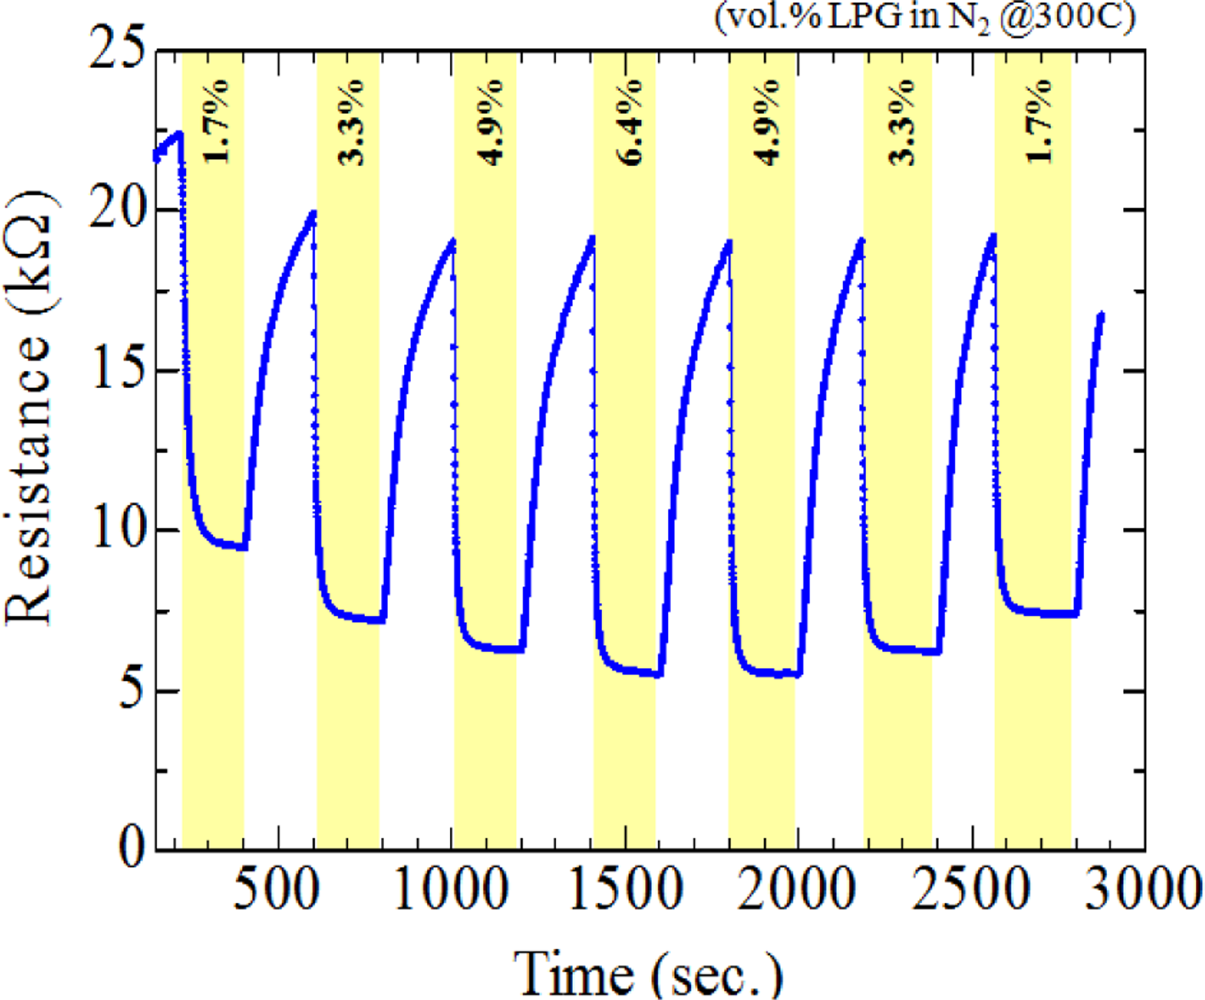
Among of the studied sensors, the sensor deposited at 3.5 wt.% of NH4F showed the maximum response of ∼55% to 1.7 vol.% LPG, with a response time of ∼50 s and a recovery time of ∼150 s (Figure 9). In order to ensure correct operation in air environment, we also tested this sensor in the presence of LPG diluted with zero air.
Figure 10 shows the dynamic resistance response of the 3.5 wt.% F-doped SnO2 film in an alternating environment of air and LPG (0.1∼5.0 vol.%) at 300 °C. It should be noted here that the highly increase in baseline resistance under air atmosphere must be mainly caused by the adsorption of ambient oxygen on the SnO2 surfaces. As shown in Figure 10, the SnO2:F sensor could detect LPG at 0.5% by volume in air which corresponds to 25% of the LEL (lower explosive limit), showing the possibility of using this material for LPG leak detection. In order to investigate the selectivity for LPG, this sensor (3.5 wt.% F-doped SnO2) was tested for ethanol, methanol, acetone and LPG. The gas concentration and operating temperature in all cases were 0.5 vol.% and 300 °C, respectively. The response of the sensor to VOCs vapors was found to be slightly lower as compared to its response to LPG (Gas responses to ethanol (28%), methanol (25%), acetone (29%) and LPG (46%)), showing medium selectivity for LPG.
Since the SnO2 films deposited by a dip-coating technique show nanoscale textured surfaces, the sensing mechanism of the sensors may be explained by the interactions between target gases and sensor surfaces [37]. At the operating temperature of 300–400 °C atmospheric oxygen atoms are adsorbed onto the SnO2 surface in the term of O− ions [38] by capturing electrons from the conduction band. When the SnO2 sensor is exposed to LPG (reducing gaseous species), LPG molecules removes adsorbed oxygen ions from the surfaces and produces water molecules along with electrons according to the following equations [39]:
Here, CnH2n+2 represents a mixture of hydrocarbons like propane (C3H8; n = 3) and butane (C4H10; n = 4), the main components of LPG. This reaction produces more electrons and thus reduces the resistivity of n-type SnO2 and increases the resistivity of p-type SnO2 upon exposure to LPG. It is well known that gas response of the metal-oxide semiconductor sensors is mainly determined by the surface interactions of the target gases with the sensing material. Therefore it is certain that for the greater surface areas of the material, the interactions between the adsorbed gases and the sensor surfaces are stronger—i.e., the gas response is higher [40]. In the present case, the XRD (Figure 2) and AFM (Figure 3) results show that the adding intermediate amount of fluorine into the films could decrease the crystalline size and increase the surface roughness, resulting in the formation of nanoscale-textured surfaces. An increase in surface areas [11,41] leads to more effective sites for more oxygen to be adsorbed and more interaction with LPG molecules, and, as a consequence, to enhance the sensor response (Figures 6–8). Besides, the tiny grain size of the SnO2:F films may become comparable to the thickness of the depletion region [10], which will also give contribution to the increased response [41]. However, further studies are needed to elucidate the gas sensing mechanism of F-doped oxides and to improve their gas sensing characteristics.
4. Conclusions
Tin oxide films were prepared on glass substrates by dip-coating technique using a layer-by-layer deposition cycle (alternating between dip-coating a thin layer followed by drying in air after each new layer was added). The results showed that this technique is superior to the conventional technique for both improving the film thickness uniformity and film transparency. Atomic Force Microscopy (AFM) and X-ray diffraction pattern measurements showed that the obtained thin films were nanocrystalline SnO2 with nanoscale-textured surfaces. The addition of fluorine to SnO2 was found to be advantageous for efficient detection of LPG gases, e.g., F-doped sensors are more stable at a low operating temperature (300 °C) with higher sensor response and faster response/recovery time, compared to un-doped sensor materials. Among of the studied sensors, the 3.5 wt.% F-doped SnO2 film showed the maximum response of ∼55% to 1.7 vol.% of LPG, with a response time of ∼50 s and a recovery time of ∼150 s. The sensor based on SnO2:F films could detect LPG even at a low level of 25% LEL, showing the possibility of using this material for LPG leak detection. The LPG-sensing mechanism may be explained by surface interaction between the reducing gas (LPG) and the chemisorbed oxygen ions on the SnO2 surfaces.
Acknowledgments
The author would like to thank S. Buasrikaew and C. Boonloy for their technical assistance, Nanotec of NSTDA for the discount on FTIR, TMEC of NSTDA for AES data and DSTAR of KMITL for AFM equipment. This work was supported in part by the Faculty of Engineering (KMITL) and the King Mongkut’s Institute of Technology Ladkrabang Research Fund.
References
- Varghese, OK; Grimes, CA. Metal oxide nanoarchitectures for environmental sensing. J. Nanosci. Nanotechnol. 2003, 3, 277–293. [Google Scholar]
- Salehi, A. A highly sensitive self heated SnO2 carbon monoxide sensor. Sens. Actuat. B: Chem. 2003, 96, 88–93. [Google Scholar]
- Haridas, D; Sreenivas, K; Gupta, V. Improved response characteristics of SnO2 thin film loaded with nanoscale catalysts for LPG detection. Sens. Actuat. B: Chem. 2008, 133, 270–275. [Google Scholar]
- Madhusudhana Reddy, MH; Chandorkar, AN. E-beam deposited SnO2, Pt-SnO2 and Pd-SnO2 thin films for LPG detection. Thin Solid Films 1999, 349, 260–265. [Google Scholar]
- Gupta, S; Roy, RK; Chowdhury, MP; Pal, AK. Synthesis of SnO2/Pd composite films by PVD route for a liquid petroleum gas sensor. Vacuum 2004, 75, 111–119. [Google Scholar]
- Vaishampayan, MV; Deshmukh, RG; Mulla, IS. Influence of Pd doping on morphology and LPG response of SnO2. Sens. Actuat. B: Chem. 2008, 131, 665–672. [Google Scholar]
- Majumder, S; Hussain, S; Das, SN; Bhar, RB; Pal, AK. Silicon doped SnO2 films for liquid petroleum gas sensor. Vacuum 2008, 82, 760–770. [Google Scholar]
- Babar, AR; Shinde, SS; Moholkar, AV; Bhosale, CH; Kim, JH; Rajpure, KY. Sensing properties of sprayed antimony doped tin oxide thin films: Solution molarity. J. Alloys Compounds 2011, 509, 3108–3115. [Google Scholar]
- Thomas, B; Benoy, S; Radha, KK. Influence of Cs doping in spray deposited SnO2 thin films for LPG sensors. Sens. Actuat. B: Chem. 2008, 133, 404–413. [Google Scholar]
- Korotcenkov, G. The role of morphology and crystallographic structure of metal oxides in response of conductometric-type gas sensors. Mater. Sci. Eng. R Rep. 2008, 61, 1–39. [Google Scholar]
- Gurlo, A; Ivanovskaya, M; Bârsan, N; Schweizer-Berberich, M; Weimar, U; Göpel, W; Diéguez, A. Grain size control in nanocrystalline In2O3 semiconductor gas sensors. Sens. Actuat. B: Chem. 1997, 44, 327–333. [Google Scholar]
- Ganguly, G; Carlson, DE; Hegedus, SS; Ryan, D; Gordon, RG; Pang, D; Reedy, RC. Improved fill factors in amorphous silicon solar cells on zinc oxide by insertion of a germanium layer to block impurity incorporation. Appl. Phys. Lett. 2004, 85, 479–481. [Google Scholar]
- Han, CH; Han, SD; Singh, I; Toupance, T. Micro-bead of nano-crystalline F-doped SnO2 as a sensitive hydrogen gas sensor. Sens. Actuat. B: Chem. 2005, 109, 264–269. [Google Scholar]
- Han, CH; Han, SD; Khatkar, SP. Enhancement of H2-sensing properties of F-doped SnO2 sensor by surface modification with SiO2. Sensors 2006, 6, 492–502. [Google Scholar]
- Han, CH; Hong, DU; Gwak, J; Han, SD. A planar catalytic combustion sensor using nano-crystalline F-doped SnO2 as a supporting material for hydrogen detection. Korean J. Chem. Eng. 2007, 24, 927–931. [Google Scholar]
- Ray, SC; Karanjai, MK; DasGupta, D. Tin dioxide based transparent semiconducting films deposited by the dip-coating technique. Surf. Coat. Technol. 1998, 102, 73–80. [Google Scholar]
- Senguttuvan, TD; Rai, R; Lakshmikumar, ST. Gas sensing properties of lead doped tin oxide thick films. Mater. Lett. 2007, 61, 582–584. [Google Scholar]
- Elangovan, E; Ramamurthi, K. A study on low cost-high conducting fluorine and antimony-doped tin oxide thin films. Appl. Surf. Sci. 2005, 249, 183–196. [Google Scholar]
- Cullity, BD. Elements of X-Ray Diffraction; Addison-Wesley Pub. Co.: Upper Saddle River, NJ, USA, 1978. [Google Scholar]
- Acosta, DR; Estrada, W; Castanedo, R; Maldonado, A; Valenzuela, MA. Structural and surface studies of tin oxide films doped with fluorine. Thin Solid Films 2000, 375, 147–150. [Google Scholar]
- Kim, H; Park, H-H. A study on the electrical properties of fluorine doped direct-patternable SnO2 thin films. Ceram. Int. 2001. in press. [Google Scholar]
- Burns, G. Solid State Physics; Academic Press: New York, NY, USA, 1985. [Google Scholar]
- Lee, SC; Lee, JH; Oh, TS; Kim, YH. Fabrication of tin oxide film by sol-gel method for photovoltaic solar cell system. Solar Energ. Mater. Solar Cells 2003, 75, 481–487. [Google Scholar]
- Roman, LS; Valaski, R; Canestraro, CD; Magalhaes, ECS; Persson, C; Ahuja, R; da Silva, EF; Pepe, I; da Silva, AF. Optical band-edge absorption of oxide compound SnO2. Appl. Surf. Sci. 2006, 252, 5361–5364. [Google Scholar]
- Zhu, H; Yang, D; Yu, G; Zhang, H; Yao, K. A simple hydrothermal route for synthesizing SnO2 quantum dots. Nanotechnology 2006, 17, 2386–2389. [Google Scholar]
- Kersen, Ü; Sundberg, MR. The reactive surface sites and the H2S sensing potential for the SnO2 produced by a mechanochemical milling. J. Electrochem. Soci. 2003, 150, H129–H134. [Google Scholar]
- van Tran, T; Turrell, S; Eddafi, M; Capoen, B; Bouazaoui, M; Roussel, P; Berneschi, S; Righini, G; Ferrari, M; Bhaktha, SNB; Cristini, O; Kinowski, C. Investigations of the effects of the growth of SnO2 nanoparticles on the structural properties of glass-ceramic planar waveguides using Raman and FTIR spectroscopies. J. Mol. Struct. 2010, 976, 314–319. [Google Scholar]
- Khan, AF; Mehmood, M; Aslam, M; Ashraf, M. Characteristics of electron beam evaporated nanocrystalline SnO2 thin films annealed in air. Appl. Surf. Sci. 2010, 256, 2252–2258. [Google Scholar]
- Zhang, B; Tian, Y; Zhang, JX; Cai, W. The role of oxygen vacancy in fluorine-doped SnO2 films. Phys. B Condens. Matter 2011, 406, 1822–1826. [Google Scholar]
- Arefi-Khonsari, F; Bauduin, N; Donsanti, F; Amouroux, J. Deposition of transparent conductive tin oxide thin films doped with fluorine by PACVD. Thin Solid Films 2003, 427, 208–214. [Google Scholar]
- Amalric-Popescu, D; Bozon-Verduraz, F. Infrared studies on SnO2 and Pd/SnO2. Catal. Today 2001, 70, 139–154. [Google Scholar]
- Acosta, DR; Zironi, EP; Montoya, E; Estrada, W. About the structural, optical and electrical properties of SnO2 films produced by spray pyrolysis from solutions with low and high contents of fluorine. Thin Solid Films 1996, 288, 1–7. [Google Scholar]
- Mientus, R; Ellmer, K. Structural, electrical and optical properties of SnO2-x:F-layers deposited by DC-reactive magnetron-sputtering from a metallic target in Ar-O2/CF4 mixtures. Surf. Coat. Technol. 1998, 98, 1267–1271. [Google Scholar]
- Korotcenkov, G; Brinzari, V; Golovanov, V; Cerneavschi, A; Matolin, V; Tadd, A. Acceptor-like behavior of reducing gases on the surface of n-type In2O3. Appl. Surf. Sci. 2004, 227, 122–131. [Google Scholar]
- Gurlo, A; Sahm, M; Oprea, A; Barsan, N; Weimar, U. A p- to n-transition on alpha-Fe2O3-based thick film sensors studied by conductance and work function change measurements. Sens. Actuat. B: Chem. 2004, 102, 291–298. [Google Scholar]
- Korotcenkov, G; Brinzari, V; Schwank, J; DiBattista, M; Vasiliev, A. Peculiarities of SnO2 thin film deposition by spray pyrolysis for gas sensor application. Sens. Actuat. B: Chem. 2001, 77, 244–252. [Google Scholar]
- Radecka, M; Zakrzewska, K; Rkas, M. SnO2-TiO2 solid solutions for gas sensors. Sens. Actuat. B: Chem. 1998, 47, 194–204. [Google Scholar]
- Cheong, HW; Lee, MJ. Sensing characteristics and surface reaction mechanism of alcohol sensors based on doped SnO2. J. Ceram. Process. Res. 2006, 7, 183–191. [Google Scholar]
- Meixner, H; Gerblinger, J; Lampe, U; Fleischer, M. Thin-film gas sensors based on semiconducting metal oxides. Sens. Actuat. B: Chem. 1995, 23, 119–125. [Google Scholar]
- Chang, JF; Kuo, HH; Leu, IC; Hon, MH. The effects of thickness and operation temperature on ZnO:Al thin film CO gas sensor. Sens. Actuat. B: Chem. 2002, 84, 258–264. [Google Scholar]
- Lu, F; Liu, Y; Dong, M; Wang, X. Nanosized tin oxide as the novel material with simultaneous detection towards CO, H2 and CH4. Sens. Actuat. B: Chem. 2000, 66, 225–227. [Google Scholar]


| Authors (Year) [Ref.] | Deposition method | Dopant (Doping level) | Test gas (Concentration) | Sensing performances |
|---|---|---|---|---|
| M. Reddy et al. (1999) [4] | Electron-beam evaporation | Platinum (Pt), Palladium (Pd) | LPG (50∼800 ppm), CO, CH4 | (Pt-SnO2) Response: 75% to 800 ppm LPG at 400 °C Response time: 23 s |
| Gupta et al. (2004) [5] | Magnetron sputtering and evaporation | Pd composite (7%) | LPG (0∼3,000 ppm) | Response: 65% to 3,000 ppm LPG. at 350 °C Response time: ∼10 s |
| Senguttuvan et al. (2007) [17] | Conventional solid-state route | Lead (Pb) (SnPbO3) | LPG (1,000 ppm) | Response: ∼48% at 150 °C |
| Majumder et al. (2008) [7] | Sputtering | Silicon (Si) | LPG (1,000∼7,000 ppm) | (Grain size: ∼90 nm) Response: 59% to 3,000 ppm LPG at 300 °C Response time: ∼30 s |
| Vaishampayan et al. (2008) [6] | Modified Pechini route | Palladium (Pd) (1.5∼3.5 mol%) | LPG (20∼1,000 ppm) | (1.5 mol% Pd, grain size: 11 nm) Response: 75∼95% at 50∼100 °C Response/Recovery time: 0.4∼0.8/3∼21 min |
| Thomas et al.(2008) [9] | Spray pyrolysis | Caesium (Cs) (0∼4 wt.%) | LPG (1,000 ppm) | (2% Cs, grain size: 18 nm) Response: 93.4% to 1,000 ppm LPG at 345 °C |
| Babar et al.(2011) [8] | Spray pyrolysis | Antimony (Sb) (0.5∼2.5 M) | LPG, Ethanol, Acetone | (grain size: 20 nm) Response: 40% to 2,000 ppm LPG at 450 °C |
| This work | Dip-coating | Fluoride (F) (0∼10 wt.%)) | LPG (∼50,000 ppm), EtOH, MetOH, Acetone | (grain size: 4∼6 nm) Response: 46% to 5,000 ppm LPG at 300 °C |
© 2011 by the authors; licensee MDPI, Basel, Switzerland. This article is an open access article distributed under the terms and conditions of the Creative Commons Attribution license (http://creativecommons.org/licenses/by/3.0/).
Share and Cite
Chaisitsak, S. Nanocrystalline SnO2:F Thin Films for Liquid Petroleum Gas Sensors. Sensors 2011, 11, 7127-7140. https://doi.org/10.3390/s110707127
Chaisitsak S. Nanocrystalline SnO2:F Thin Films for Liquid Petroleum Gas Sensors. Sensors. 2011; 11(7):7127-7140. https://doi.org/10.3390/s110707127
Chicago/Turabian StyleChaisitsak, Sutichai. 2011. "Nanocrystalline SnO2:F Thin Films for Liquid Petroleum Gas Sensors" Sensors 11, no. 7: 7127-7140. https://doi.org/10.3390/s110707127
APA StyleChaisitsak, S. (2011). Nanocrystalline SnO2:F Thin Films for Liquid Petroleum Gas Sensors. Sensors, 11(7), 7127-7140. https://doi.org/10.3390/s110707127