Comparison of pH Data Measured with a pH Sensor Array Using Different Data Fusion Methods


Abstract
: This paper introduces different data fusion methods which are used for an electrochemical measurement using a sensor array. In this study, we used ruthenium dioxide sensing membrane pH electrodes to form a sensor array. The sensor array was used for detecting the pH values of grape wine, generic cola drink and bottled base water. The measured pH data were used for data fusion methods to increase the reliability of the measured results, and we also compared the fusion results with other different data fusion methods.1. Introduction
The investigation of data fusion has developed since the 1980s. The United States Department of Defense (DoD) first used data fusion for a military detection and management system [1]. In recent years, data fusion has been applied to various application fields, such as robotics, image processing and non-military purposes, and is also used in traffic management and smart transport systems. Sharma and Raju [2] have described some characteristics of data fusion as follows: it raises information reliability, reduces uncertainty, improves detection effects, increases practicability, etc., as in weighted average methods [3–6], fuzzy fusion and neural network fusion [7]. This paper introduces some data fusion methods in later sections, consisting of average data fusion, self-adaptive data fusion [3], fuzzy set data fusion [8] and coefficient of variance data fusion [9]. Li et al. [10] stated that sensor networks were an integration of sensor techniques, nested computation techniques, distributed computation techniques and wireless communication techniques. They can be used for testing, sensing, collecting and processing information of monitored objects and transferring the processed information to users. Sensor networks represent a new research area of computer science and technology and have wide application in the future. Both academia and industries are very interesting in them. The concepts and characteristics of sensor networks and the data in the networks were introduced, and the issues of the sensor networks and the data management of sensor networks were discussed. The advances of research on sensor networks and the data management of sensor networks were also presented. Wang et al. [11] proposed a new mobile-agent-based adaptive data fusion (ADF) algorithm to determine the minimum number of measurements each node required for a perfectly joint reconstruction of multiple signal ensembles. They theoretically showed that ADF provided the optimal strategy with the minimum total number of measurements possible and hence reduced communication cost and network load.
Xia et al. [12] introduced a novel approach called the linearly constrained least squares (LCLS) method for statistical data fusion. The LCLS method uses only the constrained minimum sample variance of fused information, and the proposed fusion method can tackle the unknown covariance problem. Wei [13] introduced that multi-sensor data fusion technology was one of the main techniques of the modern C31 system, and the C31 system performance played a decisive role. The paper used Visual C++ and MATLAB languages to jointly design and construct a universal visualization multi-sensor data fusion simulation platform, which provided researchers with a variety of fusion algorithm simulations and quantitative assessment of the simulation environment, as well as carrying out teaching and scientific research to provide support. Recently, Zakaria et al. [14] reported an improved classification of the herb Orthosiphon stamineus using a data fusion technique. Low level fusion was performed by combining the information provided by different sensors in different modalities. Principal component analysis (PCA) and linear discriminant analysis (LDA) were chosen to perform the low level fusion.
Utilization of data sources measured with a sensor array in pH sensing studies has gained popularity with recent technological advances. Data fusion was used to provide a better solution than could otherwise be achieved from the use of single sensor data alone. Data fusion was used to produce an improved model or estimate of a sensing system from a set of independent data sources. In this study, we investigated the feasibility of using the data fusion method for a pH sensor array and used the measured pH data to apply these data fusion methods. This research investigated the comparison of data measured by the electrochemical pH sensor array with different data fusion methods. The primary objective of this study was to select an appropriate data fusion method for electrochemical measurement applications, regardless of whether the pH sensor array contained a failed pH sensor.
2. Experimental
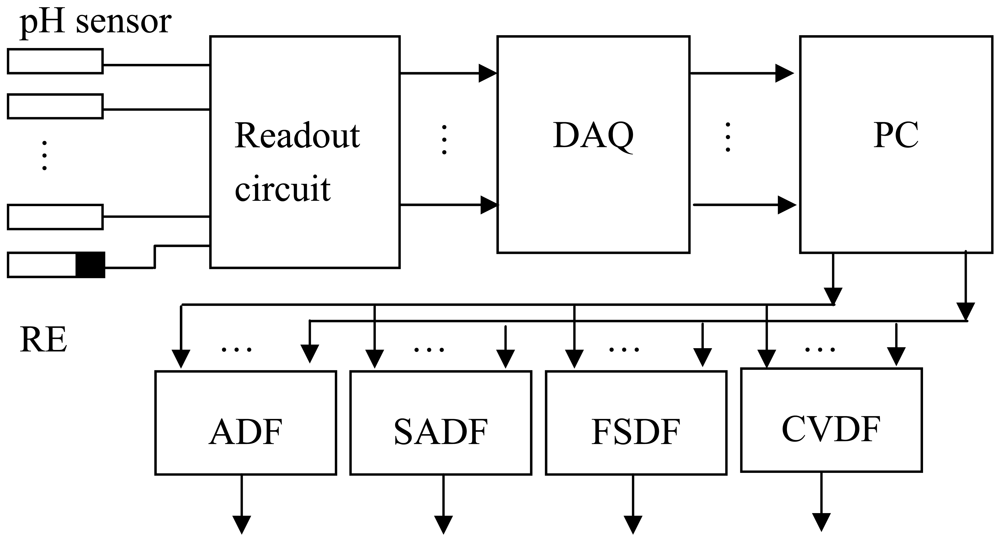
In this paper, the sensor array for pH measurement was based on the ruthenium dioxide (RuO2) pH electrode. The RuO2 thin film was deposited onto a silicon substrate using a sputtering system. In the experimental process, the sensor array and the Ag/AgCl reference electrode (RE) were immersed in commercial drinks (grape wine, generic cola drink and bottled base water) to obtain the pH readings by using a voltage-time measurement system interfaced with the program LabVIEW. The experiment uses a sensor array (eight pH electrodes) and repeats measurements fifteen times [15]. Figure 1 show a sensor array with eight pH sensors, a reference electrode, readout circuit, and the data acquisition card connected to a personal computer. The measured data were used for data fusion with different data fusion methods which are average data fusion (ADF), self-adaptive data fusion (SADF), fuzzy set data fusion (FSDA), and coefficient of variance data fusion (CVDF). The readout circuit consists of eight instrument amplifiers (IAs) and low pass filters (LPFs). The DAQ card is a product of National Instrument (NI) with universal series bus (USB) interface.
3. Data Fusion Methods
3.1. Average Data Fusion (ADF)
The pH measured data were obtained from a pH sensor array with eight ruthenium dioxide pH electrodes. For example, each sensor was measured n times during a measurement period. The pH measured data were used as a mathematical or statistical method to obtain the average value (mean) for the data measured n times from each pH sensor. Let the n times measured data of the ith sensor and the mean (μ) of n times measured data of the ith sensor be as follows [15]:
In this study, the average data fusion of sensor array with eight pH electrodes have the same weighted coefficients (w1 = w2 =⋯= w8). The sum of weighted coefficients is equal to 1 and the final average data fusion of sensor array is shown as follows [15]:
3.2. Self-Adaptive Data Fusion (SADF)
The current work obtained pH measured values from eight ruthenium dioxide pH sensors. Each sensor was measured n times during a measurement period. The pH measured data can be pre-processed using a mathematical or statistical method to obtain the mean (ȳi) and variance for the n times measured data from each pH sensor. The mean and variance equations are expressed in general form as follows [3]:
Here, we utilize the sensor array based on the minimum mean variance to proceed with measurement data fusion. First, we assume that all data from each sensor have the same mean and exclusion independent each other. We evaluated the weighted coefficients wi (w1, w2, … wn) for each pH sensor and the sum of weighted factors for each pH sensor is equal to unity. The estimated data fusion value μy can then be described as follows [3]:
From Equation (6), this study can obtain the total of mean variance σ2 which is related to each weighted coefficient in the multi-dimension second order function. According to the multi-dimension function theory, we can obtain the f function that consists of λ and wi variables in the equation as follows [3]:
The Lagrange multiplier method is used to evaluate the solution of Equation (9). Let the f function proceeds partial deviation of λ and wi, respectively. The equations are obtained as follows [3]:
The solutions of the Equations (11) and (12) are evaluated and the expressed equation for wi is obtained as follows [3]:
3.3. Fuzzy Set Data Fusion (FSDA)
There are n sensors in the measurement system and the sensors are used to determine the analyte, respectively. The measured values of the ith sensor in the k time are shown as follows [8]:
The measured values of each sensor acted as a fuzzy set. According to the fuzzy mathematic theory, we can closely measure between two fuzzy sets.
Definition 1: the approach degree measured values of the i sensor and j sensor at k time is shown as follows [8]:
Definition 2: the approach degree matrix between each sensor at k time is shown as follows [8]:
Definition 3: the consistence measurement of the measured value between the ith sensor and other sensors in the time of k is shown as follows [8]:
Considering measurement region dependability and defining the mean and variance of the ith sensor are shown as follows [8]:
Definition 4: the measurement of consistence dependability of the ith sensor in the time of k is shown as follows [8]:
Regularity equal to one then we have the following form [8]:
Utilizing the measurement of consistence dependability for data fusion, to obtain the measured value of data fusion of all sensors in the k time is presented as follows [8]:
3.4. Coefficient of Variance Data Fusion (CVDF)
The coefficient of variance (CV), also named discrete coefficient, is used for different measurement data. The CV is the ratio of the standard deviation and mean value. The CVi is presented as the coefficient of variance of measured data Xi, and the calculation of the CVi is described as follows [9]:
To utilize the coefficient of variance for the data fusion of sensor array, the data process and equation are shown as follows [9]:
From Equation (23), calculate the coefficient of variance with measured data of sensor array (CV1, CV2, ⋯, CVn).
Calculate the reciprocal of the coefficient of variance with measured data of sensor array ( ).
Let the reciprocal of the coefficient of variance, to obtain the weighting fusion of sensor array.
The result of fusion is described as follows [9]:
4. Results and Discussion
This study can obtain the pH measurement data of grape wine, generic cola drink and bottled base water from the ruthenium dioxide sensor array as shown in Table 1. We utilized the pH measured data of drinks in Table 1 to obtain fusion results with different data fusion methods. We also compared the fusion results with average data fusion, self-adaptive data fusion, fuzzy set data fusion and coefficient of variance data fusion etc. The pH sensor array was measured one time and obtained eight pH data. In this research, we provided an appropriate data fusion method for electrochemical measurement applications. This study is associated the various data fusion methods and pH sensor array to investigate the reliability of measured results of sensor array and without removing the measured data of the failed pH sensor among sensor array.
4.1. Average Data Fusion (ADF)
The current study has obtained average data fusion (ADF) from each sensor with the same weighted coefficients (w1 = w2 =⋯= w8). We used Equation (4) to derive the average data fusion with the pH measured data. The weighted coefficient of eight sensor array is 0.125. The data fusion results of grape wine, generic cola drink and bottled base water with average data fusion are 4.04, 5.11 and 7.62, respectively, and are shown in Table 2.
4.2. Self-Adaptive Data Fusion (SADF)
The measured pH data of the RuO2 sensor array were used with self-adaptive data fusion (SADF). We used the Equation (13) to obtain the weighted coefficients (wi) of sensor array. The weighted coefficients and the fusion results with weighted coefficients of SADF are shown in Table 3. The fusion results of grape wine, generic cola drink and bottled base water by using self-adaptive data fusion are 3.58, 4.67 and 7.44, respectively.
4.3. Fuzzy Set Data Fusion (FSDF)
We used Equation (21) to obtain the weighted coefficients (wi) of the sensor array with fuzzy set data fusion (FSDF). The fusion results and weighted coefficients (wi) of every sensor are shown in Table 4. The fusion results of grape wine, generic cola drink and bottled base water with fuzzy set data fusion are 3.56, 4.68 and 7.30, respectively.
4.4. Coefficient of Variance Data Fusion (CVDF)
We used Equation (24) to obtain the weighted coefficients (wi) of the sensor array with coefficient of variance data fusion (CVDF). Table 5 shows the fusion results of the coefficient of variance data fusion with weighted coefficients (wi) of every sensor. The measured pH data of grape wine after coefficient of variance data fusion is 3.62. The measured pH data of generic cola drink after coefficient of variance data fusion is 4.79 and the measured pH data of bottled base water after coefficient of variance data fusion is 7.46.
4.5. Summary Results
The weighted coefficients of various data fusion methods are obtained from the measured pH data and used these measured pH data to compute the mean (μ), standard deviation (σ) and variance (σ2) with mathematic statistic functions. In this study, we investigated the various data fusion methods and applied for the measured pH values of an electrochemical pH sensor array. The fusion technology is only to use the measured data and added mathematic statistic formula to derive the solution. Table 6 shows the summary of pre-calculation, weighted coefficient and computational complexity with different data fusion methods. The mean (μ) value of measured data was obtained for the H sensor array in the average data fusion in advance. The average data fusion has the same weighted coefficient and the complexity of calculation is easy. The self-adaptive data fusion need to obtain the mean (μ) and variance (σ2) beforehand, the weighted coefficients of sensor array were obtained from the variance of each pH sensor. The approach degree (σij) and consistent (ri) were used to calculate the weighted coefficients of the fuzzy set data fusion. The coefficient of variance data fusion used the mean (μ) and standard deviation (σ) to derive the weighted coefficients for pH sensor array. According to the computational process of these data fusion methods, in which the fuzzy set data fusion uses the variance and matrix operations and is more difficult than the others. The computational complexity of self-adaptive and coefficient of variance data fusions are moderate with mean, standard deviation and variance statistic operation. The average data fusion has easy computation with arithmetic average to get the weighted coefficients.
In this study, we have performed a series of trials for commercial drinks using different data fusion methods with a RuO2 pH sensor array. This section summarizes the fusion results in this experiment. We used the measured pH data of Table 1 for different data fusion methods to perform the data fusion. Tables 2–5 present the experiment results. Table 2 shows the final results of the pH measurement of grape wine, generic cola drink and bottled base water with a single sensor. The no. 6 sensor failed and its measured value is very different from other sensors. The fusion results with different data fusion methods are shown in Table 7 and compared with the measurement results of a commercial pH meter. From Table 7, we can conclude that the fusion result of average data fusion is more different from the commercial pH meter than the other data fusion methods. This phenomenon is due to the fact the 6th sensor of the pH sensor array failed; its measured data was incorrect and had the same weight coefficient as the others. As to the other data fusion methods, the 6th sensor has a smaller weighted coefficient, therefore the fusion results were fairly close to the measured value of the commercial pH meter. According to the experimental results, the conclusion was that the fusion results with self-adaptive, fuzzy set and coefficient of variance methods were superior to a single failed pH sensor and the average data fusion.
5. Conclusions
This study used ruthenium dioxide pH electrodes to form a sensor array and obtained a set of measured pH data with a voltage-time measurement system. The sensor array was applied to measure the pH of commercial drinks. The measured pH data were used for different data fusion methods. We also compared the fusion results with different data fusion methods and investigated the complexity of each one. The data fusion results were obviously superior to a single failed sensor and the average data fusion.
Acknowledgments
This study was supported by National Science Council, the Republic of China under the contracts NSC 100-2221-E-224-017 and NSC 101-2221-E-265-001.
References
- Klein, L.A. Sensor Technologies and Data Requirements for ITS; Artech House: Norwood, MA, USA, 2001; pp. 399–497. [Google Scholar]
- Sharma, V.S.; Raju, S. Multisensor data fusion and decision support for airborne target identification. IEEE Trans. Syst. Man Cybern. 1991, 21, 1224–1230. [Google Scholar]
- Zhou, Y.; Li, H.S.; Ding, Y.Z. Self-adaptive sensor weighted data fusion in strain detection. Proceedings of the 8th International Conference on Electronic Measurement and Instruments, Hefei, Anhui, China, 16–18 August 2007; pp. 4:55–4:58.
- Zhang, Q.Y.; Sun, L.; Jin, Y.F. Description of key performance index states based on cloud theory and weighted mean method for multi-sensor. Proceedings of the 8th ACIS International Conference on Software Engineering, Artificial Intelligence, Networking, and Parallel/Distributed Computing, Qingdao, Shandong, China, 30 July–1 August 2007; pp. 350–354.
- Gao, S.; Feng, Z.; Li, H. The research of data fusion method for sample mean random weighting estimation. Proceedings of the 2006 IEEE International Conference on Information Acquisition, Weihai, Shandong, China, 20–23 August 2006; pp. 584–588.
- Guo, L.; Chen, X.; Hu, S. Fusion tracking algorithm based on stochastic approximation. Proceedings of the 2006 IEEE International Conference on Information Acquisition, Weihai, Shandong, China, 20–23 August 2006; pp. 802–807.
- Zhang, J.W.; Wang, K.Q.; Yue, Q. Data fusion algorithm based on functional link artificial neural networks. Proceedings of the 6th World Congress on Intelligent Control and Automation, Dalian, China, 21–23 June 2006; pp. 2806–2810.
- Wan, S.P. Method based on the ratio of signal to noise for multi-sensor data fusion. Chin. J. Sens. Actuators 2008, 21, 178–181. [Google Scholar]
- Wan, S.P. Fusion method for fuzzy sensor data based on coefficient of variance. Transducer Microsyst. Technol. 2008, 27, 63–65. [Google Scholar]
- Li, J.Z.; Li, J.B.; Shi, S.F. Concepts, issues and advance of sensor networks and data management of sensor networks. J. Softw. 2003, 14, 1717–1727. [Google Scholar]
- Wang, T.J.; Yang, Z.; Liu, G.Q. A mobile-agent-based adaptive data fusion algorithm for multiple signal ensembles in wireless sensor networks. Wirel. Sens. Netw. 2009, 1, 458–466. [Google Scholar]
- Xia, Y.S.; Leung, H.; Bossé, E. Neural data fusion algorithms based on a linearly constrained least square method. IEEE Trans. Neural Netw. 2002, 13, 320–329. [Google Scholar]
- Wei, X.M. Design and implementation of multi-sensor data fusion simulation platform. Adv. Intell. Soft Comput. 2012, 112, 11–16. [Google Scholar]
- Zakaria, A.; Shakaff, A.Y.M.; Adom, A.H.; Ahmad, M.; Masnan, M.J.; Aziz, A.H.A.; Fikri, N.A.; Abdullah, A.H.; Kamarudin, L.M. Improved classification of Orthosiphon stamineus by data fusion of electronic nose and tongue sensors. Sensors 2010, 10, 8782–8796. [Google Scholar]
- Liao, Y.H.; Chou, J.C. Weighted data fusion use for ruthenium dioxide thin film pH array electrodes. IEEE Sens. J. 2009, 9, 842–848. [Google Scholar]


| Times | 1 | 2 | 3 | 4 | 5 | 6 | 7 | 8 | 9 | 10 | 11 | 12 | 13 | 14 | 15 | |
|---|---|---|---|---|---|---|---|---|---|---|---|---|---|---|---|---|
| Sensors | ||||||||||||||||
| Grape wine | 1 | 3.85 | 3.82 | 3.79 | 3.68 | 3.98 | 3.50 | 3.86 | 3.63 | 3.53 | 3.89 | 3.74 | 3.46 | 3.67 | 3.75 | 3.66 |
| 2 | 3.75 | 3.64 | 3.58 | 3.82 | 3.69 | 3.76 | 3.66 | 3.58 | 3.71 | 3.64 | 3.81 | 3.61 | 3.71 | 3.67 | 3.71 | |
| 3 | 3.72 | 3.70 | 3.73 | 3.73 | 3.77 | 3.64 | 3.67 | 3.52 | 3.78 | 3.73 | 3.70 | 3.73 | 3.73 | 3.75 | 3.74 | |
| 4 | 3.32 | 3.33 | 3.27 | 3.38 | 3.58 | 3.36 | 3.29 | 3.29 | 3.41 | 3.35 | 3.46 | 3.39 | 3.36 | 3.44 | 3.37 | |
| 5 | 3.41 | 3.48 | 3.57 | 3.54 | 3.75 | 3.59 | 3.57 | 3.54 | 3.62 | 3.52 | 3.44 | 3.53 | 3.59 | 3.57 | 3.59 | |
| (6) * | 4.80 | 4.83 | 5.83 | 5.67 | 8.72 | 10.21 | 10.12 | 10.00 | 9.80 | 9.02 | 8.24 | 7.52 | 6.36 | 5.16 | 4.37 | |
| 7 | 3.56 | 3.59 | 3.45 | 3.31 | 3.30 | 3.27 | 3.10 | 3.15 | 3.29 | 3.59 | 3.76 | 3.66 | 4.01 | 3.99 | 3.46 | |
| 8 | 3.57 | 3.59 | 3.56 | 3.49 | 3.51 | 3.48 | 3.39 | 3.40 | 3.38 | 3.39 | 3.40 | 3.38 | 3.37 | 3.36 | 3.36 | |
| Generic cola drink | 1 | 4.26 | 4.37 | 4.58 | 4.73 | 4.63 | 4.46 | 4.67 | 4.60 | 4.70 | 4.63 | 4.21 | 4.02 | 4.23 | 4.71 | 4.70 |
| 2 | 4.20 | 4.35 | 4.43 | 4.71 | 4.82 | 4.80 | 4.81 | 4.83 | 4.91 | 5.02 | 4.96 | 4.96 | 4.90 | 4.87 | 4.74 | |
| 3 | 4.15 | 4.52 | 4.63 | 4.64 | 4.88 | 4.86 | 4.80 | 4.76 | 4.87 | 4.73 | 4.75 | 4.79 | 4.85 | 4.88 | 4.76 | |
| 4 | 3.98 | 4.34 | 4.60 | 4.58 | 4.70 | 4.77 | 4.89 | 4.76 | 4.74 | 4.79 | 4.76 | 4.80 | 4.79 | 4.72 | 4.76 | |
| 5 | 4.08 | 4.35 | 4.54 | 4.63 | 4.65 | 4.64 | 4.67 | 4.71 | 4.71 | 4.74 | 4.73 | 4.74 | 4.76 | 4.73 | 4.72 | |
| (6) * | 5.83 | 8.04 | 9.01 | 7.22 | 8.39 | 9.12 | 9.52 | 9.46 | 9.36 | 9.35 | 9.22 | 9.01 | 8.96 | 5.35 | 6.59 | |
| 7 | 3.98 | 4.32 | 4.40 | 4.43 | 4.88 | 4.72 | 4.74 | 4.61 | 4.72 | 4.79 | 4.75 | 4.79 | 4.76 | 4.63 | 4.64 | |
| 8 | 4.82 | 4.16 | 4.26 | 4.58 | 4.55 | 4.82 | 4.85 | 4.79 | 4.79 | 4.80 | 4.82 | 4.76 | 4.79 | 4.72 | 4.81 | |
| Bottled base water | 1 | 7.80 | 7.72 | 7.69 | 7.90 | 7.97 | 7.56 | 7.86 | 7.81 | 7.71 | 7.67 | 7.81 | 7.77 | 7.91 | 7.63 | 7.62 |
| 2 | 7.67 | 6.99 | 7.53 | 7.13 | 7.09 | 7.09 | 7.11 | 7.36 | 7.41 | 7.28 | 7.36 | 7.46 | 7.15 | 7.23 | 7.19 | |
| 3 | 6.91 | 7.39 | 7.58 | 7.11 | 7.13 | 7.28 | 7.31 | 7.27 | 7.23 | 7.43 | 7.33 | 7.22 | 7.26 | 7.27 | 7.37 | |
| 4 | 7.73 | 7.05 | 7.81 | 7.39 | 6.91 | 6.98 | 7.14 | 7.25 | 6.98 | 7.14 | 7.00 | 7.02 | 7.13 | 7.14 | 7.09 | |
| 5 | 7.77 | 7.25 | 7.30 | 7.53 | 7.04 | 6.99 | 7.13 | 7.38 | 7.34 | 7.47 | 7.66 | 7.66 | 7.52 | 7.44 | 7.23 | |
| (6) * | 9.58 | 8.39 | 10.32 | 11.54 | 10.18 | 9.38 | 8.76 | 9.11 | 8.58 | 8.30 | 9.57 | 10.26 | 11.55 | 9.66 | 8.33 | |
| 7 | 7.15 | 6.81 | 7.05 | 7.16 | 7.00 | 7.49 | 7.15 | 7.08 | 7.59 | 7.31 | 7.22 | 7.36 | 7.49 | 7.02 | 6.99 | |
| 8 | 7.57 | 7.10 | 7.32 | 7.63 | 7.45 | 7.22 | 7.36 | 7.58 | 7.18 | 7.06 | 7.16 | 7.23 | 7.33 | 7.15 | 7.65 | |
*Sensor No. (6) failed.
| i | 1 | 2 | 3 | 4 | 5 | 6 | 7 | 8 | ADF |
|---|---|---|---|---|---|---|---|---|---|
| Grape wine | 3.72 | 3.69 | 3.71 | 3.37 | 3.55 | 7.38 | 3.50 | 3.44 | 4.04 |
| Generic cola drink | 4.50 | 4.75 | 4.73 | 4.67 | 4.63 | 8.29 | 4.61 | 4.69 | 5.11 |
| Bottled base water | 7.76 | 7.27 | 7.27 | 7.18 | 7.38 | 9.57 | 7.19 | 7.33 | 7.62 |
| Sensor (i) | Grape wine (wi) | Generic cola drink (wi) | Bottled base water (wi) |
|---|---|---|---|
| 1 | 0.045372 | 0.127247 | 0.324111 |
| 2 | 0.187159 | 0.111269 | 0.123980 |
| 3 | 0.272164 | 0.179767 | 0.190449 |
| 4 | 0.164172 | 0.123371 | 0.063876 |
| 5 | 0.162918 | 0.196128 | 0.085280 |
| 6 | 0.000218 | 0.003356 | 0.004028 |
| 7 | 0.013709 | 0.114756 | 0.095197 |
| 8 | 0.154288 | 0.144106 | 0.113079 |
| SADF | 3.58 | 4.67 | 7.44 |
| Sensor (i) | Grape wine (wi) | Generic cola drink (wi) | Bottled base water (wi) |
|---|---|---|---|
| 1 | 0.105599 | 0.024853 | 0.027837 |
| 2 | 0.130574 | 0.129387 | 0.122701 |
| 3 | 0.146149 | 0.190182 | 0.100886 |
| 4 | 0.232531 | 0.104639 | 0.172091 |
| 5 | 0.188192 | 0.168873 | 0.165584 |
| 6 | 0.002562 | 0.003567 | 0.004394 |
| 7 | 0.059306 | 0.286215 | 0.172905 |
| 8 | 0.135085 | 0.092284 | 0.233602 |
| FSDF | 3.56 | 4.68 | 7.30 |
| Sensor (i) | Grape wine (wi) | Generic cola drink (wi) | Bottled base water (wi) |
|---|---|---|---|
| 1 | 0.088093 | 0.126295 | 0.227577 |
| 2 | 0.177495 | 0.124831 | 0.131845 |
| 3 | 0.215109 | 0.157725 | 0.163473 |
| 4 | 0.151923 | 0.129017 | 0.093518 |
| 5 | 0.159425 | 0.161257 | 0.111017 |
| 6 | 0.012109 | 0.037826 | 0.031278 |
| 7 | 0.045561 | 0.122942 | 0.114288 |
| 8 | 0.150284 | 0.140107 | 0.127005 |
| CVDF | 3.62 | 4.79 | 7.46 |
| Methods | Pre-Calculation | Weighted Coefficient (wi) | Computational Complexity |
|---|---|---|---|
| ADF | μ | 1/n | easy |
| SADF | μ,σ2 | moderate | |
| FSDF | σij, ri, r̄i, | difficult | |
| CVDF | μ,σ, CV = σ/μ | moderate |
*μ: mean; σ: standard deviation; σ2: variance; σij: approach degree; ri: consistent; r̄i: mean of consistent; n: sensor amount.
| Fusion Method | Grape Wine | Generic Cola Drink | Bottled Base Water |
|---|---|---|---|
| Average data fusion (ADF) | 4.04 | 5.11 | 7.62 |
| Self-adaptive data fusion (SADF) | 3.58 | 4.67 | 7.44 |
| Fuzzy set data fusion (FSDF) | 3.56 | 4.68 | 7.30 |
| Coefficient of variance data fusion (CVDF) | 3.62 | 4.79 | 7.46 |
| Commercial pH meter | 3.61 | 4.24 | 7.32 |
© 2012 by the authors; licensee MDPI, Basel, Switzerland. This article is an open access article distributed under the terms and conditions of the Creative Commons Attribution license (http://creativecommons.org/licenses/by/3.0/).
Share and Cite
Liao, Y.-H.; Chou, J.-C. Comparison of pH Data Measured with a pH Sensor Array Using Different Data Fusion Methods. Sensors 2012, 12, 12098-12109. https://doi.org/10.3390/s120912098
Liao Y-H, Chou J-C. Comparison of pH Data Measured with a pH Sensor Array Using Different Data Fusion Methods. Sensors. 2012; 12(9):12098-12109. https://doi.org/10.3390/s120912098
Chicago/Turabian StyleLiao, Yi-Hung, and Jung-Chuan Chou. 2012. "Comparison of pH Data Measured with a pH Sensor Array Using Different Data Fusion Methods" Sensors 12, no. 9: 12098-12109. https://doi.org/10.3390/s120912098