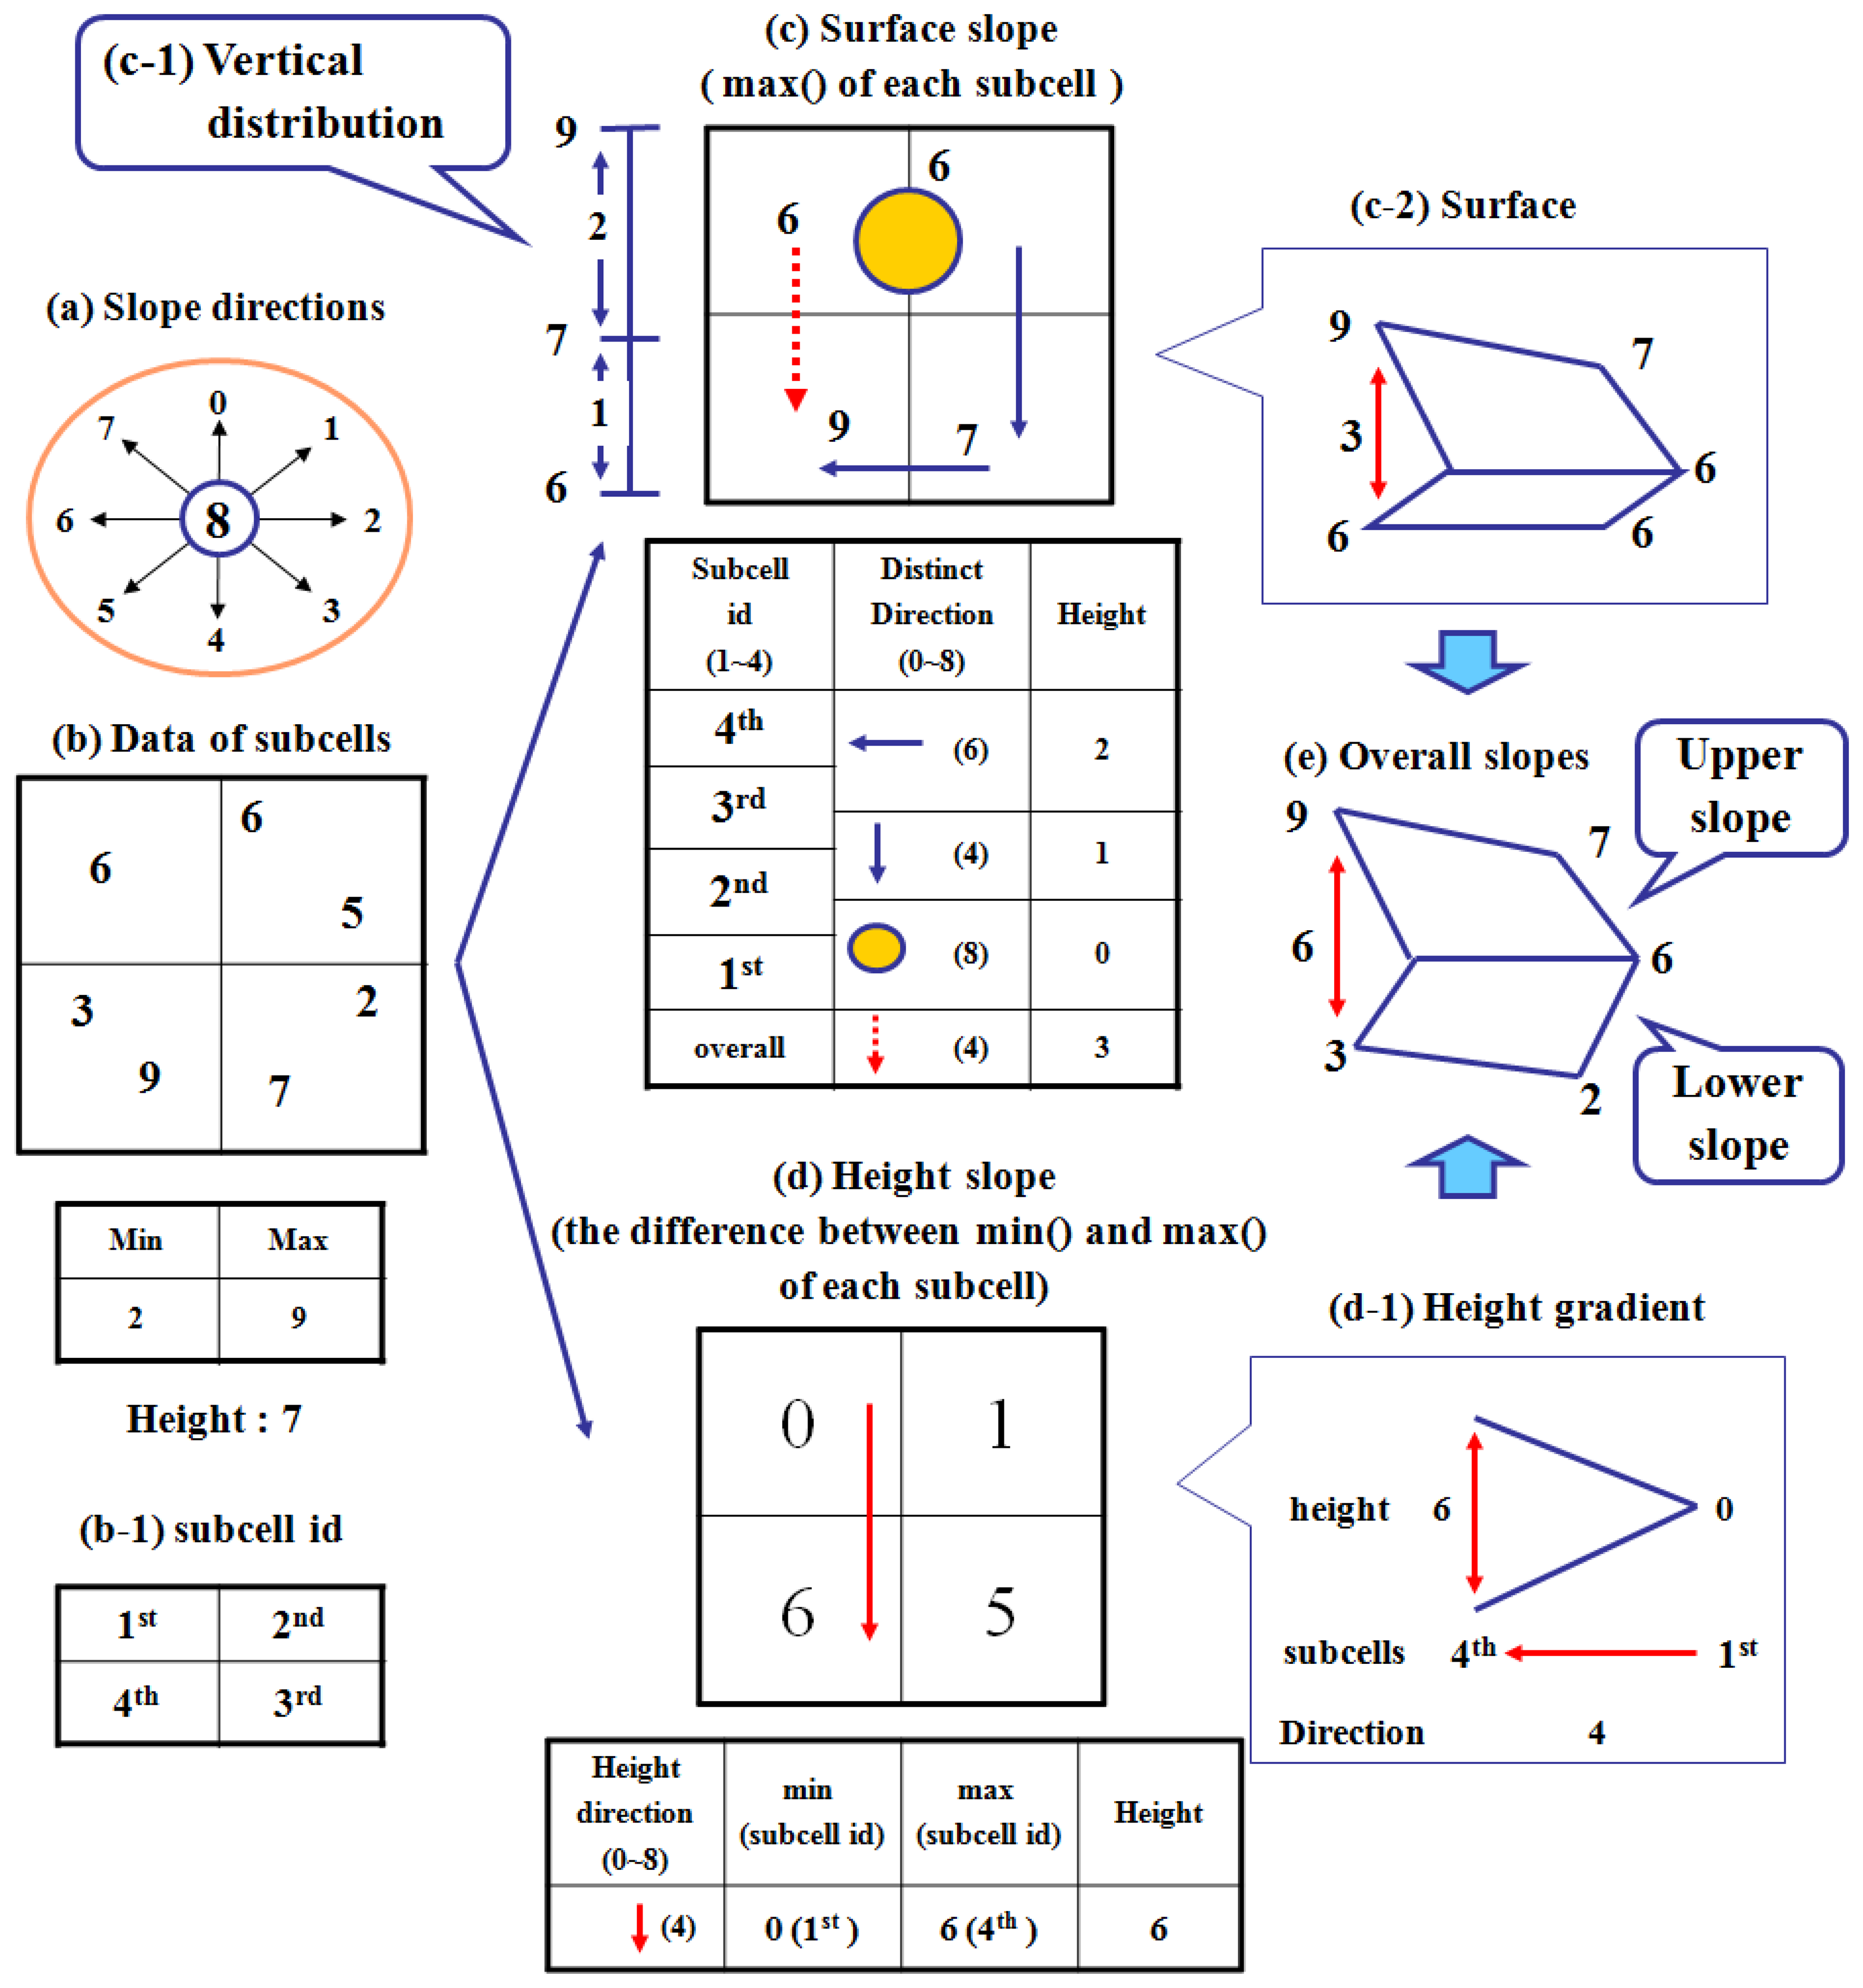
Correction: Lee, Y. et al. Geosensor Data Representation Using Layered Slope Grids. Sensors 2012, 12, 17074-17093
Reference
- Lee, Y.; Jung, Y.J.; Nam, K.W.; Nittel, S.; Beard, K.; Ryu, K.H. Geosensor Data Representation Using Layered Slope Grids. Sensors 2012, 12, 17074–17093. [Google Scholar]

© 2013 by the authors; licensee MDPI, Basel, Switzerland. This article is an open access article distributed under the terms and conditions of the Creative Commons Attribution license ( http://creativecommons.org/licenses/by/3.0/).
Share and Cite
Lee, Y.; Jung, Y.J.; Nam, K.W.; Nittel, S.; Beard, K.; Ryu, K.H. Correction: Lee, Y. et al. Geosensor Data Representation Using Layered Slope Grids. Sensors 2012, 12, 17074-17093. Sensors 2013, 13, 5404-5405. https://doi.org/10.3390/s130405404
Lee Y, Jung YJ, Nam KW, Nittel S, Beard K, Ryu KH. Correction: Lee, Y. et al. Geosensor Data Representation Using Layered Slope Grids. Sensors 2012, 12, 17074-17093. Sensors. 2013; 13(4):5404-5405. https://doi.org/10.3390/s130405404
Chicago/Turabian StyleLee, Yongmi, Young Jin Jung, Kwang Woo Nam, Silvia Nittel, Kate Beard, and Keun Ho Ryu. 2013. "Correction: Lee, Y. et al. Geosensor Data Representation Using Layered Slope Grids. Sensors 2012, 12, 17074-17093" Sensors 13, no. 4: 5404-5405. https://doi.org/10.3390/s130405404
APA StyleLee, Y., Jung, Y. J., Nam, K. W., Nittel, S., Beard, K., & Ryu, K. H. (2013). Correction: Lee, Y. et al. Geosensor Data Representation Using Layered Slope Grids. Sensors 2012, 12, 17074-17093. Sensors, 13(4), 5404-5405. https://doi.org/10.3390/s130405404


