The Influence of Nanopore Dimensions on the Electrochemical Properties of Nanopore Arrays Studied by Impedance Spectroscopy


Abstract
: The understanding of the electrochemical properties of nanopores is the key factor for better understanding their performance and applications for nanopore-based sensing devices. In this study, the influence of pore dimensions of nanoporous alumina (NPA) membranes prepared by an anodization process and their electrochemical properties as a sensing platform using impedance spectroscopy was explored. NPA with four different pore diameters (25 nm, 45 nm and 65 nm) and lengths (5 μm to 20 μm) was used and their electrochemical properties were explored using different concentration of electrolyte solution (NaCl) ranging from 1 to 100 μM. Our results show that the impedance and resistance of nanopores are influenced by the concentration and ion species of electrolytes, while the capacitance is independent of them. It was found that nanopore diameters also have a significant influence on impedance due to changes in the thickness of the double layer inside the pores.1. Introduction
The unique properties of metal oxide nanopores and their similarity with biological nanopore structures have attracted considerable research attention and seen the use of nanopores in many applications [1,2]. The integration of biomolecules into nanopores and nanochannels has been recognized as a new approach for development of simple, inexpensive and highly sensitive biomolecule detection [3–5]. The sensitivity, low cost, simplicity, and easy miniaturization of electrochemical detection is particularly suited to the development of highly sensitive nanopore-based biosensors [6]. The sensitivity of these nanopore-based devices is highly influenced by molecular transport of analyte molecules to reach binding receptors inside the nanopores where the dimensions of the nanopore structures (pore diameters and lengths) are critical parameters. Hence, a better understanding of electrical and electrochemical properties of the nanopores is essential for development and optimization of these devices. Thus characterizations using electrochemical methods are important to understand how devices based on nano-confined pore structures function [7,8] but surprisingly there have been few electrochemical studies on nanopore arrays and membranes [9].
Electrochemical impedance spectroscopy (EIS) is often used to characterize a wide variety of electrochemical phenomena related to the solid state, porous materials, synthetic and biological membranes, and liquid electrolytes [10]. Moreover, it provides valuable information on the functional and structural characteristics of membrane systems. The electrochemical impedance study in the ion-exchange membrane system provided a good means of investigating the electrochemical characteristics of fouling phenomena (i.e., deposition and accumulation of foulants on anion-exchange membranes) [11]. EIS is a powerful method for analyzing the complex electrical resistance of a system and possible changes of bulk properties and, therefore, it has been widely used for characterization of charge transport across nanopores in membranes and membrane/solution interfaces [10]. The applications of impedance sensors are not limited to gas and humidity sensors, etc., but these impedance sensors are also used in biological sensor which have very sophisticated interdigitated electrode structures [12,13].
The nanoporous alumina (NPAs) prepared by an electrochemical anodization process have been very attractive for the development of nanopore biosensing devices, due to their uniform pore size, high aspect ratio, high surface area and straightforward and inexpensive fabrication. It has been demonstrated that the electron transfer resistance will decrease and the conductance increase as a result of an ion transfer inside the pores of NPA [14,15]. Previous studies demonstrated that the transport of ions or molecules passing through nanopore nanochannels is affected by steric and electrostatic effects [16–18]. The electrostatic effect is a long-range effect caused by the interaction between surface charges and the transporting ions [13,19]. This transport is shown to be dependent on pore size and number of pores and can be changed by the surface charge or ionic strength of the bulk solution, which can also change their transport inside the nanopores [7,20]. These studies clearly demonstrate the need for a detailed investigation on the influence of nanopore dimensions on their electrochemical properties and biosensing performance [21,22].
Herein the aims of this work were to use impedance spectroscopy to explore the effect of nanopore diameters and lengths on the electrochemical properties of NPAs, which are related to their application in sensing and molecular separation. NPAs with different diameter (25 nm, 45 nm, 65 nm) and pore lengths (4.5 μm, 8 μm, 13.5 μm, 18 μm) were used as a nanopore array platform and sodium chloride (NaCl) with different concentrations was used as the electrolyte for the measurements.
2. Experimental Section
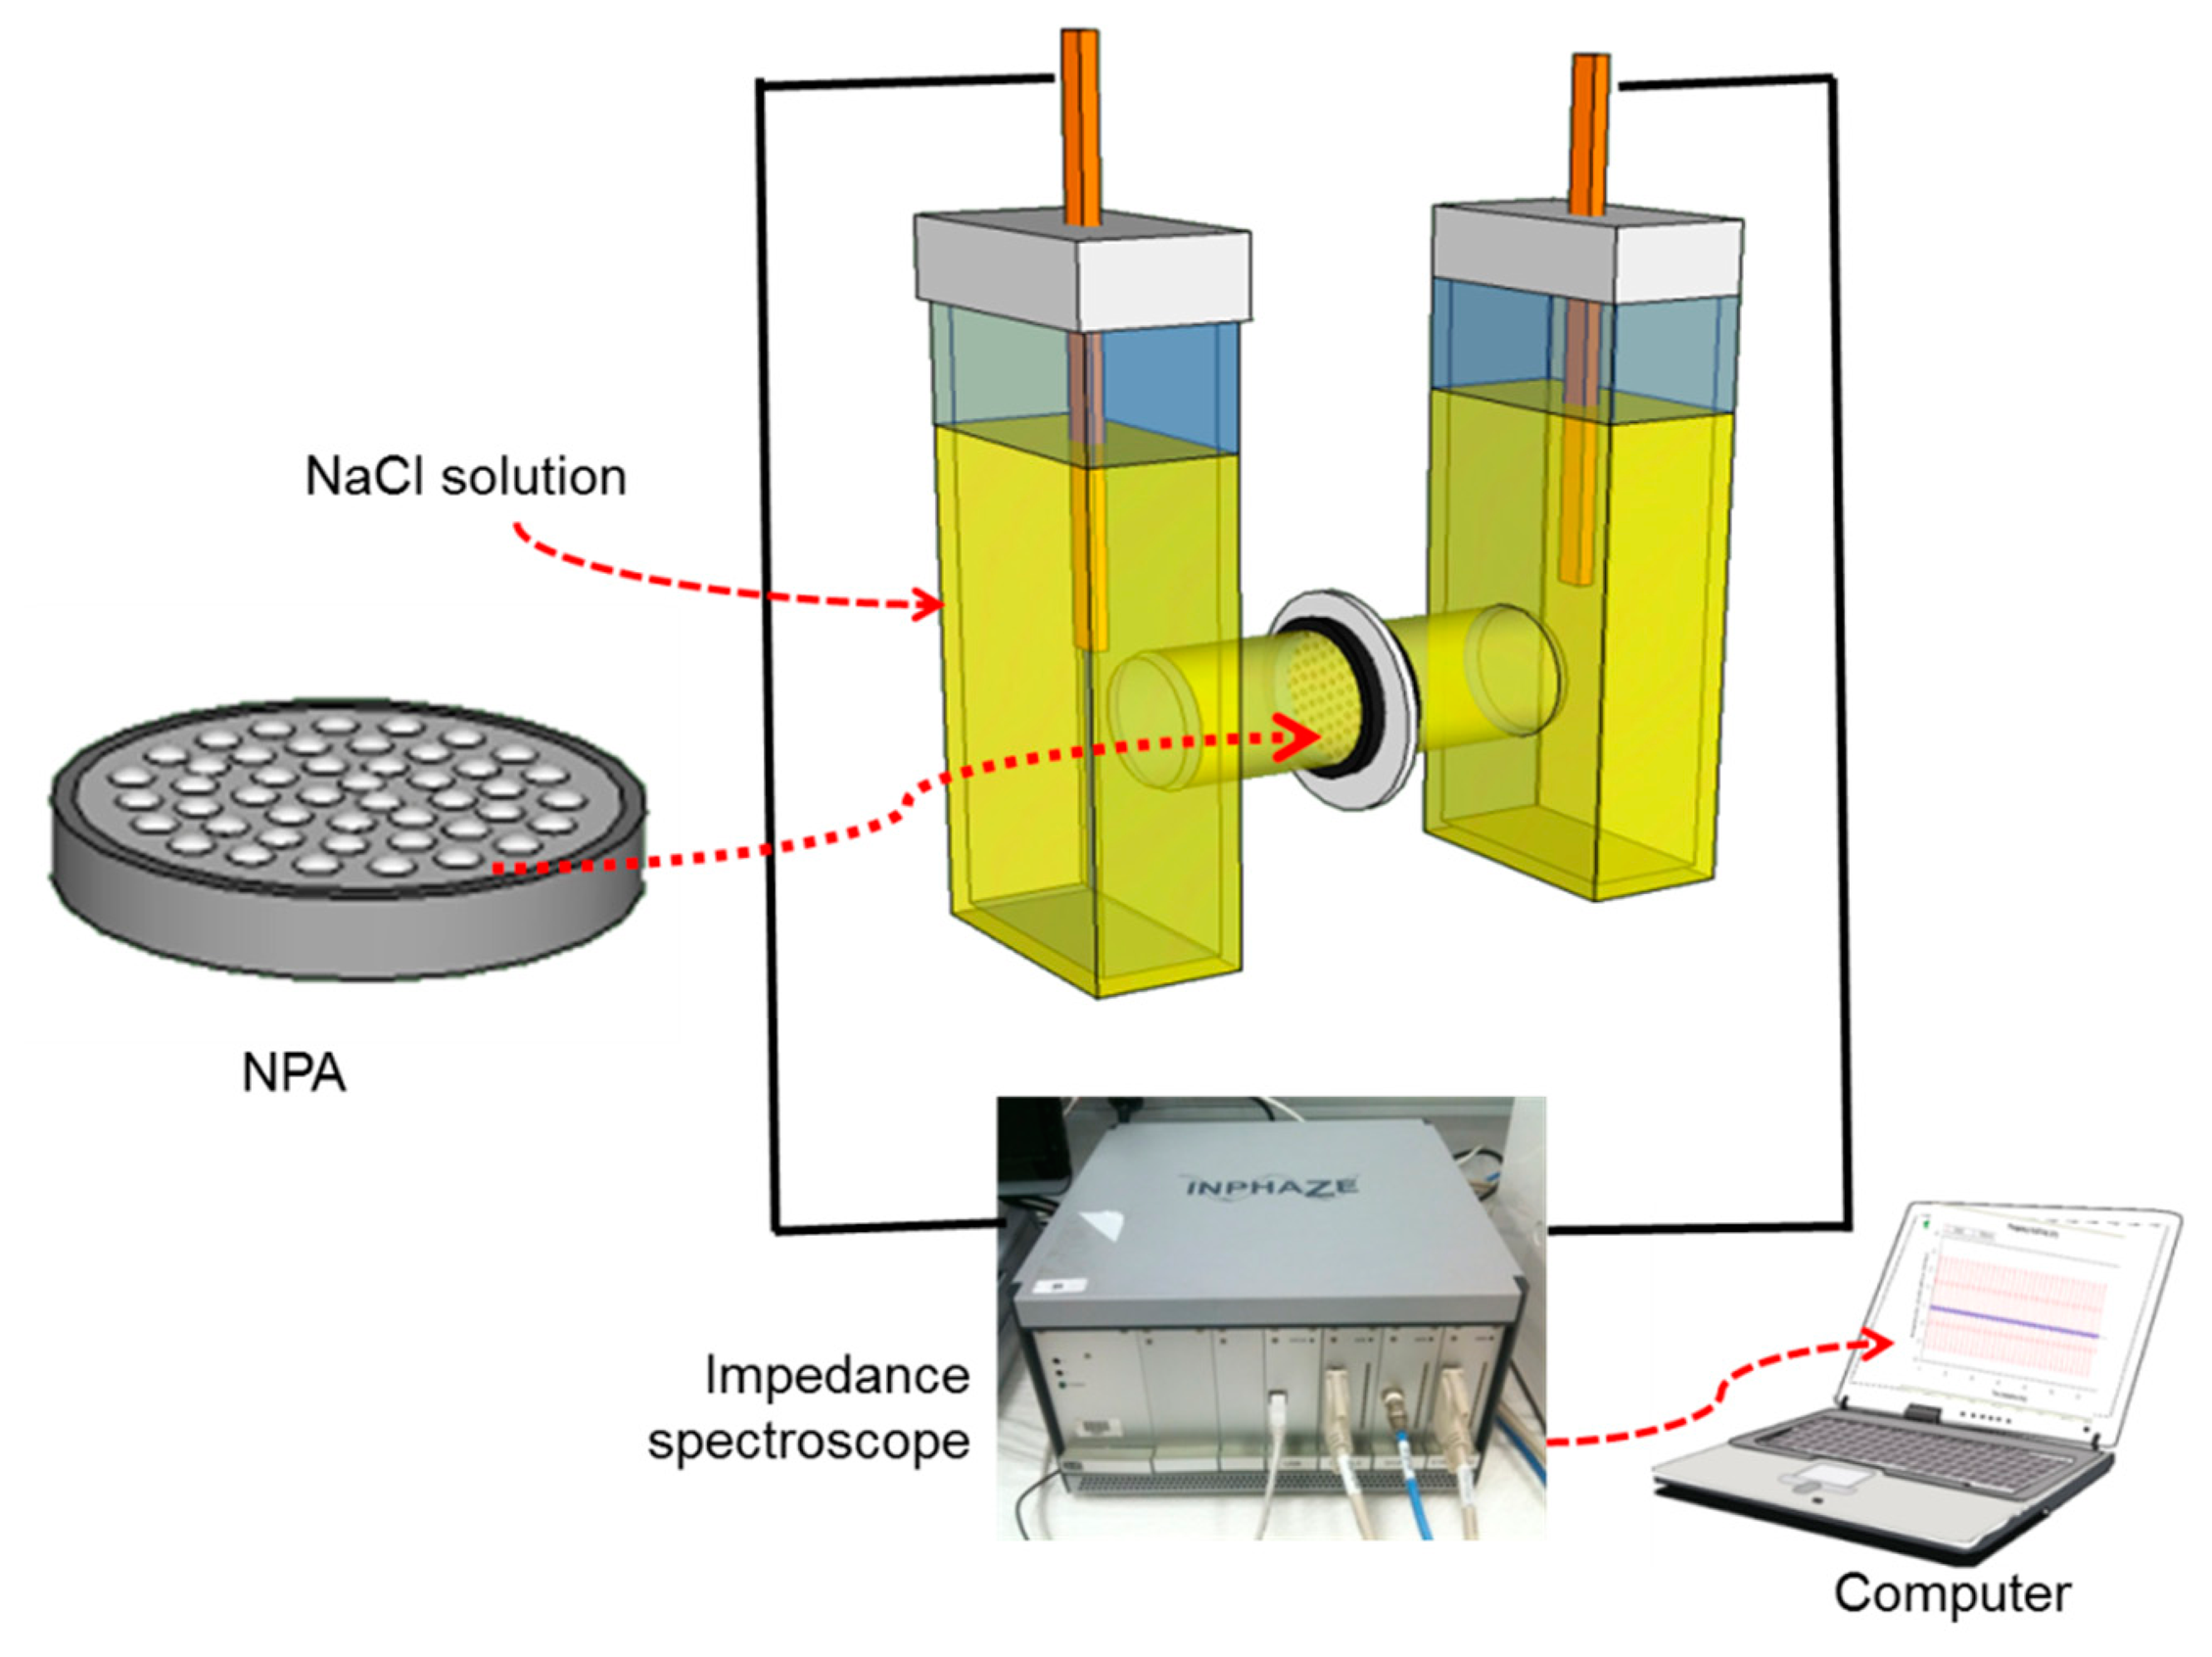
The scheme of the proposed impedance devices and the experimental setup is shown in Figure 1. The NPA membranes were sandwiched between two different cell chambers and impedance measurements were performed by EIS.
2.1. Preparation of NPA
NPA membranes were prepared by a two-step anodization process using 0.3 M oxalic acid as electrolyte at 0 °C as described elsewhere [14]. The first anodized porous layer was prepared at a voltage of 30–60 V for 2–4 h, and then removed using an oxide removal solution (0.2 M chromium trioxide and 0.4 M phosphoric acid) for 1–2 h at 60 °C. The second anodization was carried out in the range of 30 V to 70 V to achieve different pore diameters. Mild anodization at 30 V was used to get pore diameters of 25 ± 5 nm and hard anodization at 70 V for large pore diameter of 65 ± 5 nm was used. The length of NPA is controlled by the time duration of anodization. For mild anodization at 30 V it took 180 min to achieve a pore length about 4–5 μm. However for hard anodization at 70 V it took only 20 min to grow 4–5 μm long pores [23]. To prepare NPAs with different thicknesses or lengths (5–18 μm) of small diameter pores the anodization time was varied from 180 min to 720 min at 30 V. Once the anodization was complete, the remaining aluminum was removed from the backside of the nanopore array by using CuCl2/HCl to reveal a clear and clean barrier layer of the nanopore array. The removal of barrier layer from the pore structures was performed by using 10% phosphoric acid [24].
2.2. Photolithography on NPA
The fabricated NPA was patterned on the back side (barrier layer side) with a photoresist using photolithography to prepare a 20 × 20 μm2 area with the opened nanopore array. The photoresist (AZ1518, AZ Electronic Materials, Somerville, NJ, USA) was spin-coated (1500 rpm) over the bottom side of the NPA (barrier layer) and followed by baking of the sample at 100 °C for 50 s. A photo-mask (chrome-on-glass mask, Bandwidth Foundry, Eveleigh, Sydney, NSW, Australia) with a 20 μm2 diameter transparent region was used to mask the sample with exposure of 330 mJ/m2. The exposed photoresist was then removed by solvent. In this way an opening of a 20 × 20 μm2 square on the NPA from bottom side was obtained.
2.3. Electrochemical Measurements
The transport characteristics of the prepared NPA membrane are determined by the behaviour of the nanopores, which forms the basis of our analysis. It was assumed that the solutions just inside and outside the pore are in equilibrium at the respective pore ends. If diffusion layers exist at the membrane-solution interfaces, as in our case, the solutions just inside the pore must be in equilibrium with the solutions at the membrane-diffusion layer interfaces. Electrochemical measurements were carried out using an EIS spectrometer (Inphaze, Pty. Ltd., Sydney, Australia) with a two-electrode system which is specifically designed for EIS characterization of NPA [9]. Two gold electrodes formed the working and counter electrodes. The nanoporous array was sandwiched between two cell chambers filled with the electrolyte each side. The working and counter electrodes were respectively placed at the end of two chambers (Figure 1). The Nyquist plot is one of the ways used to reveal the presence of various elements and processes as it provides a direct view of the manner in which the real component of the impedance (inverse of the conductance) varies with the imaginary component at each frequency. An equivalent circuit is used to fit the experimental data with the theoretical model. This model assumes that there is no impedance contribution made from the limited diffusion of the ions. In practice, such contribution does exist but mainly influences the impedance characteristics within a very low frequency range [25,26]. The resistance of the area of membrane, which is covered with photoresist, is so high that it does not appear in the equivalent circuit model. The pore resistance Rp can be calculated as:
If the surface conduction of nanopore (Equation (4)) is combined with pore conductance, the total pore conductance can be calculated by the expression:
If the length L of the nanopore is large and the diameter is small the pore resistance (Rp) dominates the total conductance of nanopore where Ks is the surface conductivity and Kb is the bulk conductivity [33]. The increase in the impedance across the pore is approximately equal to the applied potential meaning that the potential drops at the electrode/solution interfaces are small. The applied potential and generated resistance at interface may not be same on both sides of the membrane. Rp is small if the conductivity of the electrolyte is high and if the pore channel is very short, Rp becomes small.
3. Results and Discussion
3.1. SEM Characterization of NPA Arrays
SEM images of the top surface of the prepared NPA sensing platform with different pore diameters are presented in Figure 2a–c. The images confirm the successful preparation of well-ordered nanopores with a diameter of 25 ± 2 nm, 45 ± 2 nm and 65 ± 2 nm, depending on the anodization conditions. To achieve three different pore diameters at constant pore length the anodization potential was tuned between 30 and 70 V with the anodization time; varied from 20 to 180 min. It is well known that pore diameter is determined by applied voltage during anodization and that the porosity (P) of the NPA can be estimated assuming an ideal hexagonal arrangement of the pores:
3.2. EIS Measurements on NPA Arrays: Influence of Ion Concentration
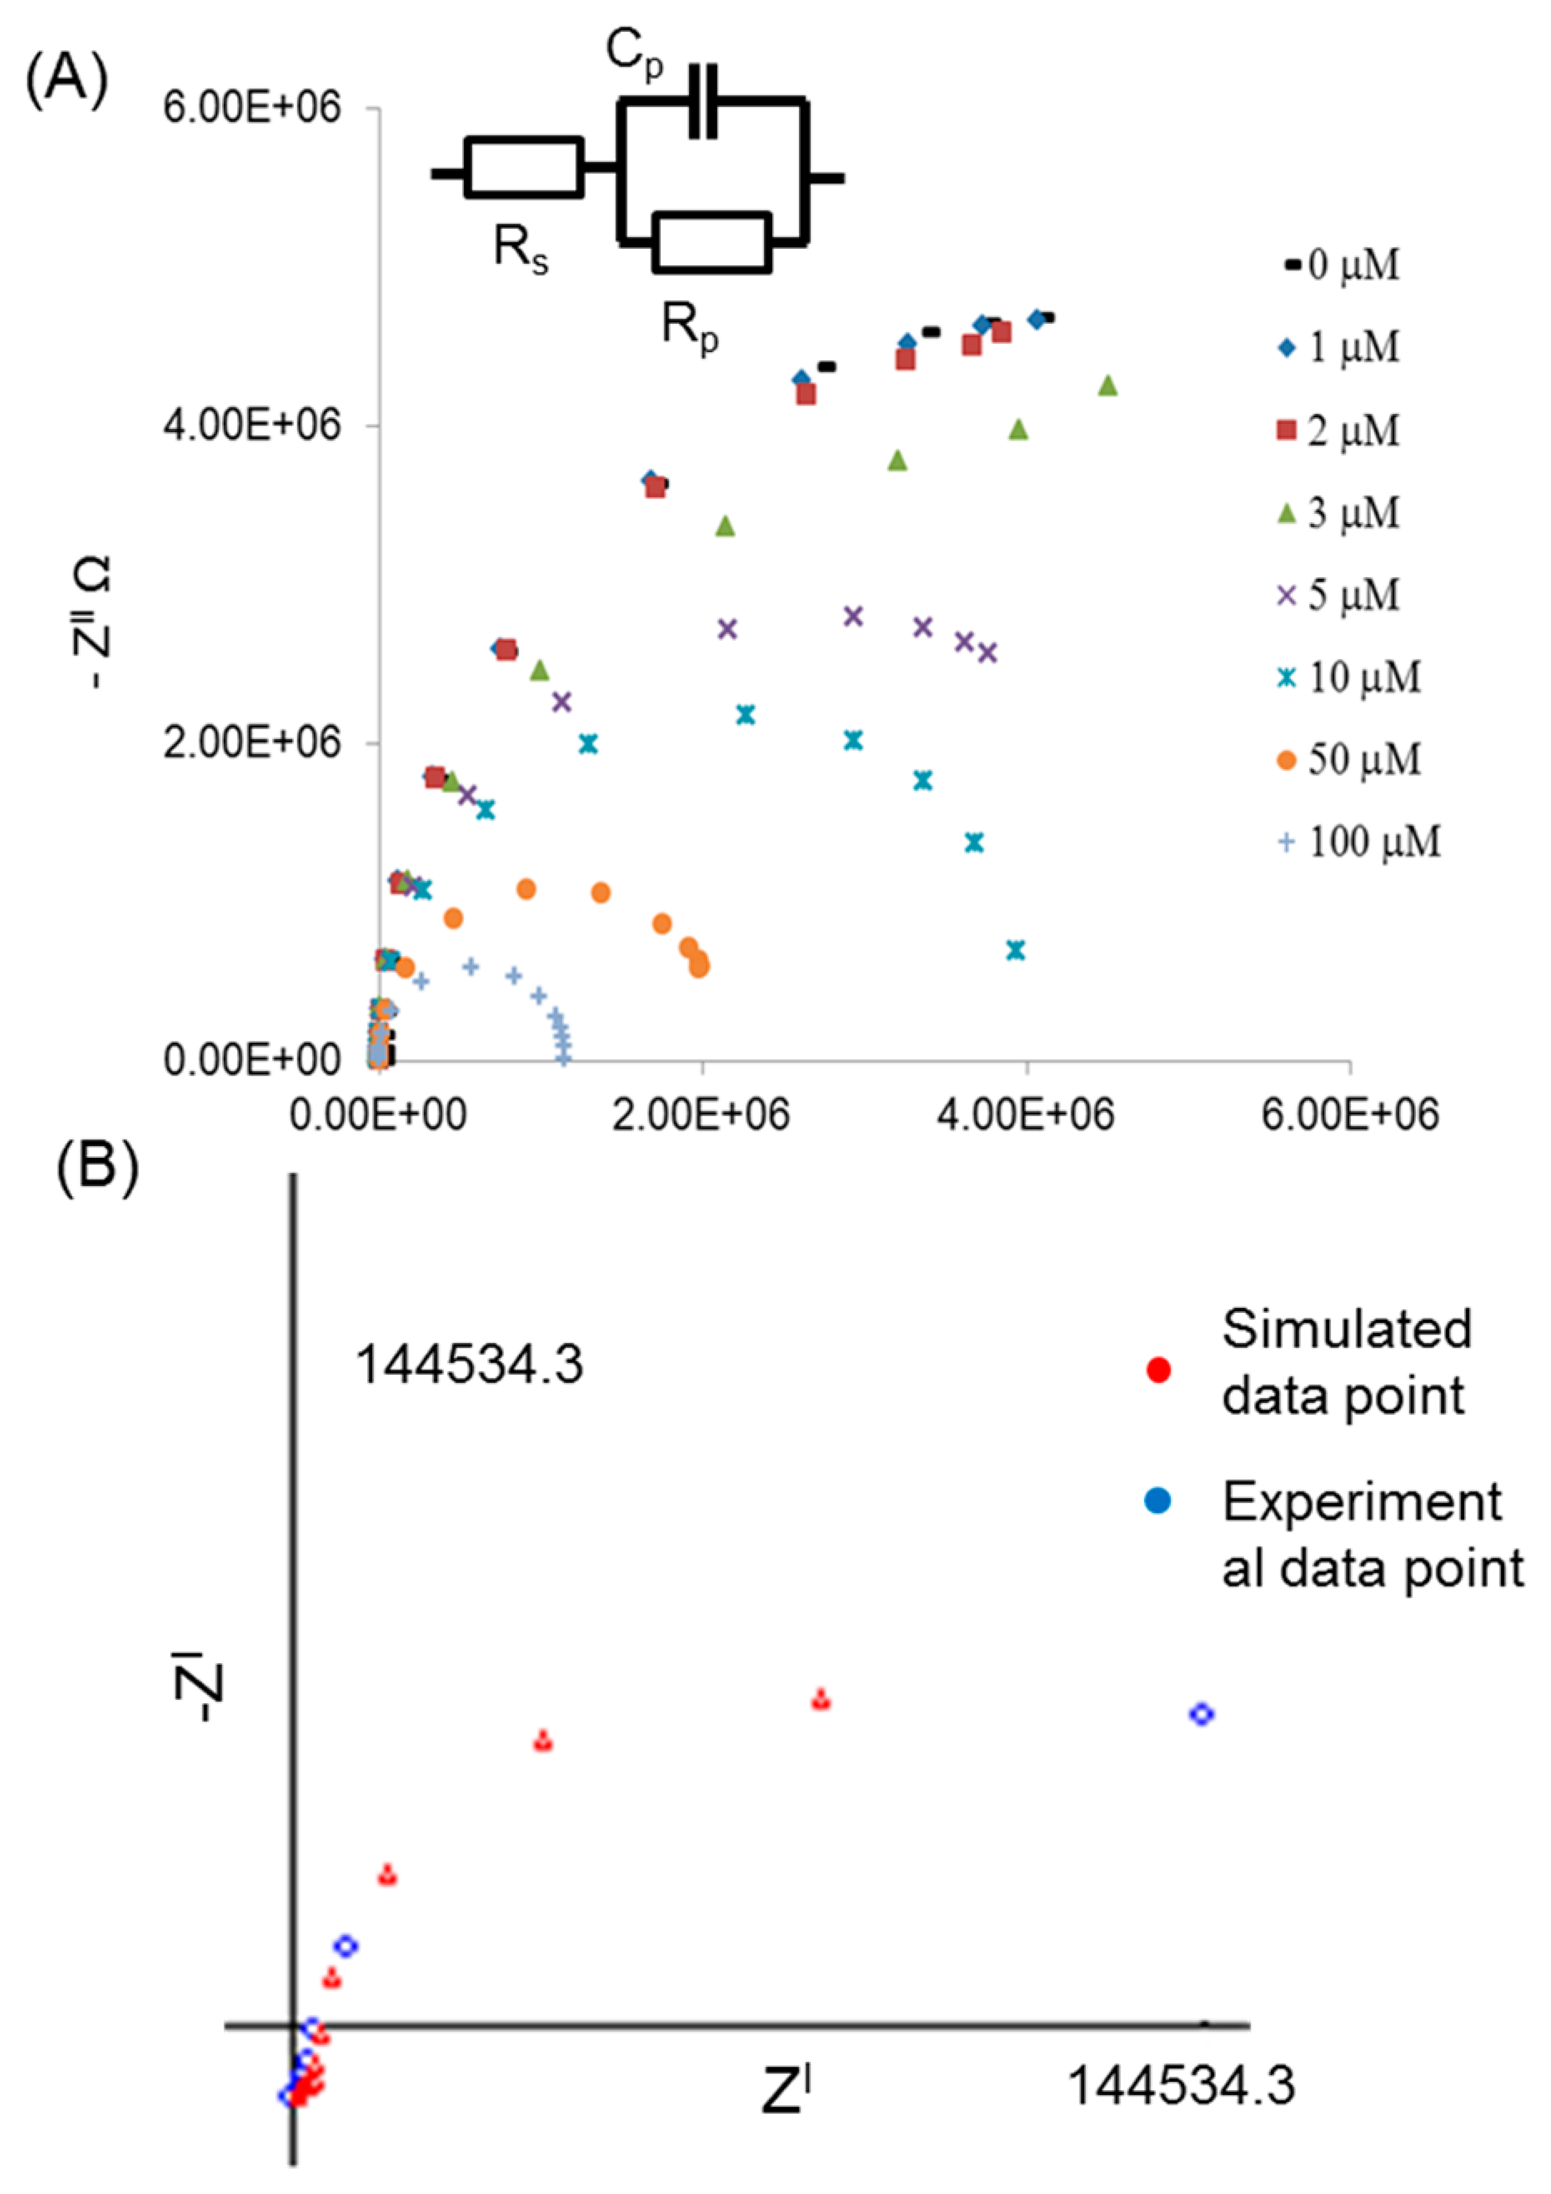
In order to characterize the performance of these NPA arrays and hence allow the optimization of the nanopore dimensions for sensing applications, a series of electrochemical impedance spectroscopy experiments were carried out [35,36]. In the first set of experiments, NPA arrays were characterized using NaCl electrolyte with concentrations ranging from 1 to 100 μM. The collected impedance (Z) data for the constant pore diameters using various concentration of NaCl are shown in Nyquist plots (Figure 3). The Nyquist plot consists of over lapping semicircles, each of which is associated with a single time constant element. The apex of the semicircle corresponds to the characteristic frequency of elements in the system. The decrease in the radius of the semicircle at high concentration is due to the diffusion of ions inside the nanopores and increase in the conductance of the nanopore array especially at the very high concentration. Surface conductivity, Ks, changes due to high concentration of ions at the end of the nanopore while bulk conductivity, Kb, has opposite impact on the system conductance and reduces the resistivity. The Nyquist plot provides a more immediate indication of the ion diffusion due to the concentration gradation. It reveals the effect of concentration on the conductivity of the NPA. The graphs show that Zl (real) decreased with increasing electrolytic concentration inside pores of NPA.
To estimate the impedance of the NPA, we modeled the experimental system using the EvolCRT software developed at the Department of Chemistry, Wuhan University (Wuhan, China) [37]. Here, Rs is resistance of the electrolyte solution; Rp and Cp are the total contribution of resistance and capacitance of alumina membranes (Figure 3a). The experimental data was simulated against the equivalent circuit to find out the exact value for the pore resistance (Rp). The Rp is a key parameter which is directly related to changes happening due to the diameter of nanopore. The wall thickness of NPA and available NaCl ions inside the nanopores generates an EDL on inner surface of nanopores which resulted in high impedance inside the nanopores. Therefore, RP is much larger than RS. It is also found that both RS and RP decrease with increasing concentration indicating that the nanopore resistance is a function of the electrolyte concentration inside the nanopore, so the high concentration ratio induced by the trans-membrane potential increases the mobility of the charged ions inside the nanopore resulting in a relatively lower electrolyte resistance [38].
3.3. EIS Measurements on NPA Arrays: Influence of Nanopore Diameters and Length
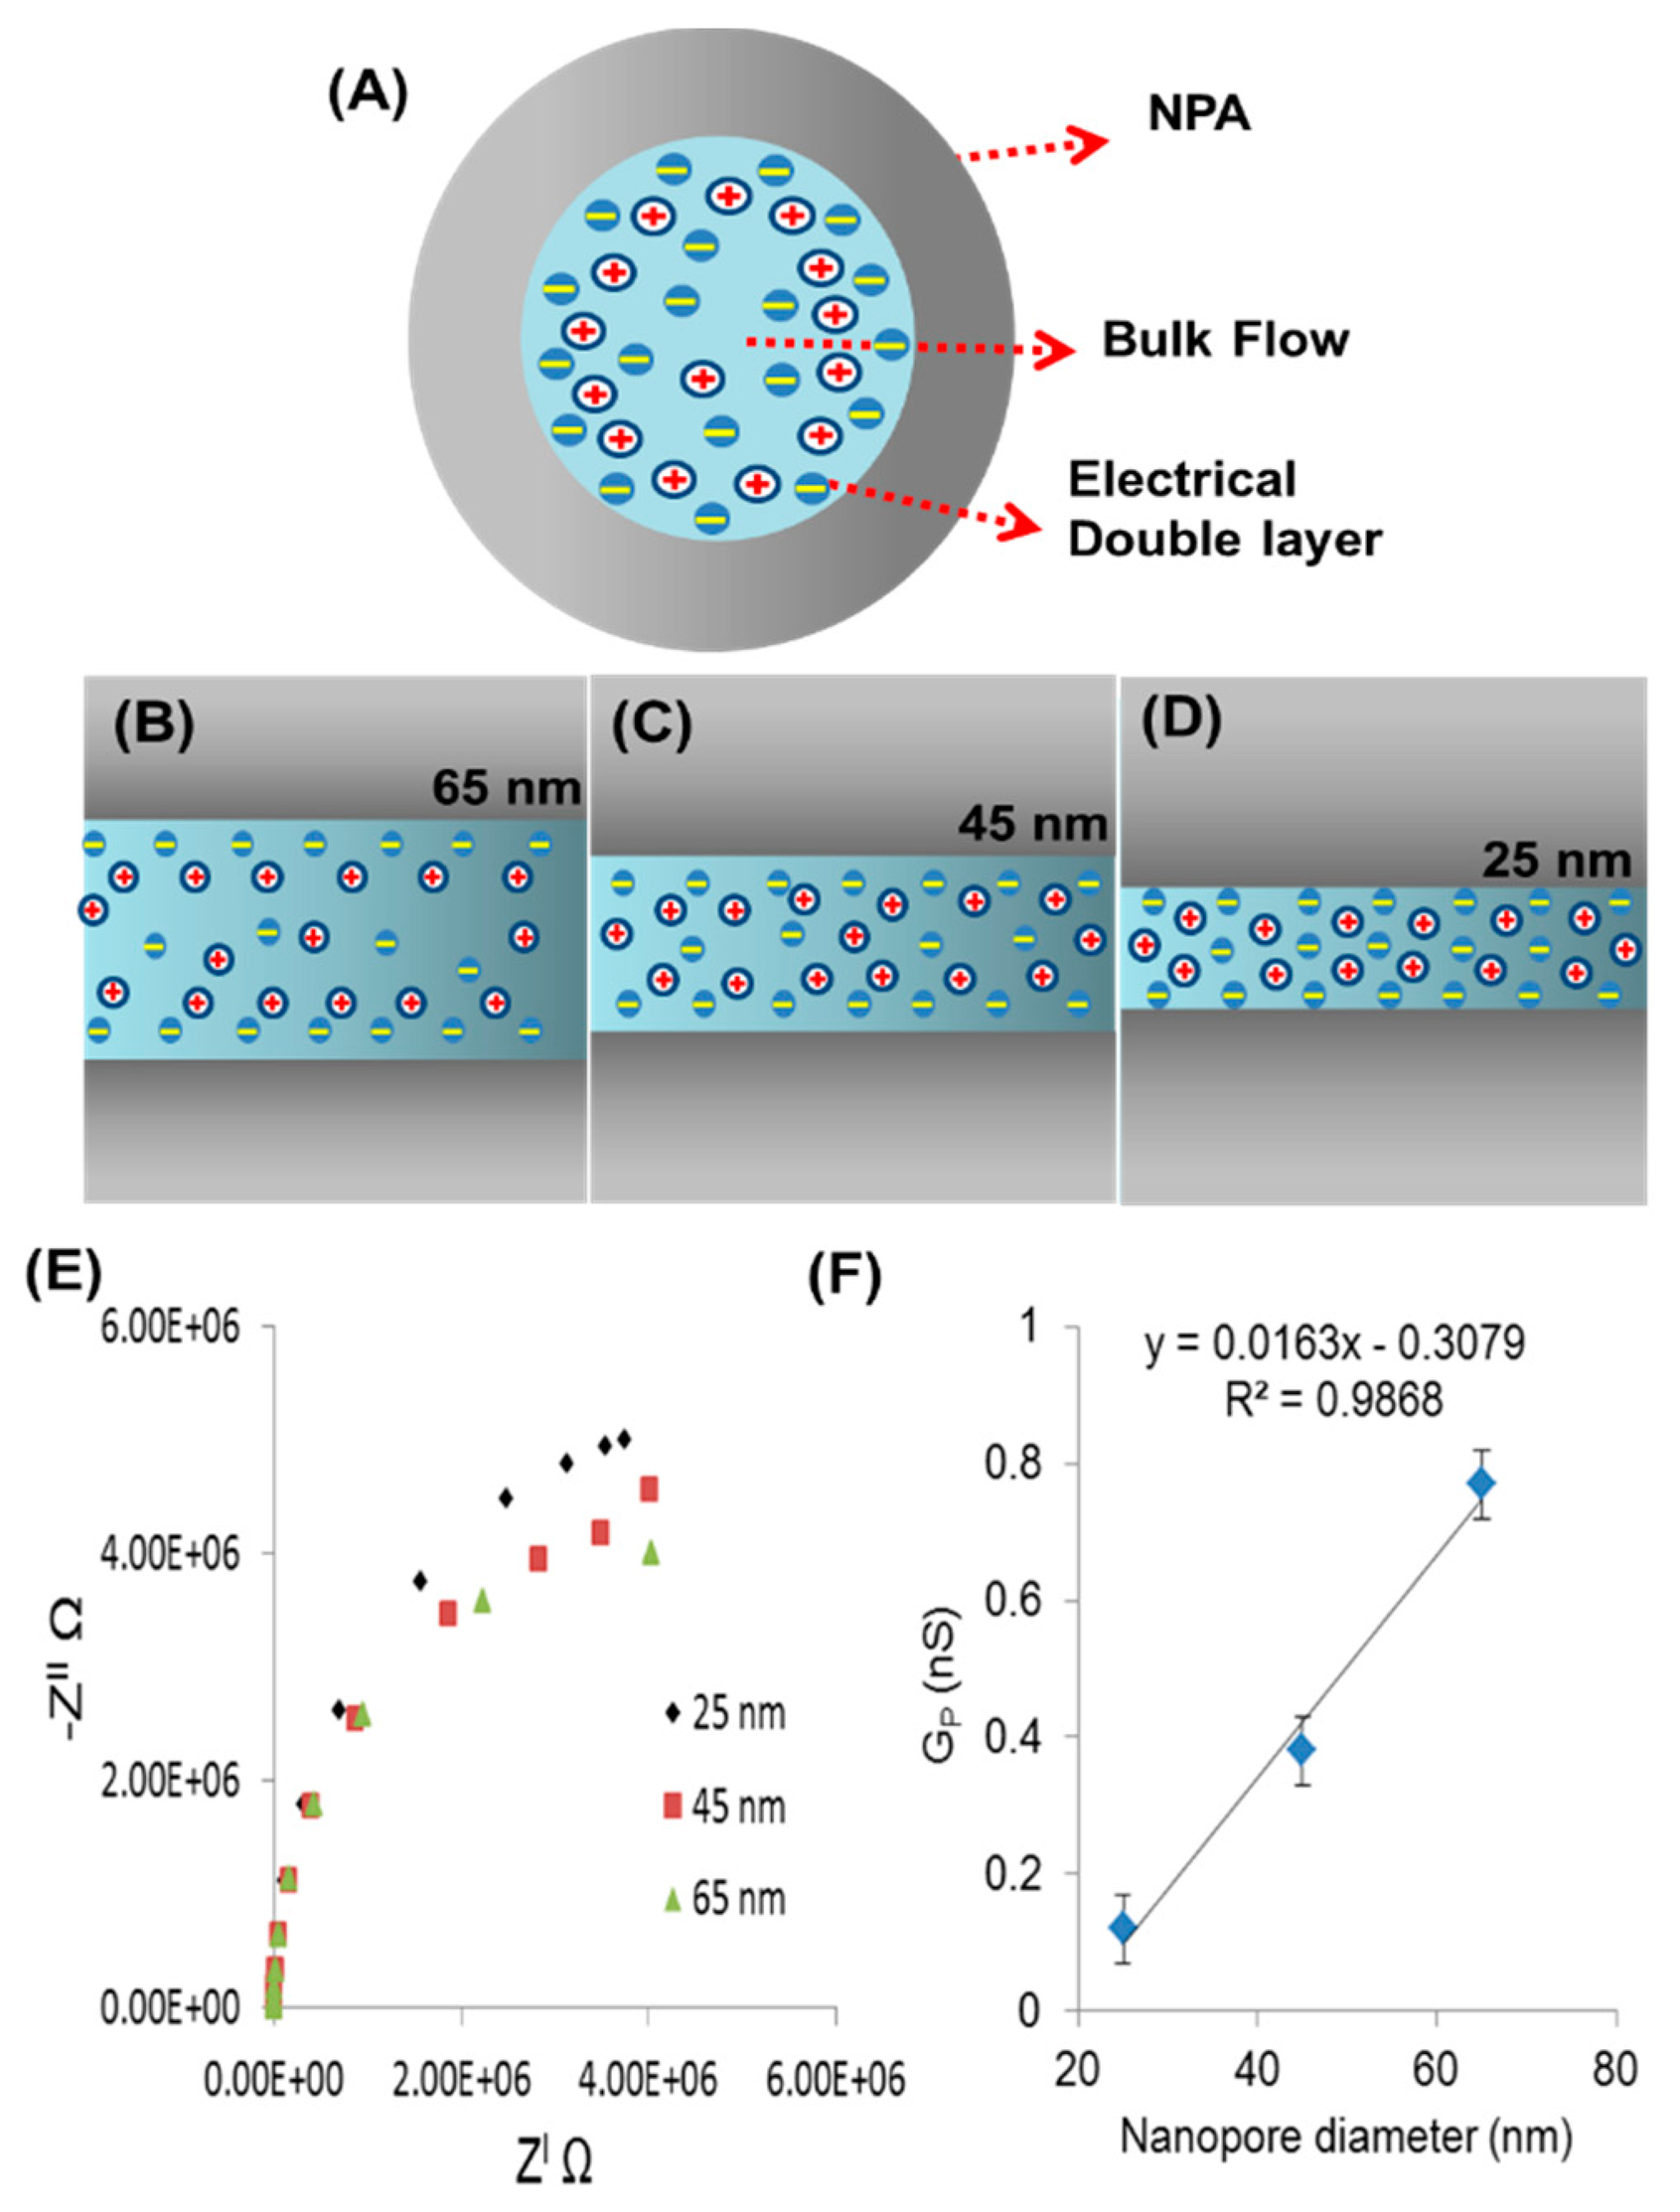
NPAs of three different pore diameters (25, 45, and 65 nm) were characterized using NaCl electrolyte. The collected impedance (Z) data for the various pore diameters using constant concentration of 1 μM NaCl is shown in Nyquist plots (Figure 4e). The values for Rp obtained after simulation with equivalent circuit shown in Figure 3a. The graph showing the influence of pore diameter on Rp. At the lowest concentration of electrolyte 1 μM, the pore resistance decreases from 5.61 × 10⁶ to 3.8 × 10⁶ Ω when the pore diameter is increased from 25 to 65 nm. For the large pore diameter, the impedance measurement is dominated by the bulk properties of the buffer solution (Figure 4a,b) and small changes in impedance due to effects at the walls of the nanopores become insignificant. The conductance of a nanopore (Gp) is also affected by the increase in the diameter of nanopore (Equation (3)) as the diameter is increasing (25, 45 and 65 nm) conductance increases (0.12, 0.38 and 0.77 nS), respectively (Figure 4f). The effect of electrical double layer depends on the electrolyte concentration and increases with decrease in electrolyte concentration. In case of large nanopores (65 nm) there is enough space for the ions to diffuse inside the nanopore so the electric double layer is not affecting system resistance. However, in the case of the smaller pores (Figure 4d), the electrical double layer (at the same concentration of electrolyte) formed on each side of the alumina wall is very close to each other and starts to effect ion movement inside the nanopore causing high resistance in the system. The relative surface effects are greater and the signal is affected significantly, as reported in previous studies [39–41]. The conclusion from this experiment is that the NPA with smaller nanopore diameter (25 nm) is comparatively more sensitive (∼120 Ω/μM) than the larger pores (∼45 Ω/μM), which was found over the lower range (1 μM to 50 μM) of concentration.
Since we observed that the smaller pore diameter provides greater sensitivity and performance, we used the 25 nm diameter pores to study the influence of pore length on electrochemical signal. For that purpose we fabricated NPA biosensing platforms with different pore lengths (4.5, 9, 13.5 and 18 μm) and carried out a series of EIS measurements at different concentrations of NaCl. The Nyquist plots generated at a constant concentration of electrolyte (1 μM) are shown in Figure 5a. The graph shows the trend of increasing impedance over the range of frequencies with respect to increasing pore length. The calculated Gp decreases (0.126, 0.062, 0.041 and 0.031 nS) with increasing nanopore length respectively (Figure 5b). Further measurements were performed by simulating the experimental data with the proposed equivalent circuit to find value of Rp for various length of NPA. It was found that Rp changes from 3.2 × 10⁶ to 5.32 × 10⁶ Ω as the length of NPA increases from 4.5 to 18 μm. The graph clearly shows the increase in the pore resistance with increasing the pore length. The characteristic saturation in signal was observed at higher concentration of electrolyte [42]. It was found that increasing the pore length beyond 10–15 μm lead to higher system resistances, as ion path will be longer inside nanopore and density of ion will not be in equilibrium at both ends of the nanopore. Increasing nanopore length to more than 10 to 15 μm will not be useful for biosensing detection where biomolecules need to diffuse through the nanopores [43].
It was observed that pore resistance is a key factor to be considered in the optimization of NPA performance by EIS. In our case the pore resistance with respect to lower concentration (1–10 μM) has a high sensitivity for small change in concentration of electrolyte. This behavior of NPA arrays is also limited with the morphology of nanopore array. A small nanopore diameter (below 20 nm) is also been effected by the electrical double layer and has a low conductance [44,45]. The detection limit for electrolyte using this system was 1 μM. However we believe a detection limit can be improved by lowering nanopore diameters (<25 nm). Nanopores with a diameter below 20 nm were difficult to make using the anodization conditions employed in our experiments (oxalic acid anodization), but the use of other electrolytes (i.e., sulphuric acid) will allow the production of systems with smaller pores. However, smaller nanopores may limit the diffusion of the ions and other molecules such as protein and enzymes. The best performance for the biosensing platform was observed with nanopore diameters of 20–40 nm and a length of 4–15 μm.
4. Conclusions
The EIS method was successfully applied to measure the impedance characteristics of NPA nanopore sensing platforms to explore the influence of the pore dimensions on their electrochemical properties. Our results confirmed that pore diameter and length have considerable influence on device performance where pore resistance is used as the sensing method. The results indicate that smaller pores provide increased sensitivity with optimal pore diameters in range of 20–40 nm. However, there is a limit for the pore size reduction down to sizes (<10 nm) comparable to the size of analyte molecules which will prevent diffusion molecules inside the pore. In terms of pore length, it was found that optimal lengths are in 5–15 μm range. Longer pores (>15 μm) are also not favorable for non-Faradic EIS detection as a result of higher nanopore impedance and long diffusion time of analyte molecules inside the nanopores. It is critical to optimize pore dimensions to achieve optimal performances of nanopore based electrochemical biosensing devices which have considerable potential toward the development simple and inexpensive sensing devices for broad biomedical applications.
Acknowledgments
The authors acknowledge the financial support of the Australian Research Council ((LP100100272), the University of Adelaide and Flinders University. This work is supported by Inphaze Pty. Ltd, Sydney, Australia and K. K. acknowledges their support for his PhD scholarship. Authors acknowledge support and help of Jingxian Yu with software and help to understand the impedance data. Authors also acknowledge support of South Australian node of the Australian National Fabrication Facility (ANFF), for getting the start-up award to use their clean room facility for lithography and Australian Microscopy and Microanalysis Research Facility (AMMRF) for their microscopic facilities at Adelaide Microscopy.
Author Contributions
Krishna Kant performed the experiments; processed the data and wrote the draft of paper, Dusan Losic designed experiment, helped for data analysis, paper writing and reviewing, Joe Shapter, and Craig Priest helped in paper writing, reviewing and editing.
Conflicts of Interest
The authors declare no conflict of interest.
References
- Ronkainen, N.J.; Halsall, H.B.; Heineman, W.R. Electrochemical biosensors. Chem. Soc. Rev 2010, 39, 1747–1763. [Google Scholar]
- Komarova, E.; Reber, K.; Aldissi, M.; Bogomolova, A. New multispecific array as a tool for electrochemical impedance spectroscopy-based biosensing. Biosens. Bioelectron 2010, 25, 1389–1394. [Google Scholar]
- Daniels, J.S.; Pourmand, N. Label-Free Impedance Biosensors: Opportunities and Challenges. Electroanalysis 2007, 19, 1239–1257. [Google Scholar]
- Chang, B.-Y.; Park, S.-M. Electrochemical Impedance Spectroscopy. Annu. Rev. Anal. Chem 2010, 3, 207–229. [Google Scholar]
- Pänke, O.; Balkenhohl, T.; Kafka, J.; Schäfer, D.; Lisdat, F. Impedance Spectroscopy and Biosensing. In Biosensing for the 21st Century; Renneberg, R., Lisdat, F., Eds.; Springer: Berlin/Heidelberg, Germany, 2008; Volume 109, pp. 195–237. [Google Scholar]
- Kim, J.; Gonzalez-Martin, A. Nanopore membrane-based electrochemical immunoassay. J. Solid State Electrochem 2009, 13, 1037–1042. [Google Scholar]
- Eftekhari, F.; Escobedo, C.; Ferreira, J.; Duan, X.; Girotto, E.M.; Brolo, A.G.; Gordon, R.; Sinton, D. Nanoholes as Nanochannels: Flow-through Plasmonic Sensing. Anal. Chem 2009, 81, 4308–4311. [Google Scholar]
- Yu, J.; Liu, Z.; Yang, M.; Mak, A. Nanoporous membrane-based cell chip for the study of anti-cancer drug effect of retinoic acid with impedance spectroscopy. Talanta 2009, 80, 189–194. [Google Scholar]
- Chilcott, T.C.; Guo, C. Impedance and dielectric characterizations of ionic partitioning in interfaces that membranous, biomimetic and gold surfaces form with electrolytes. Electrochim. Acta 2013, 98, 274–287. [Google Scholar]
- Reimhult, E.; Kumar, K. Membrane biosensor platforms using nano- and microporous supports. Trend. Biotechnol 2008, 26, 82–89. [Google Scholar]
- Park, J.-S.; Choi, J.-H.; Woo, J.-J.; Moon, S.-H. An electrical impedance spectroscopic (EIS) study on transport characteristics of ion-exchange membrane systems. J. Colloid Interface Sci 2006, 300, 655–662. [Google Scholar]
- Zhang, J.; Zhu, J. A novel amperometric biosensor based on gold nanoparticles-mesoporous silica composite for biosensing glucose. Sci. China Ser. B Chem 2009, 52, 815–820. [Google Scholar]
- Orazem, M.E.; Tribollet, B. An integrated approach to electrochemical impedance spectroscopy. Electrochim. Acta 2008, 53, 7360–7366. [Google Scholar]
- Masuda, H.; Fukuda, K. Ordered Metal Nanohole Arrays Made by a Two-Step Replication of Honeycomb Structures of Anodic Alumina. Science 1995, 268, 1466–1468. [Google Scholar]
- Prakash, S.; Yeom, J.; Jin, N.; Adesida, I.; Shannon, M.A. Characterization of ionic transport at the nanoscale. Proc. Inst. Mechan. Eng. Part N: J. Nanoeng. Nanosyst 2006, 220, 45–52. [Google Scholar]
- Römer, W.; Steinem, C. Impedance Analysis and Single-Channel Recordings on Nano-Black Lipid Membranes Based on Porous Alumina. Biophys. J 2004, 86, 955–965. [Google Scholar]
- Takhistov, P. Electrochemical synthesis and impedance characterization of nano-patterned biosensor substrate. Biosens. Bioelectron 2004, 19, 1445–1456. [Google Scholar]
- Potucek, R.K.; Rateick, R.G.; Birss, V.I. Impedance Characterization of Anodic Barrier Al Oxide Film Beneath Porous Oxide Layer. J. Electrochem. Soc 2006, 153, B304–B310. [Google Scholar]
- Herzog, G.; Arrigan, D.W.M. Electrochemical strategies for the label-free detection of amino acids, peptides and proteins. Analyst 2007, 132, 615–632. [Google Scholar]
- Li, S.-J.; Li, J.; Wang, K.; Wang, C.; Xu, J.-J.; Chen, H.-Y.; Xia, X.-H.; Huo, Q. A Nanochannel Array-Based Electrochemical Device for Quantitative Label-free DNA Analysis. ACS Nano 2010, 4, 6417–6424. [Google Scholar]
- Berdat, D.; Marin, A.; Herrera, F.; Gijs, M.A.M. DNA biosensor using fluorescence microscopy and impedance spectroscopy. Sens. Actuators B Chem 2006, 118, 53–59. [Google Scholar]
- Girginov, A.; Popova, A.; Kanazirski, I.; Zahariev, A. Characterization of complex anodic alumina films by electrochemical impedance spectroscopy. Thin Solid Films 2006, 515, 1548–1551. [Google Scholar]
- Losic, D.; Velleman, L.; Kant, K.; Kumeria, T.; Gulati, K.; Shapter, J.G.; Beattie, D.A.; Simovic, S. Self-ordering Electrochemistry: A Simple Approach for Engineering Nanopore and Nanotube Arrays for Emerging Applications*. Aust. J. Chem 2011, 64, 294–301. [Google Scholar]
- Lillo, M.; Losic, D. Pore opening detection for controlled dissolution of barrier oxide layer and fabrication of nanoporous alumina with through-hole morphology. J. Membr. Sci 2009, 327, 11–17. [Google Scholar]
- Yu, X.; Lv, R.; Ma, Z.; Liu, Z.; Hao, Y.; Li, Q.; Xu, D. An impedance array biosensor for detection of multiple antibody-antigen interactions. Analyst 2006, 131, 745–750. [Google Scholar]
- Lisdat, F.; Schäfer, D. The use of electrochemical impedance spectroscopy for biosensing. Anal Bioanal. Chem 2008, 391, 1555–1567. [Google Scholar]
- Hall, J.E. Access resistance of a small circular pore. J. General Phys 1975, 66, 531–532. [Google Scholar]
- Kowalczyk, S.W.; Grosberg, A.Y.; Rabin, Y.; Dekker, C. Modeling the conductance and DNA blockade of solid-state nanopores. Nanotechnology 2011, 22, 315101. [Google Scholar]
- Ho, C.; Qiao, R.; Heng, J.B.; Chatterjee, A.; Timp, R.J.; Aluru, N.R.; Timp, G. Electrolytic transport through a synthetic nanometer-diameter pore. Proc. Natl. Acad. Sci. USA 2005, 102, 10445–10450. [Google Scholar]
- Schoch, R.B.; van Lintel, H.; Renaud, P. Effect of the surface charge on ion transport through nanoslits. Phys. Fluids 2005, 17, 6. [Google Scholar]
- Bocquet, L.; Charlaix, E. Nanofluidics, from bulk to interfaces. Chem. Soc. Rev 2010, 39, 1073–1095. [Google Scholar]
- Hille, B. Pharmacological Modifications of the Sodium Channels of Frog Nerve. J. Gen. Physiol 1968, 51, 199–219. [Google Scholar]
- Lee, C.; Joly, L.; Siria, A.; Biance, A.-L.; Fulcrand, R.M.; Bocquet, L.R. Large apparent electric size of solid-state nanopores due to spatially extended surface conduction. Nano Lett 2012, 12, 4037–4044. [Google Scholar]
- Lee, W.; Ji, R.; Gösele, U.; Nielsch, K. Fast fabrication of long-range ordered porous alumina membranes by hard anodization. Nat. Mater 2006, 5, 741–747. [Google Scholar]
- Sim, L.N.; Wang, Z.J.; Gu, J.; Coster, H.G.L.; Fane, A.G. Detection of reverse osmosis membrane fouling with silica, bovine serum albumin and their mixture using in-situ electrical impedance spectroscopy. J. Membr. Sci 2013, 443, 45–53. [Google Scholar]
- Rai, V.; Deng, J.; Toh, C.-S. Electrochemical nanoporous alumina membrane-based label-free DNA biosensor for the detection of Legionella sp. Talanta 2012, 98, 112–117. [Google Scholar]
- Yu, J.; Cao, H.; He, Y. A new tree structure code for equivalent circuit and evolutionary estimation of parameters. Chemom. Intell. Lab. Syst 2007, 85, 27–39. [Google Scholar]
- Chien, M.-C.; Wang, G.-J.; Yu, M.-C. Nanopore Size Estimation by Electrochemical Impedance Spectroscopy Analysis. Jap. J. Appl. Phys 2008, 47, 7459. [Google Scholar]
- Kant, K.; Kurkuri, M.; Yu, J.; Shapter, J.G.; Priest, C.; Losic, D. Impedance spectroscopy study of nanopore arrays for biosensing applications. Sci. Adv. Mater 2014, 6, 1–7. [Google Scholar]
- Tsai, Y.-T.; Chang, K.; Wang, G.-J. Measurement and control of the ion diffusion coefficient in a nanochannel. Microsyst. Technol 2013, 19, 937–944. [Google Scholar]
- Khair, A.S.; Squires, T.M. Surprising consequences of ion conservation in electro-osmosis over a surface charge discontinuity. J. Fluid Mech 2008, 615, 323–334. [Google Scholar]
- Cheng, I.F.; Yang, H.-L.; Chung, C.-C.; Chang, H.-C. A Rapid Electrochemical Biosensor Based on an AC Electrokinetics Enhanced Immuno-reaction. Analyst 2013, 138, 4656–4662. [Google Scholar]
- Smeets, R.M.; Keyser, U.F.; Krapf, D.; Wu, M.-Y.; Dekker, N.H.; Dekker, C. Salt dependence of ion transport and DNA translocation through solid-state nanopores. Nano Lett 2006, 6, 89–95. [Google Scholar]
- Harrell, C.C.; Lee, S.B.; Martin, C.R. Synthetic Single-Nanopore and Nanotube Membranes. Anal. Chem 2003, 75, 6861–6867. [Google Scholar]
- Stein, D.; Kruithof, M.; Dekker, C. Surface-charge-governed ion transport in nanofluidic channels. Phys. Rev. Lett 2004, 93, 035901. [Google Scholar]


© 2014 by the authors; licensee MDPI, Basel, Switzerland. This article is an open access article distributed under the terms and conditions of the Creative Commons Attribution license (http://creativecommons.org/licenses/by/4.0/).
Share and Cite
Kant, K.; Priest, C.; Shapter, J.G.; Losic, D. The Influence of Nanopore Dimensions on the Electrochemical Properties of Nanopore Arrays Studied by Impedance Spectroscopy. Sensors 2014, 14, 21316-21328. https://doi.org/10.3390/s141121316
Kant K, Priest C, Shapter JG, Losic D. The Influence of Nanopore Dimensions on the Electrochemical Properties of Nanopore Arrays Studied by Impedance Spectroscopy. Sensors. 2014; 14(11):21316-21328. https://doi.org/10.3390/s141121316
Chicago/Turabian StyleKant, Krishna, Craig Priest, Joe G. Shapter, and Dusan Losic. 2014. "The Influence of Nanopore Dimensions on the Electrochemical Properties of Nanopore Arrays Studied by Impedance Spectroscopy" Sensors 14, no. 11: 21316-21328. https://doi.org/10.3390/s141121316