
Comparison of the Detection Characteristics of Trace Species Using Laser-Induced Breakdown Spectroscopy and Laser Breakdown Time-of-Flight Mass Spectrometry

Abstract
:1. Introduction
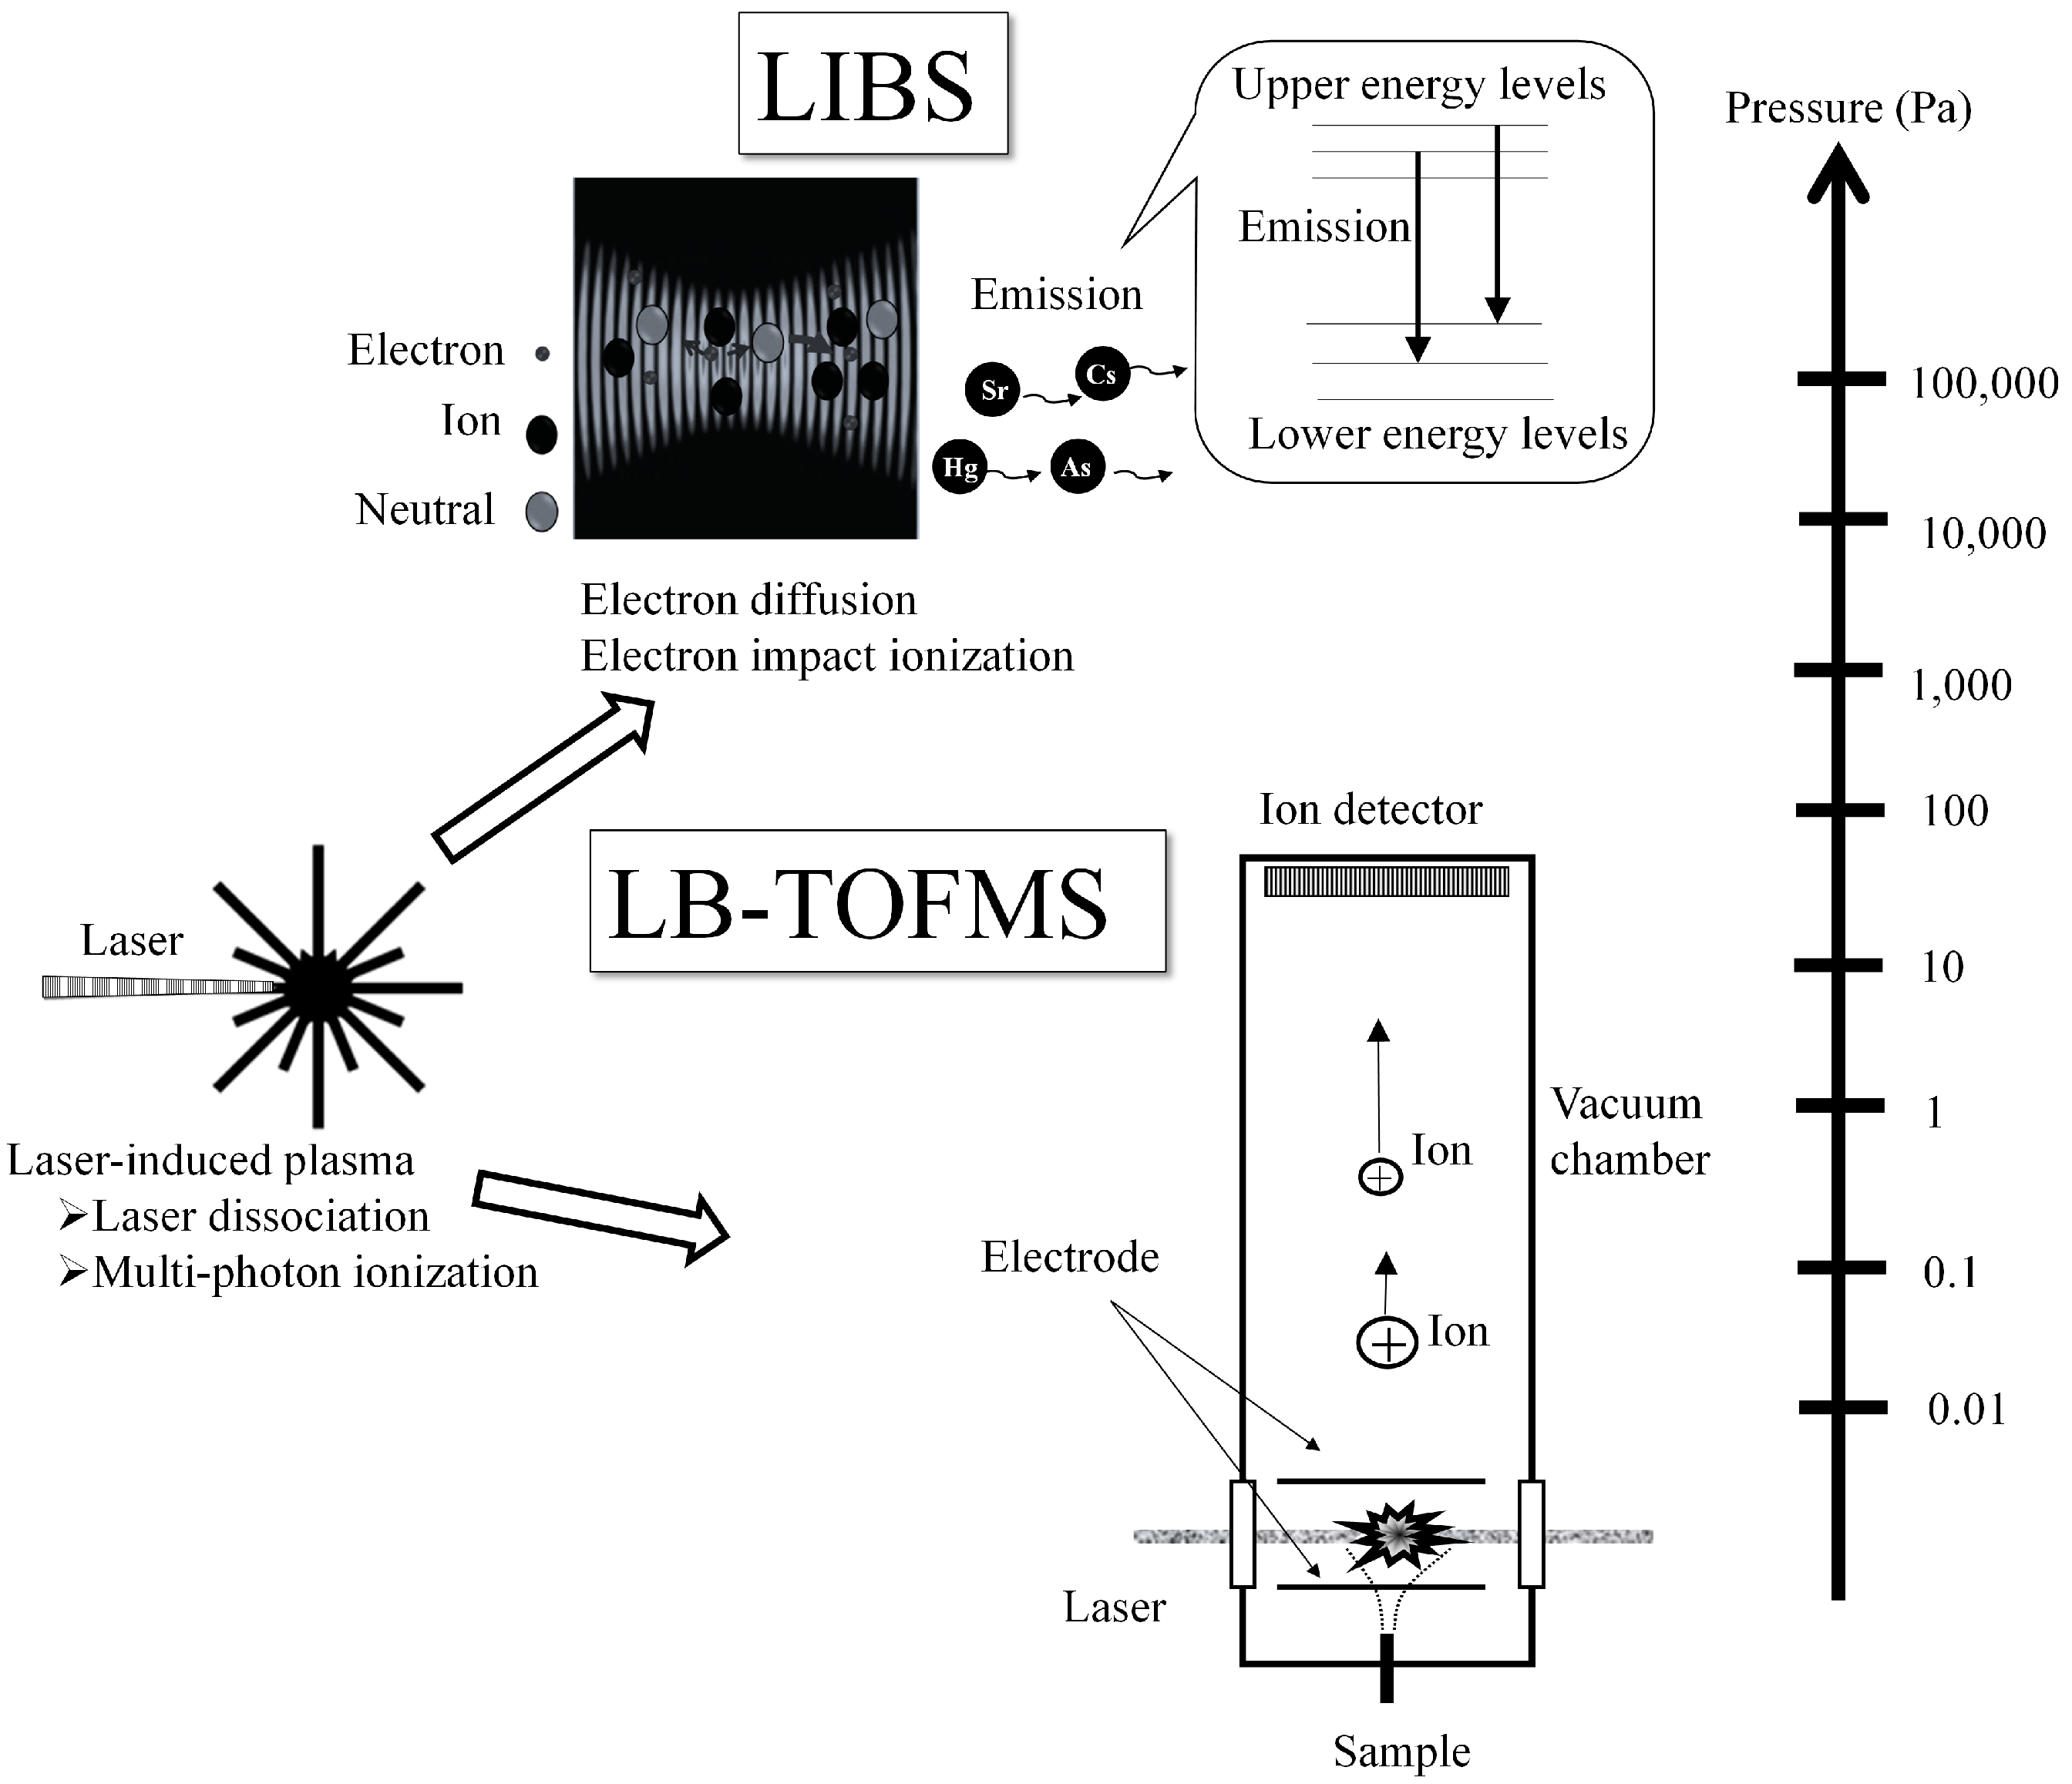
2. Theory


| Parameter | Significant Influence | |||
|---|---|---|---|---|
| LIBS | LB-TOFMS | |||
| Physical | Effect | Physical | Effect | |
| Pressure | (2) | Plasma temperature | --- | Ion number density |
| continuum emission | ||||
| Laser power | (2) | Plasma temperature | (3) | Ion number density |
| Ionization and excitation | ||||
| Delay time | --- | Plasma temperature | --- | --- |
| Wavelength | (1) | Ionization and excitation | (1) | Ionization |
| Pulse width | (1), (2) | Ionization and excitation | (1) | Ionization |
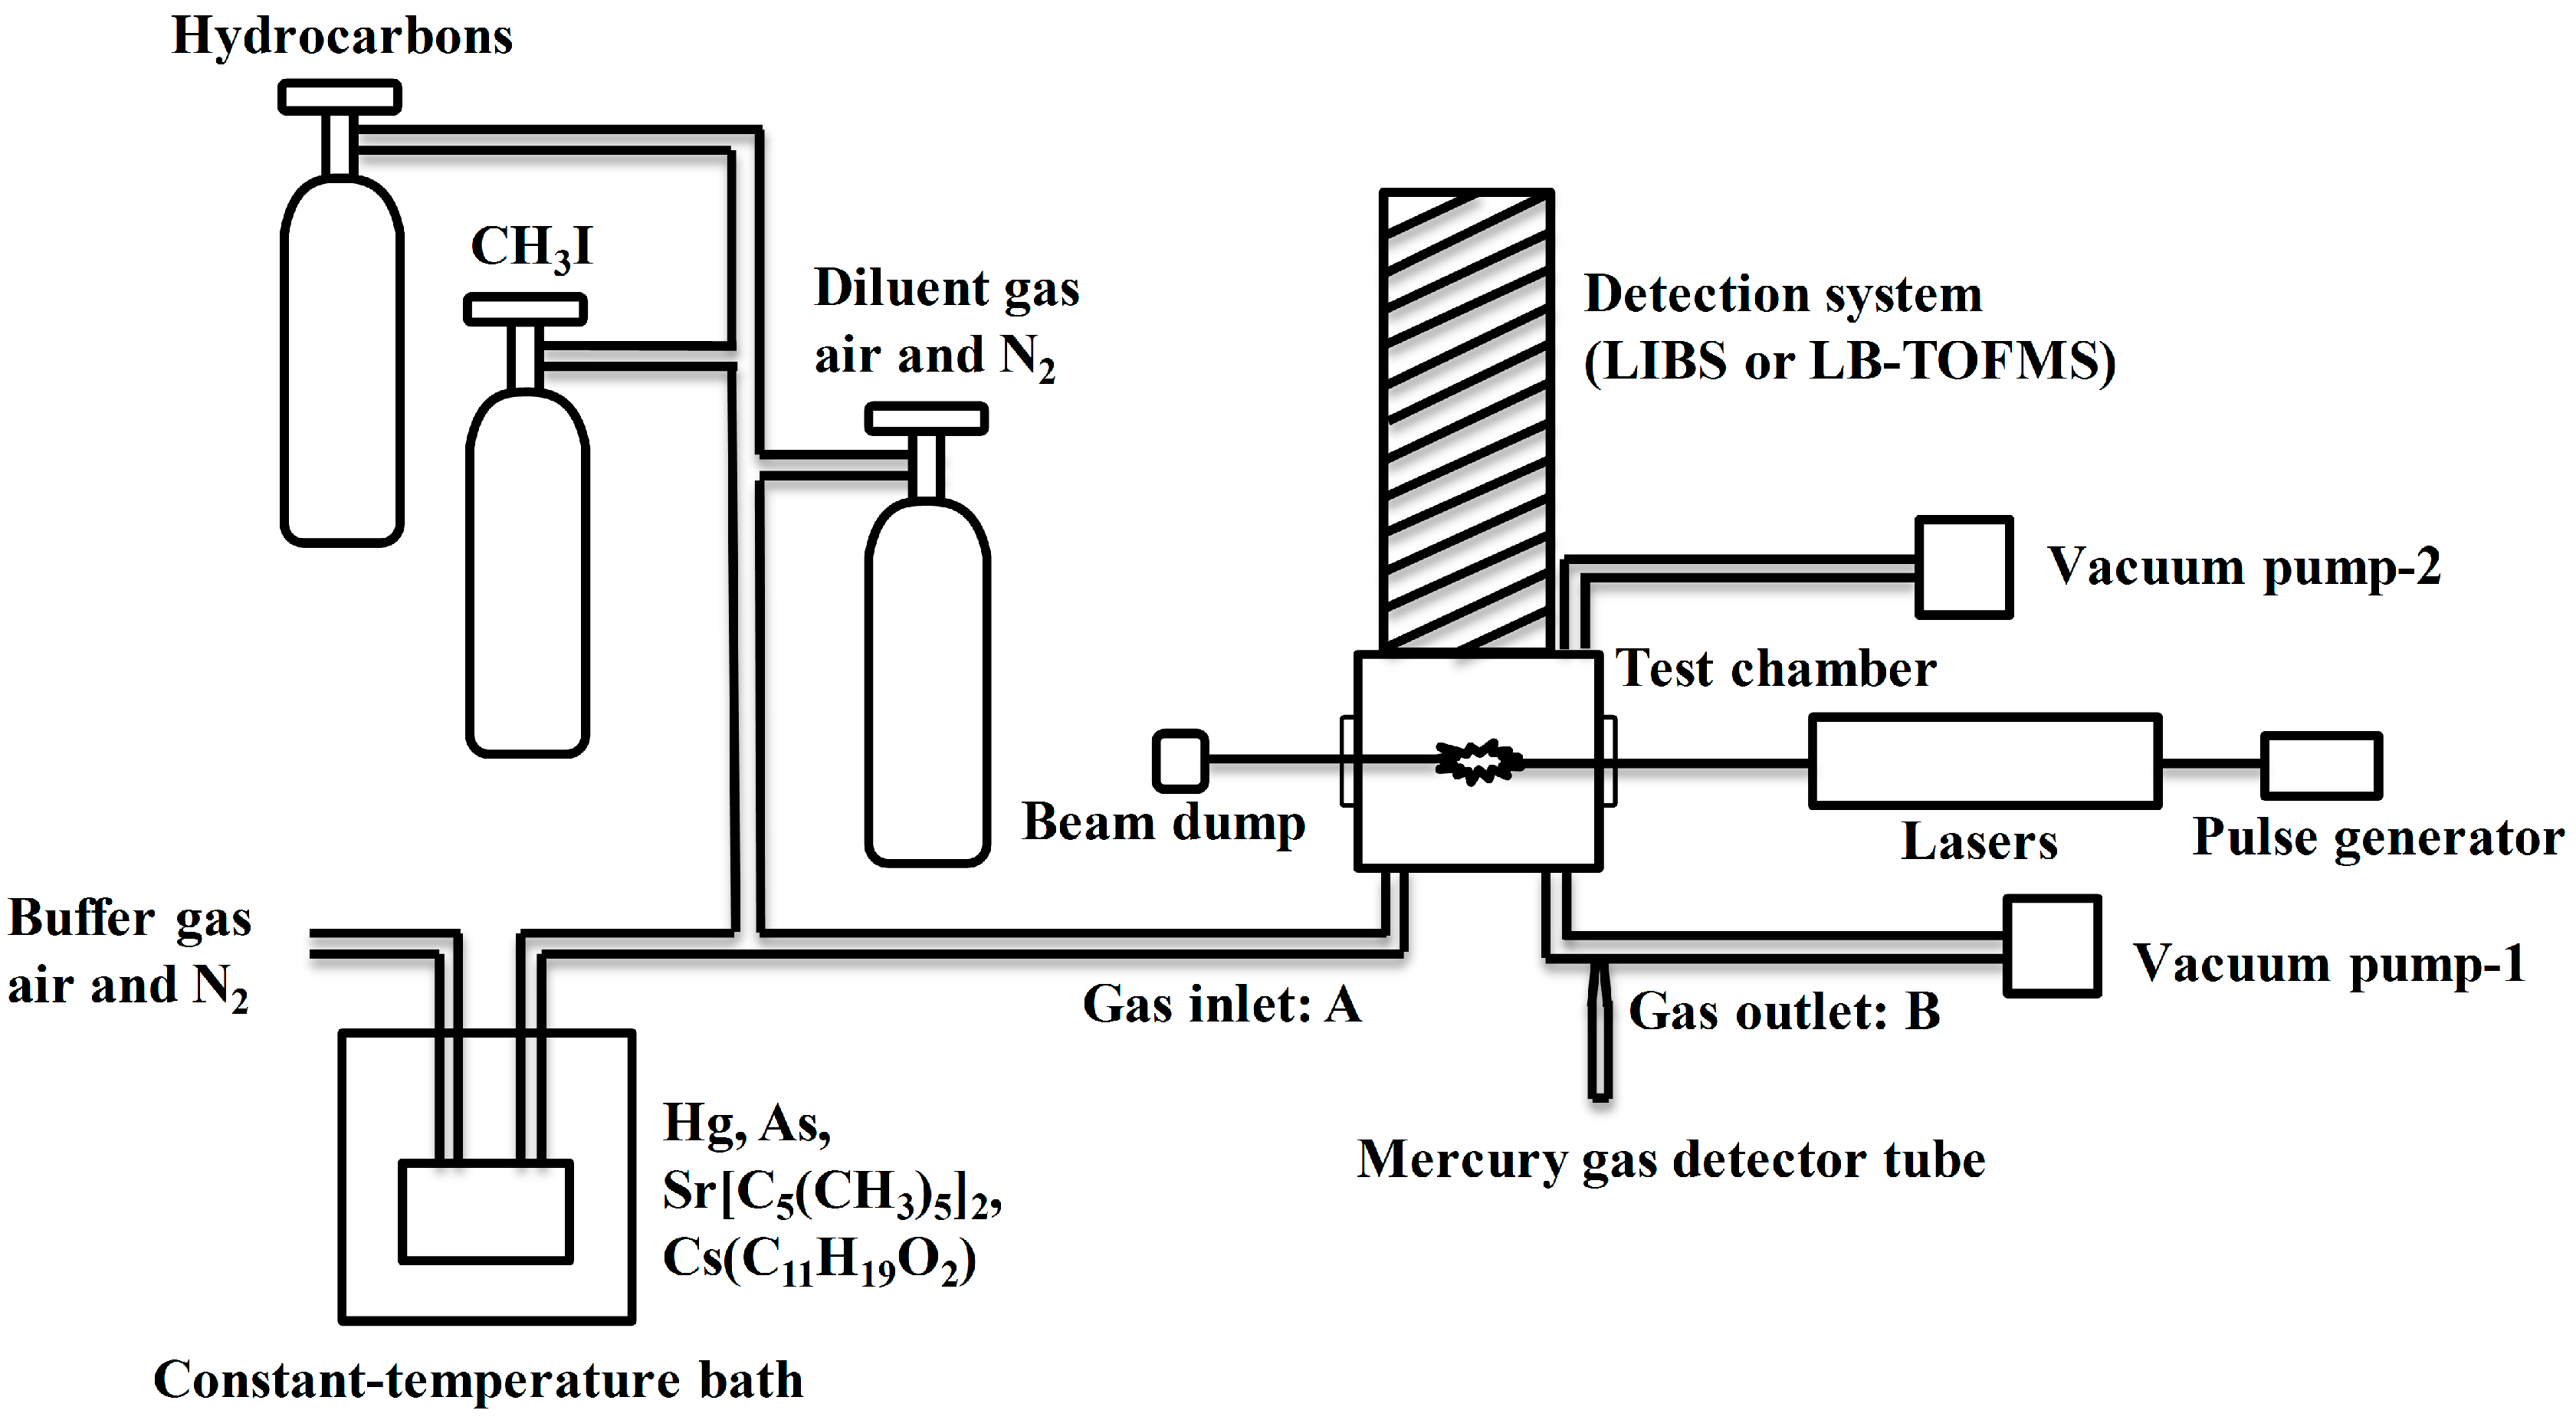
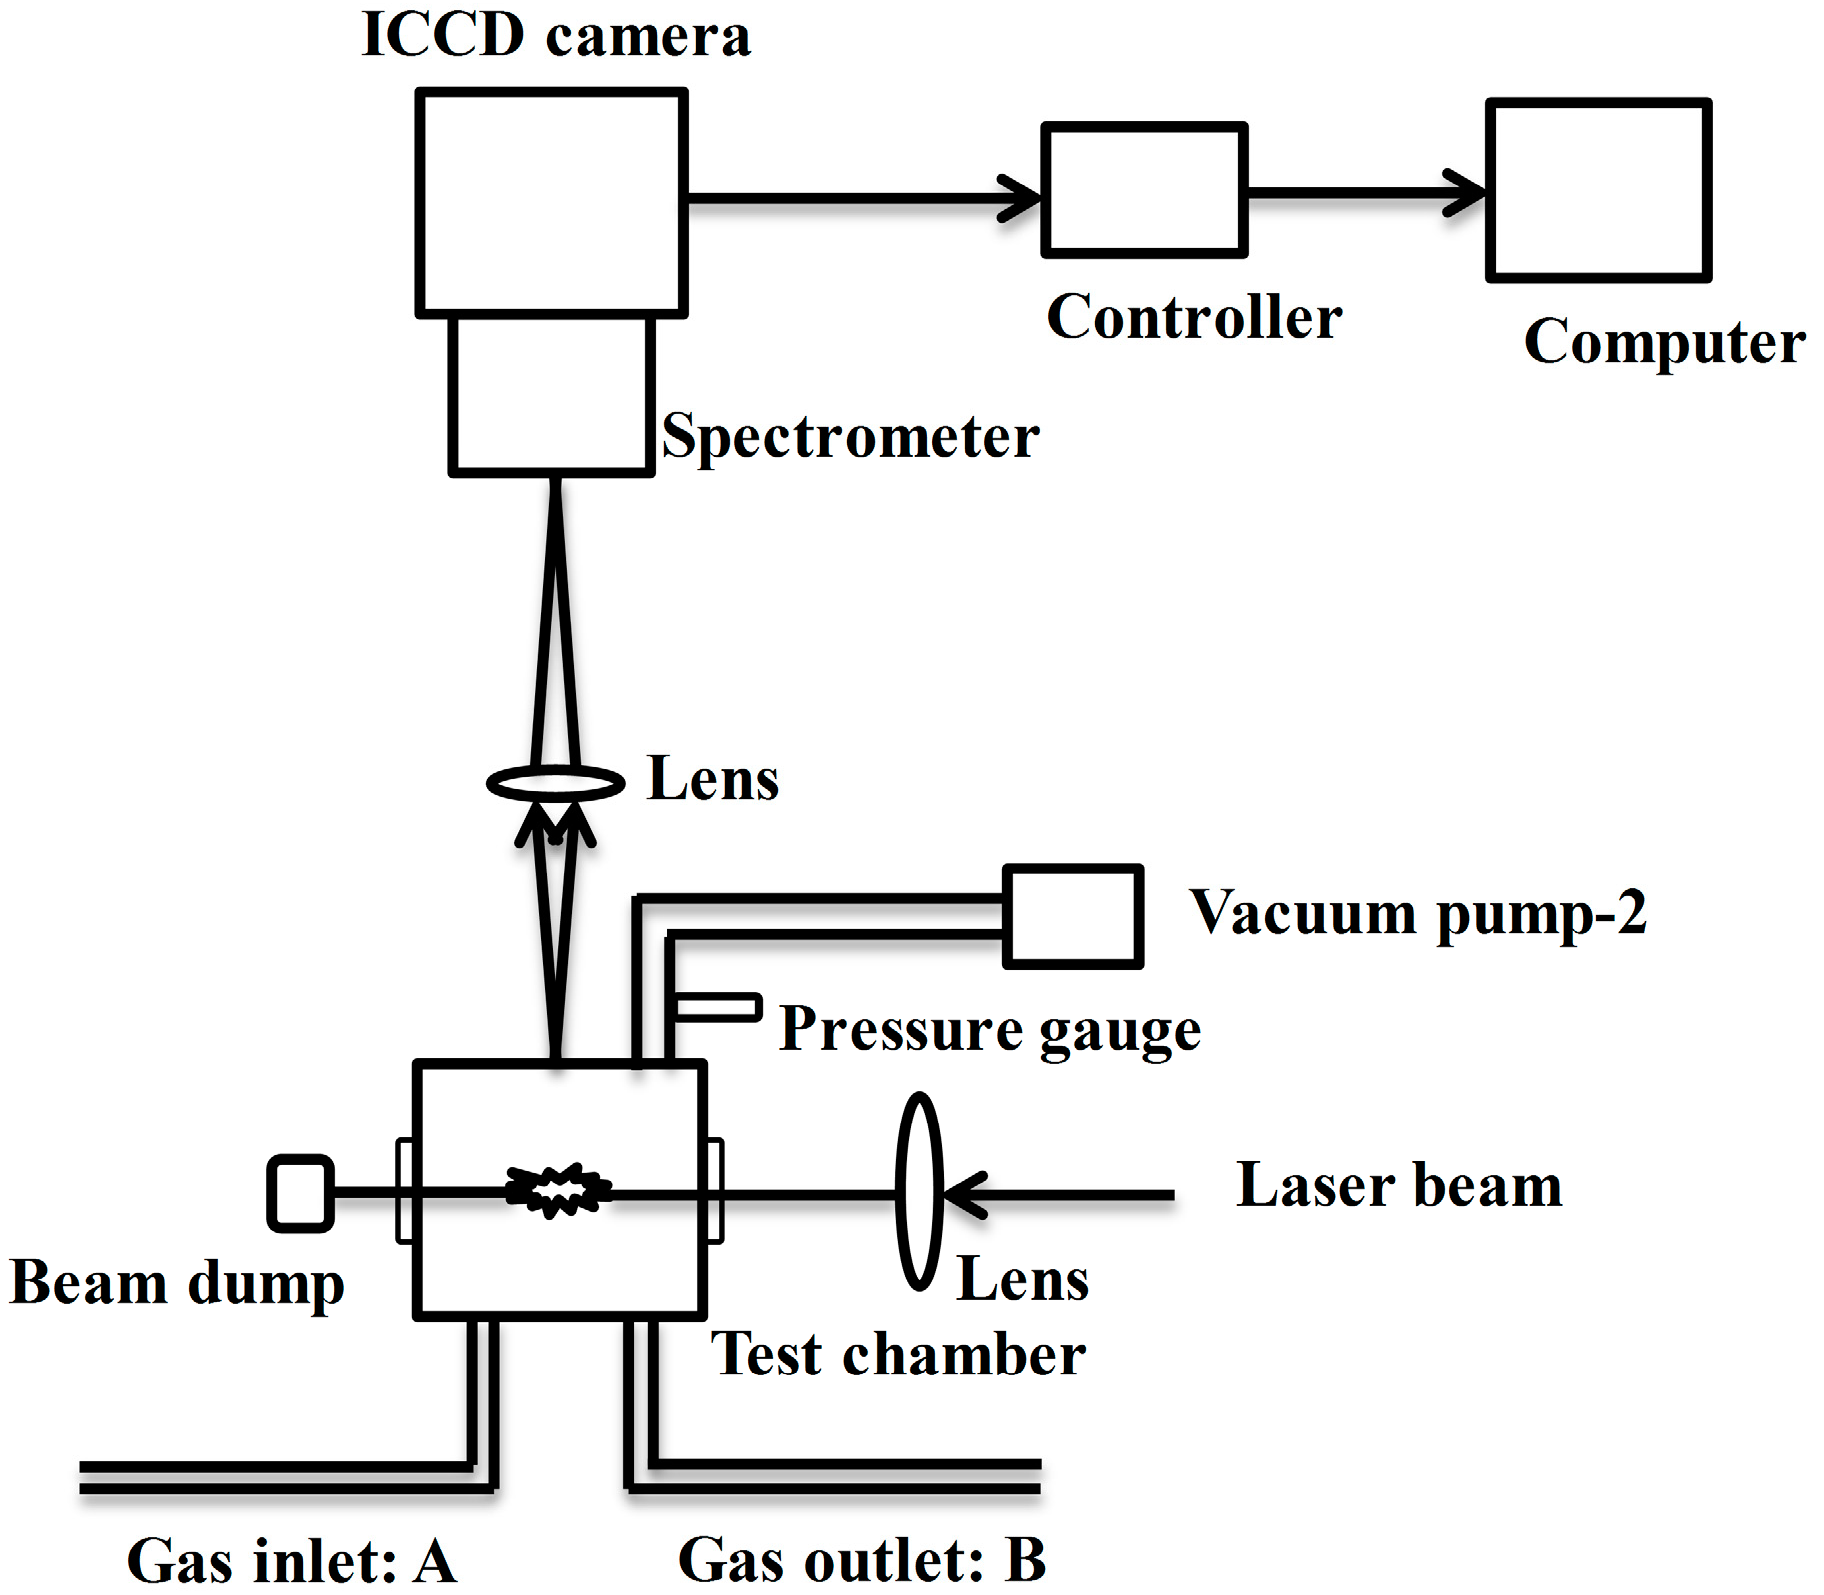
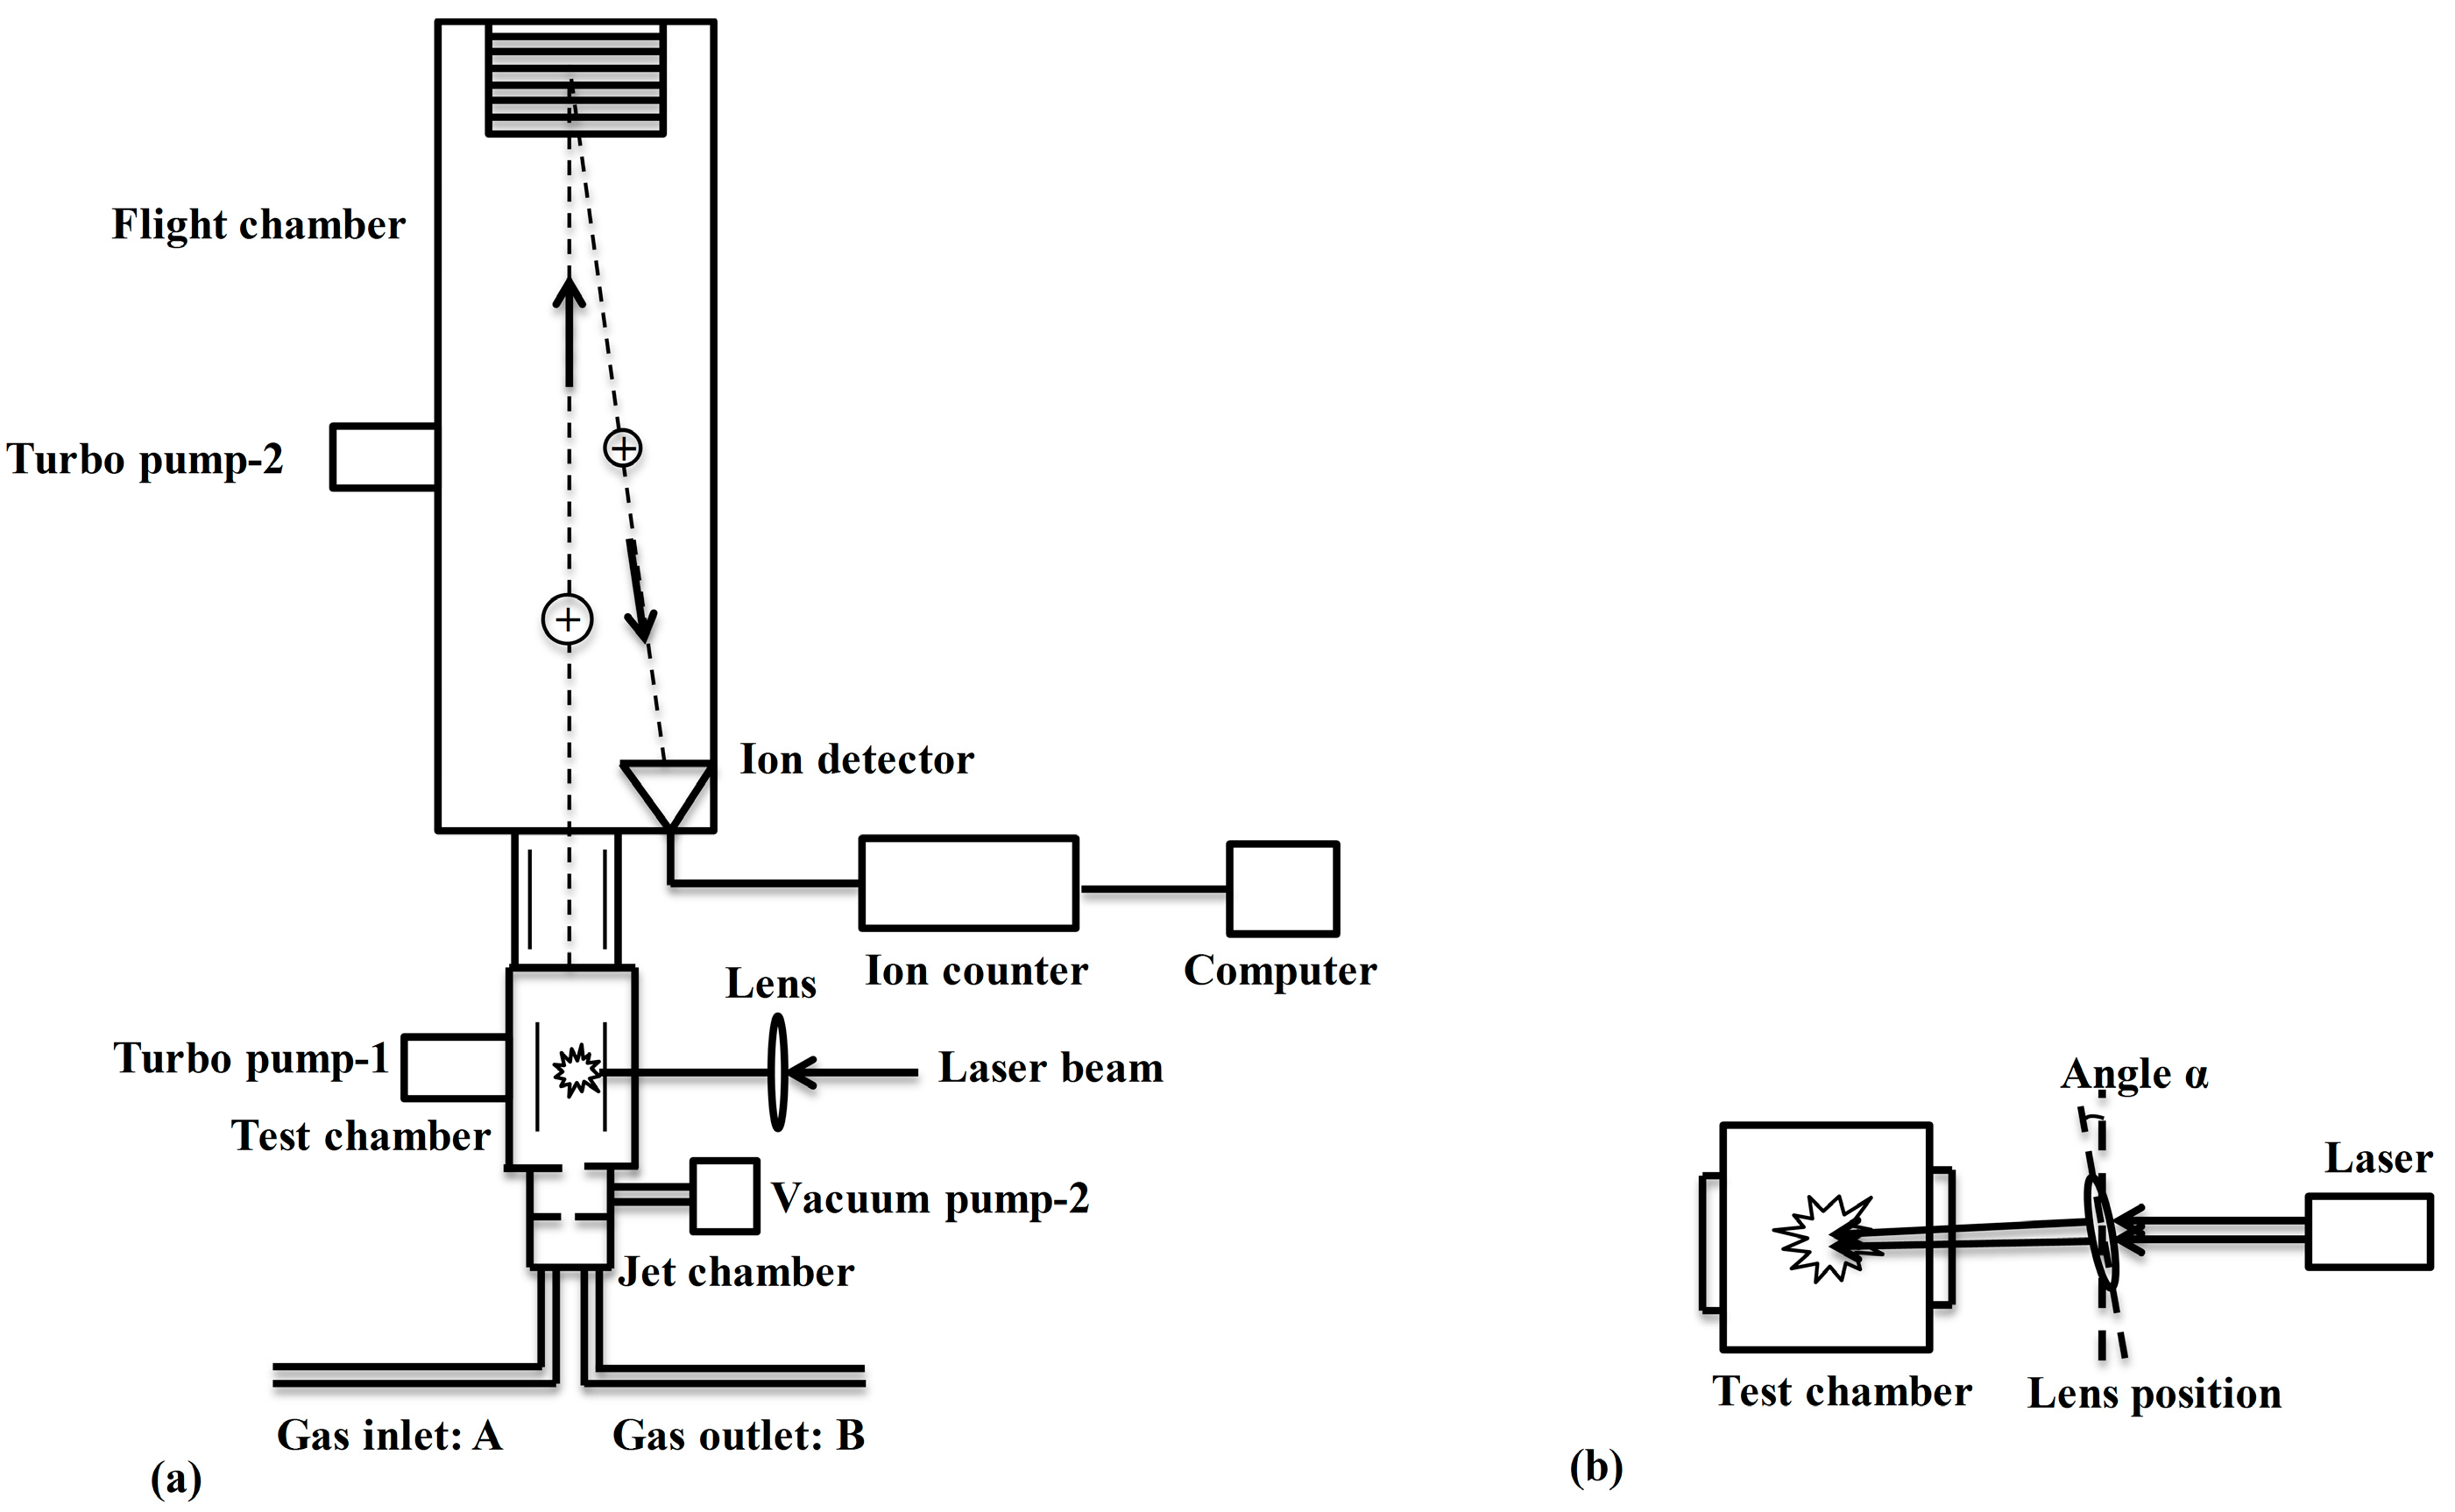
3. Experiment


| Nd:YAG Laser | Pulse Width@1064 nm | Wavelength (nm) | LB-TOFMS | LIBS |
|---|---|---|---|---|
| LOTIS TII, LS-2134UTF | 5–8 ns | 266, 1064 | HC | --- |
| Quanta-Ray, Pro-230 | 6–12 ns | 532, 1064 | HC, Hg, I, As | Sr, Cs, I |
| Quantel, Brilliant b | 6 ns | 1064 | Hg, I | Hg, I |
| EKSPLA, SL312 | 150 ps | 1064 | --- | Hg, I |
| Quantel, YG901C-10 | 35 ps | 532, 1064 | Hg, I | Hg, I |
4. Results and Discussion
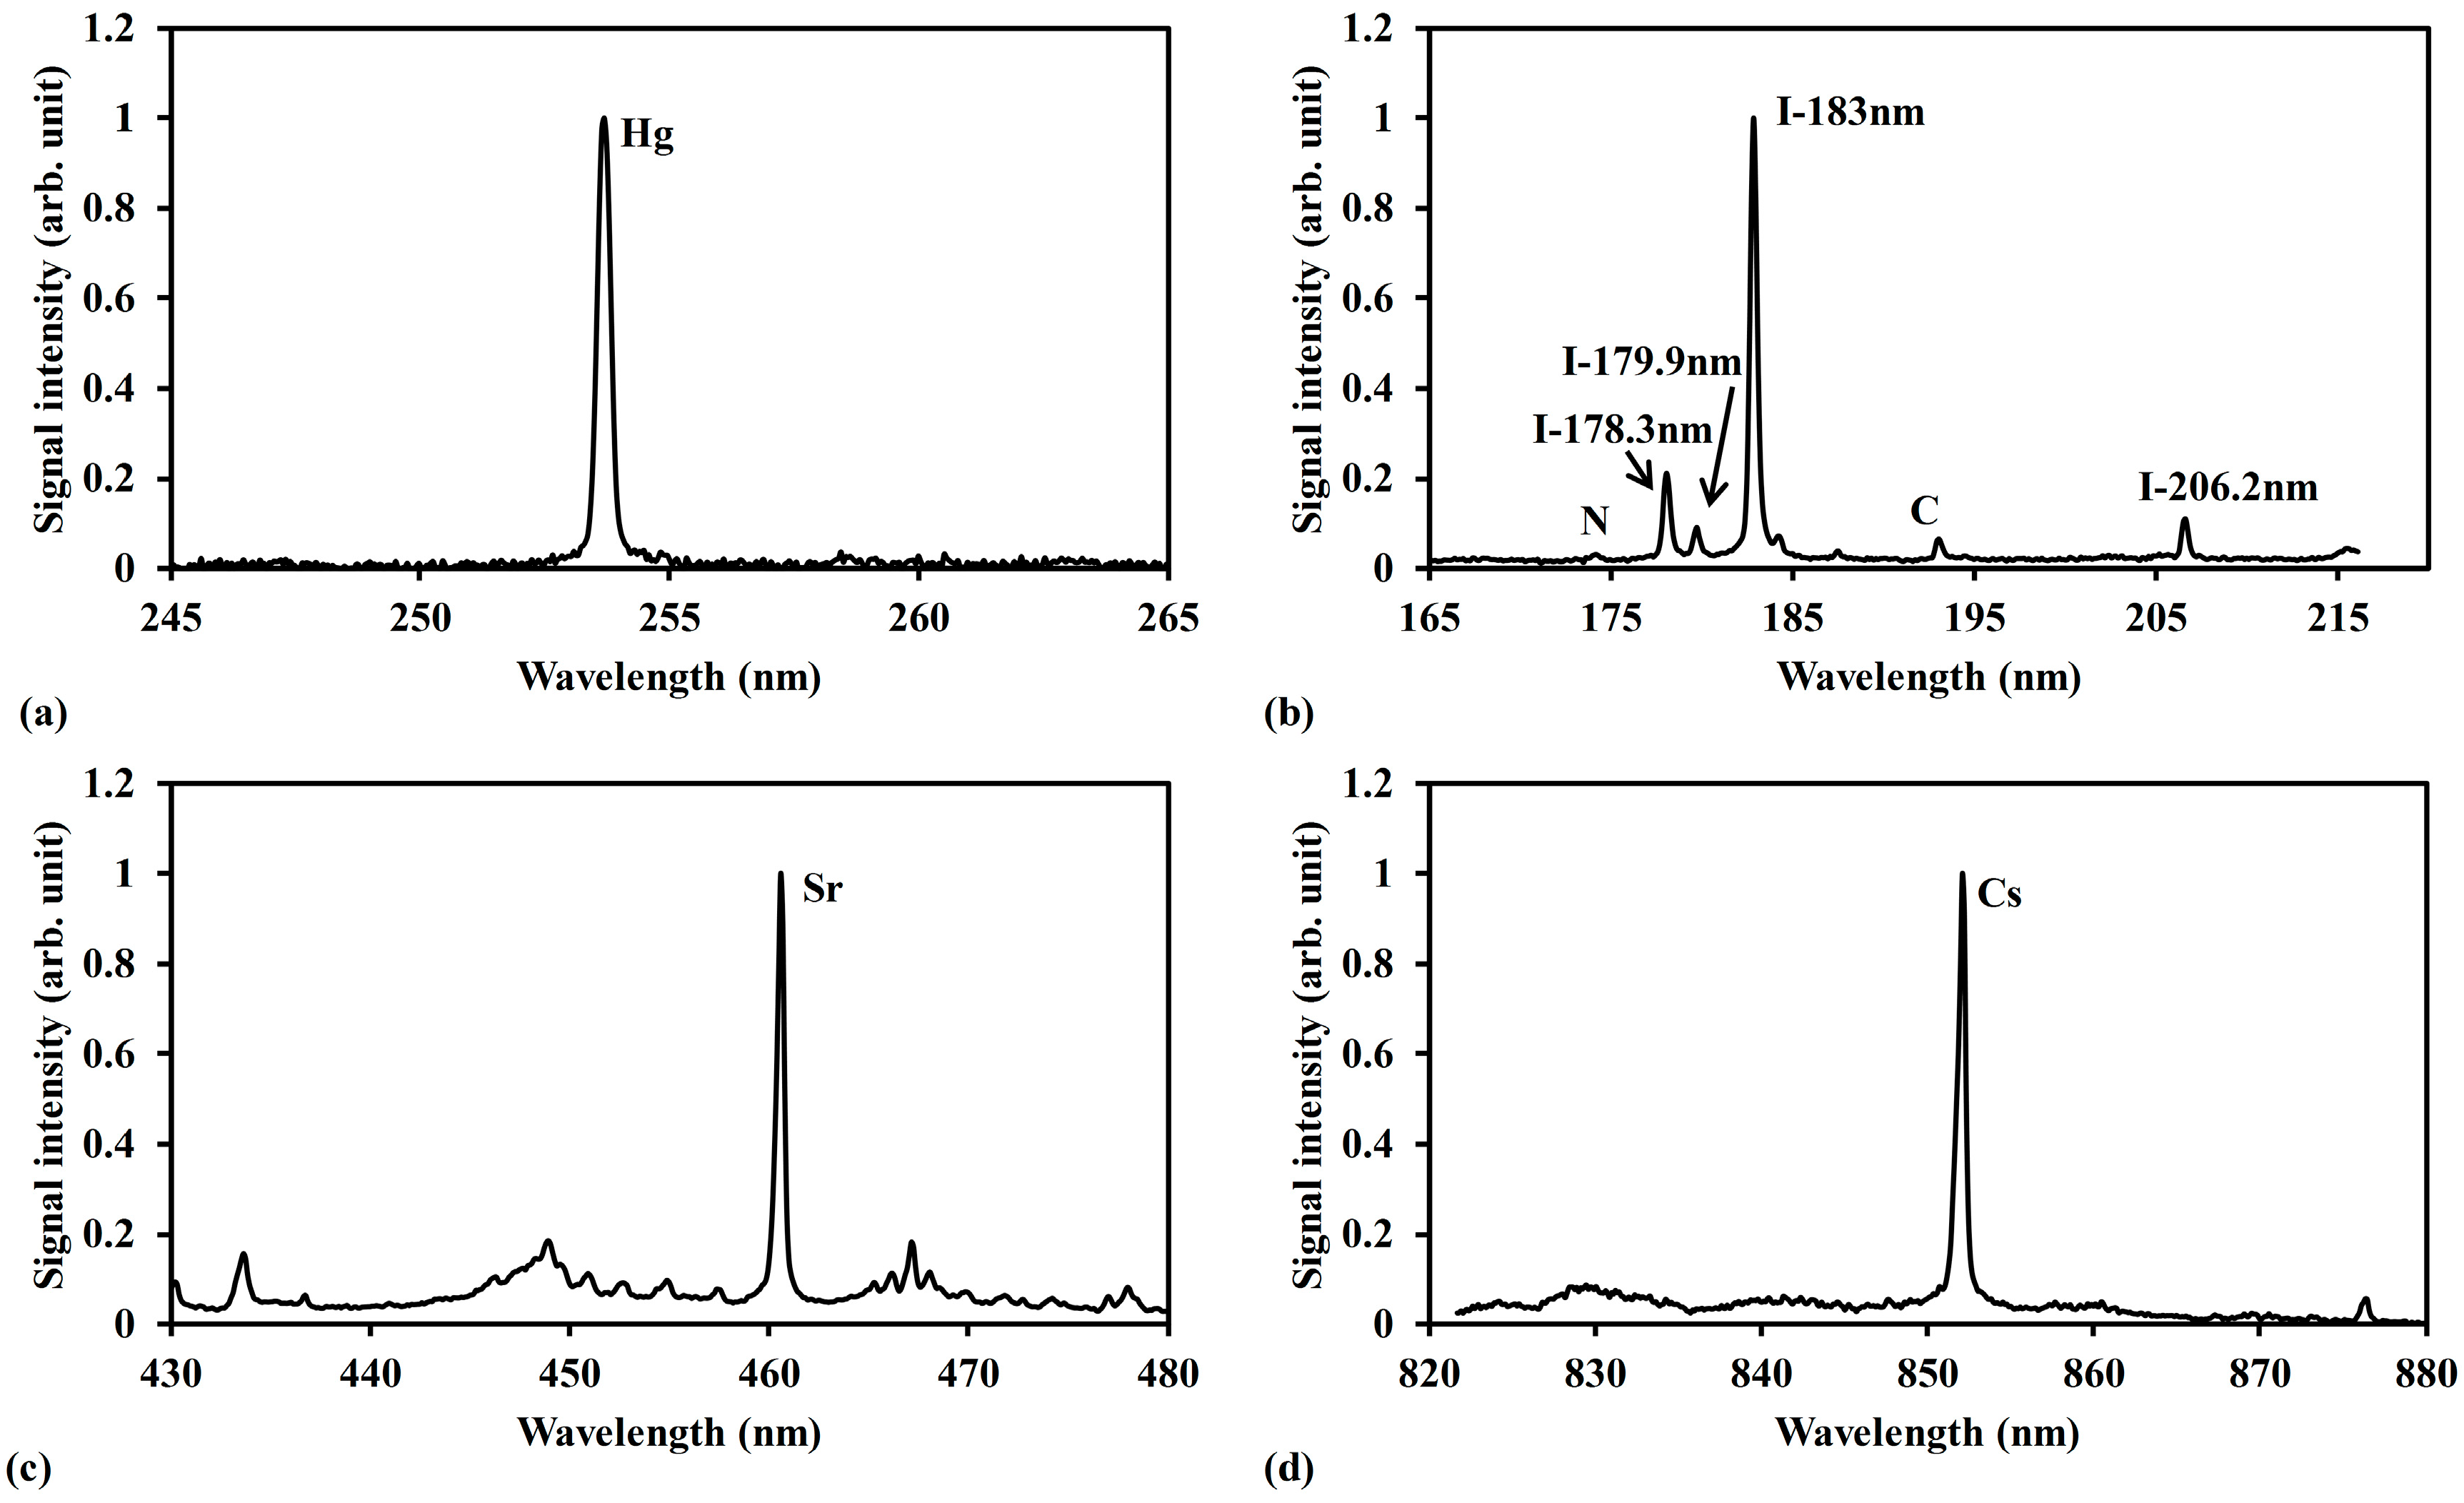
4.1. Laser Breakdown Process and Detection Features
| Species | Wavelength (nm) | Upper Level Energy (cm−1) |
|---|---|---|
| Hg(I) | 253.7 | 39,412.2 [60] |
| NO | 258 | 38,759.7 [61] |
| I(I) | 178.3 | 56,092.88 [62] |
| I(I) | 179.9 | 63,186.76 [62] |
| I(I) | 183 | 54,633.5 [62] |
| I(I) | 206.2 | 56,092.88 [62] |
| N(I) | 174.3 | 86,220.5 [63] |
| C(I) | 193.1 | 61,981.82 [64] |
| Sr(I) | 460.7 | 21,698.45 [65] |
| Cs(I) | 852.1 | 11,732.31 [66] |


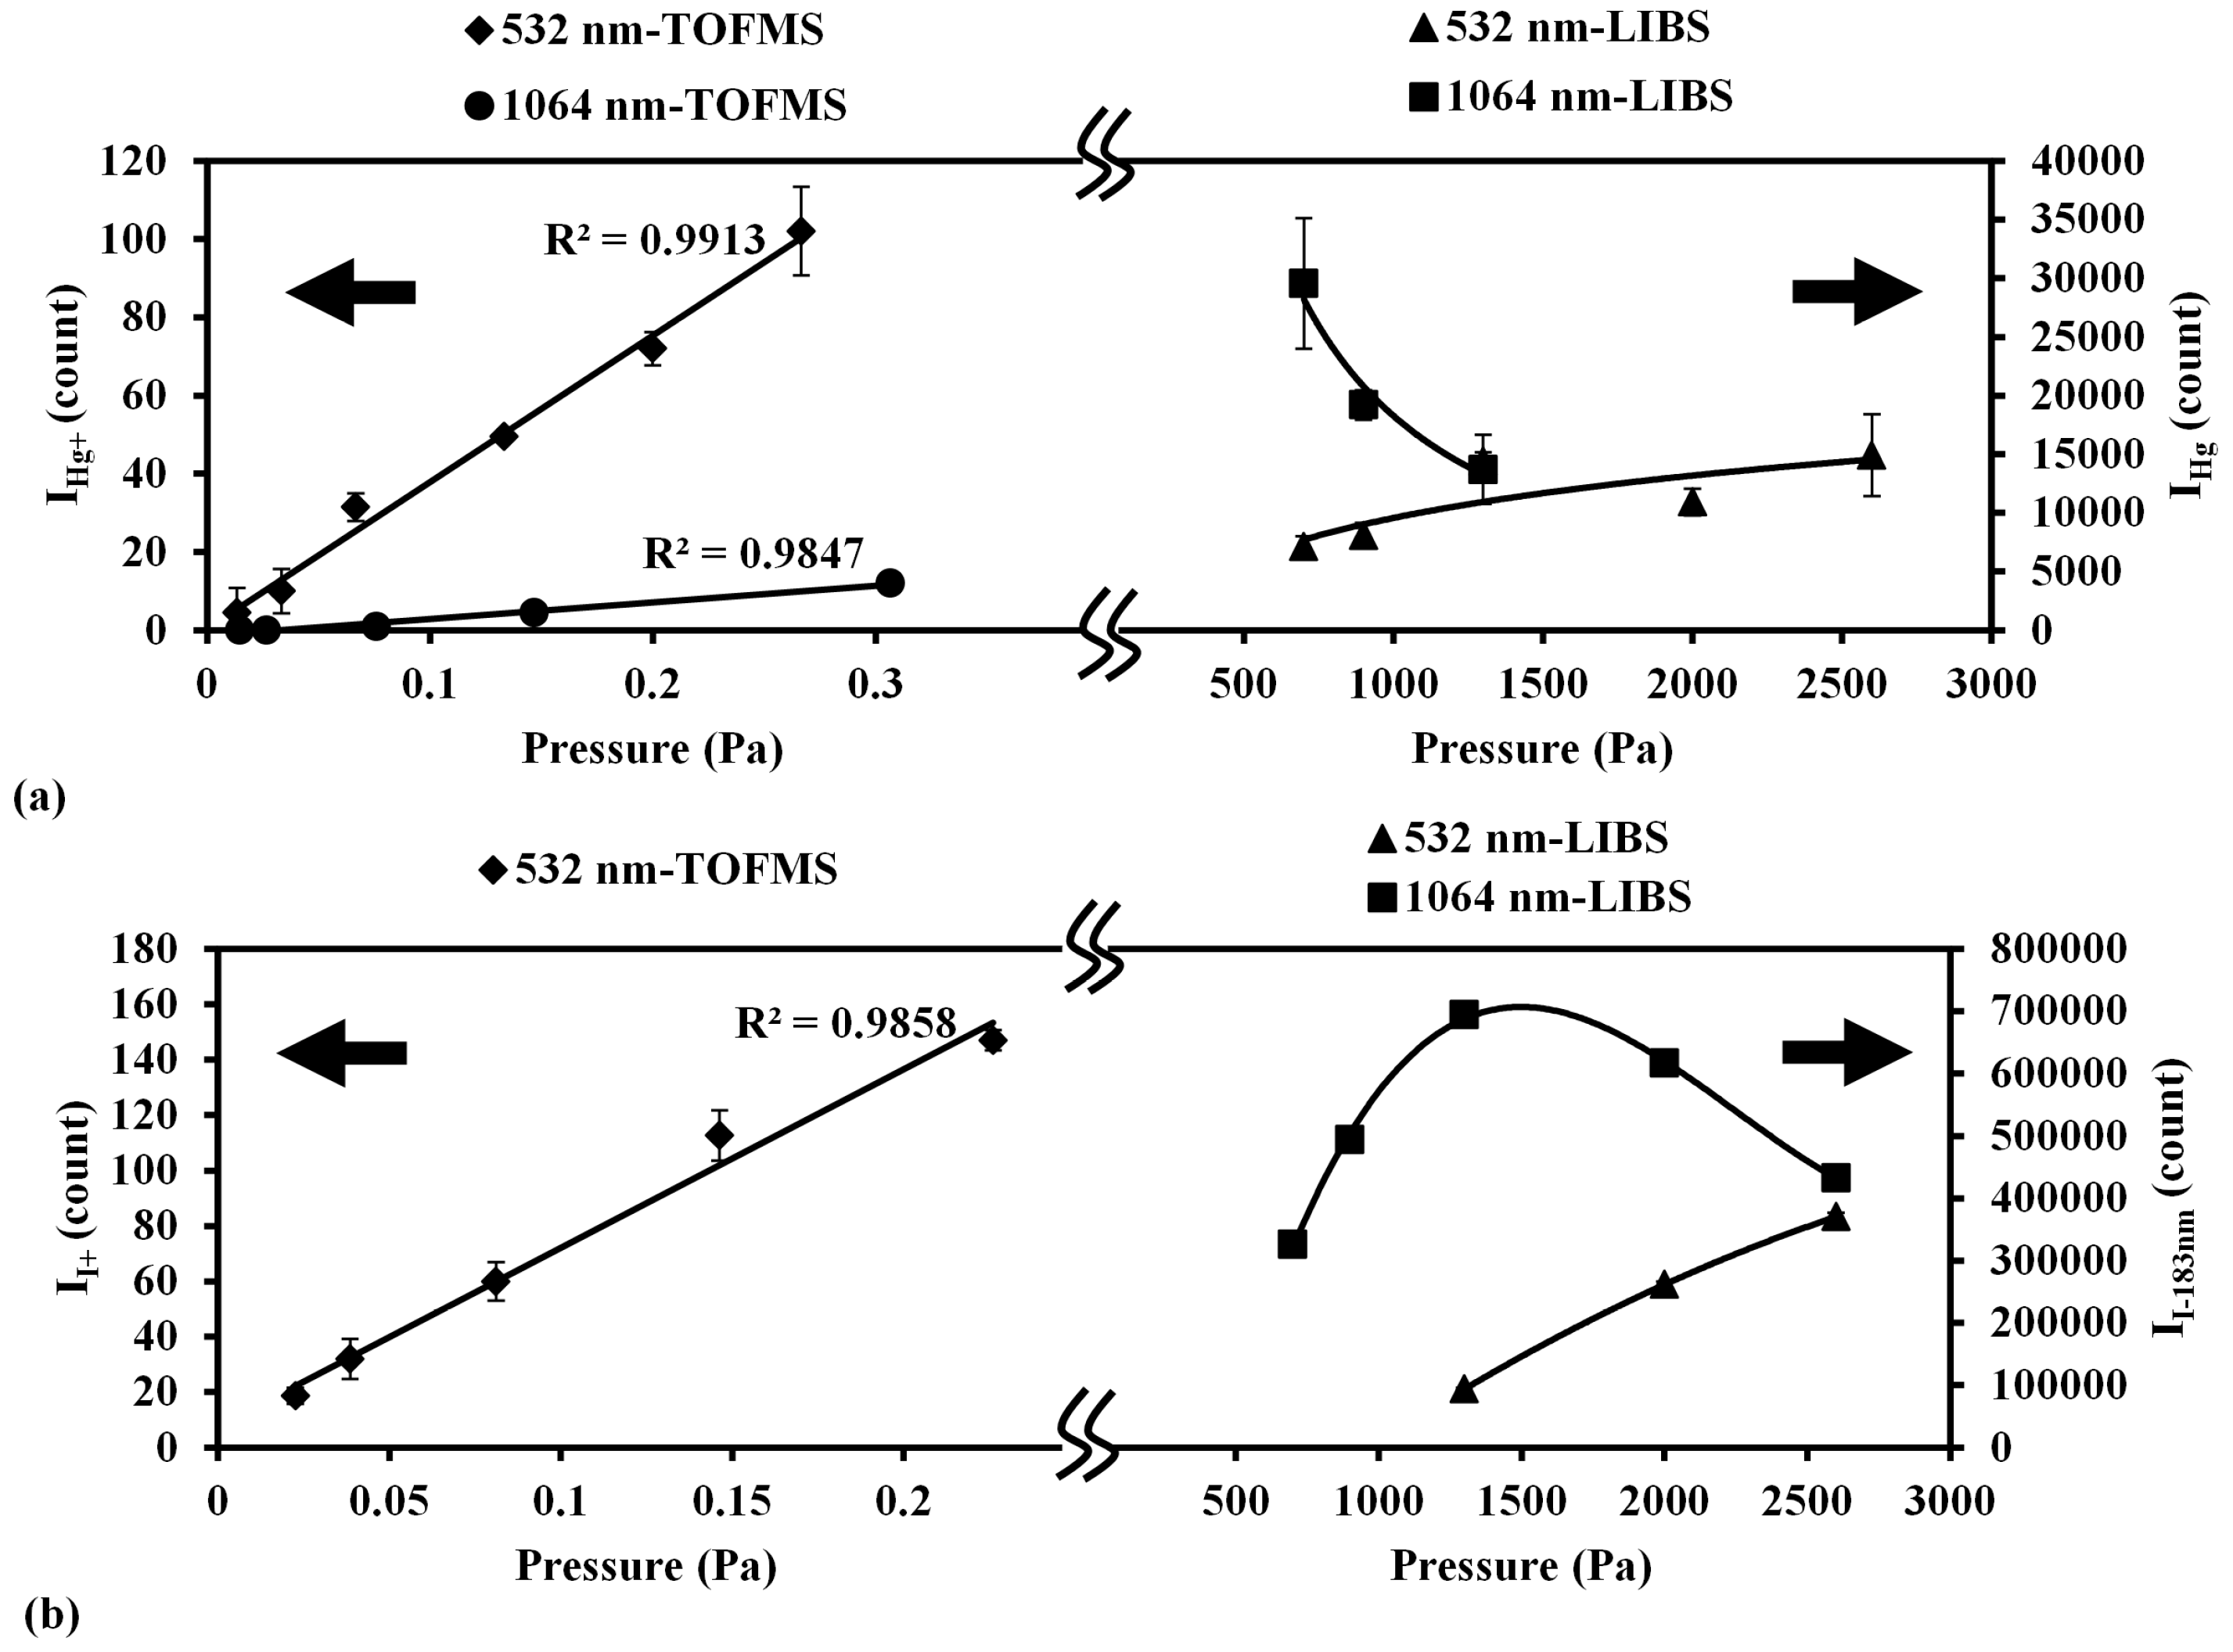
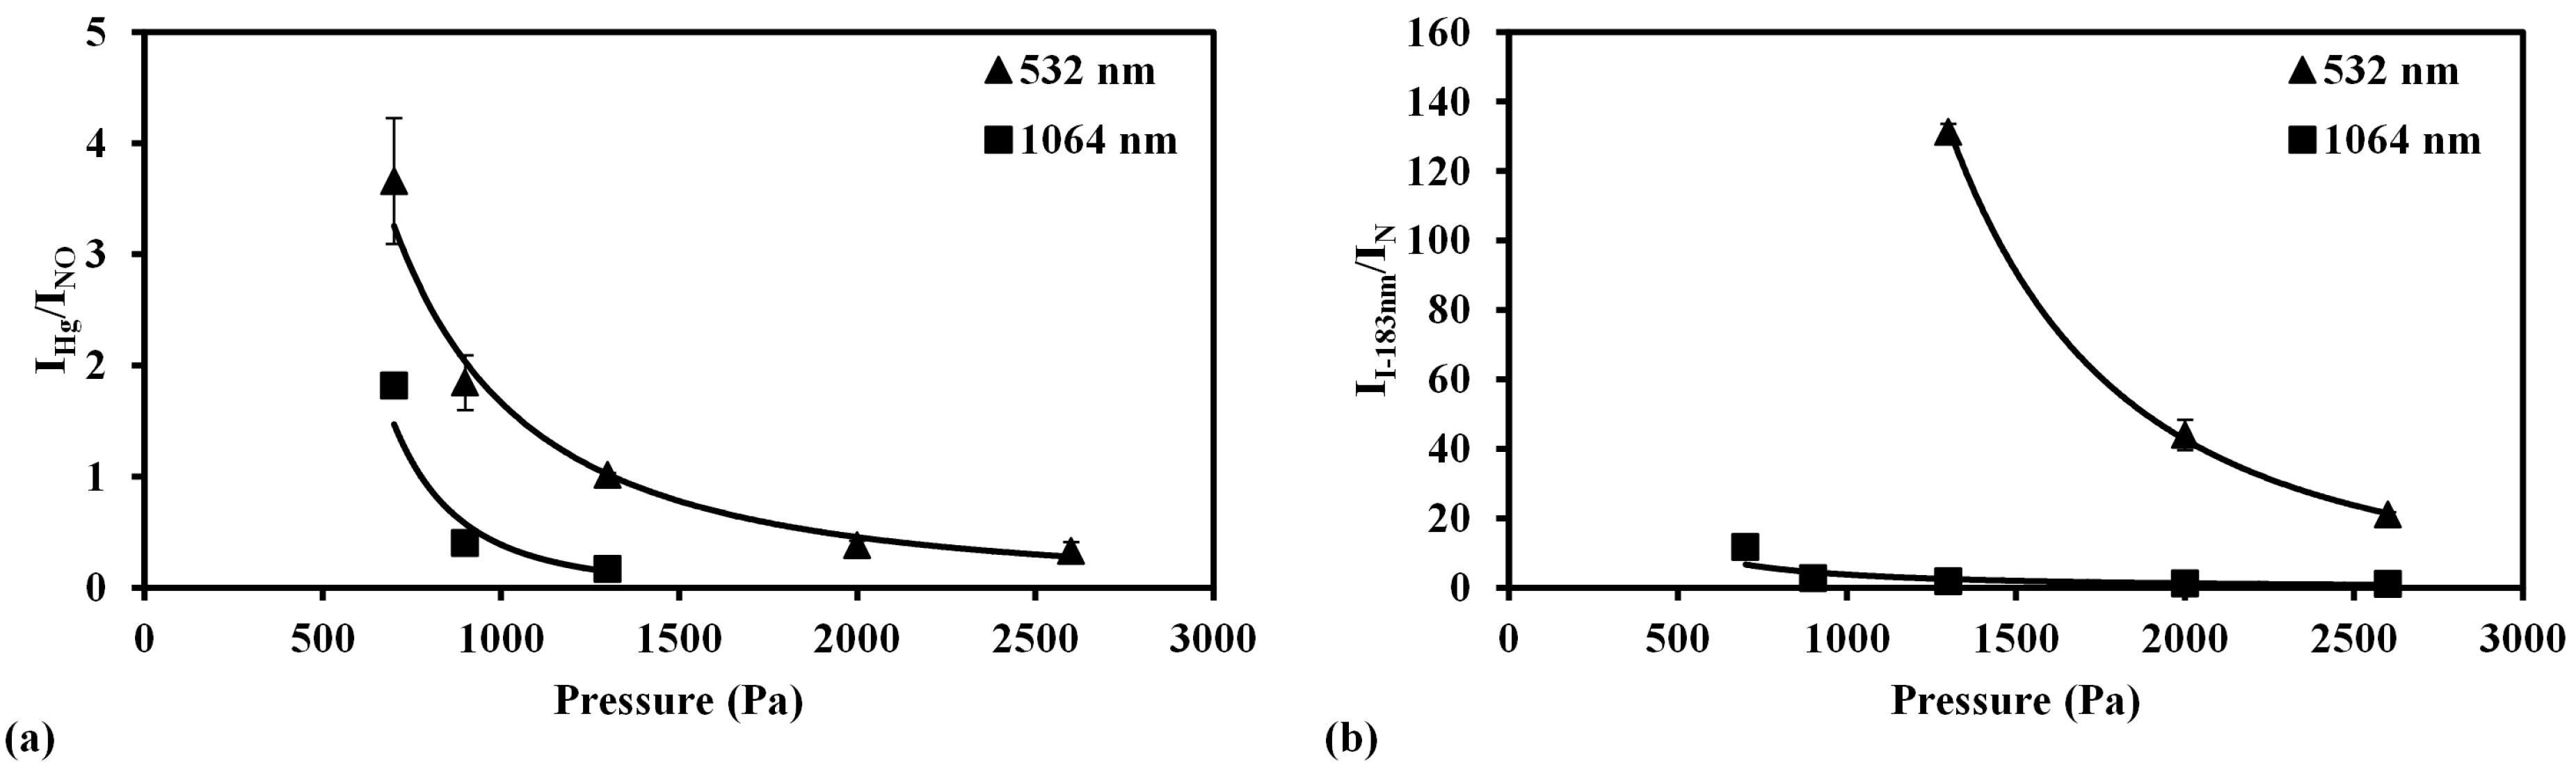
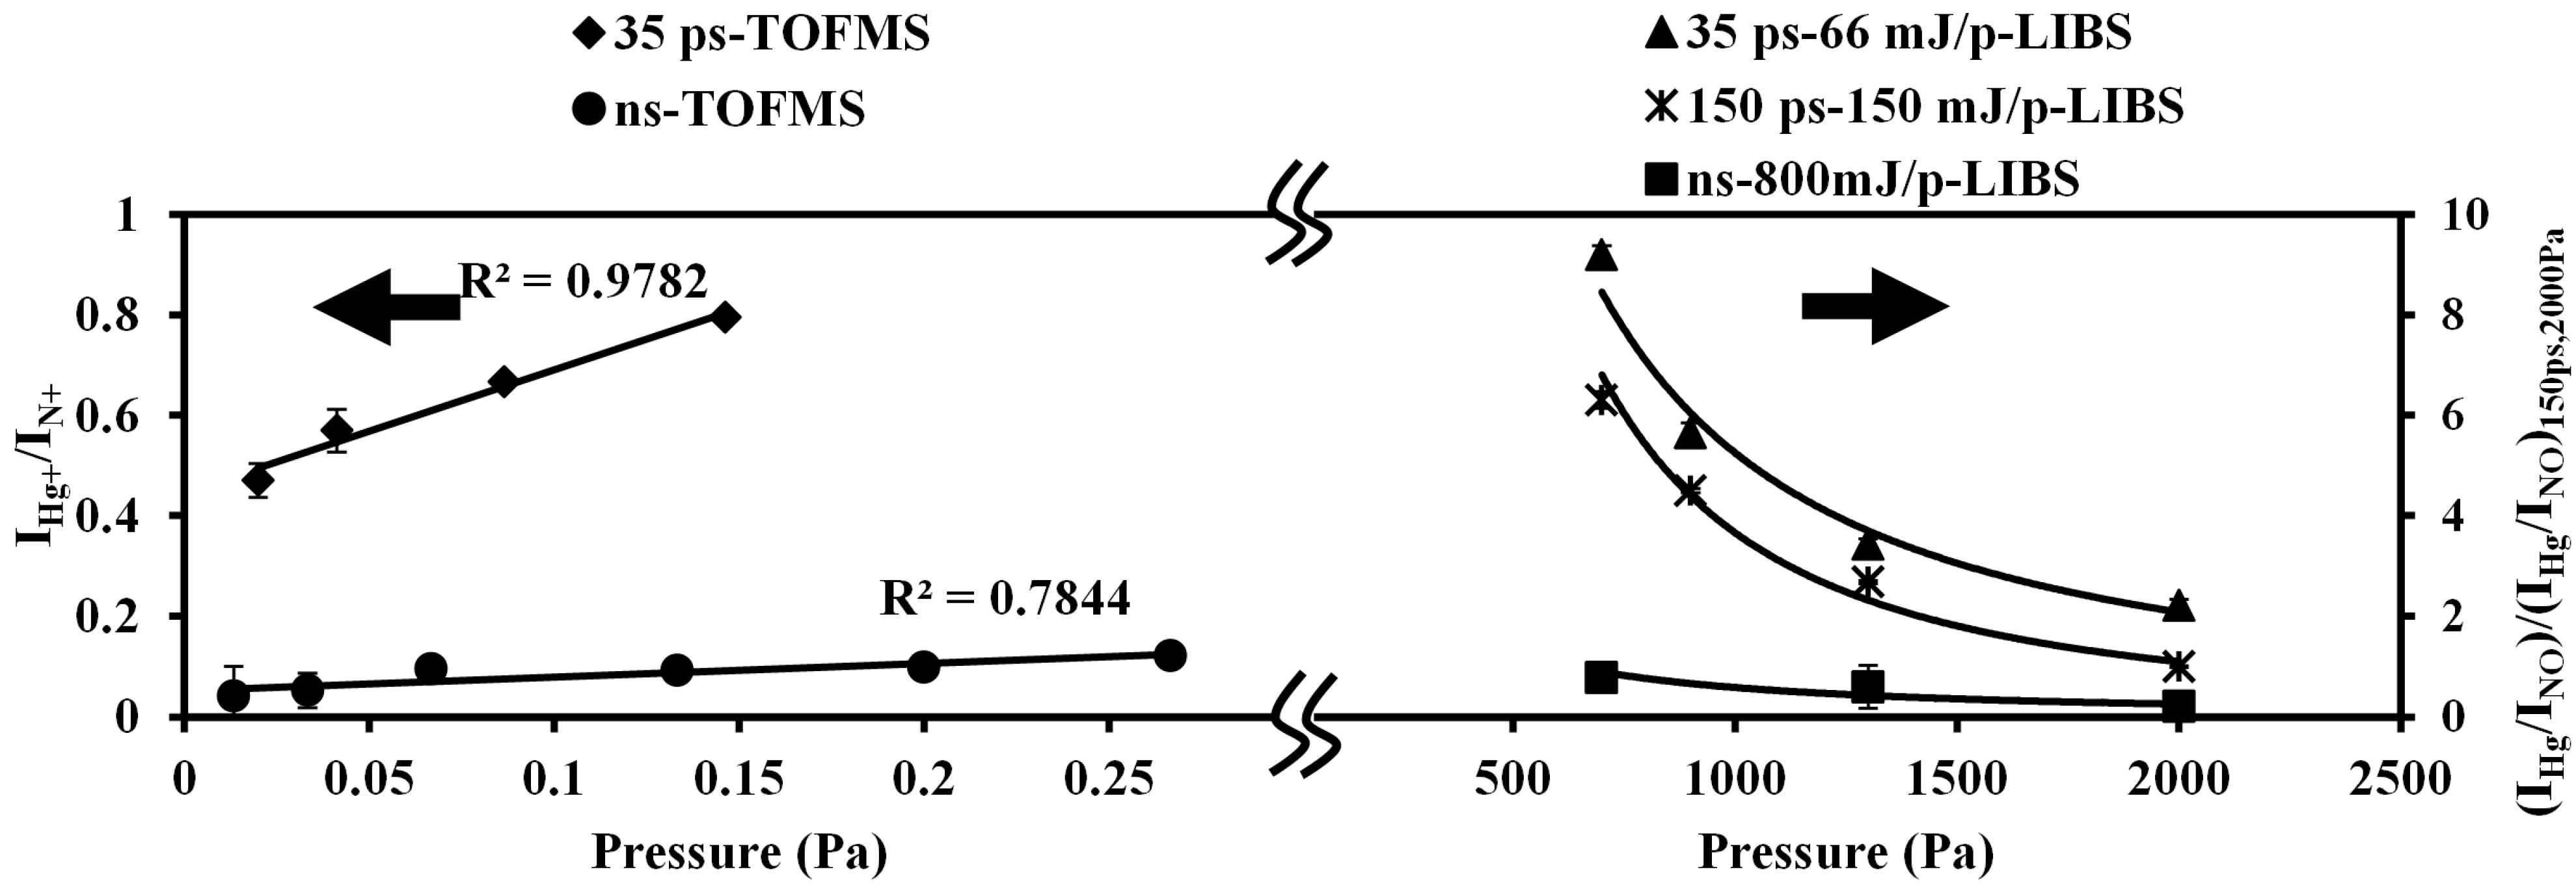
4.2. Pressure Effect on Detection Ability


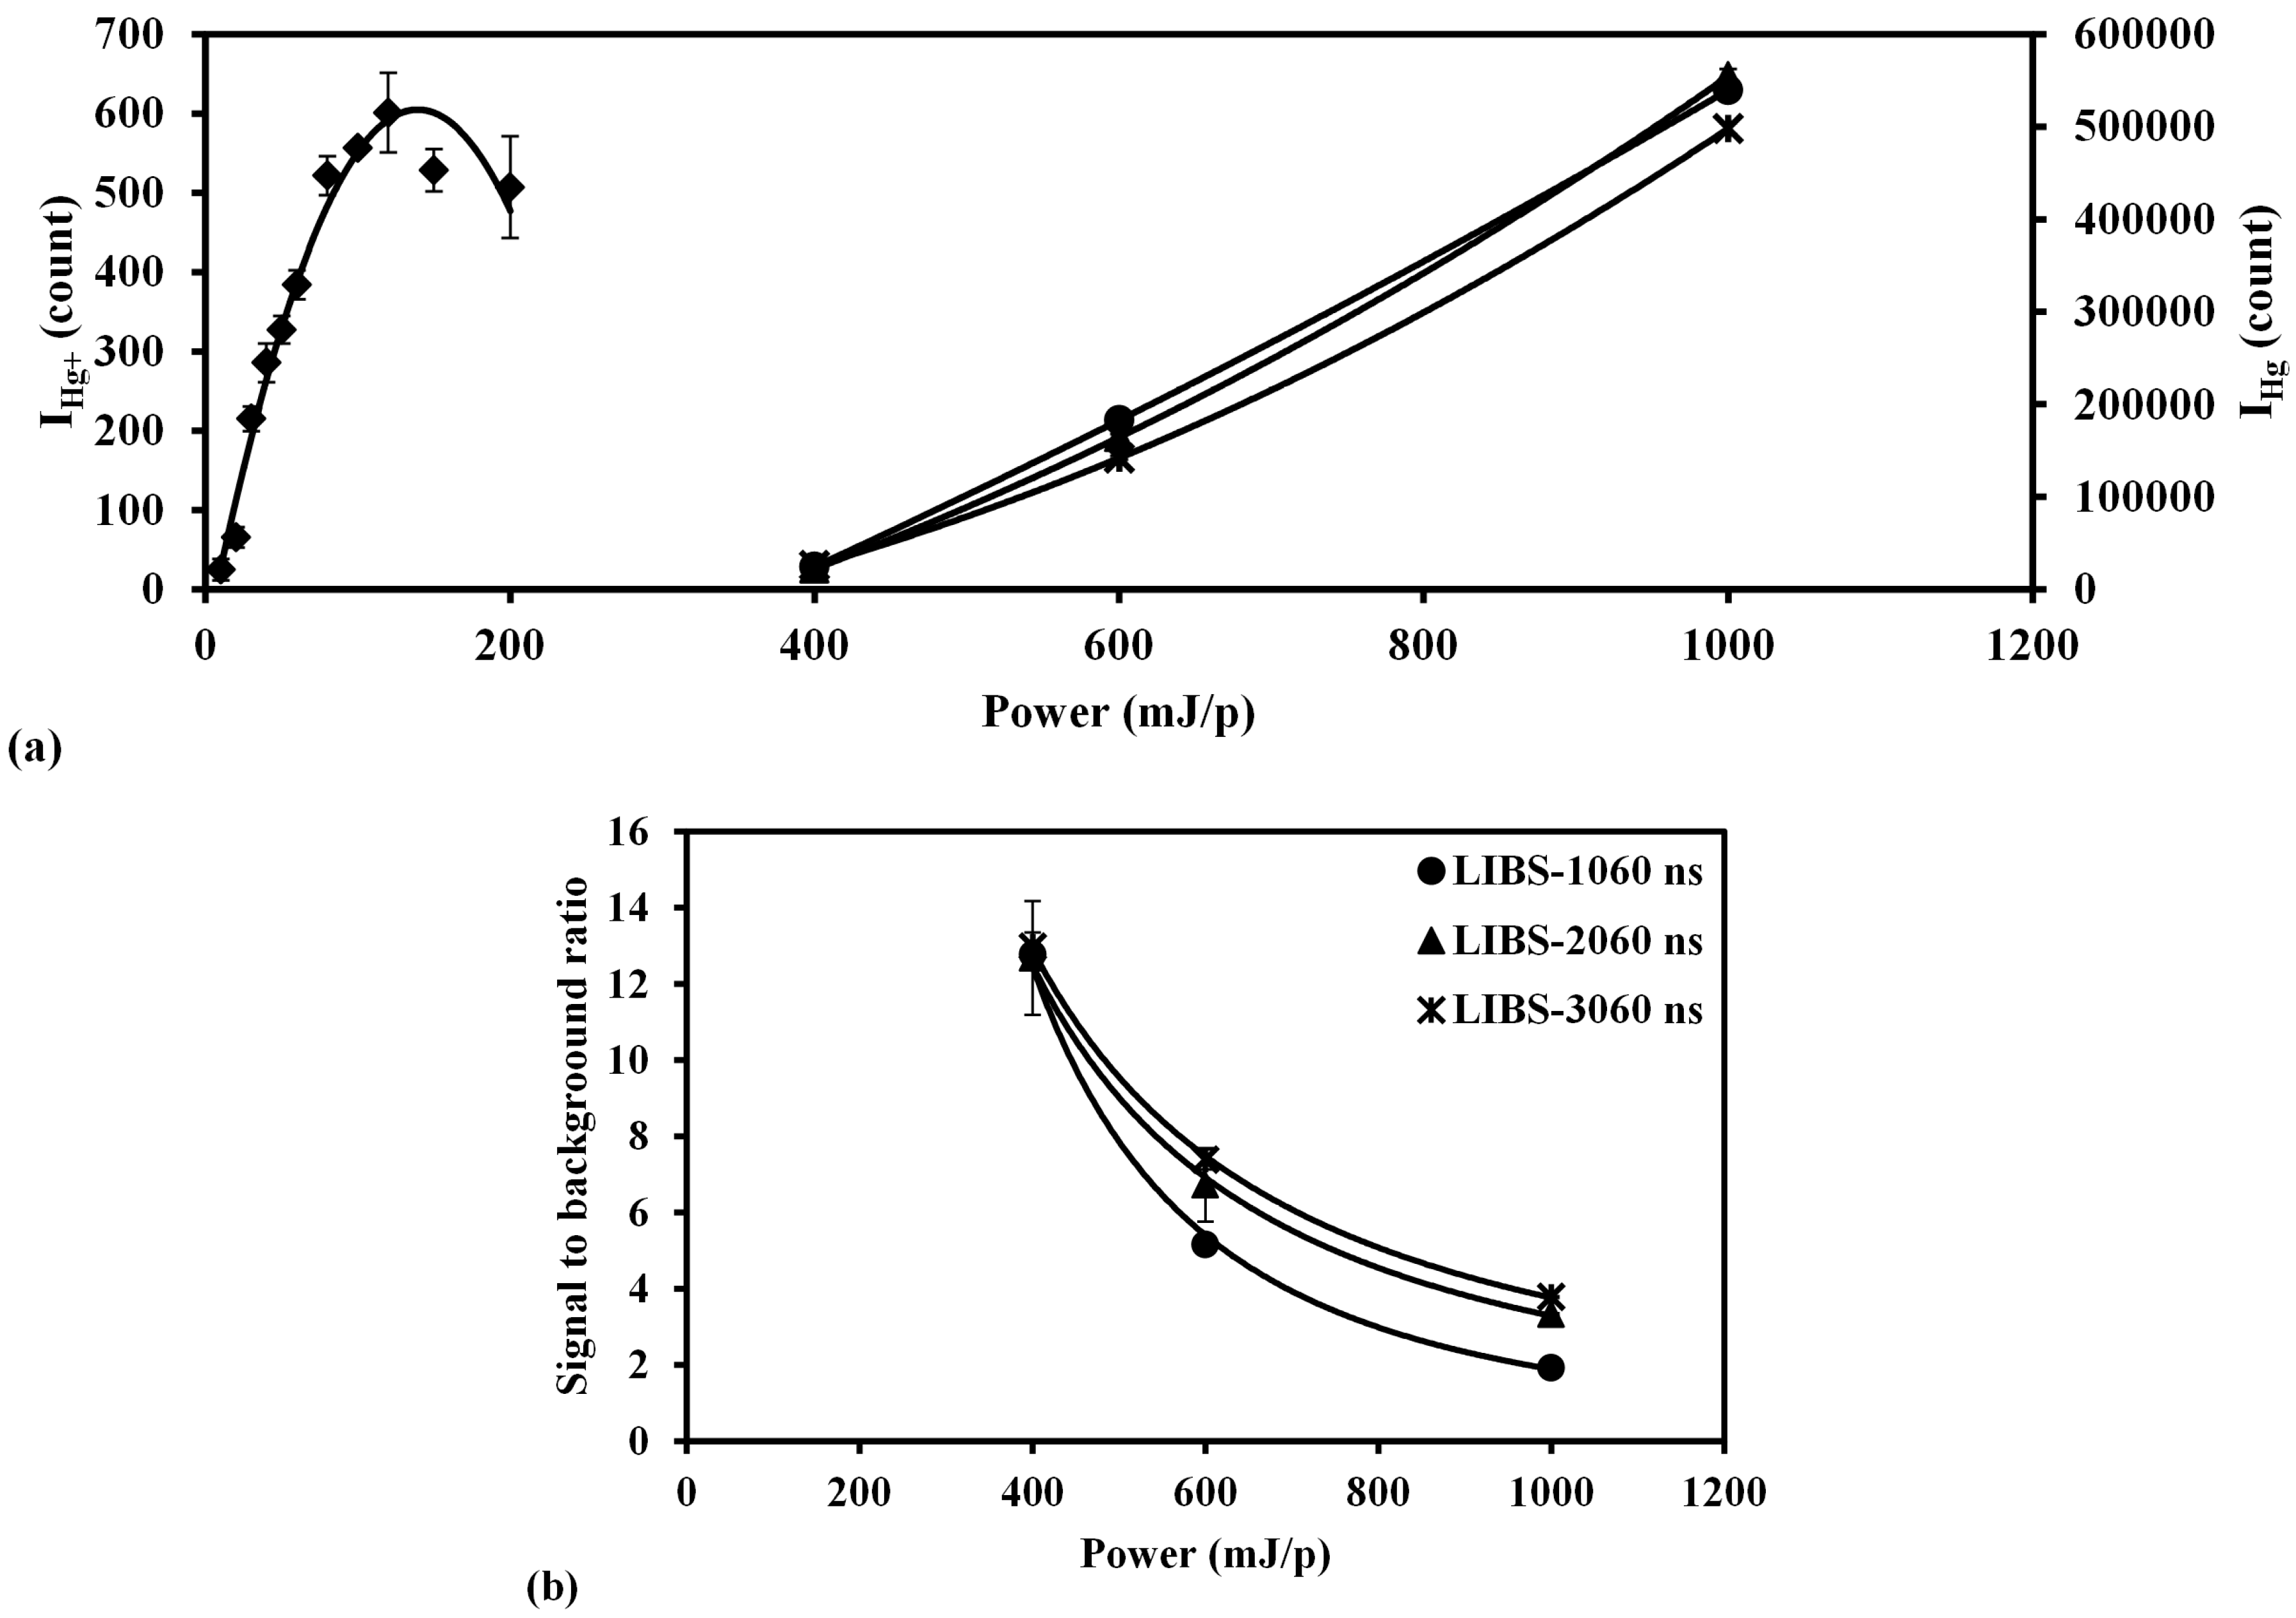
4.3. Laser Power Effect on Detection Ability

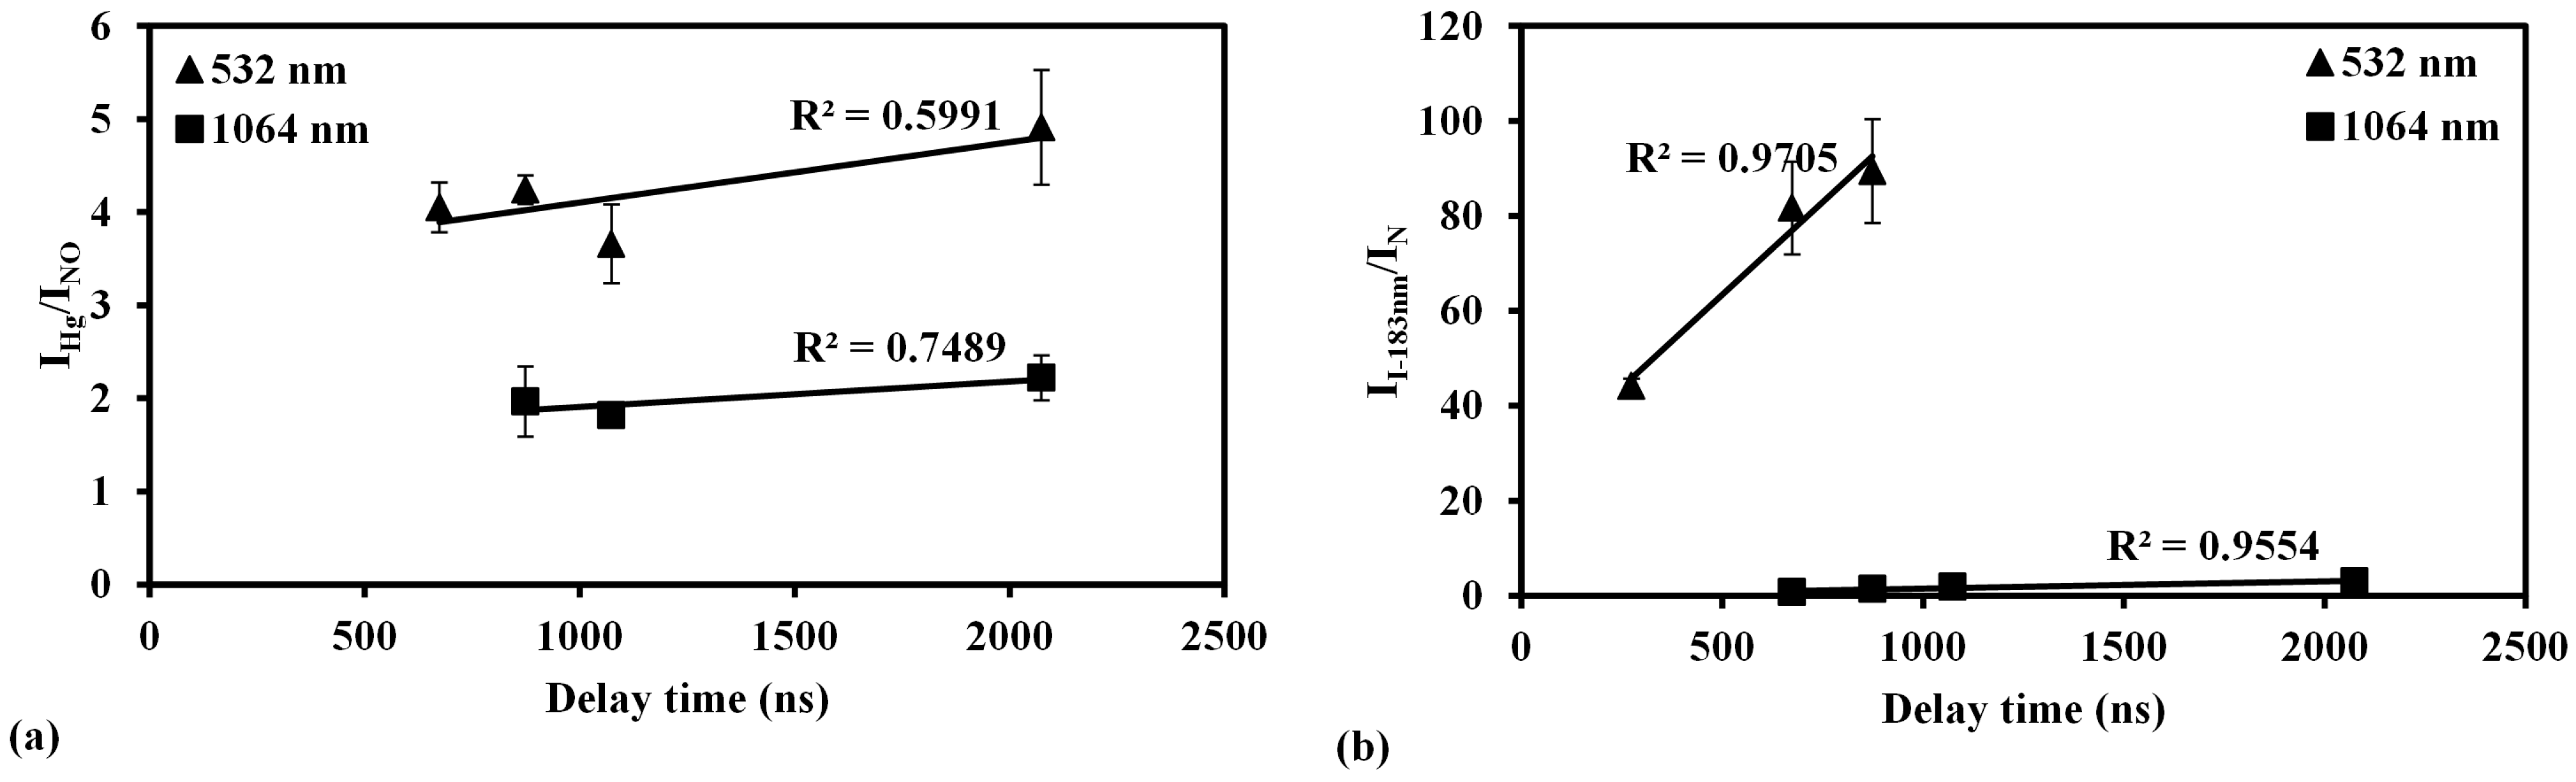
4.4. Influence of Delay Time on Emission Signals

4.5. Pulse width Effect on Detection Ability


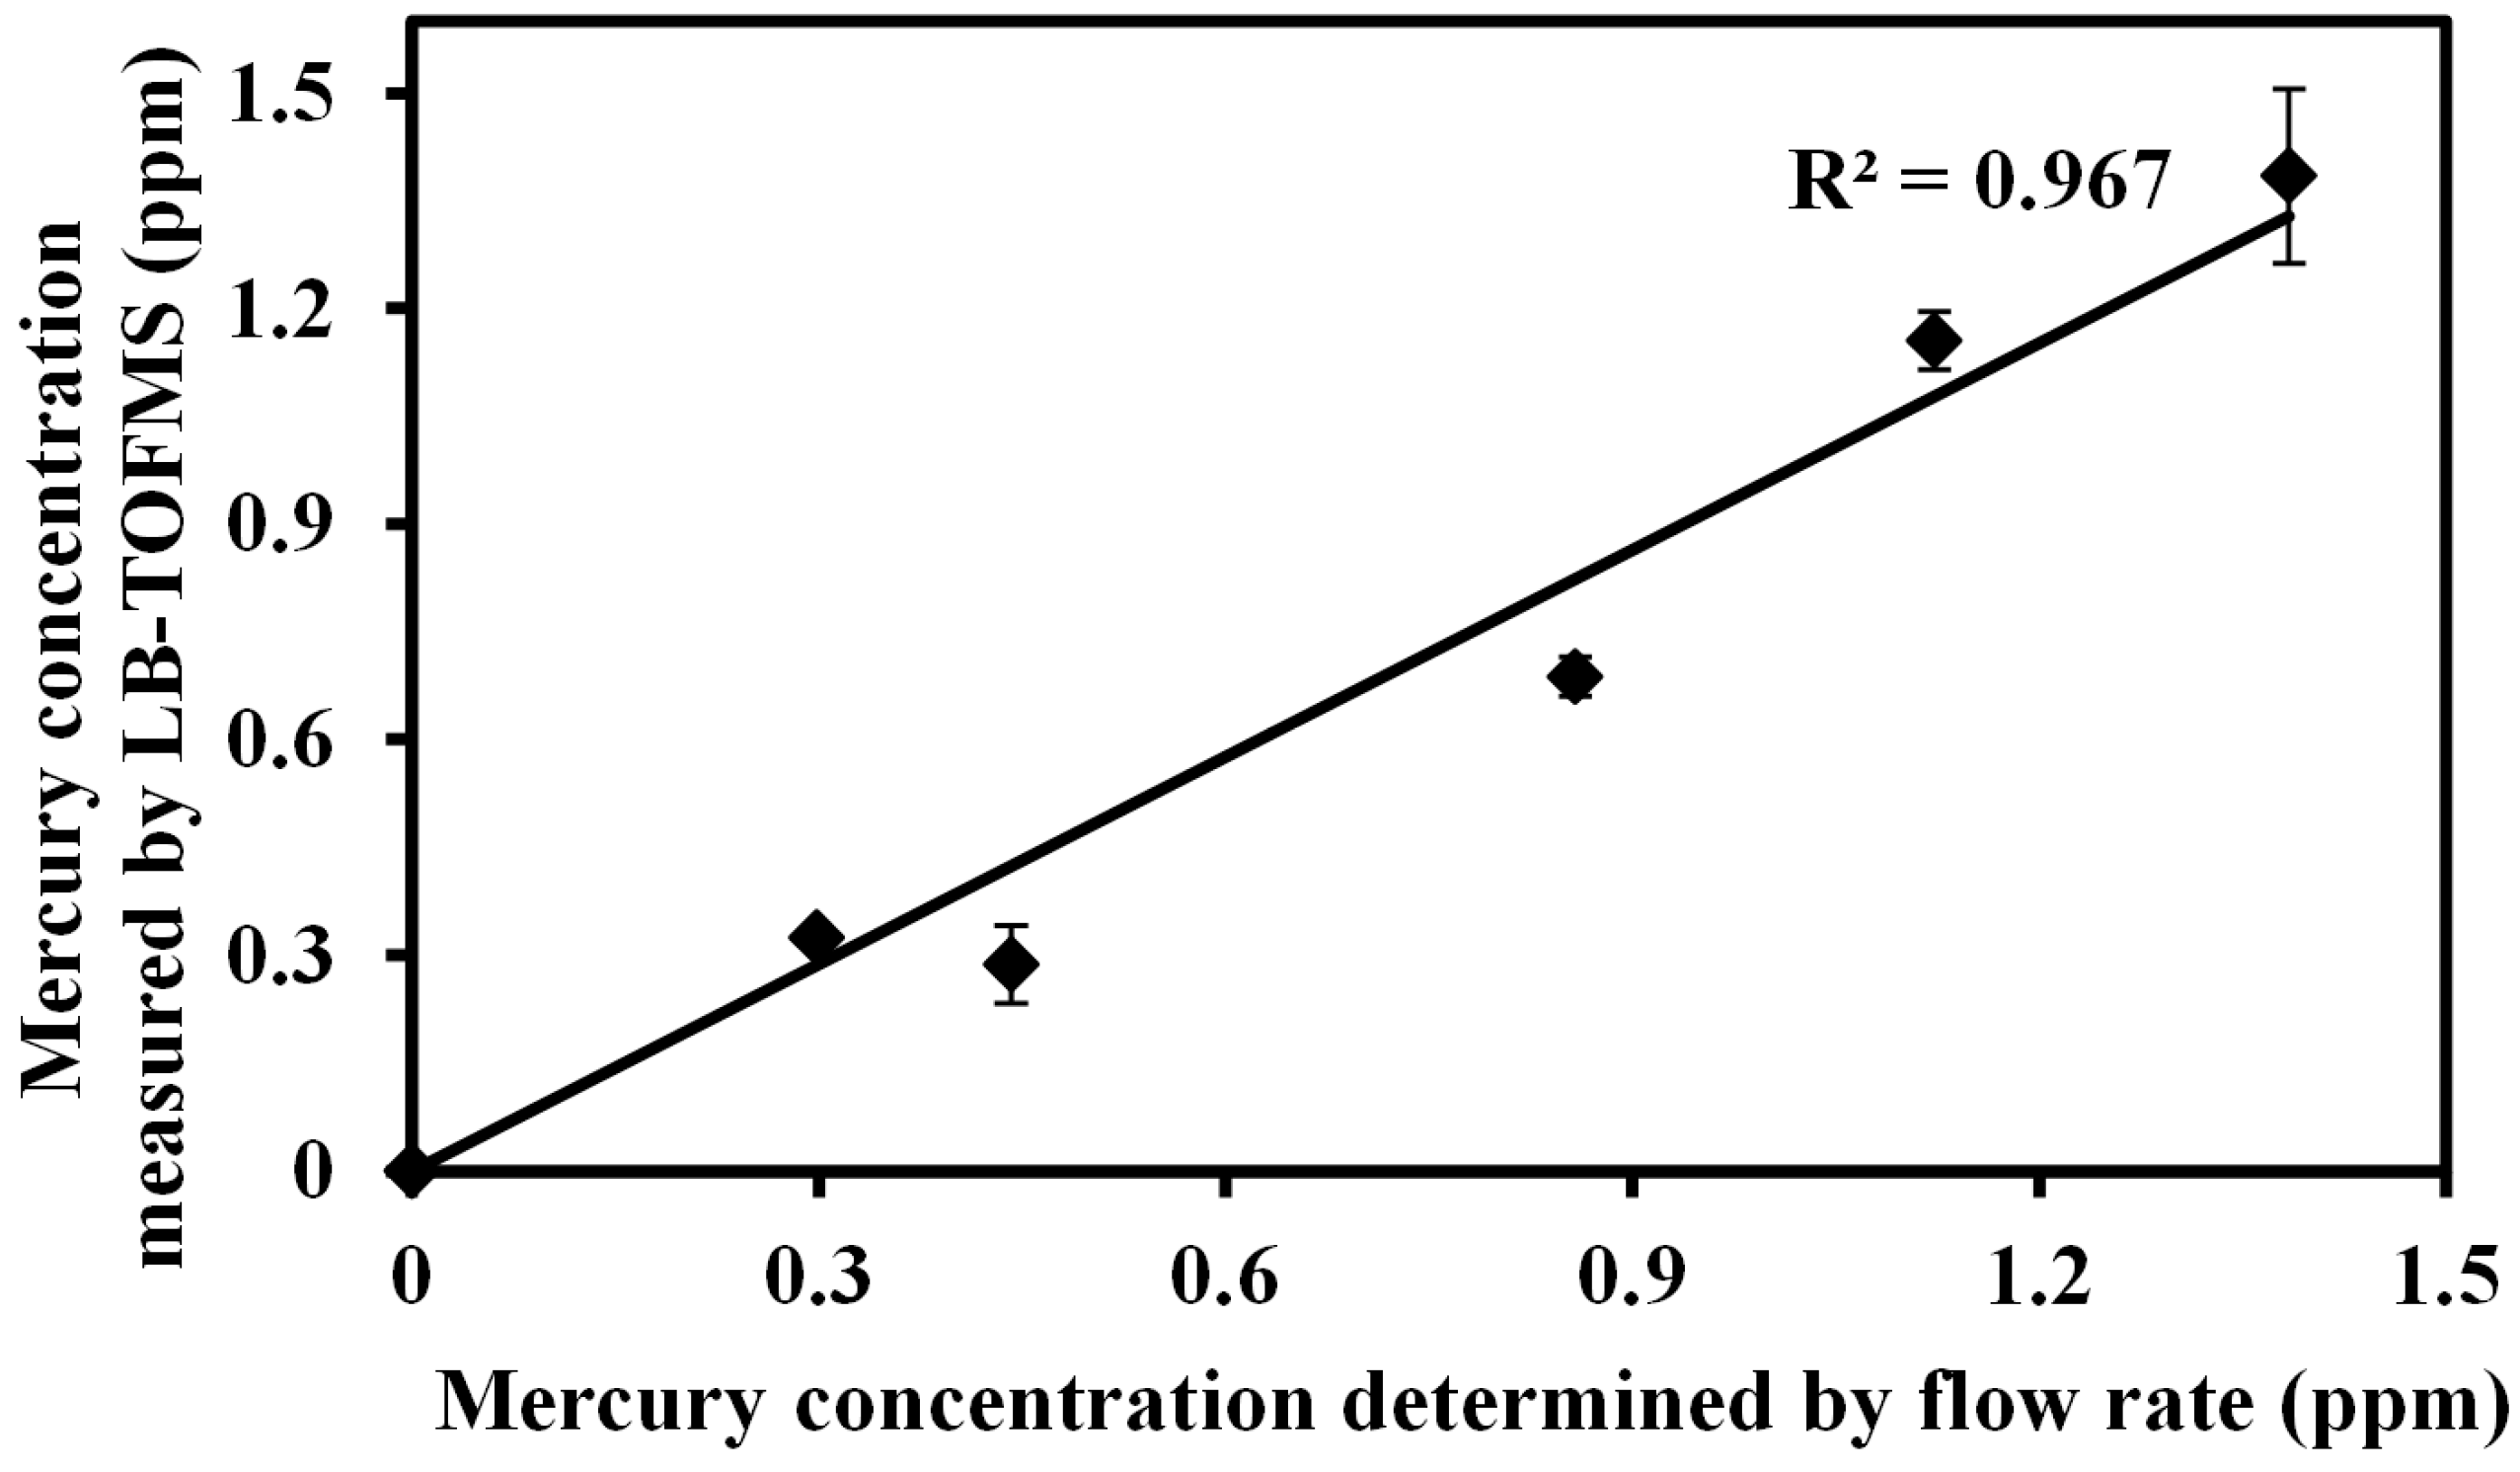
4.6. Detection Limit

| Species | LIBS (ppb) | LB-TOFMS (ppb) | |||||||
|---|---|---|---|---|---|---|---|---|---|
| Mercury | Iodine | Mercury | Iodine | ||||||
| Conditions | ns | 35 ps | ns | 35 ps | ns | 35 ps | ns | 35 ps | |
| Buffer Gas | 1064 nm | 1064 nm | 1064 nm | 1064 nm | 532 nm | 532 nm | 532 nm | 532 nm | |
| Air | 450 | 30 | 2660 | 3440 | --- | --- | --- | --- | |
| N2 | 3.5 | --- | 60 | 210 | 2.2 | 1.2 | 9.5 | 9.0 | |
5. Conclusions
- (1)
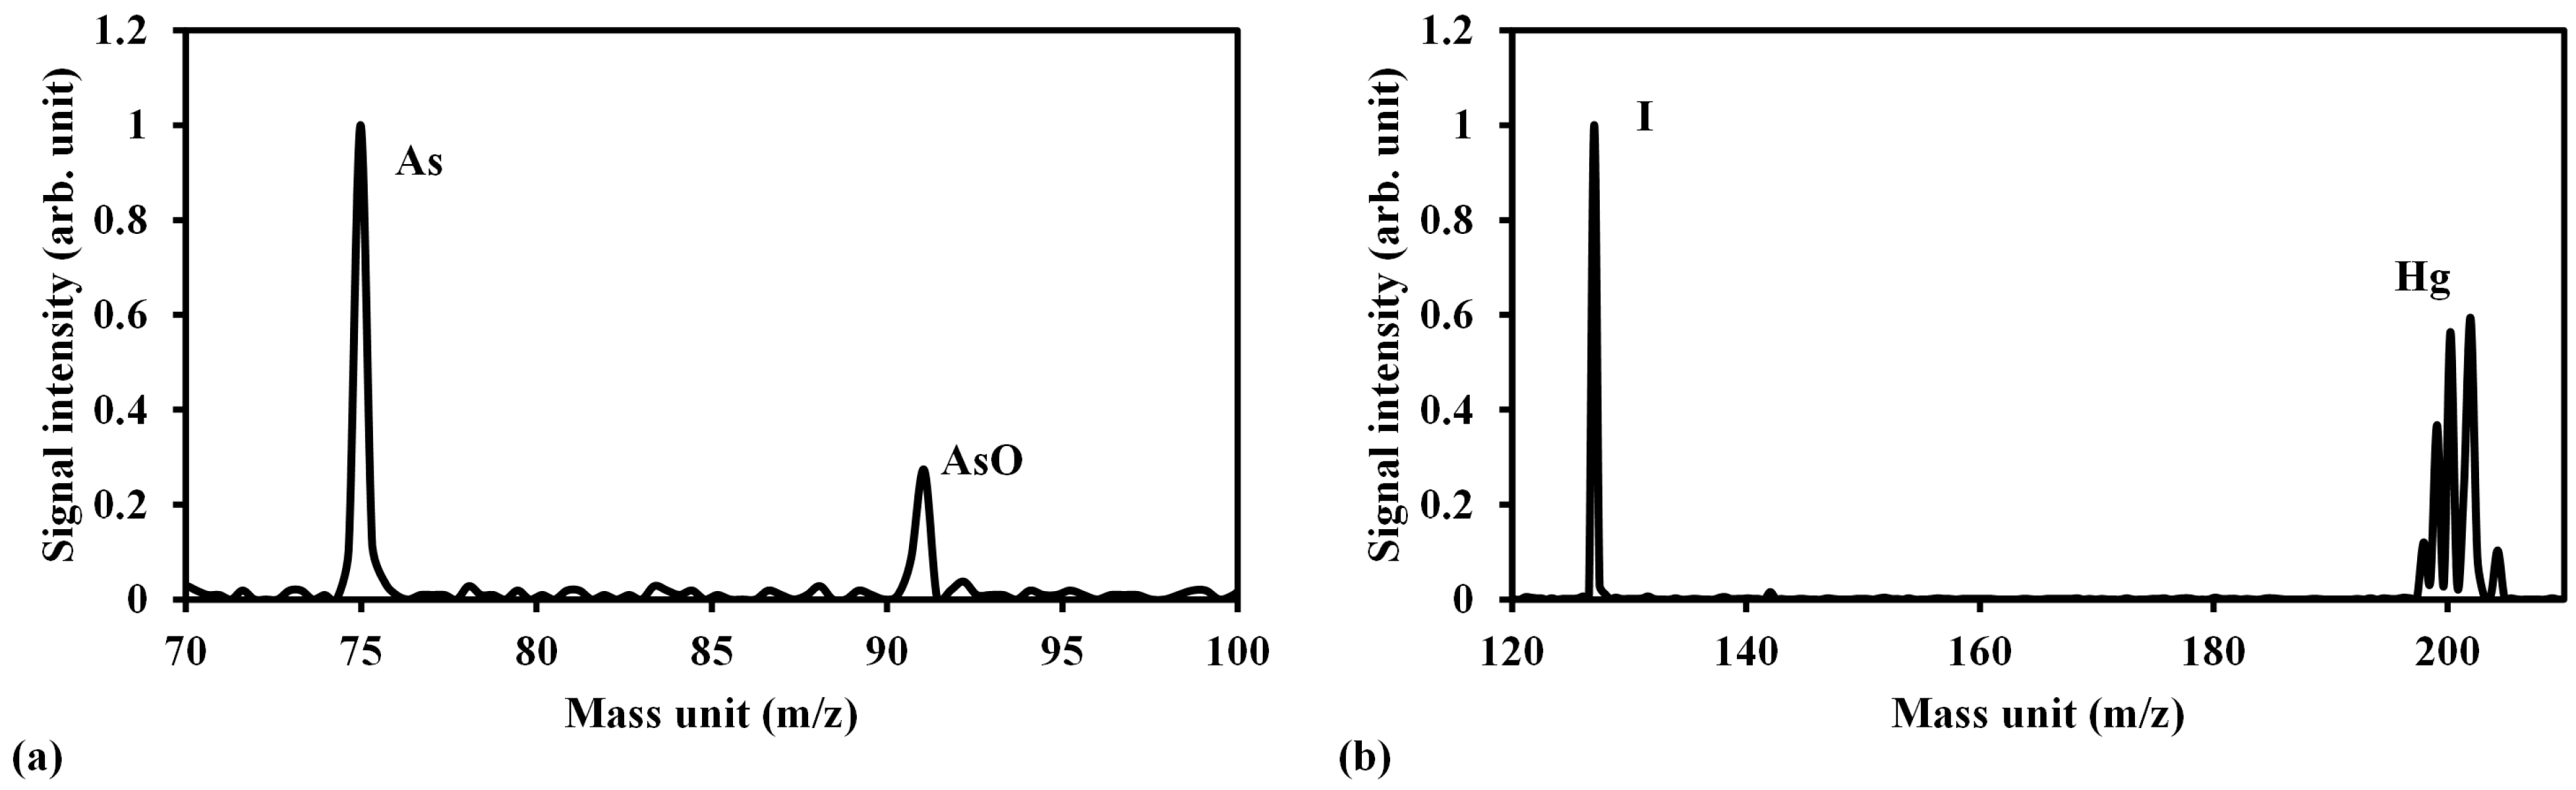
- Clear emission signals of mercury, iodine, strontium and cesium with decreased interference of the continuum emission from the plasma itself were measured using LIBS at low pressure. As for LB-TOFMS, the measurement results of 1064 nm and 532 nm laser irradiation show clear ion signals of arsenic, mercury and iodine without any interference of the partial fragmentation in the m/z 30–300 mass region.
- (2)
- When the pressure decreased in low pressure LIBS, the ratios of IHg/INO and II-183nm/IN increased due to the control of the electron impact ionization process. In TOFMS the intensity of Hg+ and I+ signals increased when the pressure increased due to the increased ion number density. In both detection systems, the measurements employing 532 nm laser irradiation provided improved results relating to the high photon energy concerning the multi-photon ionization process.
- (3)
- The laser power dependence of the Hg+ signal shows an increase first and then a decrease because of the recombination of Hg+ ion with electrons. The intensity of the Hg emission signal increased when the laser power increased. In LIBS the measured result of signal to background ratio at 400 mJ/p was much better than that at 1000 mJ/p due to the decline of the electron impact ionization effect. An identical tendency was observed in iodine measurement.
- (4)
- The delay time is an important parameter in the LIBS process concerning the plasma temperature. Under low pressure conditions, the delay time was not a determining factor for mercury measurements in air. In the measurement of iodine using 532 nm laser irradiation, II-183nm/IN increased when the delay time increased. This can be explained by the different upper level energy.
- (5)
- The laser-induced plasma process can be also controlled by a short pulse width laser, especially the electron impact ionization process, as well as the larger ionization and excitation of mercury and iodine signals during the multi-photon ionization process. The detection ability of trace species can be enhanced using short pulse width laser in LIBS and LB-TOFMS.
- (6)
- The detection ability was improved dramatically using the LB-TOFMS system. The detection limits of mercury and iodine in N2 were 3.5 ppb (3σ/ɛ) and 60 ppb (3σ/ɛ) using low pressure LIBS. Mercury and iodine detection limits using of LB-TOFMS were 1.2 ppb (3σ/ɛ) and 9.0 ppb (3σ/ɛ), which were enhanced 2.9 times for mercury measurement and 6.7 times for iodine measurement, respectively, compared with that using LIBS because of the different detection features.
Acknowledgments
Author Contributions
Conflict of Interest
References
- Gauderman, W.J.; Gilliland, G.F.; Vora, H.; Avol, E.; Stram, D.; McConnell, R.; Thomas, D.; Lurmann, F.; Margolis, H.G.; Rappaport, E.B.; et al. Association between air pollution and lung function growth in southern California children. Am. J. Respir. Crit. Care Med. 2002, 166, 76–84. [Google Scholar] [CrossRef] [PubMed]
- Arden Pope, C., III; Dockery, D.W. Health effects of fine particulate air pollution: Lines that connect. J. Air Waste Manag. Assoc. 2006, 56, 709–742. [Google Scholar]
- Kampa, M.; Castanas, E. Human health effects of air pollution. Environ. Pollut. 2008, 151, 362–367. [Google Scholar] [CrossRef] [PubMed]
- Hackett, G.A.; Gerdes, K.; Song, X.Y.; Chen, Y.; Shutthanandan, V.; Engelhard, M.; Zhu, Z.H.; Thevuthasan, S.; Gemmen, R. Performance of solid oxide fuel cells operated with coal syngas provided directly from a gasification process. J. Power Sources 2012, 214, 142–152. [Google Scholar] [CrossRef]
- Bao, J.E.; Krishnan, G.N.; Jayaweera, P.; Sanjurjo, A. Effect of various coal gas contaminants on the performance of solid oxide fuel cells: Part III. Synergistic effects. J. Power Sources 2010, 195, 1316–1324. [Google Scholar] [CrossRef]
- Trembly, J.P.; Gemmen, R.S.; Bayless, D.J. The effect of coal syngas containing AsH3 on the performance of SOFCs: Investigations into the effect of operational temperature, current density and AsH3 concentration. J. Power Sources 2007, 171, 818–825. [Google Scholar] [CrossRef]
- Haga, K.; Adachi, S.; Shiratori, Y.; Itoh, K.; Sasaki, K. Poisoning of SOFC anodes by various fuel impurities. Solid State Ion. 2008, 179, 1427–1431. [Google Scholar] [CrossRef]
- Organization, W.H. Air Quality Guidelines for Europe, 2nd ed.; WHO Regional Office for Europe: Copenhagen, Denmark, 2000. [Google Scholar]
- GB13223–2011. In Emission Standard of Air Pollutants for Thermal Power Plants; Ministry of Environmental Protection of the People’s Republic of China: Beijing, China, 2011.
- Landis, M.S.; Stevens, R.K.; Schaedlich, F.; Prestbo, E.M. Development and characterization of an annular denuder methodology for the measurement of divalent inorganic reactive gaseous mercury in ambient air. Environ. Sci. Technol. 2002, 36, 3000–3009. [Google Scholar] [CrossRef] [PubMed]
- Lee, S.J.; Seo, Y.C.; Jang, H.N.; Park, K.S.; Baek, J.I.; An, H.S.; Song, K.C. Speciation and mass distribution of mercury in a bituminous coal-fired power plant. Atmos. Environ. 2006, 40, 2215–2224. [Google Scholar] [CrossRef]
- Wolterbeek, B. Biomonitoring of trace element air pollution: Principles, possibilities and perspectives. Environ. Pollut. 2002, 120, 11–21. [Google Scholar] [CrossRef] [PubMed]
- Imperatoa, M.; Adamob, P.; Naimoa, D.; Arienzob, M.; Stanzionea, D.; Violanteb, P. Spatial distribution of heavy metals in urban soils of Naples city (Italy). Environ. Pollut. 2003, 124, 247–256. [Google Scholar] [CrossRef] [PubMed]
- Li, X.D.; Coles, B.J.; Ramsey, M.H.; Thornton, I. Sequential extraction of soils for multielement analysis by ICP-AES. Chem. Geol. 1995, 124, 109–123. [Google Scholar] [CrossRef]
- Eggins, S.M.; Rudnick, R.L.; McDonough, W.F. The composition of peridotites and their minerals: A laser-ablation ICP–MS study. Earth Planet. Sci. Lett. 1998, 154, 53–71. [Google Scholar] [CrossRef]
- Horn, I.; Rudnick, R.L.; McDonough, W.F. Precise elemental and isotope ratio determination by simultaneous solution nebulization and laser ablation-ICP-MS: Application to U–Pb geochronology. Chem. Geol. 2000, 164, 281–301. [Google Scholar] [CrossRef]
- Matsuura, H.; Hokura, A.; Katsuki, F.; Itoh, A.; Haraguchi, H. Multielement determination and speciation of major-to-trace elements in black tea leaves by ICP-AES and ICP-MS with the aid of size exclusion chromatography. Anal. Sci. 2001, 17, 391–398. [Google Scholar] [CrossRef] [PubMed]
- White, W.M.; Albarède, F; Télouk, P. High-precision analysis of Pb isotope ratios by multi-collector ICP-MS. Chem. Geol. 2000, 167, 257–270. [Google Scholar] [CrossRef]
- Liu, Y.S.; Hu, Z.C.; Gao, S.; Günther, D.; Xu, J.; Gao, C.G.; Chen, H.H. In situ analysis of major and trace elements of anhydrous minerals by LA-ICP-MS without applying an internal standard. Chem. Geol. 2008, 257, 34–43. [Google Scholar] [CrossRef]
- Jurowski, K.; Szewczyk, M.; Piekoszewski, W.; Herman, M.; Szewczyk, B.; Nowak, G.; Walas, S.; Miliszkiewicz, N.; Tobiasz, A.; Dobrowolska-Iwanek, J. A standard sample preparation and calibration procedure for imaging zinc and magnesium in rats’ brain tissue by laser ablation-inductively coupled plasma-time of flight-mass spectrometry. J. Anal. At. Spectrom. 2014, 29, 1425–1431. [Google Scholar] [CrossRef]
- Jurowski, K.; Walas, S.; Piekoszewski, W. A calibration strategy in bioimaging trace elements in rat brain tissue by LA ICP-TOF-MS method. Talanta 2013, 115, 195–199. [Google Scholar] [CrossRef] [PubMed]
- Hondrogiannis, E.M.; Ehrlinger, E.; Poplaski, A.; Lisle, M. Use of laser ablation-inductively coupled plasma-time of flight-mass spectrometry to identify the elemental composition of vanilla and determine the geographic origin by discriminant function analysis. J. Agric. Food Chem. 2013, 61, 11332–11337. [Google Scholar] [CrossRef] [PubMed]
- Deguchi, Y.; Noda, M.; Fukuda, Y.; Ichinose, Y.; Endo, Y.; Inada, M.; Abe, Y.; Iwasaki, S. Industrial applications of temperature and species concentration monitoring using laser diagnostics. Measur. Sci. Technol. 2002, 13, R103–R115. [Google Scholar] [CrossRef]
- Deguchi, Y. Industrial Applications of Laser Diagnostics; CRS Press, Taylor & Francis: New York, NY, USA, 2011. [Google Scholar]
- Miziolek, A.W.; Palleschi, V.; Schechter, I. Laser-Induced Breakdown Spectroscopy (LIBS): Fundamentals and Applications; Cambridge University Press: Cambridge, UK, 2006. [Google Scholar]
- Noll, R. Laser-Induced Breakdown Spectroscopy: Fundamentals and Applications; Springer-Verlag: Berlin/Heidelberg, Germany, 2012. [Google Scholar]
- Hahn, D.W.; Omenetto, N. Laser-induced breakdown spectroscopy (LIBS), Part I: Review of basic diagnostics and plasma-particle interactions: Still-challenging issues within the analytical plasma community. Appl. Spectrosc. 2010, 67, 335A–366A. [Google Scholar] [CrossRef]
- Hahn, D.W.; Omenetto, N. Laser-induced breakdown spectroscopy (LIBS), Part II: Review of instrumental and methodological approaches to material analysis and applications to different fields. Appl. Spectrosc. 2012, 6, 347–419. [Google Scholar] [CrossRef]
- Noda, M.; Deguchi, Y.; Iwasaki, S.; Yoshikawa, N. Detection of carbon content in a high-temperature and high-pressure environment using laser-induced breakdown spectroscopy. Spectrochim. Acta Part B 2002, 57, 701–709. [Google Scholar] [CrossRef]
- Kurihara, M.; Ikeda, K.; Izawa, Y.; Deguchi, Y.; Tarui, H. Optimal boiler control through real-time monitoring of unburned carbon in fly ash by laser-induced breakdown spectroscopy. Appl. Opt. 2003, 42, 6159–6165. [Google Scholar] [CrossRef] [PubMed]
- Ctvrtnickova, T.; Mateo, M.P.; Yañez, A.; Nicolas, G. Laser induced breakdown spectroscopy application for ash characterization for a coal fired power plant. Spectrochim. Acta Part B 2010, 65, 734–737. [Google Scholar] [CrossRef]
- Wang, Z.Z.; Deguchi, Y.; Kuwahara, M.; Taira, T.; Zhang, X.B.; Yan, J.J.; Liu, J.P.; Watanabe, H.; Kurose, R. Quantitative elemental detection of size-segregated particles using laser-induced breakdown spectroscopy. Spectrochim. Acta Part B 2013, 87, 130–138. [Google Scholar] [CrossRef]
- Wang, Z.Z.; Deguchi, Y.; Kuwahara, M.; Yan, J.J.; Liu, J.P. Enhancement of laser-induced breakdown spectroscopy (LIBS) detection limit by low pressure and short pulse laser-induced plasma process. Appl. Spectrosc. 2013, 67, 1242–1251. [Google Scholar] [CrossRef] [PubMed]
- Noll, R.; Mönch, I.; Klein, O.; Lamott, A. Concept and operating performance of inspection machines for industrial use based on laser-induced breakdown spectroscopy. Spectrochim. Acta Part B 2005, 60, 1070–1075. [Google Scholar] [CrossRef]
- Gaft, M.; Sapir-Sofer, I.; Modiano, H.; Stana, R. Laser induced breakdown spectroscopy for bulk minerals online analyses. Spectrochim. Acta Part B 2007, 62, 1496–1503. [Google Scholar] [CrossRef]
- Boué-Bigne, F. Laser-induced breakdown spectroscopy applications in the steel industry: Rapid analysis of segregation and decarburization. Spectrochim. Acta Part B 2008, 63, 1122–1129. [Google Scholar] [CrossRef]
- Cho, H.H.; Kim, Y.J.; Jo, Y.S.; Kitagawa, K.; Arai, N.; Lee, Y.I. Application of laser-induced breakdown spectrometry for direct determination of trace elements in starch-based flours. J. Anal. At. Spectrom. 2001, 16, 622–627. [Google Scholar] [CrossRef]
- Pouzar, M.; Černohorský, T.; Průšová, M.; Prokopčáková, P.; Krejčová, A. LIBS analysis of crop plants. J. Anal. At. Spectrom. 2009, 24, 953–957. [Google Scholar] [CrossRef]
- Samek, O.; Beddows, D.C.S.; Telle, H.H.; Kaiser, J.; Liška, M.; Cáceres, J.O.; Gonzáles Ureña, A. Quantitative laser-induced breakdown spectroscopy analysis of calcified tissue samples. Spectrochim. Acta Part B 2001, 56, 865–875. [Google Scholar] [CrossRef]
- Thareja, R.K.; Sharma, A.K.; Shukla, S. Spectroscopic investigations of carious tooth decay. Med. Eng. Phys. 2008, 30, 1143–1148. [Google Scholar] [CrossRef] [PubMed]
- Porizka, P.; Prochazkova, P.; Prochazka, D.; Sladkova, L.; Novotny, J.; Petrilak, M.; Brada, M.; Samek, O.; Pilat, Z.; Zemanek, P.; et al. Algal biomass analysis by laser-based analytical techniques—A review. Sensors 2014, 14, 17725–17752. [Google Scholar] [CrossRef] [PubMed]
- Vitkova, G.; Prokes, L.; Novotny, K.; Porizka, P.; Novotny, J.; Vsiansky, D.; Celko, L.; Kaiser, J. Comparative study on fast classification of brick samples by combination of principal component analysis and linear discriminant analysis using stand-off and table-top laser-induced breakdown spectroscopy. Spectrochim. Acta Part B 20 2014, 101, 191–199. [Google Scholar] [CrossRef]
- Porizka, P.; Demidov, A.; Kaiser, J.; Keivanian, J.; Gornushkin, I.; Panne, U.; Riedel, J. Laser-induced breakdown spectroscopy for in situ qualitative and quantitative analysis of mineral ores. Spectrochim. Acta Part B 20 2014, 101, 155–163. [Google Scholar] [CrossRef]
- Rehse, S.J.; Salimnia, H.; Miziolek, A.W. Laser-induced breakdown spectroscopy (LIBS): An overview of recent progress and future potential for biomedical applications. J. Med. Eng. Technol. 2012, 36, 77–89. [Google Scholar] [CrossRef] [PubMed]
- Kaiser, J.; Novotny, K.; Martin, M.Z.; Hrdlicka, A.; Malina, R.; Hartl, M.; Adam, V.; Kizek, R. Trace elemental analysis by laser-induced breakdown spectroscopy-Biological applications. Surf. Sci. Rep. 2012, 67, 233–243. [Google Scholar] [CrossRef]
- Gittins, C.M.; Castaldi, M.J.; Senkan, S.M.; Rohlfing, E.A. Real-time quantitative analysis of combustion-generated polycyclic aromatic hydrocarbons by resonance-enhanced multiphoton ionization time-of-flight mass spectrometry. Anal. Chem. 1997, 69, 286–293. [Google Scholar] [CrossRef] [PubMed]
- Heger, H.J.; Zimmermann, R.; Dorfner, R.; Beckmann, M.; Griebel, H.; Kettrup, A.; Boesl, U. On-line emission analysis of polycyclic aromatic hydrocarbons down to pptv concentration levels in the flue gas of an incineration pilot plant with a mobile resonance-enhanced multiphoton ionization time-of-flight mass spectrometer. Anal. Chem. 1999, 71, 46–57. [Google Scholar] [CrossRef] [PubMed]
- Bente, M.; Sklorz, M.; Streibel, T.; Zimmermann, R. Thermal desorption-multiphoton ionization time-of-flight mass spectrometry of individual aerosol particles: A simplified approach for online single-particle analysis of polycyclic aromatic hydrocarbons and their derivatives. Anal. Chem. 2009, 81, 2525–2536. [Google Scholar] [CrossRef] [PubMed]
- Gullett, B.K.; Touati, A.; Oudejans, L.; Ryan, S.P. Real-time emission characterization of organic air toxic pollutants during steady state and transient operation of a medium duty diesel engine. Atmos. Environ. 2006, 40, 4037–4047. [Google Scholar] [CrossRef]
- Deguchi, Y.; Tanaka, N.; Tsuzaki, M.; Fushimi, A.; Kobayashi, S.; Tanabe, K. Detection of components in nanoparticles by resonant ionization and laser breakdown time-of-flight mass spectrometry. Environ. Chem. 2008, 5, 402–412. [Google Scholar] [CrossRef]
- Dobashi, S.; Yamaguchi, Y.; Izawa, Y.; Deguchi, Y.; Wada, A.; Hara, M. Laser mass spectrometry: Rapid analysis of polychlorinated biphenyls in exhaust gas of disposal plants. J. Environ. Eng. 2007, 2, 25–34. [Google Scholar] [CrossRef]
- Deguchi, Y.; Dobashi, S.; Fukuda, N.; Shinoda, K.; Morita, M. Real-time PCB monitoring using time-of-flight mass spectrometry with picosecond laser ionization. Environ. Sci. Technol. 2003, 37, 4737–4742. [Google Scholar] [CrossRef] [PubMed]
- Dobashi, S.; Yamaguchi, Y.; Izawa, Y.; Wada, A.; Hara, M. Safety management by use of laser mass spectrometry of polychlorinated biphenyls (PCBs) in the processed gas and work environment of a PCB disposal plant. J. Mater. Cycles Waste Manag. 2009, 11, 148–154. [Google Scholar] [CrossRef]
- Pignone, M.; Greth, K.M.; Cooper, J.; Emerson, D.; Tang, J. Identification of mycobacteria by matrix-assisted laser desorption ionization–time-of-flight mass spectrometry. J. Clin. Microbiol. 2006, 44, 1963–1970. [Google Scholar] [CrossRef] [PubMed]
- Hazen, T.H.; Martinez, R.J.; Chen, Y.F.; Lafon, P.C.; Garrett, N.M.; Parsons, M.B.; Bopp, C.A.; Sullards, M.C.; Sobecky, P.A. Rapid identification of vibrio parahaemolyticus by whole-cell matrix-assisted laser desorption ionization–time of flight mass spectrometry. Appl. Environ. Microbiol. 2009, 75, 6745–6756. [Google Scholar] [CrossRef] [PubMed]
- Phuoc, T.X. Laser-induced spark ignition fundamental and applications. Opt. Lasers Eng. 2006, 44, 351–397. [Google Scholar] [CrossRef]
- Cristoforetti, G.; Tognoni, E.; Gizzi, L.A. Thermodynamic equilibrium states in laser-induced plasmas: From the general case to laser-induced breakdown spectroscopy plasmas. Spectrochim. Acta Part B 2013, 90, 1–22. [Google Scholar] [CrossRef]
- Glumac, N.; Elliott, G. The effect of ambient pressure on laser-induced plasmas in air. Opt. Lasers Eng. 2007, 45, 27–35. [Google Scholar] [CrossRef]
- Wang, Z.Z.; Deguchi, Y.; Yan, J.J.; Liu, J.P. Rapid detection of mercury and iodine using laser breakdown time-of-flight mass spectrometry. Spectrosc. Lett. 2015, 48, 128–138. [Google Scholar] [CrossRef]
- Sansonetti, C.J.; Salit, M.L.; Reader, J. Wavelengths of spectral lines in mercury pencil lamps. Appl. Opt. 1996, 35, 74–77. [Google Scholar] [CrossRef] [PubMed]
- Herzberg, G. Molecular Spectra and Molecular Structure, 2nd ed.; Van Nostrand Reinhold Company: New York, NY, USA, 1950; p. 558. [Google Scholar]
- Minnhagen, L. The energy levels of neutral atomic iodine. Ark. Fys. 1962, 21, 415–465. [Google Scholar]
- Moore, C.E. Selected tables of atomic spectra, atomic energy levels and multiplet tables—N I, N II, N III. In National Standard Reference Series—National Bureau of Standards; National Bureau of Standards: Washington, DC, USA, 1975. [Google Scholar]
- Moore, C.E. Selected tables of atomic spectra, atomic energy levels and multiplet tables—C I, C II, C III, C IV, C V, C VI. In National Standard Reference Series—National Bureau of Standards; National Bureau of Standards: Washington, DC, USA, 1970. [Google Scholar]
- Sullivan, F.J. Strontium lines in arc and solar spectra. Univ. Pittsburgh. Bull. 1938, 35, 1–8. [Google Scholar]
- Gerginov, V.; Tanner, C.E.; Diddams, S.; Bartels, A.; Hollberg, L. High-resolution spectroscopy with a femtosecond laser frequency comb. Opt. Lett. 2005, 30, 1734–1736. [Google Scholar] [CrossRef] [PubMed]
- Wang, Z.Z.; Deguchi, Y.; Kuwahara, M.; Zhang, X.B.; Yan, J.J.; Liu, J.P. Sensitive measurement of trace mercury using low pressure laser-induced plasma. Jpn. J. Appl. Phys. Part 1 2013, 52. 11NC05. [Google Scholar]
- Lazzari, C.; de Rosa, M; Rastelli, S.; Ciucci, A.; Palleschi, V.; Salvetti, A. Detection of mercury in air by time-resolved laser-induced breakdown spectroscopy techique. Laser Part. Beams 1994, 12, 525–530. [Google Scholar] [CrossRef]
- Gleason, R.L.; Hahn, D.W. The effects of oxygen on the detection of mercury using laser-induced breakdown spectroscopy. Spectrochim. Acta Part B 2001, 56, 419–430. [Google Scholar] [CrossRef]
- Lubman, D.M. Lasers and Mass Spectrometry; Oxford University Press: Oxford, UK, 1990. [Google Scholar]
- Zhang, X.B.; Deguchi, Y.; Wang, Z.Z.; Yan, J.J.; Liu, J.P. Sensitive detection of iodine by low pressure and short pulse laser-induced breakdown spectroscopy (LIBS). J. Anal. At. Spectrom. 2014, 29, 1082–1089. [Google Scholar] [CrossRef]
© 2015 by the authors; licensee MDPI, Basel, Switzerland. This article is an open access article distributed under the terms and conditions of the Creative Commons Attribution license (http://creativecommons.org/licenses/by/4.0/).
Share and Cite
Wang, Z.; Deguchi, Y.; Yan, J.; Liu, J. Comparison of the Detection Characteristics of Trace Species Using Laser-Induced Breakdown Spectroscopy and Laser Breakdown Time-of-Flight Mass Spectrometry. Sensors 2015, 15, 5982-6008. https://doi.org/10.3390/s150305982
Wang Z, Deguchi Y, Yan J, Liu J. Comparison of the Detection Characteristics of Trace Species Using Laser-Induced Breakdown Spectroscopy and Laser Breakdown Time-of-Flight Mass Spectrometry. Sensors. 2015; 15(3):5982-6008. https://doi.org/10.3390/s150305982
Chicago/Turabian StyleWang, Zhenzhen, Yoshihiro Deguchi, Junjie Yan, and Jiping Liu. 2015. "Comparison of the Detection Characteristics of Trace Species Using Laser-Induced Breakdown Spectroscopy and Laser Breakdown Time-of-Flight Mass Spectrometry" Sensors 15, no. 3: 5982-6008. https://doi.org/10.3390/s150305982