
Towards a Dynamic Clamp for Neurochemical Modalities

 , and
, and 
Abstract
: The classic dynamic clamp technique uses a real-time electrical interface between living cells and neural simulations in order to investigate hypotheses about neural function and structure. One of the acknowledged drawbacks of that technique is the limited control of the cells' chemical microenvironment. In this manuscript, we use a novel combination of nanosensor and microfluidic technology and microfluidic and neural simulations to add sensing and control of chemical concentrations to the dynamic clamp technique. Specifically, we use a microfluidic lab-on-a-chip to generate distinct chemical concentration gradients (ions or neuromodulators), to register the concentrations with embedded nanosensors and use the processed signals as an input to simulations of a neural cell. The ultimate goal of this project is to close the loop and provide sensor signals to the microfluidic lab-on-a-chip to mimic the interaction of the simulated cell with other cells in its chemical environment.1. Introduction
The original dynamic clamp technique uses a real-time electrical interface between living cells and neural simulations in order to investigate hypotheses about neural function and structure [1,2]. It has been applied successfully to dissect the functionality of single neurons and small neural circuits. However, it has two major drawbacks [3]: the electrodes can clamp electrically only a small section of a cell and, hence, frequently do not control the electrical state of whole cells; and all control to-date has been concentrated on the electric properties of neurons, neglecting their chemical state. As noted in [3], the latter has been done by necessity, since until recently, registering or controlling the chemical state of either neurons or the chemical environment in which they reside has been essentially impossible with the level of precision needed to simulate the appropriate dynamics of the various extracellular chemical players. In this manuscript, we present an analogue to the dynamic clamp method, which includes the simulation and control of the effects of chemicals associated with neural signaling. To achieve that, we use the emergent discipline of microfluidics [4,5], which deals specifically with the behavior, manipulation and precise control of fluids at the microscale. The long-term goal of this project is a device as outlined in Figure 1, in which cell cultures or slices (cells) co-exist and interact with neural models. We report the initial steps and results on this project.
Our complex dynamic clamp system is enabled by innovations in microfluidics and sensor technology, especially by embedded, on-chip sensors. Advances in lab-on-a-chip microfluidic systems have demonstrated great potential to revolutionize biomedical research. Novel devices have been developed for drug delivery [6], neuron manipulation [7–9] and immune assays [10,11]. As more functions are integrated into one stand-alone lab-on-a-chip system, each component needs to be miniaturized while maintaining the same performance. As a result, nanosensors made of nanomaterials have become an ideal candidate. Single-walled carbon nanotubes (SWCNTs) are well known for their outstanding electrical, mechanical and chemical properties. They are particularly suitable for biosensing applications due to their large surface areas and high electrical conductivity. Their tubular structure provides a large number of sites for aqueous or gaseous molecules to absorb and react. The absorption of molecules alters the electrical property of the nanotube, resulting in a detectable resistance change. This phenomenon enables label-free detection, and the required measurement system is typically simpler and less expensive. On the other hand, many microfluidic devices have been developed to precisely stimulate neurons on a chip, and most of them use well-patterned electrodes [12,13]. In terms of chemical stimulation, segmented co-culture chambers have been used to separate fluids, so that specific chemical cues can be applied to regions of interest [14,15]. However, to our knowledge, micro-spatiotemporal variations in chemical cues have yet to be exploited for neuroscience applications.
In this manuscript, we present the results of experiments and simulations of fluid flow with changing Ca2+ concentrations and their effects on simulations of neural cells with Ca2+-selective channels. Ca2+ is a universal signaling molecule in the nervous system [16,17]. Typically, it is considered a vital intracellular second messenger. However, the existence of cell-surface detectors for extracellular Ca2+ indicate that it functions as an extracellular signaling molecule, as well. According to [18], cells become major sources and sinks for Ca2+ during cytoplasmic Ca2+ signaling events, because of the activation of Ca2+ export (e.g., by the plasma membrane Ca2+, ATPase, PMCA) and by Ca2+ entry (e.g., by store-operated channels). Although these processes ultimately balance, transient spatiotemporal gradients of extracellular Ca2+ can be generated during normal operation. In addition to its physiological significance, we chose to use Ca2+ because it is also easy to handle in the microfluidic devices (as water-soluble CaCl2). Furthermore, the dissociation of Ca2+ in water provided an ionic solution, which could be registered with the currently available set of sensors in the microfluidic lab-on-a-chip. However, the techniques developed in this manuscript can be used with most other neuromodulators, allowing for the recreation of the natural dynamics of the extracellular medium, which so far has been inaccessible. We instantiate some of the chemical simulations on chip and present the response of the neural simulation to the measured Ca2+ concentration. Currently, we have not yet closed the loop, in which the neural simulation will drive the control signals that determine the extracellular concentration of neuromodulators (like Ca2+ here).
2. Experimental Section
2.1. Microfluidic Lab-on-a-Chip
Microfluidics is an emerging technology that deals with the behavior, precise control and manipulation of fluids at the microscale [4,5]. Microfluidics technology enables the novel concept of lab-on-a-chip that aims at integrating one or more functions on a single chip of a few centimeters in size for chemical and biological experiments [19–22].
2.1.1. Lab-on-a-Chip Design
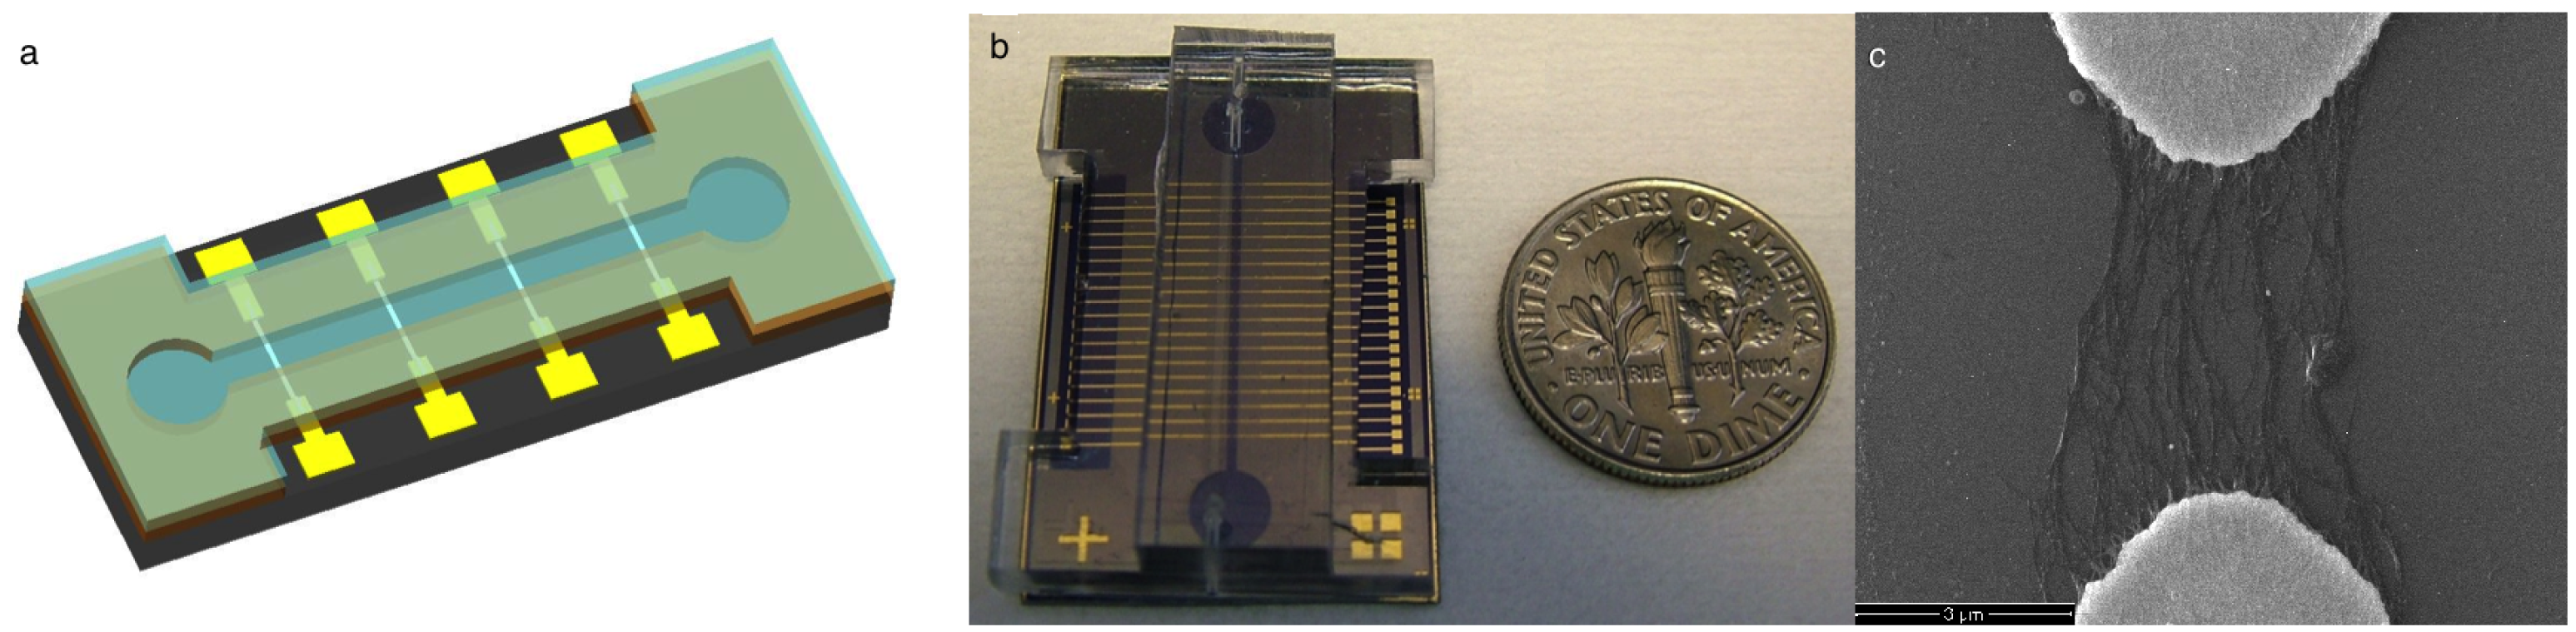
The main experimental system consists of the microfluidic chip shown in Figure 2. Such a chip is able to generate various concentration configurations. The chip also contains an array of carbon nanotube-based nanosensors that can respond selectively to changes in concentrations of ions. The proposed use of this chip is to introduce single ionic species through the corresponding channels and to register their concentrations with the on-chip nanosensors.
The microfluidic device is based on our recently-reported lab-on-a-chip system, which is fabricated with standard lithography and bonding methods [23,24]. In the fabrication process, a silicon wafer serves as the substrate and is cut into 2 cm × 3 cm pieces with a dicing saw machine. Multi-teeth electrodes with a 5 μm gap are used to ensure the controlled dielectrophoresis (DEP) alignment of nanosensors. The electrodes are fabricated by patterning metal layers of Cr and Au on the silicon wafer surface through metal sputtering, optical lithography and wet etching. Then, the negative photoresist SU-8 3050 is spin-coated onto the Si surface as the second layer, which contains all of the microfluidic components. The predesigned microchannels are transferred from the photomask to the SU-8 layer with UV lithography. The protected SU-8 layer under the photomask is dissolved in the SU-8 developer, leaving only the exposed, cross-linked SU-8 structure, which encloses the micro-channel network used in the device. The last step is bonding a piece of PDMS to SU-8 to form a sealed channel. Surface treatment is necessary in the bonding step [25]. Oxygen plasma and 5% 3-aminopropyltriethoxysilane (APTES) solution are used for the SU-8 surface treatment, which introduces amine (Si-NH2) groups onto the surface. For PDMS, oxygen plasma is used to generate silanol (Si-OH) groups. The covalent bonds of Si-O-Si formed by amine and silanol chemical groups bond the SU-8 and PDMS tightly.
The SWCNT nanosensors are integrated into the sealed microfluidic device after the SU-8-PDMS bonding. This integration is enabled by the in-channel dielectrophoresis process. A small volume of SWCNT dispersion is injected into the microchannel. An AC signal, with a frequency of 5 MHz and a peak-to-peak voltage of 10 V, is applied across a pair of electrodes to generate an electric field in the solution. This field induces electric dipole moments in dispersed SWCNTs and forces them to rotate along the electric field lines. The SWCNTs are eventually “captured” by the dielectrophoretic forces and land on the substrate. As the SWCNTs bridge the gap between the electrode pair, they become a part of the circuit and change the distribution of the electric field. This change creates a small potential drop of 0.5–2 V between the electrode pair, which can be visually observed on an oscilloscope.
The lab-on-a-chip system with predesigned microfluidic structures can precisely control the fluids in our system. The schematic structure of the microfluidic device is illustrated in Figure 2a, and the optical image of a fabricated device is shown in Figure 2b. Scanning electron microscopy (SEM) inspection shows that the SWCNTs are aligned between electrodes, as shown in Figure 2c. The SWCNTs are in the form of small bundles, and they are only observed near the electrode tips. This demonstrates that the dielectrophoresis process is an “active” approach to deposit SWCNTs, only placing them on locations with the strongest electric fields. This device, slightly larger than a dime, consists of an inlet, an outlet, a microfluidic channel and an electrode array with integrated nanosensors. It was fabricated to experimentally test the performance of the ion sensors, as described in next section. The new mixer also presented in this work will be attached to the device to create the desired conditions.
2.1.2. Sensor Design
Calcium ion sensors have been investigated previously using various approaches. Among them, ion-selective electrodes have proven to be an effective method for Ca2+ detection [26,27]. Membranes inside these electrodes allow calcium ions to pass through for selective detection. In addition, such calcium ion sensors have been successfully integrated into microfluidic devices for real-time detection [27]. In this work, we use a similar configuration with SWCNTs as the integrated nanosensors in a microfluidic system [28].
2.1.3. Flow Simulations
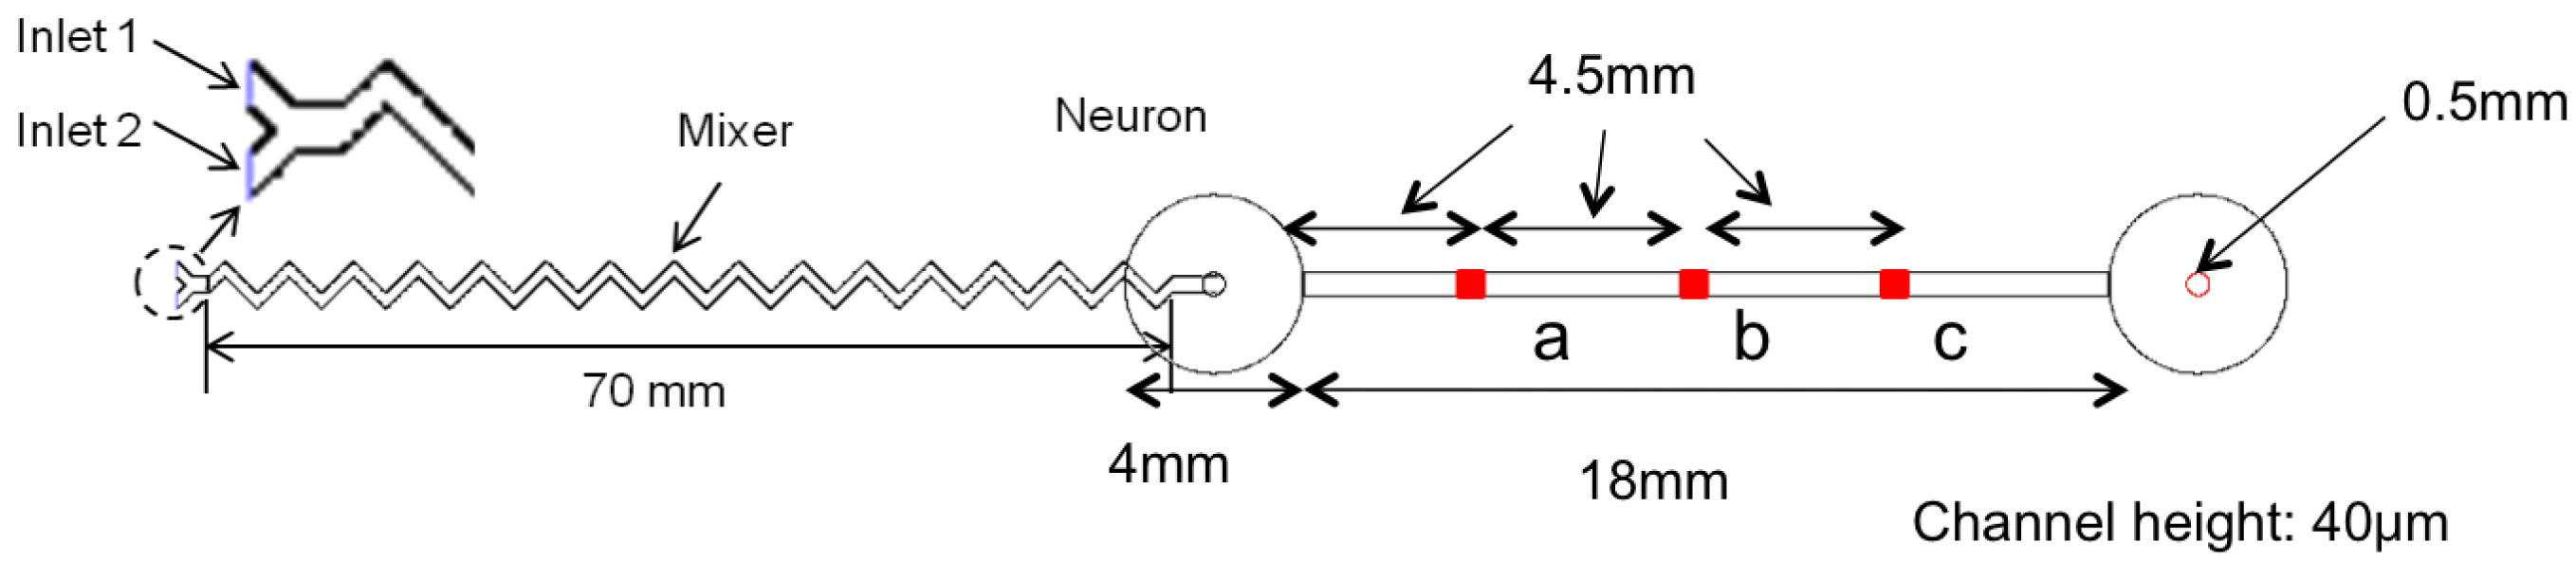
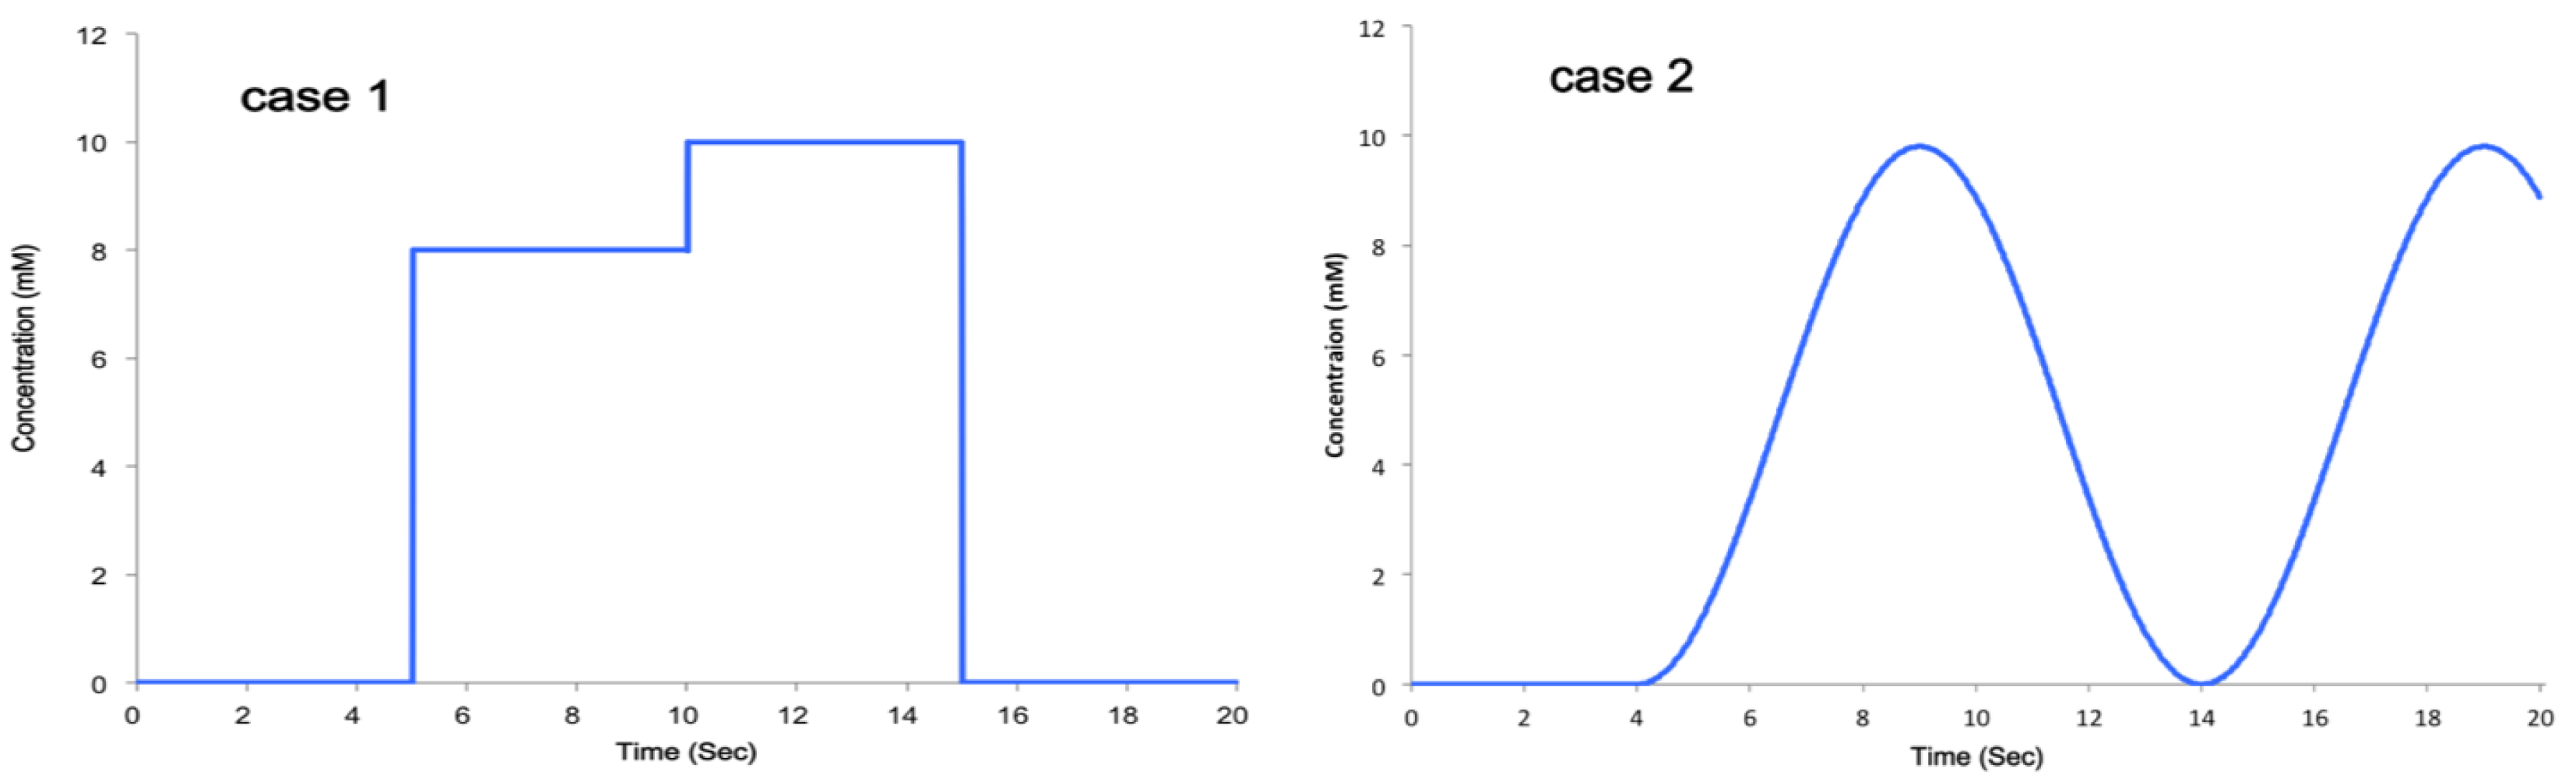
In order to predict the distribution of specific chemicals inside a microfluidic chip and to select appropriate geometries for the specific neurochemical dynamic clamp task, we used 3D CFD (computational fluid dynamics) techniques. In this study, the commercial software FLUENT® 6.3 [29] was used to build the computational domain and the models for the microfluidic chip by using the finite element method (FEM). This method is suitable for simulating complex microfluidic flows, as demonstrated in our previous study [30]. Figure 3 shows the shape and dimensions of the microfluidic chip used in the experiment. The computational domain for the simulations consisted of 536,920 cells, 1,535,298 faces and 409,040 nodes. Navier–Stokes and diffusion-convection equations were employed to predict the flow and diffusion of the selected ion. The first-order schemes were used because they are known to provide better convergence of calculations than the second-order ones, although they provide less accurate results due to propagated error in numerical calculations. The SIMPLEC algorithm, as implemented in [29], was used for pressure-velocity coupling. An unsteady laminar flow model was selected since the concentration of the ion in the flow varied by time, and the maximum Reynolds number was less than 100. The flow in the microfluidic chip was assumed to be incompressible, non-isothermal and laminar for numerical calculation. Ca2+ was chosen as a target ion. Two cases of simulation were conducted by varying the concentration of the Ca2+ ion, as shown in Figure 4. The flow rate was fixed to 0.3 mL/min, the same as in the experimental conditions.
2.2. Neural Models
The Hodgkin–Huxley (HH) model is a mathematical model describing the behavior of a patch of a membrane neuron in which action potentials can be produced under certain conditions. The patch is considered mainly as a lipid bilayer, mostly impermeable, with certain proteins embedded in it considered as voltage-gated ion channels. This model is well understood and allows us to test the effects of the proposed novel engineering system without confounding them with novel effects in a neuronal model.
The system is modeled as a circuit where a capacitance Cm represents the bilayer, and the non-linear conductances for Na+ and K+ represent the voltage-gated channels. There is also a constant “leak” conductance, for which IL = gL(V − EL) would correspond to the passive flow of ions through non-gated channels [31]. The conductances representing the Na+ and K+ voltage-dependent channels are gNa = ḡNam(V)3h(V) and gK = ḡKn(V)4, where ḡNa and ḡK are the maximum values that the conductances can take. Therefore, by using certain gating variables m, h, n, which represent the fraction of a certain gate's type opened, it is possible to calculate the probability of a K+ channel being opened as proportional to n4, since this is composed of four identical gates and similarly for a Na+ channel as proportional to m3h, composed of four gates, three of them identical.
Each of the gating variables satisfies a first order differential equation:
With all of this in mind, the equation for the circuit is:
2.2.1. Calcium Channels
We focus our attention on a model in which, in addition to sodium and potassium channels, calcium channels are also considered [31]. The model would be described by the following system of equations, adding calcium channel dynamics to the standard HH model:
Usually, it is assumed that the intracellular and extracellular concentrations are constant during the process. Here, however, we want to keep track of the Ca2+ concentration dynamics. First, we express the explicit dependence of the ionic current on concentration through Icfe. Next, we consider the dynamics of the intracellular concentration, by adding the following equation to the model:
The first term is just a conversion from current to concentration flux, with γ = 0.002 μM·cm2/(ms·μA). This value is based on measurements done by [32] in cortical pyramidal neurons. The second term is δ([x]) = ([x] − [Ca]in)/τ, where τ is the inverse of the pumping rate. It can be seen that the effect of coupling the Ca2+ concentration dynamics to the rest of the system is negligible if we use the same values for the parameters as in [31] and baseline intracellular Ca2+ concentration [Ca]in = 10−4. However, if the external Ca2+ concentration [Ca]out changes in Equation (7), as we propose to simulate here, [Ca]in and the model state can change, as well.
3. Results and Discussion
3.1. Microfluidic Simulations
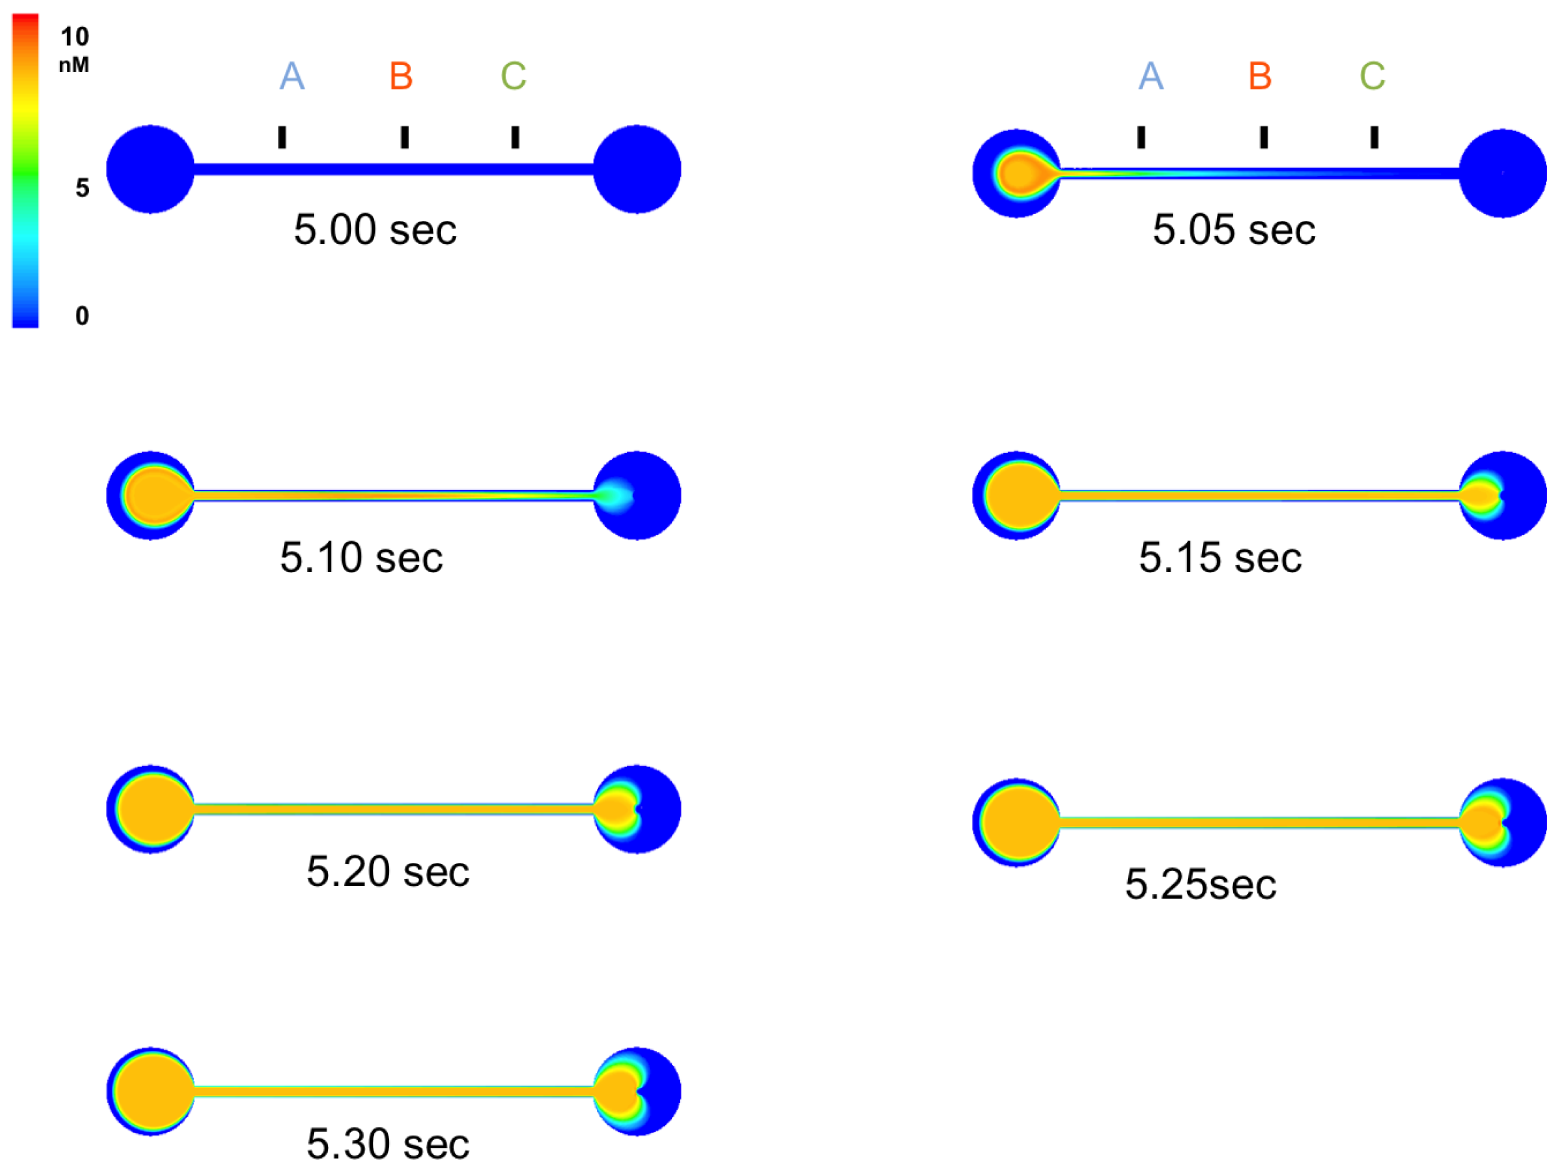
Figure 5 shows simulations of the flow dynamics within the device, after injection of a target concentration profile from Case 1 starting at 5.00 s. Subsequent frames track the distribution of increased concentration throughout the device. Figure 6 shows the concentration of Ca2+ ion at Points A, B and C, detailed in Figure 3. In Case 1, it took 5.10 s to achieve the initial maximum concentration at A, 5.14 s at B and 5.18 s at C, as expected from constant laminar flow. In Case 2, it took 8.93 s to achieve the maximum concentration at A, 8.97 s at B and 9.01 s at C. In this case, the trend was almost the same as Case 1; however, the concentration at A showed exactly the same shift from C, because the flow rate was fixed. This will be good for more precise control of the gradient and demonstrates the needed precision for flow rate control. The result from all test cases showed it was possible to control the concentration gradient at specific points by varying the flow.
3.2. Neural Simulations
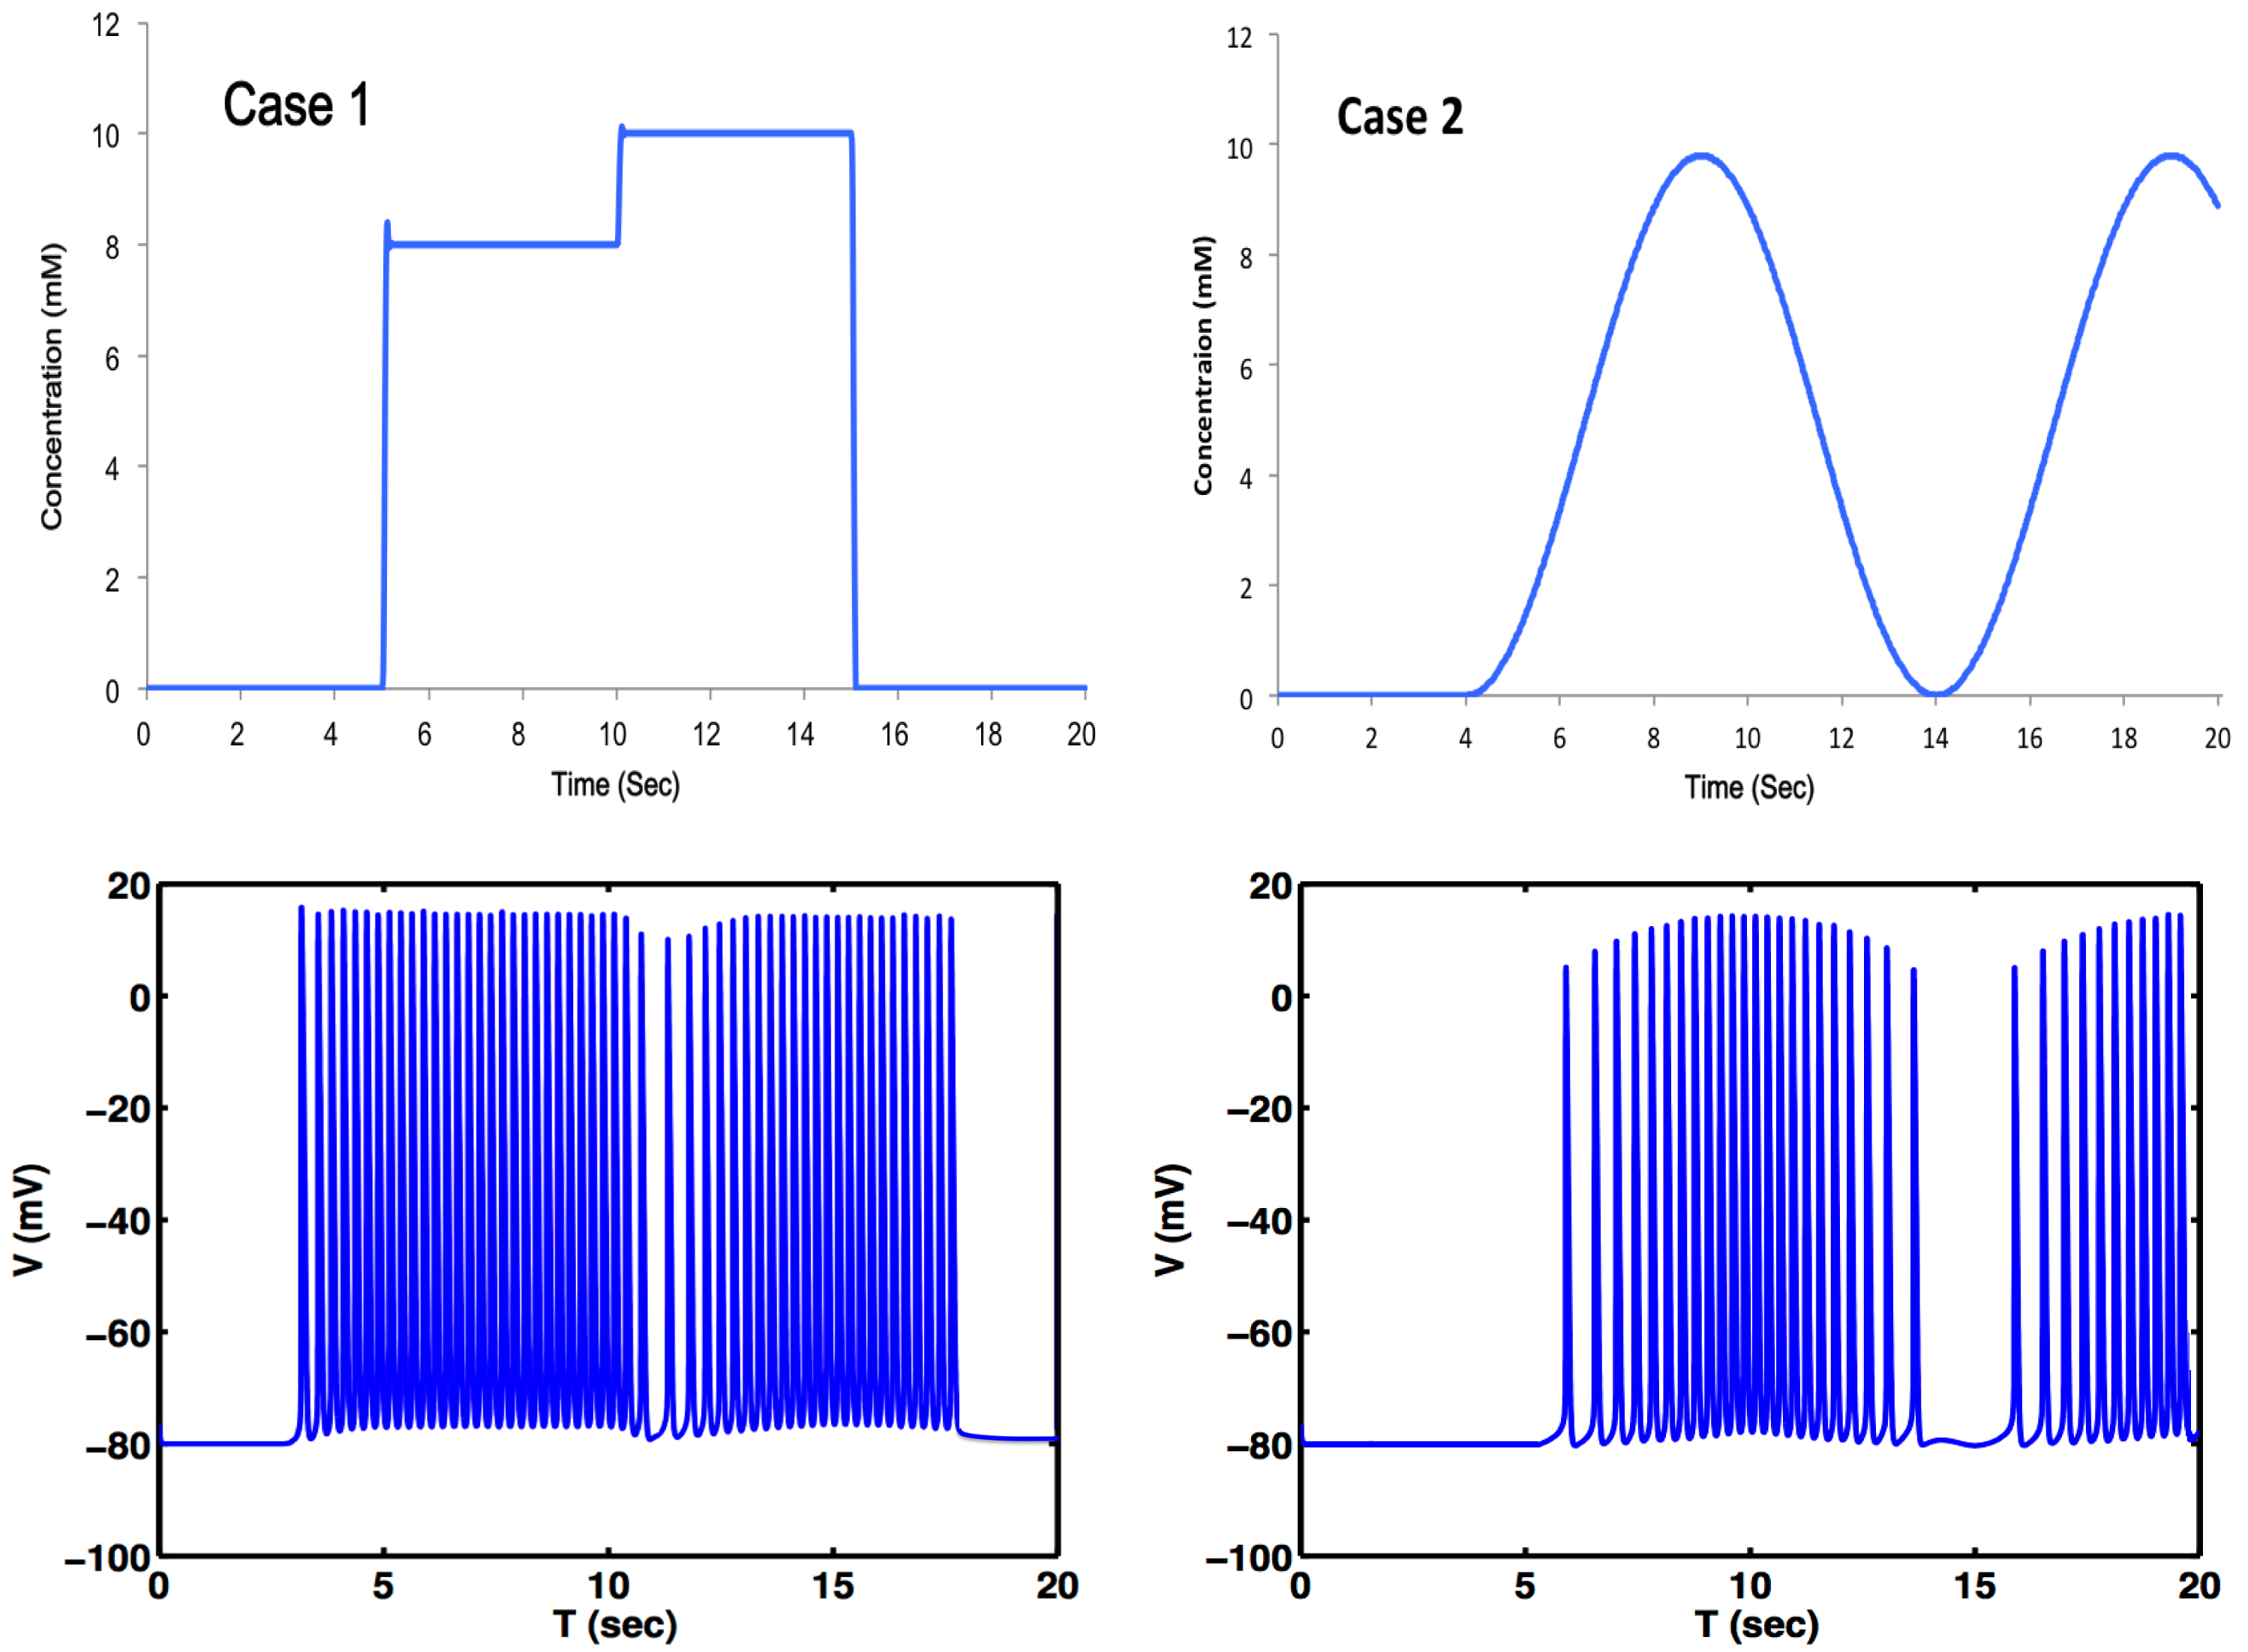
We used the simulated Ca2+ concentration above as input to the neural models outlined in the Experimental Section. Our goal was to test whether changes in the Ca2+ concentration, like those triggered by signaling of other neurons or glial cells, could lead to changes in the activity of the modeled neuron. We show the results of these simulations as applied to the concentration signals in Figure 6 at Point A.
The bursting activity seen in Figure 7 is typically associated with changes to the neuron's membrane potential. The simulations in Figure 7 demonstrate that neural activity can be not only modulated, but also triggered by extracellular chemical concentrations.
3.3. Microfluidic Experiments
Testing solutions with different Ca2+ concentrations are obtained by mixing CaCl2 and deionized water in different volume ratios. During our experiment, two different solutions with concentrations of 8 mM and 10 mM are used. In order to monitor the real-time nanosensor's resistance caused by the different ionic solutions, a continuous flow of these aqueous solutions is injected into the micro-channel by a high-precision programmable syringe pump. To stimulate Case 1, an air bubble is introduced between these two solutions in the flow-feeding tube in order to eliminate unwanted mixing.
For generating dynamic flow, like that in Case 2, we use coupled syringe pumps. Two syringe pumps were programmed to work in synchronization, such that the analyte concentration can be varied at a constant total flow-rate. For this to occur, the individual pumps are operated with a phase between them. The sum of the flow-rate of the two fluid streams is a constant at any given instance of time. More complicated signals with various analytes (neurotransmitters, drugs and ions) can be generated by programming the pumps accordingly for a controlled neuronal stimulation.
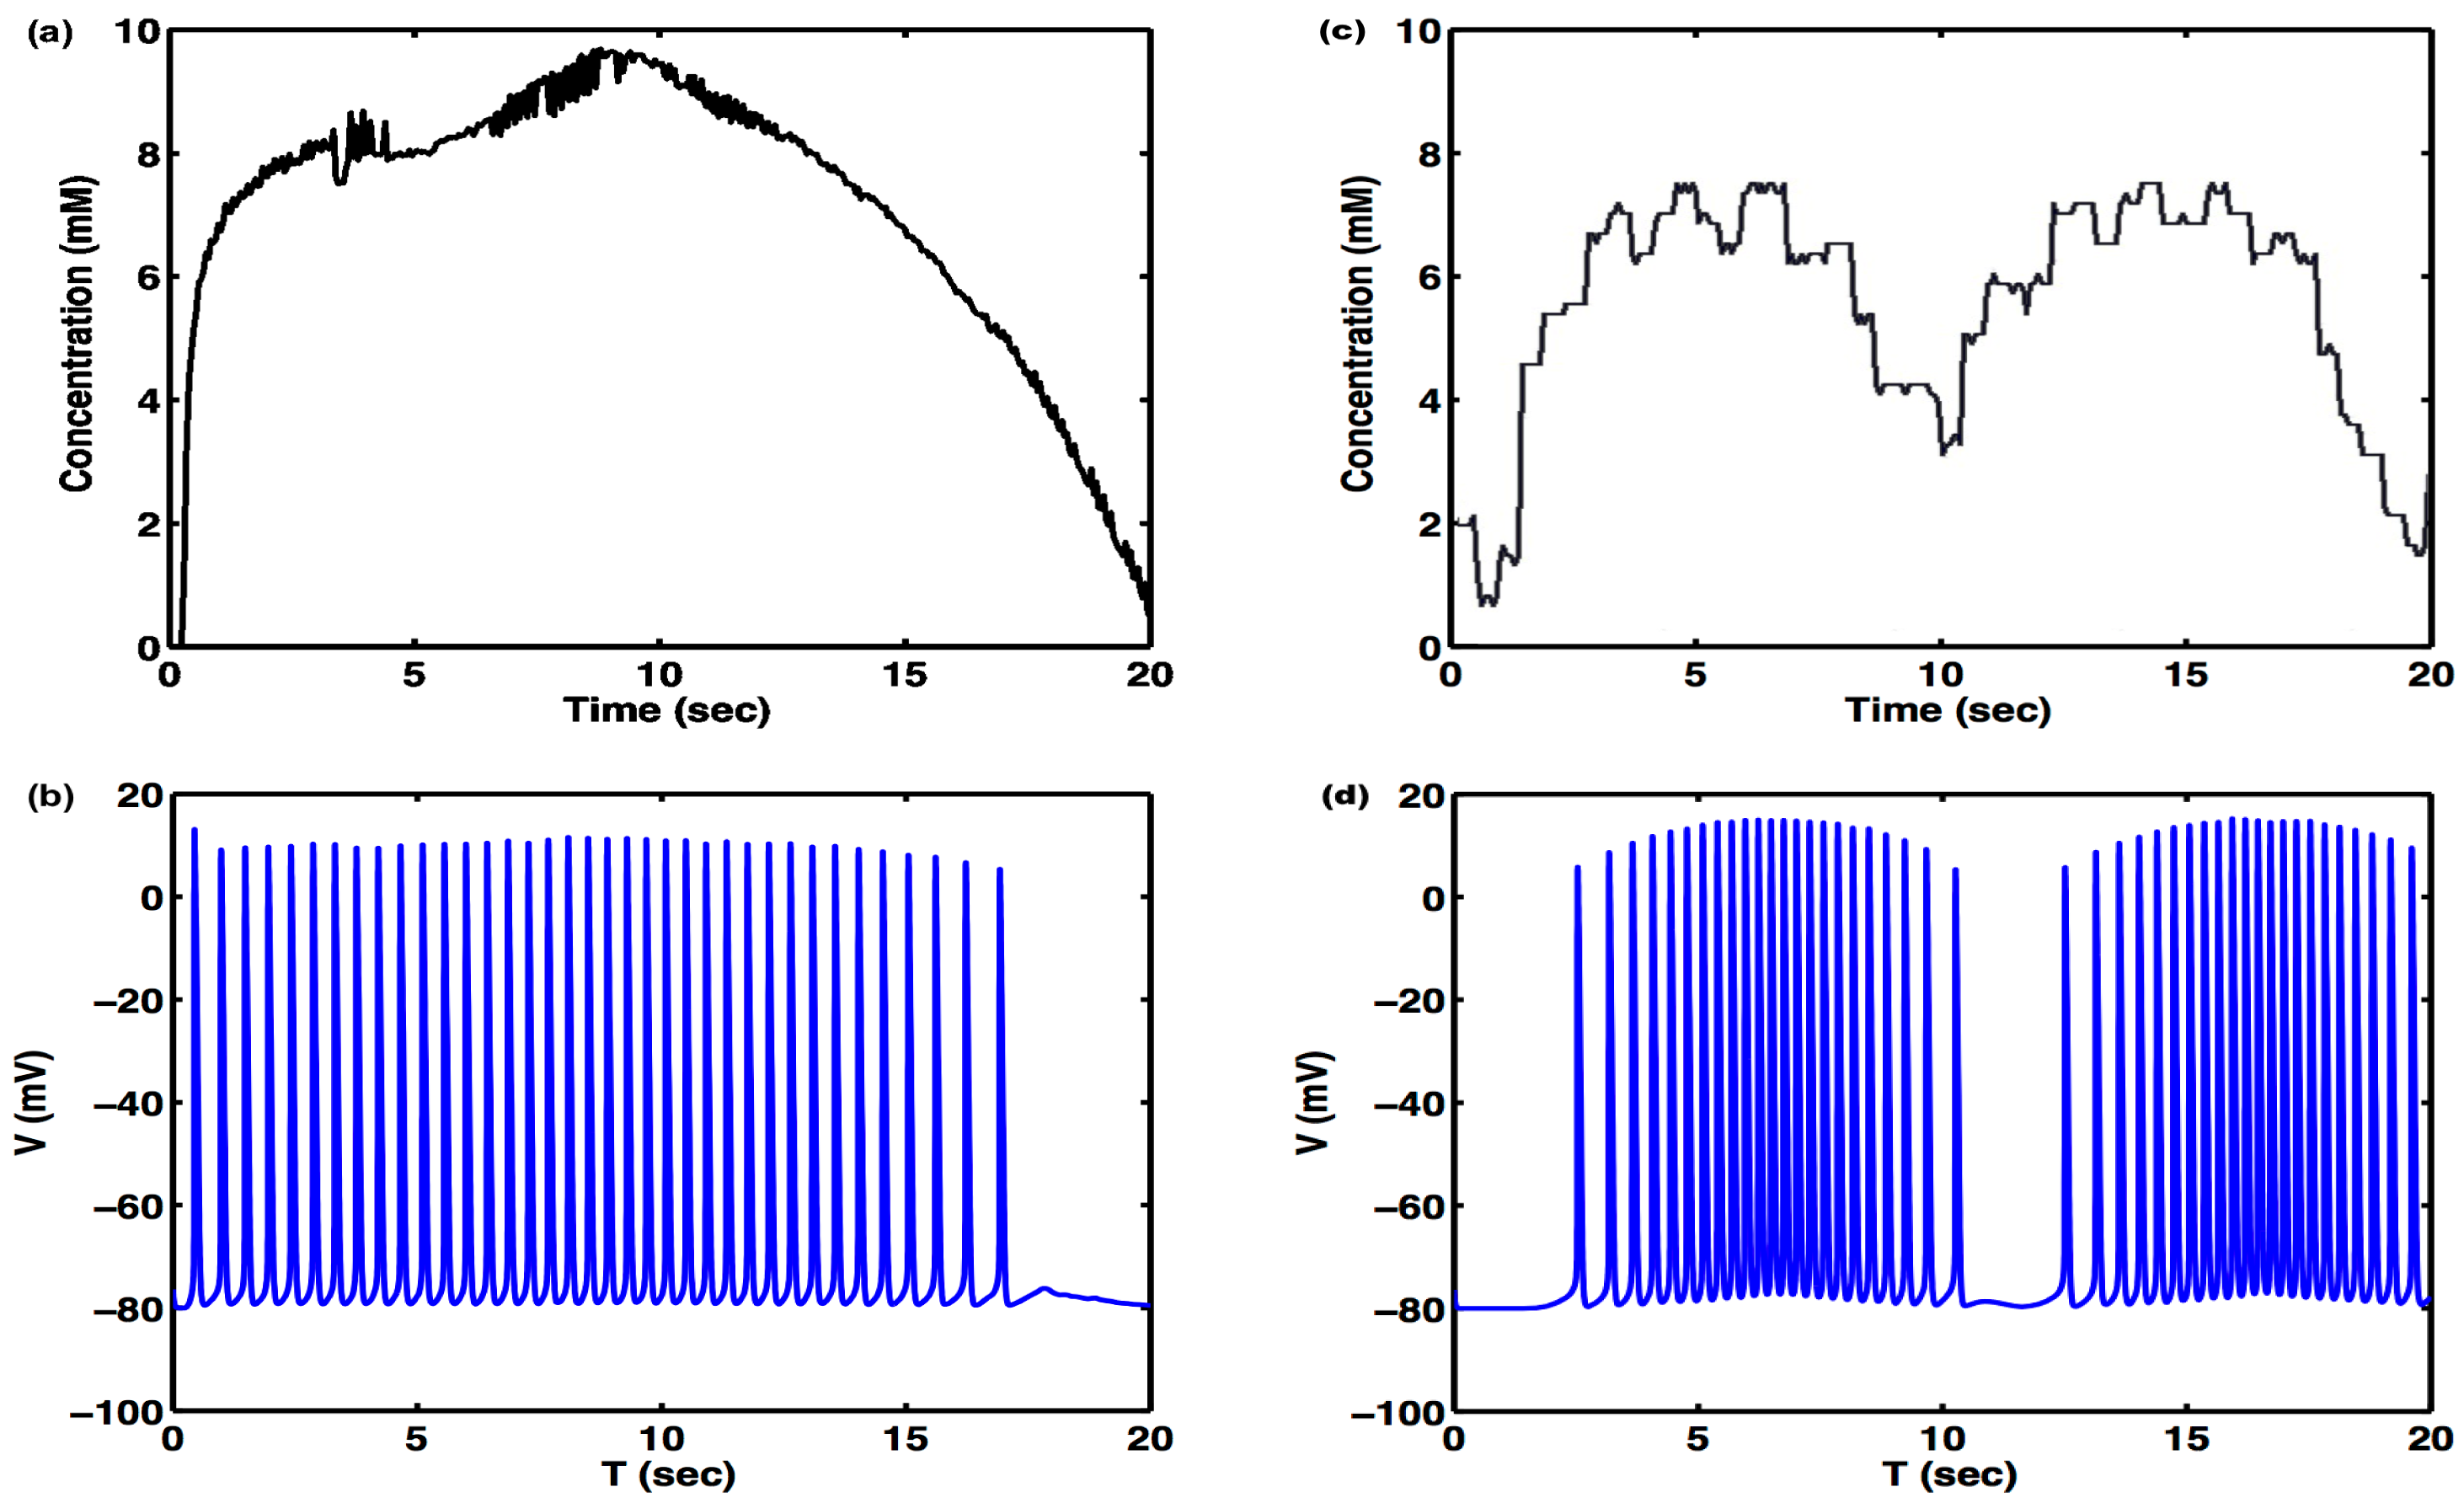
A semiconductor device analyzer is connected to the nanosensor on the microfluidic device for the real-time resistance measurement. In this experiment, the flow rate is precisely controlled at 0.3 mL/min, and the current-voltage (I-V) characteristics of the SWCNT sensors are obtained with the semiconductor device analyzer. Under the steady flow condition, the resistance of the SWCNT nanosensor increases as the Ca2+ concentration increases. The resulting concentration profile was effectively equivalent to Case 1 in Figure 7, except for the smaller scale and added small step between 8 and 10 mM concentrations. The resultant concentration profile is shown in Figure 8a. The outcome of the dynamic simulation, with a sinusoidal driving signal similar to Case 2 in Figure 7, is shown in Figure 8c.
3.4. Neural Simulations
The experimentally-induced and measured Ca2+ concentration, shown in Figure 8a, was used as an input for the external Ca2+ concentration of Equation (5). The resulting simulated response is shown in (b) of the same figure. A neural response was observed similar to the firing pattern for Case 1 in Figure 7, as expected, due to the similarity between observed concentrations of Ca2+ and the simulated concentrations shown in Figure 7a. The experimentally-induced and measured sinusoidal Ca2+ concentration, shown in Figure 8c, was used as an input for the external Ca2+ concentration of Equation (5). The resulting simulated response is shown in ( d) of the same figure. A neural response was observed similar to the firing pattern for Case 2 of Figure 7, as expected, due to the similarity between observed concentrations of Ca2+ and the simulated concentrations shown in Figure 7a.
3.5. Discussion
The chemical dynamic clamp is a promising new technology that will extend the power of the dynamic clamp method to the realm of neurochemical and neuromodulatory control and analysis of neural function. It will also provide an alternative method for the study of interactions between neurons and other tissues, which occur predominantly through chemical channels. The device and methods developed here take the initial steps in that direction.
The main impetus behind this work was our desire, as part of a bigger team, to understand the role of glia in the functioning of biological neural networks, specifically in the process of sleep [33,34]. Since glia interact with neurons and one another predominantly chemically, we are striving to build a tool that will allow us to manipulate chemical concentrations based on the function of glial and neural networks, as well as models of those functions with which to test our theories of neuro-glial interactions. The ultimate goal of this project will be to, for example, model a glial network and then instantiate the chemical outputs of such a network with the chemical dynamic clamp device proposed here, in order to test hypothesized effects of glia on neural cells. This experiment will be contrasted with the dynamics of a complete neuro-glial network, in which neurons and glia interact naturally.
In this manuscript, we demonstrate the benefits and drawbacks of using a microfluidic lab-on-a-chip as the mechanism through which a chemical dynamic clamp can be modulated. We simulated chip geometries and designs and their effects on Ca2+ flow inside the chip chambers. We show that the lab can maintain essentially a uniform concentration in the working volume; other approaches, like creating a concentration gradient, are also possible.
The design that we investigated showed the importance of mixing on the functionality of the chip [35]. The simulations used an effective mixer [36]; however, good mixing was achieved only after a prohibitively long mixer structure (and corresponding reaction delay) was introduced. Thus, for the actual experiments, we used a simplified microfluidic lab with specific concentrations prepared in advance. The situation can be remedied through the use of a bubble mixer [37]; however, that is too complex to simulate at the moment.
The work demonstrated the need for improved sensors with which to register the concentration of the controlled substance throughout the microfluidic chip. Since the outputs of these sensors are used as inputs to simulations and model-based microfluidic control, it is of paramount importance to have fast, reliable ways of registering these quantities. The current implementation of carbon nanosensors [24] was insufficient for the task, since it was too slow and noisy. We are preparing improvements to those nanosensors and investigating the use of well-established molecular probes [38] as an alternative sensing mechanism. Another consideration for integrated nanosensors is that they need to provide sufficient selectivity in addition to high sensitivity. Testing samples in a fluidic microenvironment contain multiple types of ions and electroactive entities. It is critical for the nanosensors to accurately identify and quantify each substance from a complex mixture. The simultaneous detection of multiple entities by sensors has been investigated previously using different approaches [39–41]. Among them, multiplexed electrochemical sensing can be used in our SWCNT nanosensors [42,43]. Functionalization by specific enzymes or receptors on the nanotube surface can enable high selectivity for each nanosensor. An array of specifically functionalized nanosensors can provide multiplexed sensing abilities, ideal for neurochemical applications.
The neural simulations with either simulated Ca2+ concentration (Figure 7) or measured Ca2+ concentration (Figure 8) demonstrate that neural activity can not only be modulated, but also triggered by extracellular chemical dynamics, opening new venues of research in the functional properties and information transmission of single neurons and biological neural networks.
Acknowledgements
This research is supported in part by funding from the Alcohol and Drug Abuse Research Program of Washington State University to A.G.D. and by a DARPA Young Faculty Award Grant N66001-11-1-4127 to J.X.
Author Contributions
Xue and Xu designed and manufactured the lab-on-a-chip. Kwon designed, performed and analyzed the microfluidic simulations. Rivera and Dimitrov coded, executed and analyzed the neural models. Hashmi, Rivera, Yu, Zhao and Gao performed the experimental work and preliminary data processing. Rivera, Hashmi and Kwon contributed equally substantially to the work and are listed as the first co-authors. All authors participated in writing the manuscript.
Conflicts of Interest
The authors declare no conflict of interest.
References
- Sharp, A.A.; O'Neil, M.B.; Abbott, L.F.; Marder, E. The dynamic clamp: Artificial conductances in biological neurons. Trends Neurosci. 1993, 16, 389–394. [Google Scholar]
- Sharp, A.A.; O'Neil, M.B.; Abbott, L.F.; Marder, E. Dynamic Clamp: Computer-Generated Conductances in Real Neurons. J. Neurophysiol. 1993, 69, 992–995. [Google Scholar]
- Prinz, A.A.; Cudmore, R.H. Dynamic clamp. Scholarpedia 2011, 6, 1470. [Google Scholar]
- Squires, T.M.; Quake, S.R. Microfluidics: Fluid physics at the nanoliter scale. Rev. Mod. Phys. 2005, 77, 977–1026. [Google Scholar]
- Xu, J.; Attinger, D. Drop on demand in a microfluidic chip. J. Micromech. Microeng. 2008, 18, 065020. [Google Scholar] [CrossRef]
- Lavan, D.A.; McGuire, T.; Langer, R. Small-scale systems for in vivo drug delivery. Nat. Biotechnol. 2003, 21, 1184–1191. [Google Scholar]
- Park, J.W.; Kim, H.; Kang, M.; Jeon, N. Advances in microfluidics-based experimental methods for neuroscience research. Lab Chip 2013, 13, 509–521. [Google Scholar]
- Soe, A.K.; Nahavandi, S.; Khoshmanesh, K. Neuroscience goes on a chip. Biosens. Bioelectron. 2012, 35, 1–13. [Google Scholar]
- Wang, J.; Ren, L.; Li, L.; Liu, W.; Zhou, J.; Yu, W.; Tong, D.; Chen, S. Microfluidics: A new cosset for neurobiology. Lab Chip 2009, 9, 644–652. [Google Scholar]
- Jiang, H.; Weng, X.; Li, D. Microfluidic whole-blood immunoassays. Microfluid. Nanofluid. 2011, 10, 941–964. [Google Scholar]
- Xu, J. Microfluidics ,lab-on-a-chipsystem- for food chemical hazard detection. In Food Chemical Hazard Detection: Development and Application of New Technologies; John Wiley & Sons, Inc.: Hoboken, NJ, USA, 2014; pp. 263–289. [Google Scholar]
- Bareket-Keren, L.; Hanein, Y. Carbon nanotube-based multi electrode arrays for neuronal interfacing: Progress and prospects. Front. Neural Circuits 2012. [Google Scholar] [CrossRef]
- Hallfors, N.; Khan, A.; Dickey, M.; Taylor, A. ntegration of pre-aligned liquid metal electrodes for neural stimulation within a user-friendly microfluidic platform. Lab Chip 2013, 13, 522–526. [Google Scholar]
- Park, J.; Koito, H.; Li, J.R.; Han, A. Multi-compartment neuron-glia co-culture platform for localized CNS axon-glia interaction study. Lab Chip 2012, 12, 3296–3304. [Google Scholar]
- Taylor, A.M.; Blurton-Jones, M.; Rhee, S.W.; Cribbs, D.H.; Cotman, C.W.; Jeon, N.L. A microfluidic culture platform for CNS axonal injury, regeneration and transport. Nat. Methods 2005, 2, 599–605. [Google Scholar]
- Berridge, M.J.; Lipp, P.; Bootman, M.D. The versatility and universality of calcium signalling. Nat. Rev. Mol. Cell Biol. 2000, 1, 11–21. [Google Scholar]
- Bootman, M.D.; Collins, T.J.; Peppiatt, C.M.; Prothero, L.S.; MacKenzie, L.; de Smet, P.; Travers, M.; Tovey, S.C.; Seo, J.T.; Berridge, M.J.; et al. Calcium signalling—An overview. Semin. Cell Dev. Biol. 2001, 12, 3–10. [Google Scholar]
- Hofer, A.M. Another dimension to calcium signaling: A look at extracellular calcium. J. Cell Sci. 2005, 118, 855–862. [Google Scholar]
- Figeys, D.; Pinto, D. Lab-on-a-chip: A revolution in biological and medical sciences. Anal. Chem. 2000, 72, 330A–335A. [Google Scholar]
- Haeberle, S.; Zengerle, R. Microfluidic platforms for lab-on-a-chip applications. Lab Chip 2007, 7, 1094–1110. [Google Scholar]
- Hashmi, A.; Yu, G.; Reilly-Collette, M.; Heiman, G.; Xu, J. Oscillating Bubbles: A Versatile Tool for Lab on a Chip Applications. Lab Chip 2012. [Google Scholar] [CrossRef]
- Stone, H.A.; Stroock, A.D.; Ajdari, A. Engineering Flows in Small Devices: Microfluidics Toward a Lab-on-a-Chip. Ann. Rev. Fluid Mech. 2004, 36, 381–411. [Google Scholar]
- Lei, N.; Li, P.; Xue, W.; Xu, J. Simple graphene chemiresistors as pH sensors: Fabrication and characterization. Meas. Sci. Technol. 2011, 22, 107002. [Google Scholar]
- Li, P.; Lei, N.; Sheadel, D.A.; Xu, J.; Xue, W. Integration of Nanosensors into a Sealed Microchannel in a Hybrid Lab-on-a-Chip Device. Sens. Actuators B Chem. 2012, 166–167, 751–759. [Google Scholar]
- Zhao, J.; Sheadel, D.A.; Xue, W. Surface treatment of polymers for the fabrication of all-polymer MEMS devices. Sens. Actuators A Phys. 2012. [Google Scholar] [CrossRef]
- Bakker, E.; Diamond, D.; Lewenstam, A.; Pretsch, E. Ion sensors: Current limits and new trends. Anal. Chim. Acta 1999, 393, 11–18. [Google Scholar]
- Lin, C.F.; Wang, C.H.; Liao, W.Y.; Chou, T.C.; Lee, G.B. Hydrogen and calcium ion electrochemical detecting systems using microfluidic technology. Micro Nano Lett. 2006, 1, 29–33. [Google Scholar]
- Li, P.; Xue, W. Selective Deposition and Alignment of Single-Walled Carbon Nanotubes Assisted by Dielectrophoresis: From Thin Films to Individual Nanotubes. Nanoscale Res. Lett. 2010, 5, 1072–1078. [Google Scholar]
- FLUENT 6.3 User's Guide.; Fluent Inc.: Lebanon, NH, USA, 2006.
- Kwon, H.J.; Xu, Y.; Solovitz, S.A.; Xue, W.; Dimitrov, A.G.; Coffin, A.B.; Xu, J. Design of a microfluidic device with a non-traditional flow profile for on-chip damage to zebrafish sensory cells. J. Micromech. Microeng. 2014, 24, 017001. [Google Scholar]
- Ermentrout, B.; Terman, D. Mathematical Foundations of Neuroscience.; Springer: Berlin, Germany, 2010. [Google Scholar]
- Helmchen, F.; Imoto, K.; Sakmann, B. Ca2+ buffering and action potential-evoked Ca2+ signaling in dendrites of pyramidal neurons. Biophys. J. 1996, 70, 1069–1081. [Google Scholar]
- Clinton, J.M.; Davis, C.J.; Zielinski, M.R.; Jewett, K.A.; Krueger, J.M. Biochemical regulation of sleep and sleep biomarkers. J. Clin. Sleep Med. 2011, 7, S38–S42. [Google Scholar]
- Wisor, J.P.; Schmidt, M.A.; Clegern, W.C. Evidence for neuroinflammatory and microglial changes in the cerebral response to sleep loss. Sleep 2011, 34, 261–272. [Google Scholar]
- Hashmi, A.; Xu, J. On the Quantification of Mixing in Microfluidics. J. Lab. Autom. 2014, 19, 488–491. [Google Scholar]
- Capretto, L.; Cheng, W.; Hill, M.; Zhang, X. Micromixing within Microfluidic Devices. Top. Curr. Chem. 2011, 304, 27–68. [Google Scholar]
- Xu, J.; Attinger, D. Control and ultrasonic actuation of a gas-liquid interface in a microfluidic chip. J. Micromech. Microeng. 2007, 17, 609–616. [Google Scholar]
- Williams, D.; Fay, F. Intracellular calibration of the fluorescent calcium indicator Fura-2. Cell Calcium 1990, 11, 75–83. [Google Scholar]
- Kintzios, S.; Marinopoulou, I.; Moschopoulou, G.; Mangana, O.; Nomikou, K.; Endo, K.; Papanastasiou, I.; Simonian, A. Development of a novel, multi-analyte biosensor system for assaying cell division: Identification of cell proliferation/death precursor events. Biosens. Bioelectron. 2006, 21, 1365–1373. [Google Scholar]
- Taitt, C.R.; Shriver-Lake, L.C.; Ngundi, M.M.; Ligler, F.S. Array biosensor for toxin detection: Continued advances. Sensors 2008, 8, 8361–8377. [Google Scholar]
- Wu, G.; Datar, R.H.; Hansen, K.M.; Thundat, T.; Cote, R.J.; Majumdar, A. Bioassay of prostate-specific antigen (PSA) using microcantilevers. Nat. Biotechnol. 2001, 19, 856–860. [Google Scholar]
- Wang, J. Electrochemical biosensors: Towards point-of-care cancer diagnostics. Biosens. Bioelectron. 2006, 21, 1887–1892. [Google Scholar]
- Yan, J.; Pedrosa, V.A.; Simonian, A.L.; Revzin, A. Immobilizing enzymes onto electrode arrays by hydrogel photolithography to fabricate multi-analyte electrochemical biosensors. ACS Appl. Mater. Interfaces 2010, 2, 748–755. [Google Scholar]


© 2015 by the authors; licensee MDPI, Basel, Switzerland. This article is an open access article distributed under the terms and conditions of the Creative Commons Attribution license ( http://creativecommons.org/licenses/by/4.0/).
Share and Cite
Rivera, C.M.; Kwon, H.-J.; Hashmi, A.; Yu, G.; Zhao, J.; Gao, J.; Xu, J.; Xue, W.; Dimitrov, A.G. Towards a Dynamic Clamp for Neurochemical Modalities. Sensors 2015, 15, 10465-10480. https://doi.org/10.3390/s150510465
Rivera CM, Kwon H-J, Hashmi A, Yu G, Zhao J, Gao J, Xu J, Xue W, Dimitrov AG. Towards a Dynamic Clamp for Neurochemical Modalities. Sensors. 2015; 15(5):10465-10480. https://doi.org/10.3390/s150510465
Chicago/Turabian StyleRivera, Catalina Maria, Hyuck-Jin Kwon, Ali Hashmi, Gan Yu, Jiheng Zhao, Jianlong Gao, Jie Xu, Wei Xue, and Alexander G. Dimitrov. 2015. "Towards a Dynamic Clamp for Neurochemical Modalities" Sensors 15, no. 5: 10465-10480. https://doi.org/10.3390/s150510465