1. Introduction
Cyber-Physical Systems (CPS) aim at developing cross-domain solutions from the interaction of the physical world, the world made of real daily objects like cars, buildings, robots, medical wearable devices, traffic lights and so on, and the virtual world, the world where computational representations of such objects exist. CPS will enable the readily development of applications for smart transportation, e-Health, smart grid and factories of the future domains, among others, by orchestrating, managing and controlling the physical objects and their emergent behavior by means of their virtual computational representation.
In recent years, advances in wireless communication technologies and their benefits [
1], have entailed a greater application of these technologies for supporting communication in CPS. Thus, the Wireless Sensors Networks (WSN), a well-known wireless technology that connects sensors and actuators, are becoming part of large CPS. The WSN aims at monitoring a physical system and relaying data to a targeted processing element. However, as mentioned in [
2] and considering the CPS overall design requirements in [
3] and the time requirements to be fulfilled when interacting with physical objects [
4], there are relevant challenges that WSN have to overcome in order to be fully integrable in CPS, and the energy consumption and the communication reliability are two important aspects targeted in this paper.
Reliability of wireless communications can be affected by several factors such as the environment, the frequency and modulation used, and even the orientation of the sensor antenna introduces radio irregularities [
5]. In the current available literature is possible to find several studies that analyze the level of influence of some of these factors in wireless communication, also suggesting methods and techniques to address them and thus improve the reliability and robustness of wireless communication technologies.
Kotian
et al. [
6] have been working on the problem of Transmission Power Control (TPC) for WSN by measuring the Received Signal Strength Indicator (RSSI) in order to analyze the link quality between the nodes and comparing different filtering techniques for link quality prediction. Mahmood
et al. [
7] have studied the reliability of protocols used in WSN concluding among other things that cross layer design should be further exploited to achieve reliability. Kusy
et al. [
8] proposed a dual radio network architecture to improve communication reliability in WSN, with a minor increase in energy consumption.
The research and development carried out in this work are based on the hypothesis that the adaptive connectivity between wireless nodes in the network and a certain number of neighboring nodes, improves reliability of the network communications. The main scientific and technical contributions are the use of intelligent control techniques, such as fuzzy control, for developing the adaptation strategy and its validation in a physical scenario.
The theoretical foundations for the proposed contributions has been introduced in a previous work [
9]. Briefly, the likelihood for a node in a WSN to reach the WSN sink, which collects and processes the nodes data, depends on the number of neighbors. A higher number of neighbors implies a higher likelihood. In [
9] you can find the rationale for an optimal number of neighbors that guarantees an acceptable likelihood. The optimal number of neighbors depends on the WSN deployment area and the density of nodes (number of nodes per m2). Therefore, each WSN node should adapt its power transmission to guarantee the WSN optimal number of neighbors, thus achieving a better energy saving. The current work goes an step forward by presenting the results under the basement of empirical evidences and by also applying engineering methodologies for the design and development process.
The organization of this work are presented as follows:
Section 2 presents the system design,
Section 3 describes the experiments and the equipment that has been used,
Section 4 analizes the obtained results and finally, some conclusions about the work results are shown in
Section 5.
2. System Design
The system presented in this section is a WSN comprised of several SunSPOT [
10] nodes, a product manufactured by Oracle. It is an outcome from the authors participation in the European research project “Design, Monitoring, and Operation of Adaptive Networked Embedded Systems” (DEMANES). It aims at improving the overall energy consumption of the network while keeping communication reliability and computational resources usage among acceptable boundaries. As mentioned previously, communication reliability and energy consumption are some of the WSN key aspects that could prevent it from being suitable for CPS based applications.
The software modules deployed in the SunSPOT nodes are based on the control system design that is depicted in
Figure 1 and fully described in [
9]. It accomplishes a self-adaptive system through two feedback control loops as suggested by Yuriy Brun
et al., in [
11].
Figure 1.
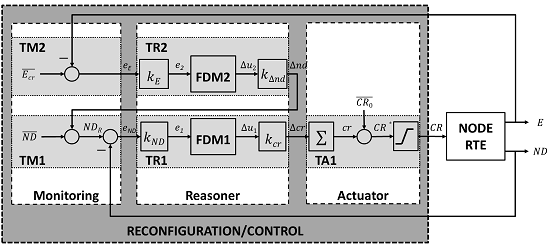
Control system design for self-adapting the Wireless Sensors Networks (WSN) nodes transmission power considering the number of neighbors and the battery level.
Figure 1.
Control system design for self-adapting the Wireless Sensors Networks (WSN) nodes transmission power considering the number of neighbors and the battery level.
A primary feedback control loop consists of tasks
TM1,
TR1 and
TA1 in
Figure 1 and manages the node transmission power considering both its real and targeted number of neighbors. A secondary feedback control loop consists of tasks
TM2 and
TR2 in
Figure 1 and manages the node targeted number of neighbors considering the battery level. The objectives of each task are:
TM1 is run periodically at a frequency discussed in the following sections. It calculates the node targeted number of neighbors by adding the WSN optimal value and the change to be applied estimated by TR2, based on the battery level. Then samples the real number of neighbors ND using the node run-time environment, calculates the difference () between the real and the targeted number of neighbors and decides if the TR1 must be triggered.
TR1 decides the change to be applied on the node transmission power so that the real and the targeted number of neighbors of the node become equals or quite similar.
TR1 decision is driven by
FDM1.
FDM1 is a decision making function based on fuzzy logic, depicted in
Figure 2b and briefly explained below. Finally
TR1 is executed when
TM1 considers appropriate.
TA1 effectively establishes the node transmission power based on the
TR1 output. It is always run once
TR1 finishes.
in
Figure 1 is the initial value for the node transmission power. The
TR1 consecutive outputs are increments or decrements that
TA1 adds up to get the desired transmission power as a deviation from
. The last building block in
TA1 guarantees that the transmission power will be a value supported by the node run-time environment.
TM2 is run periodically at a frequency discussed in the following sections. It samples the node real battery level E using the node run-time environment, computes as the difference between the critical battery level and the real battery level and triggers TR2.
TR2 decides the change (
) to be applied to the WSN optimal number of neighbors
, thus influencing
TM1. The decision making process is driven by
FDM2, a decision making function based on fuzzy logic depicted in
Figure 2b and briefly explained below.
Figure 2.
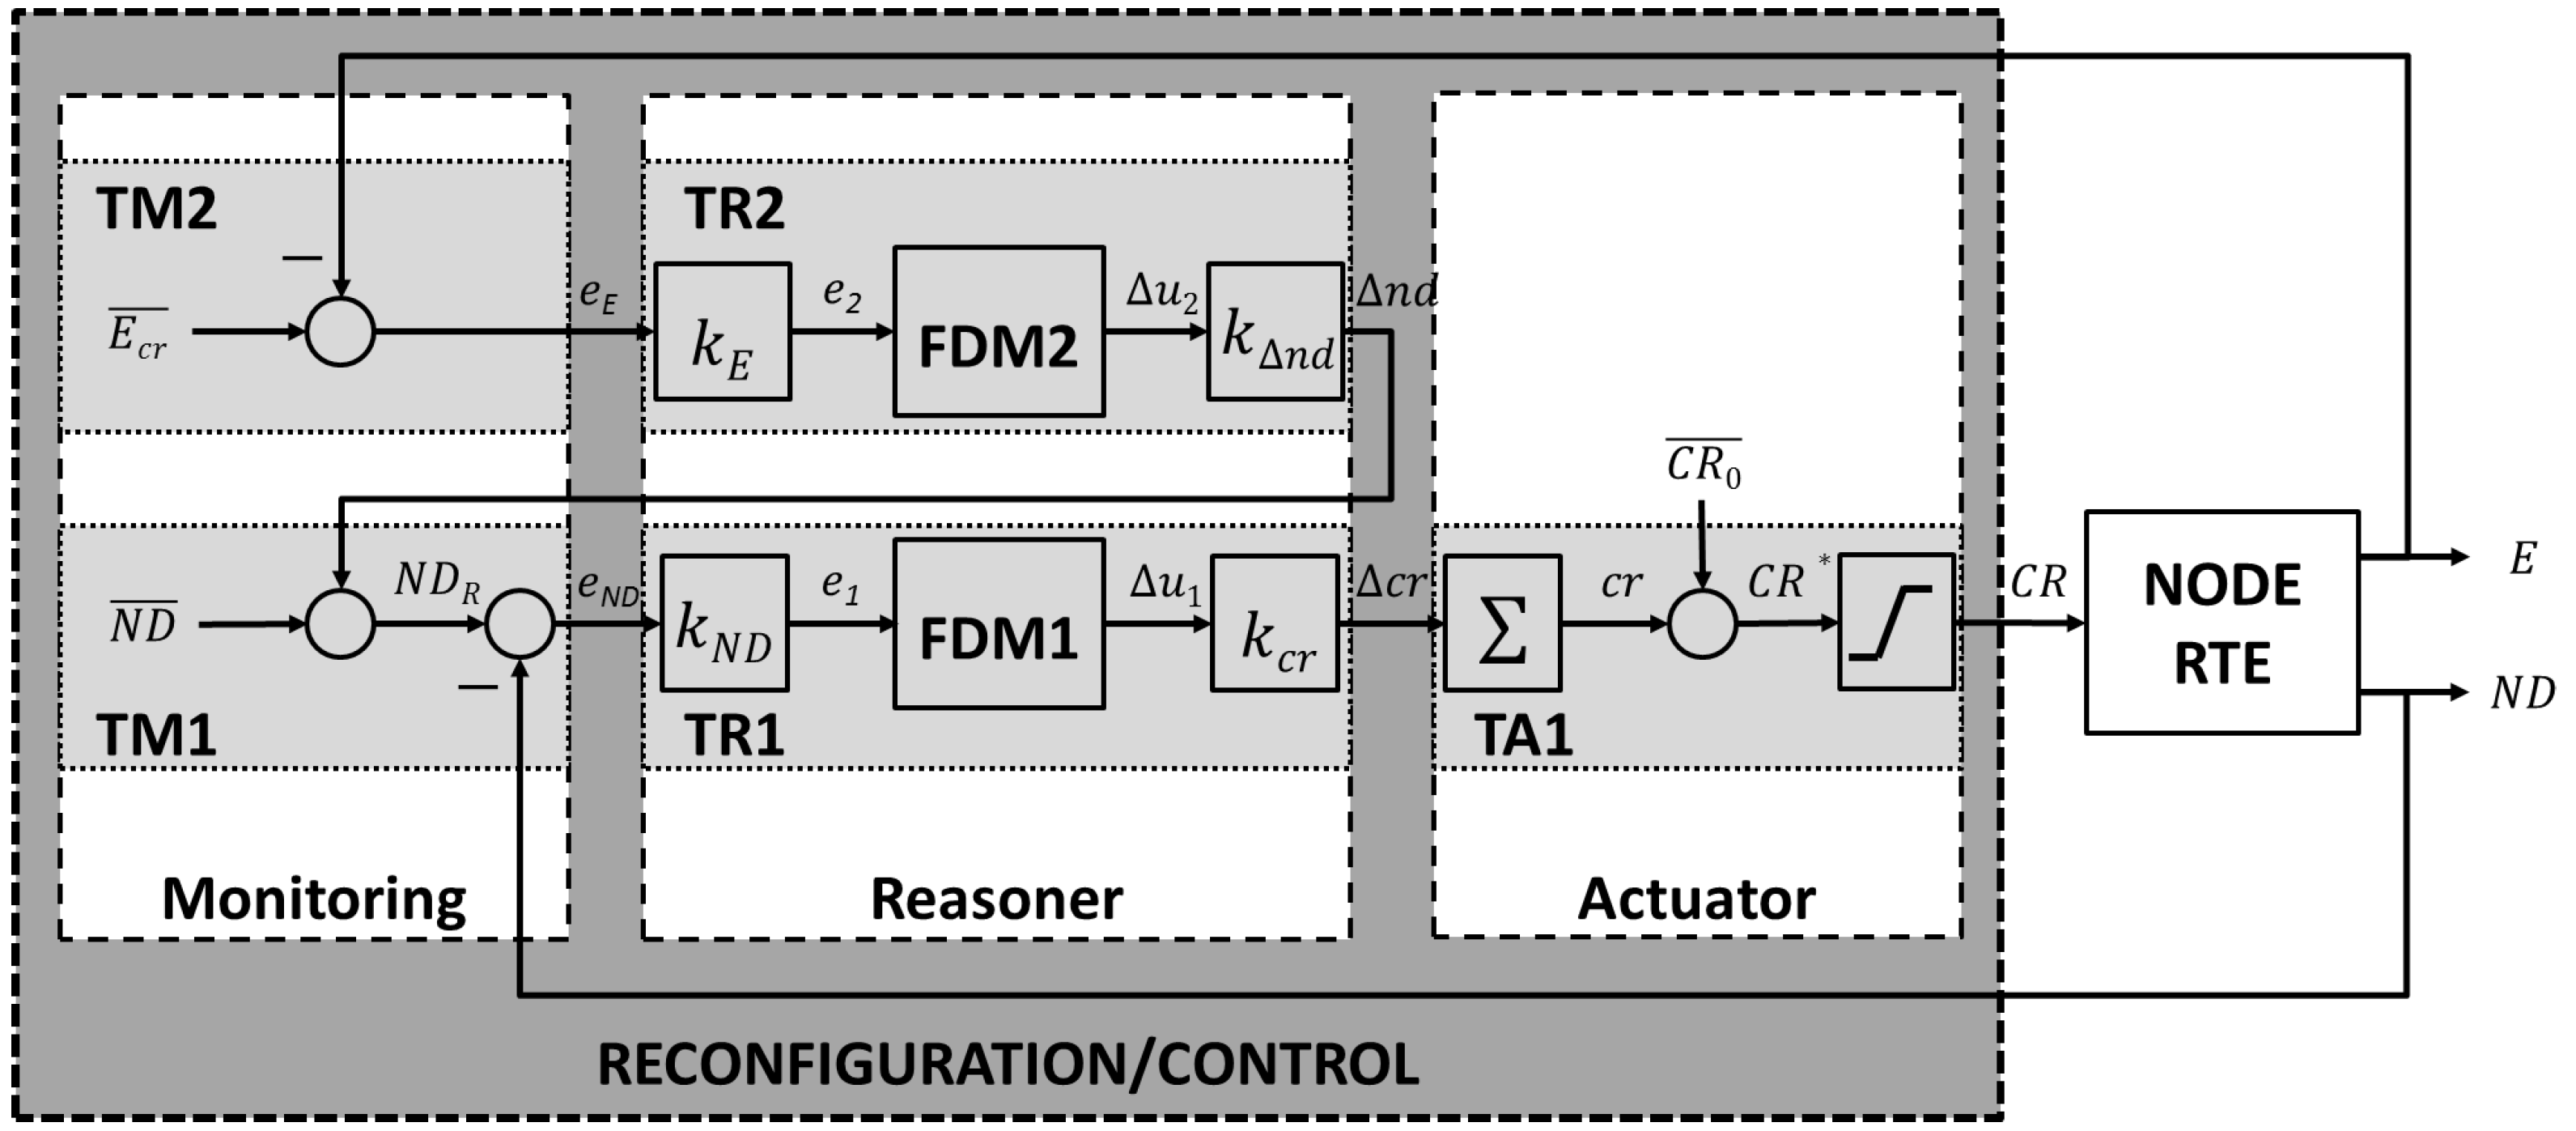
Fuzzy transfer functions. (a) FDM1; (b) FDM2.
Figure 2.
Fuzzy transfer functions. (a) FDM1; (b) FDM2.
FDM1 and
FDM2 functions represent the input-output relationship of single input-single output decision-making functions based on fuzzy logic. To model a WSN and the appropriate response to any possible failure or change in the WSN environment is overwhelming, and fuzzy-based solutions are likely to provide optimal and feasible achievements. In [
12], several algorithms for controlling a WSN topology are compared and those based on fuzzy-logic show a better trade-off between feasibility and communication reliability. The design of the functions were introduced in [
9]. The input and output ranges for both function are normalized between
and 1. The functions were designed based on engineering expertise and criterion, and after observation of the system behavior in a simulated environment.
FDM1 determines the increment on the transmission power to be applied depending on the difference between the desired number of neighbors and the present one. If the present number of neighbors is greater than the desired one, the transmission power will be increased, and decreased otherwise. For a negative input the function has larger slope than for positive values. The idea is to get large changes for negative values (the present number of neighbors is greater than the desired one ) in order to save energy consumption due to lower transmission power required. By other side, FDM2 adjusts the desired number of neighbors for each WSN node and is linear in the range between and 1. The desired number of neighbors for a node will be decreased if the battery level drops below a critical value.
In addition, the
Figure 1 also provides a different view of the system as consisting of three blocks:
Monitoring (comprises the tasks
TM1 and
TM2),
Reasoner (comprises the tasks
TR1 and
TR2) and
Actuator (comprises the task
TA1), which complies with the architectural model MAPE-K (Monitor, AnalyZe, Plan, Execute, Knowledge) [
13] and has driven the software design of the system. The
Figure 3 proposes a general software design for accomplishing self-adaptive systems based on MAPE-K. It is based on the one fully described in [
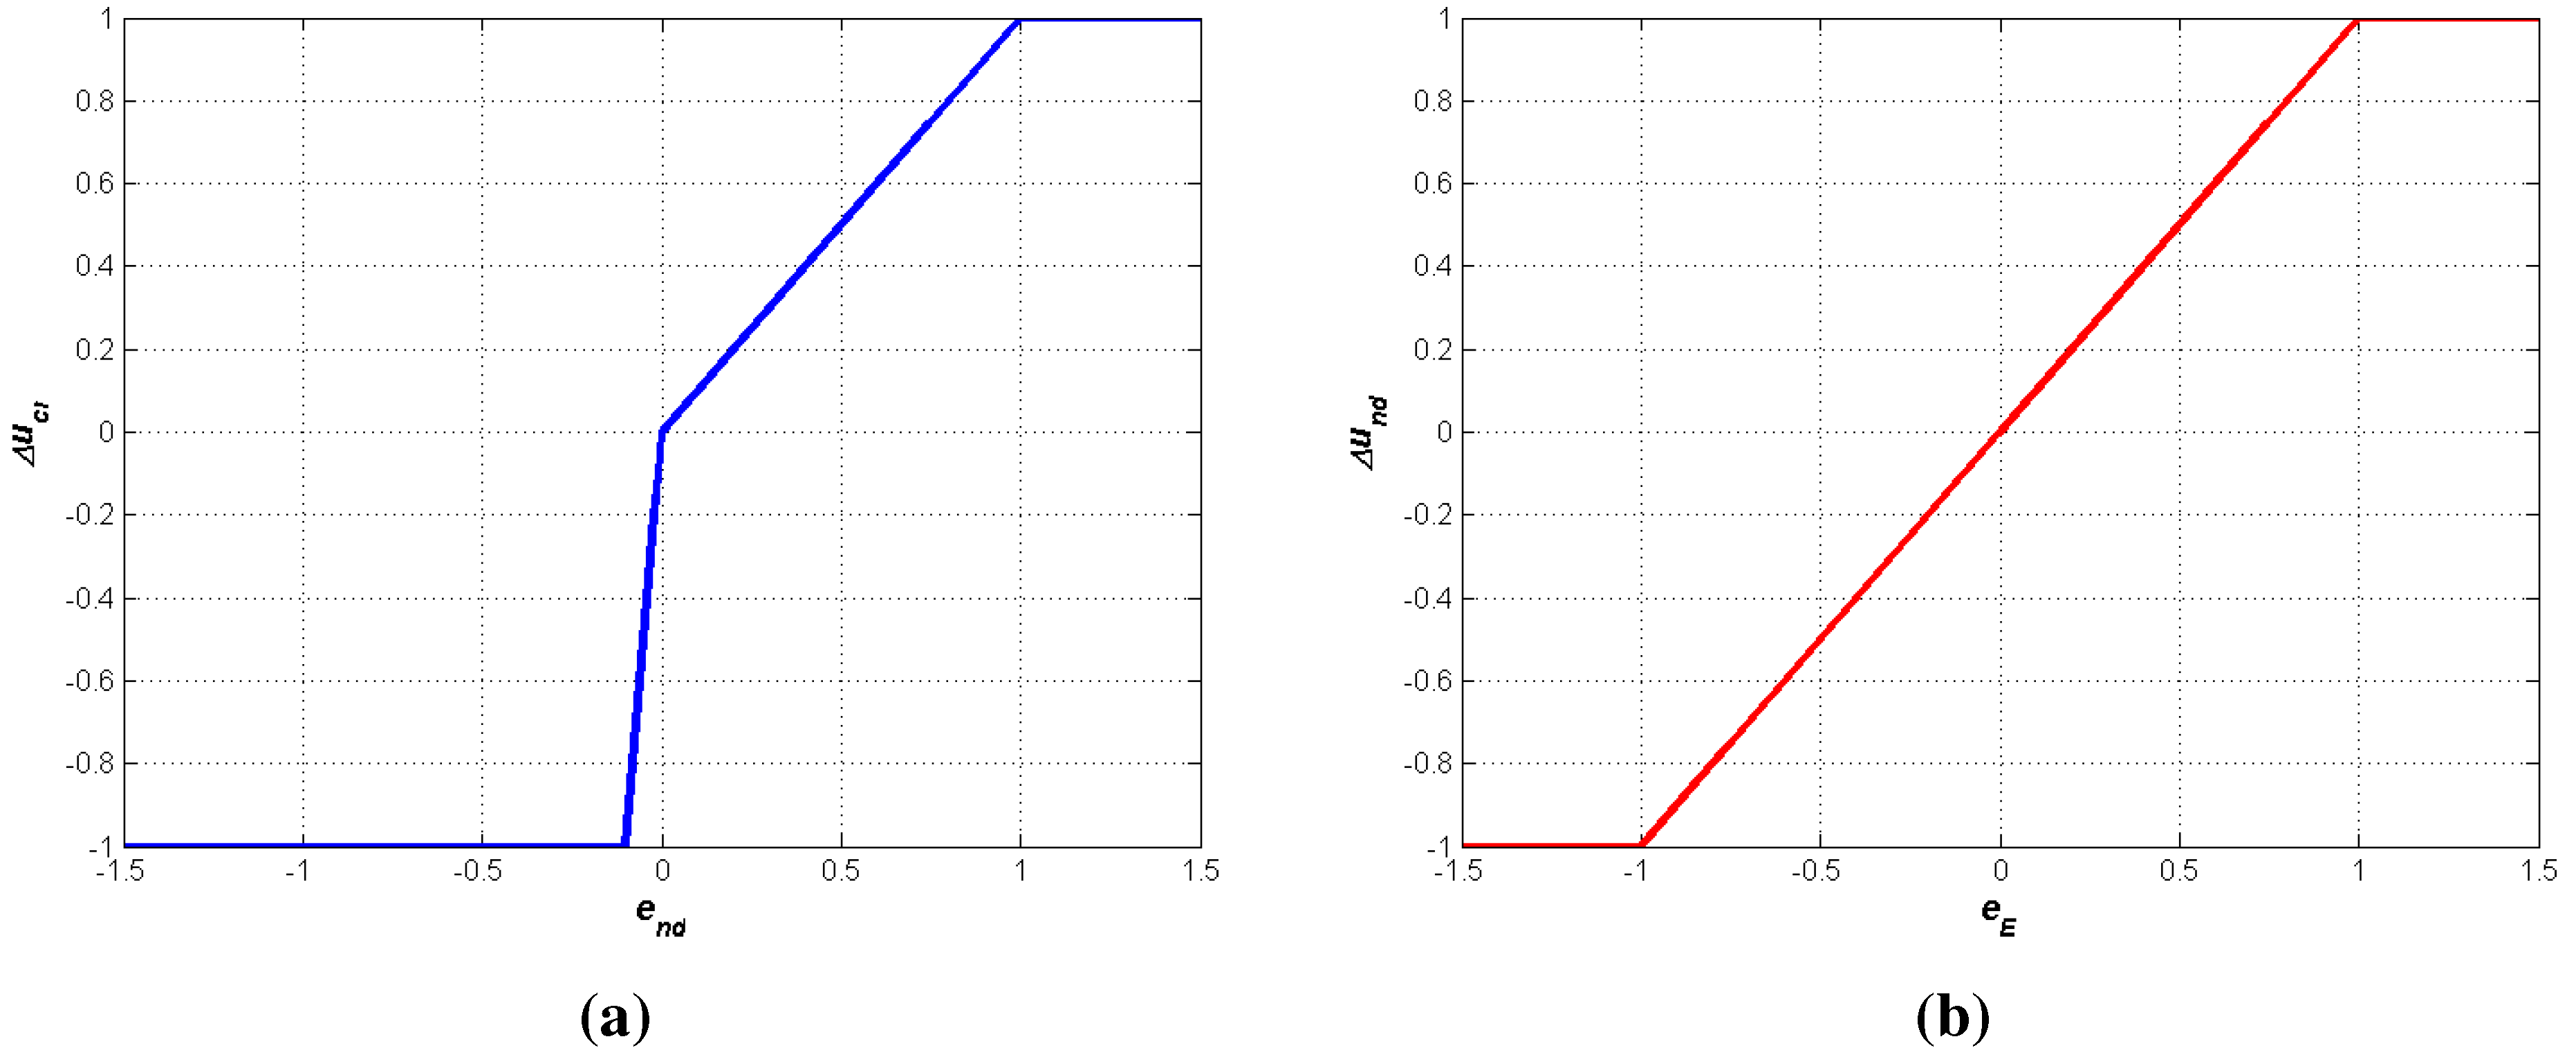
14], customized for the SunSPOT platform. The components
PowerScalingMonitor,
BatteryLevelObservation and
NodeDegreeObservation in
Figure 3 shape the
Monitoring block in
Figure 1. The component
PowerScalingMonitor monitors, at a specific rate, the number of neighbors (also called
node degree) and the battery level of a node, and also decides if the change in any of those values is significant enough to run the reasoner, the component based on fuzzy control that establishes the desired transmission power. The components
BatteryLevelObservation and
NodeDegreeObservation measure respectively the battery level and the number of neighbors of a node. The component
PowerScalingController accomplishes the
Reasoner block in
Figure 1. This component’s parameters must be tuned whenever a change in the dynamics of the control system is needed. The component
PowerTransmissionActuator carries out the
Actuator block in
Figure 1, is able to modify the transmission power of a node based on the desired value specified by the invoking component. Finally, the component
ORAMediatorForSunSpot enables interaction among the rest of components. It behaves as a broker decoupling observers, reasoners and actuators.
Figure 3.
Software components accomplishing the self-adaptive system improving the energy consumption while keeping the communication connectivity.
Figure 3.
Software components accomplishing the self-adaptive system improving the energy consumption while keeping the communication connectivity.
Whenever a component is registered in the
ORAMediatorForSunSpot, the rest of registered components are aware of that, thus they can access the new one if needed. The new components are registered by means of the interface
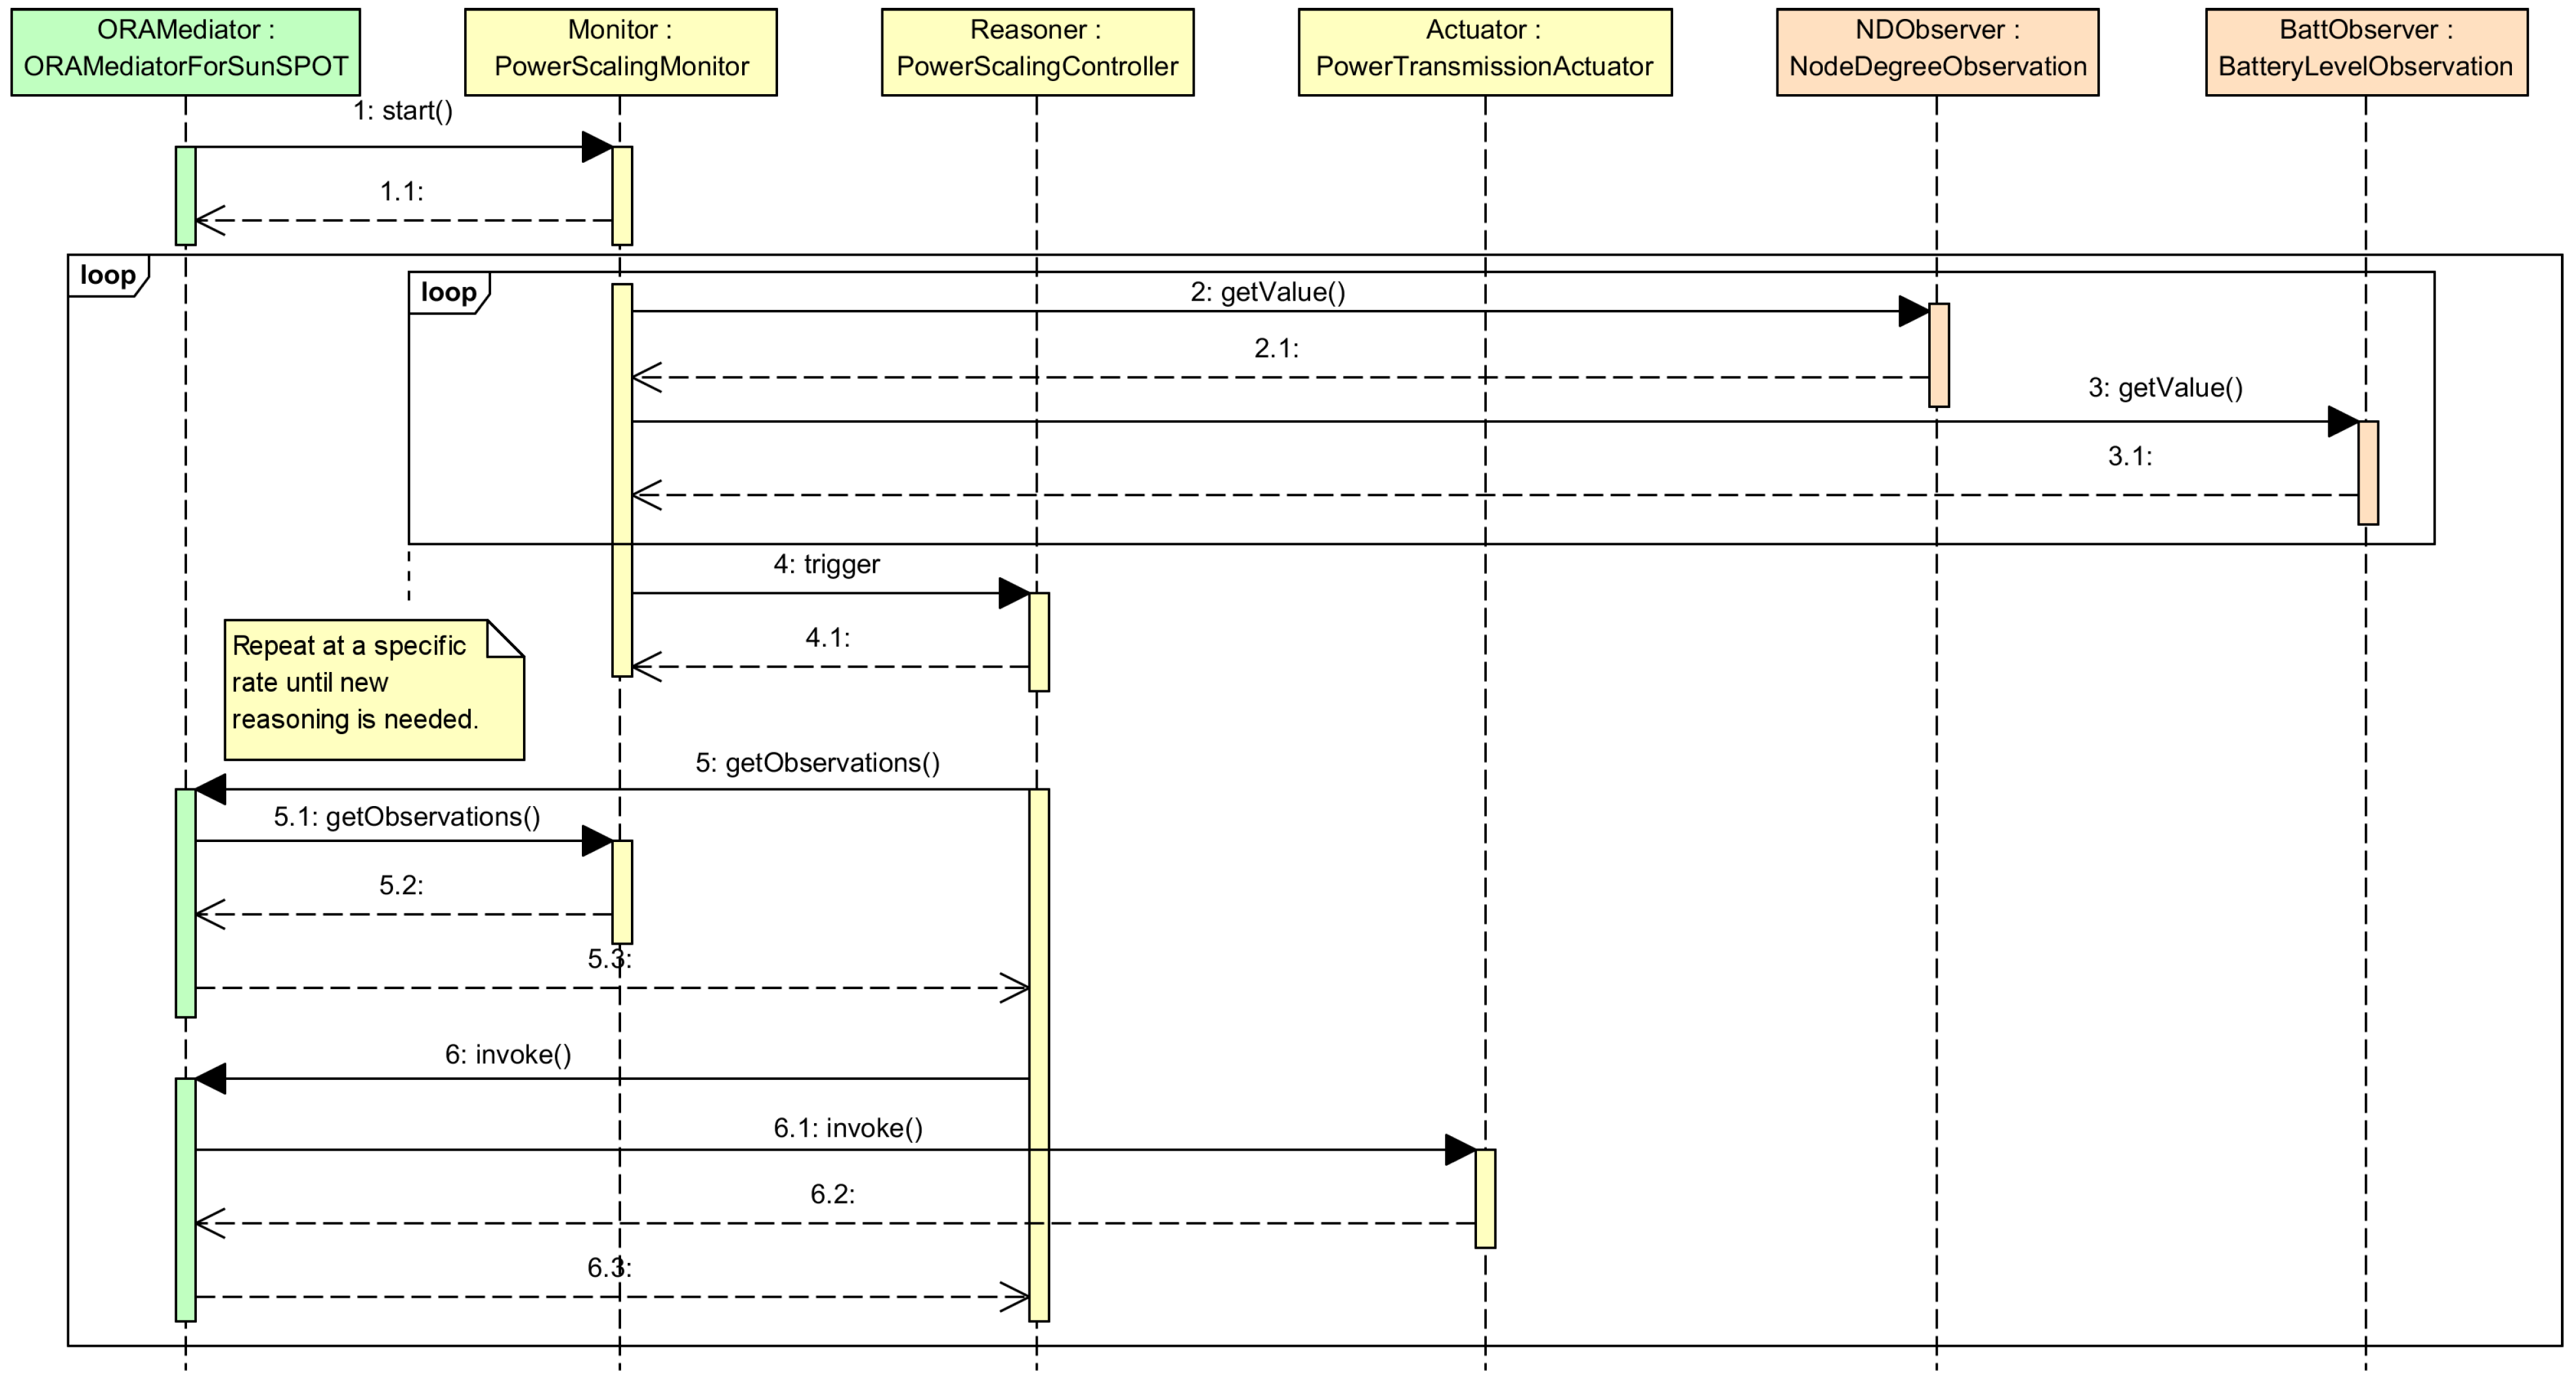
ORAMediator. The regular interactions among components is depicted in the UML sequence diagram in
Figure 4. The
ORAMediatorForSunSpot will start the
PowerScalingMonitor component by means of the
TriggerPolicy interface. That component will measure periodically the number of neighbors and the battery level of a node and will decide, based on such values, if it is worth triggering the reasoner to make new decisions, by means of the
Reasoner interface. The
PowerScalingController component will request the latest measures by means of the
ObservationProvider interface whenever triggered. The
ORAMediatorForSunSpot component captures the request, gets the data from the observer by means of the
Observer interface and finally fulfils the
PowerScalingController request. Then, the
PowerScalingController will run the algorithm depicted in the block
Reasoner in
Figure 1, including
FDM1 and
FDM2 outlined in
Figure 2a,b, and could request a change in the node transmission power by means of the
ActionProvider interface whenever suitable. The
ORAMediatorForSunSpot component captures the request and invokes the proper actuator, the
PowerTransmissionActuator in this case, to fulfill the request.
Figure 4.
UML sequence diagram depicting basic components interaction.
Figure 4.
UML sequence diagram depicting basic components interaction.
The components in the
Figure 3 have been developed in Java language for the SunSPOT platform, a Java Micro Edition virtual machine called
squawk. The commercially available WSN products are very diverse. There are products with low memory capacity and microcontroller speed, like G-Node [
15] or Waspmote [
16], an Arduino based platforms. But there are also more powerful hardware platforms like Intel Galileo Gen 2 [
17] or Raspberri PI [
18], that were not at first designed for becoming a WSN node but they can be very suitable whenever a WSN node has to run complex algorithms for making decisions, data aggregation and so on. The SunSPOT capabilities are better than those from resource constrained solutions like G-Node, but worse than those offered by powerful platforms. The SunSPOT platform was selected because it is Java programmed, making easier the development phase of a solution, and it is a well known platform for the authors.
The control strategy that have been carried out and described in this paper aims at consuming the less resources as possible and minimizing the network overhead. On the one hand, the reasoning algorithms do not require either complex and overloading processing instructions, and are presented in the
Figure 2a,b. The observed parameters that drive the control strategy, the battery level and the number of neighbors, are neither high resource consuming elements. The former is directly obtained by the tools provided by the SunSPOT platform. The latter could be estimated considering the information provided by the node routing protocol or the messages going across the node, however, a discovery protocol was carried out as the accuracy of the number of neighbors provided by the SunSPOT platform was not good enough.
3. Experimental Set-up
We have defined a set of experiments to test the improvements, if any, achieved by using the proposed fuzzy control based self-adaptive system in a WSN. There are four main parameters that rule the behavior of the self-adaptive system deployed in the SunSPOT nodes: , , and , which have been modified in the different experiments to observe each parameter impact on the system efficiency.
is the number of neighbors, a reference value, that the node must have. That value could change over time and decrease if a node battery level drops below the critical value . The initial value for depends on the number of nodes in the WSN and the deployment area, as mentioned in previous sections.
determines when the difference () between a node and its real number of neighbors is significant enough to trigger the reasoner, avoiding useless executions of task TR1. More precisely, the task TM1 in the component PowerScalingMonitor will trigger the task TR1 in the component PowerScalingReasoner when , where represents the absolute value of the error in the k instant.
amplifies FDM1 output, the required change in the node transmission power to meet . This parameter influences how long it takes the system to get number of neighbors. For instance, a high value for in a system where the number of neighbors of a node changes significantly, e.g., due to environmental changes, implies that it will take less system cycles to recover .
is a system reference value that establishes the battery level value that suggests a higher energy consumption saving to extend the battery lifetime. When the real battery level drops below , the system should reduce energy consumption by reducing the transmission power, acting on the reference value for the number of neighbors of the node.
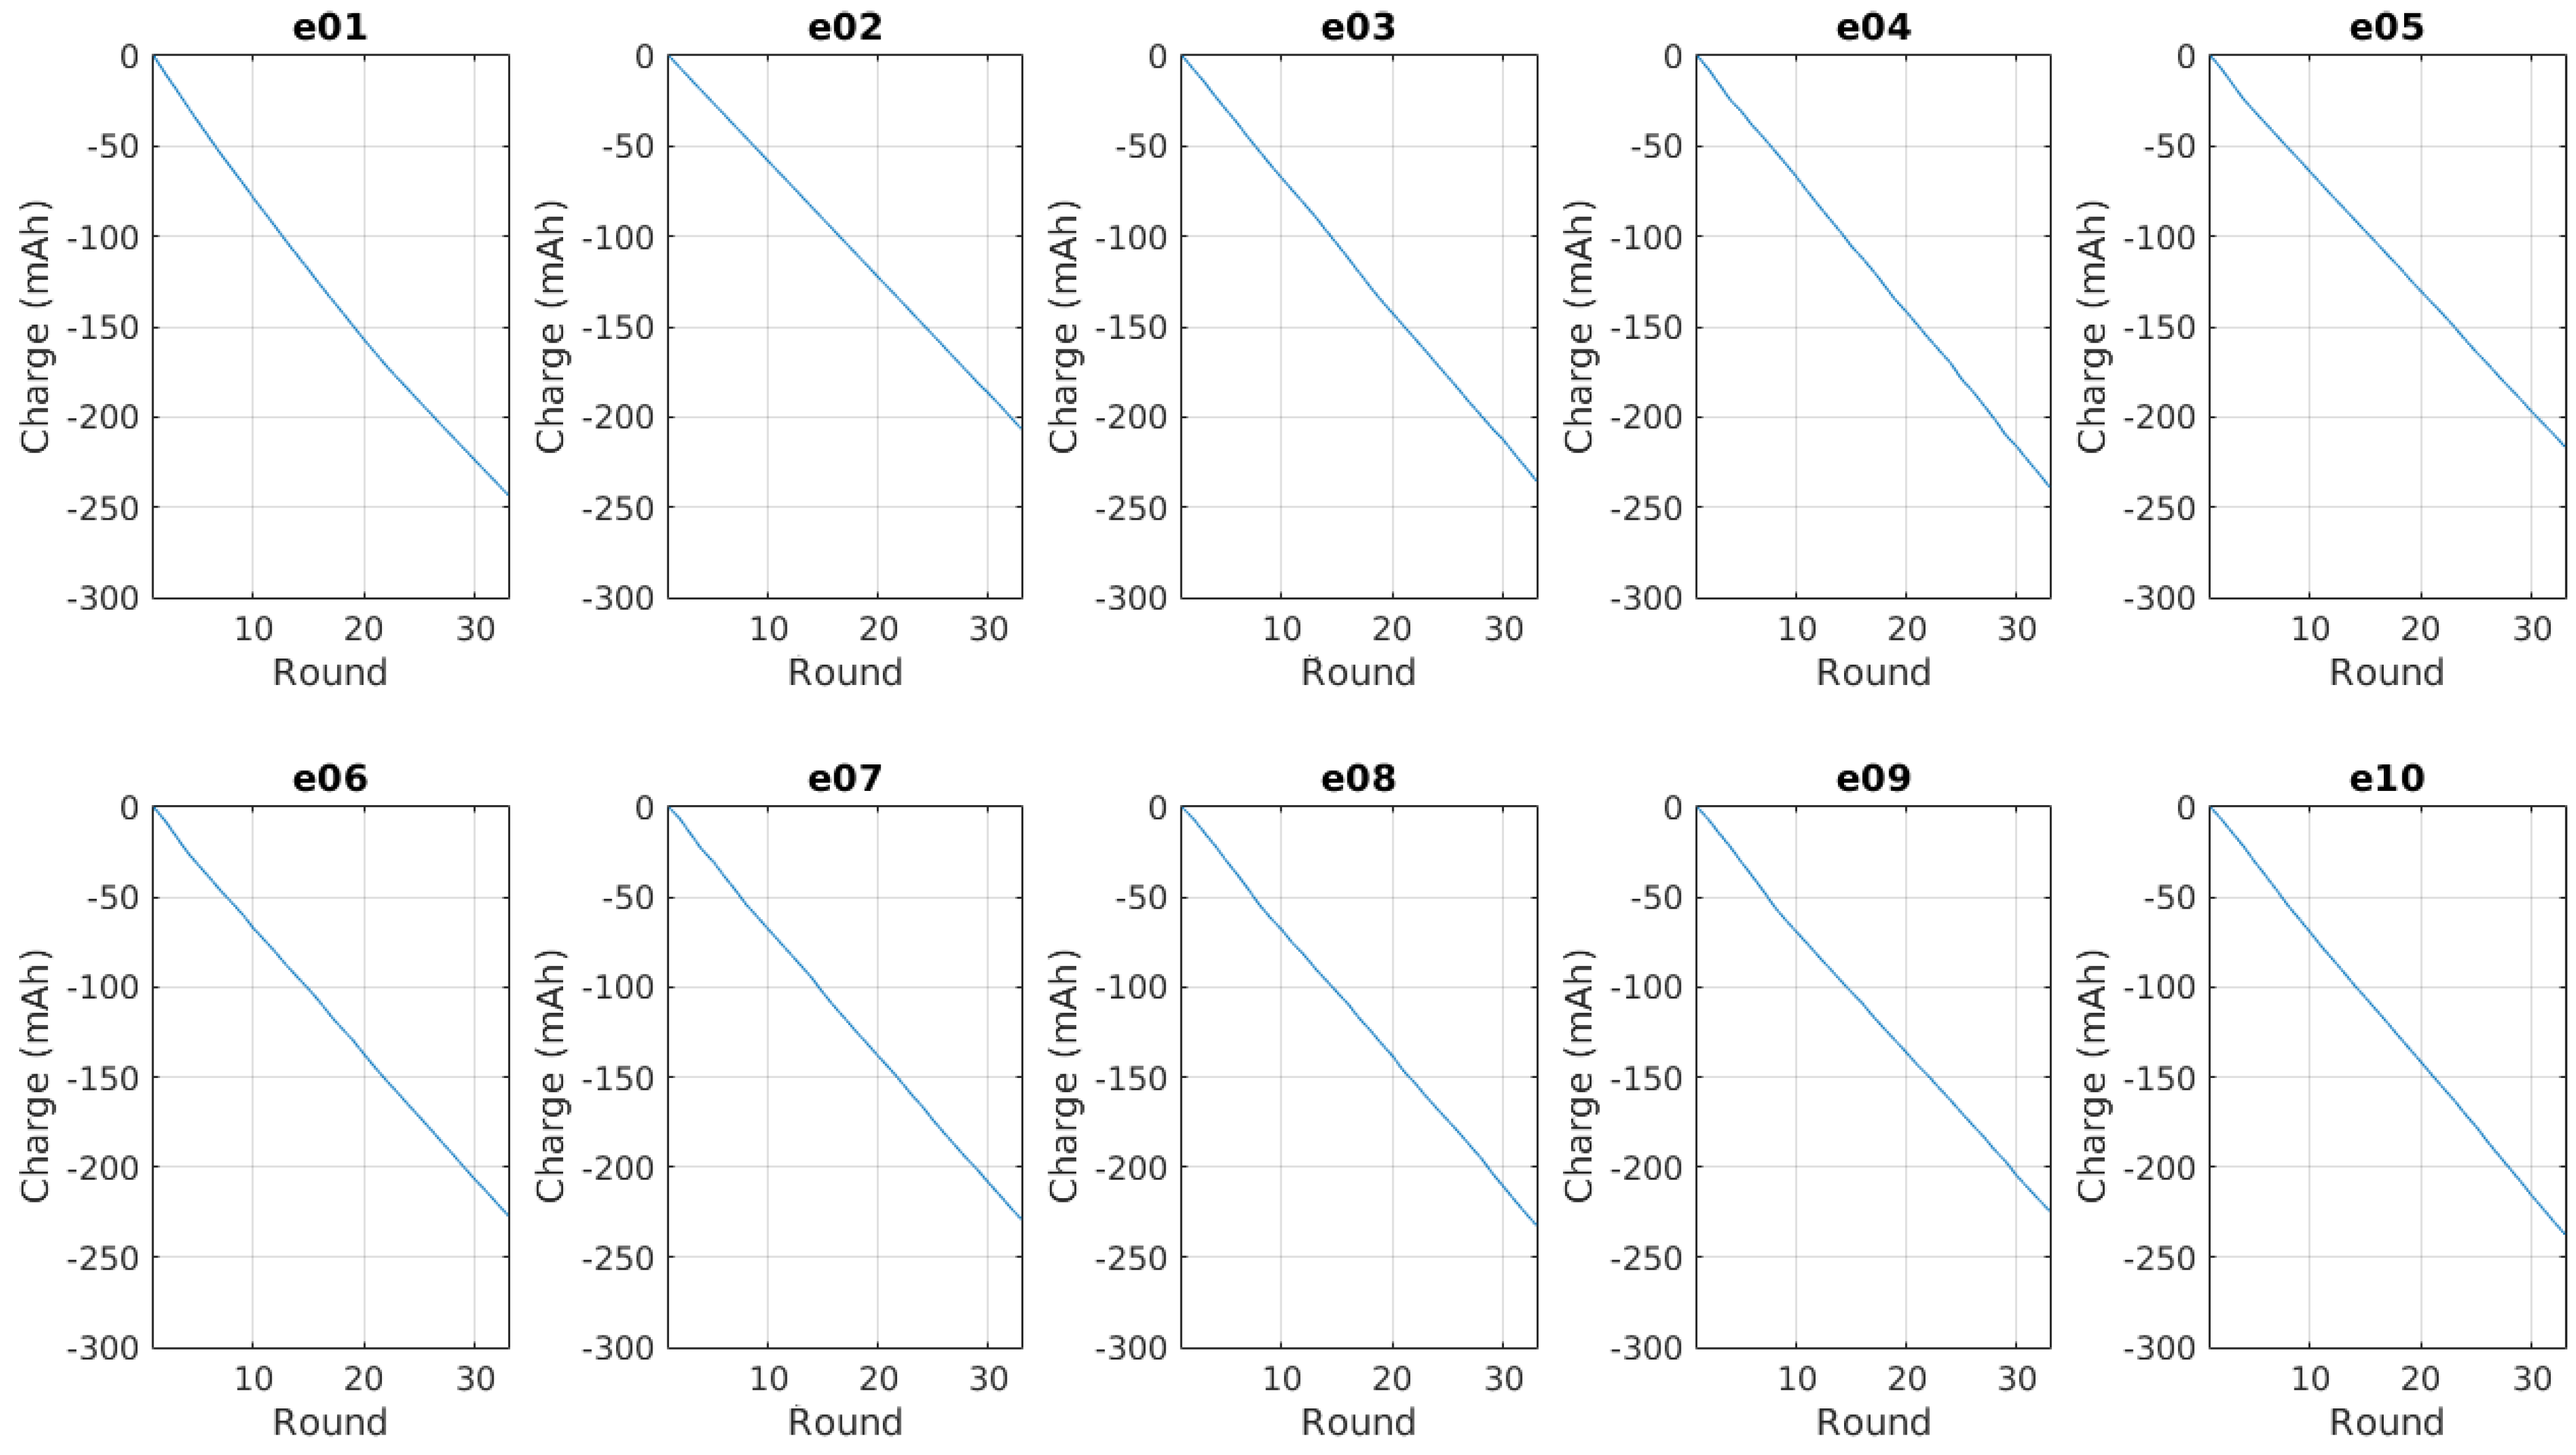
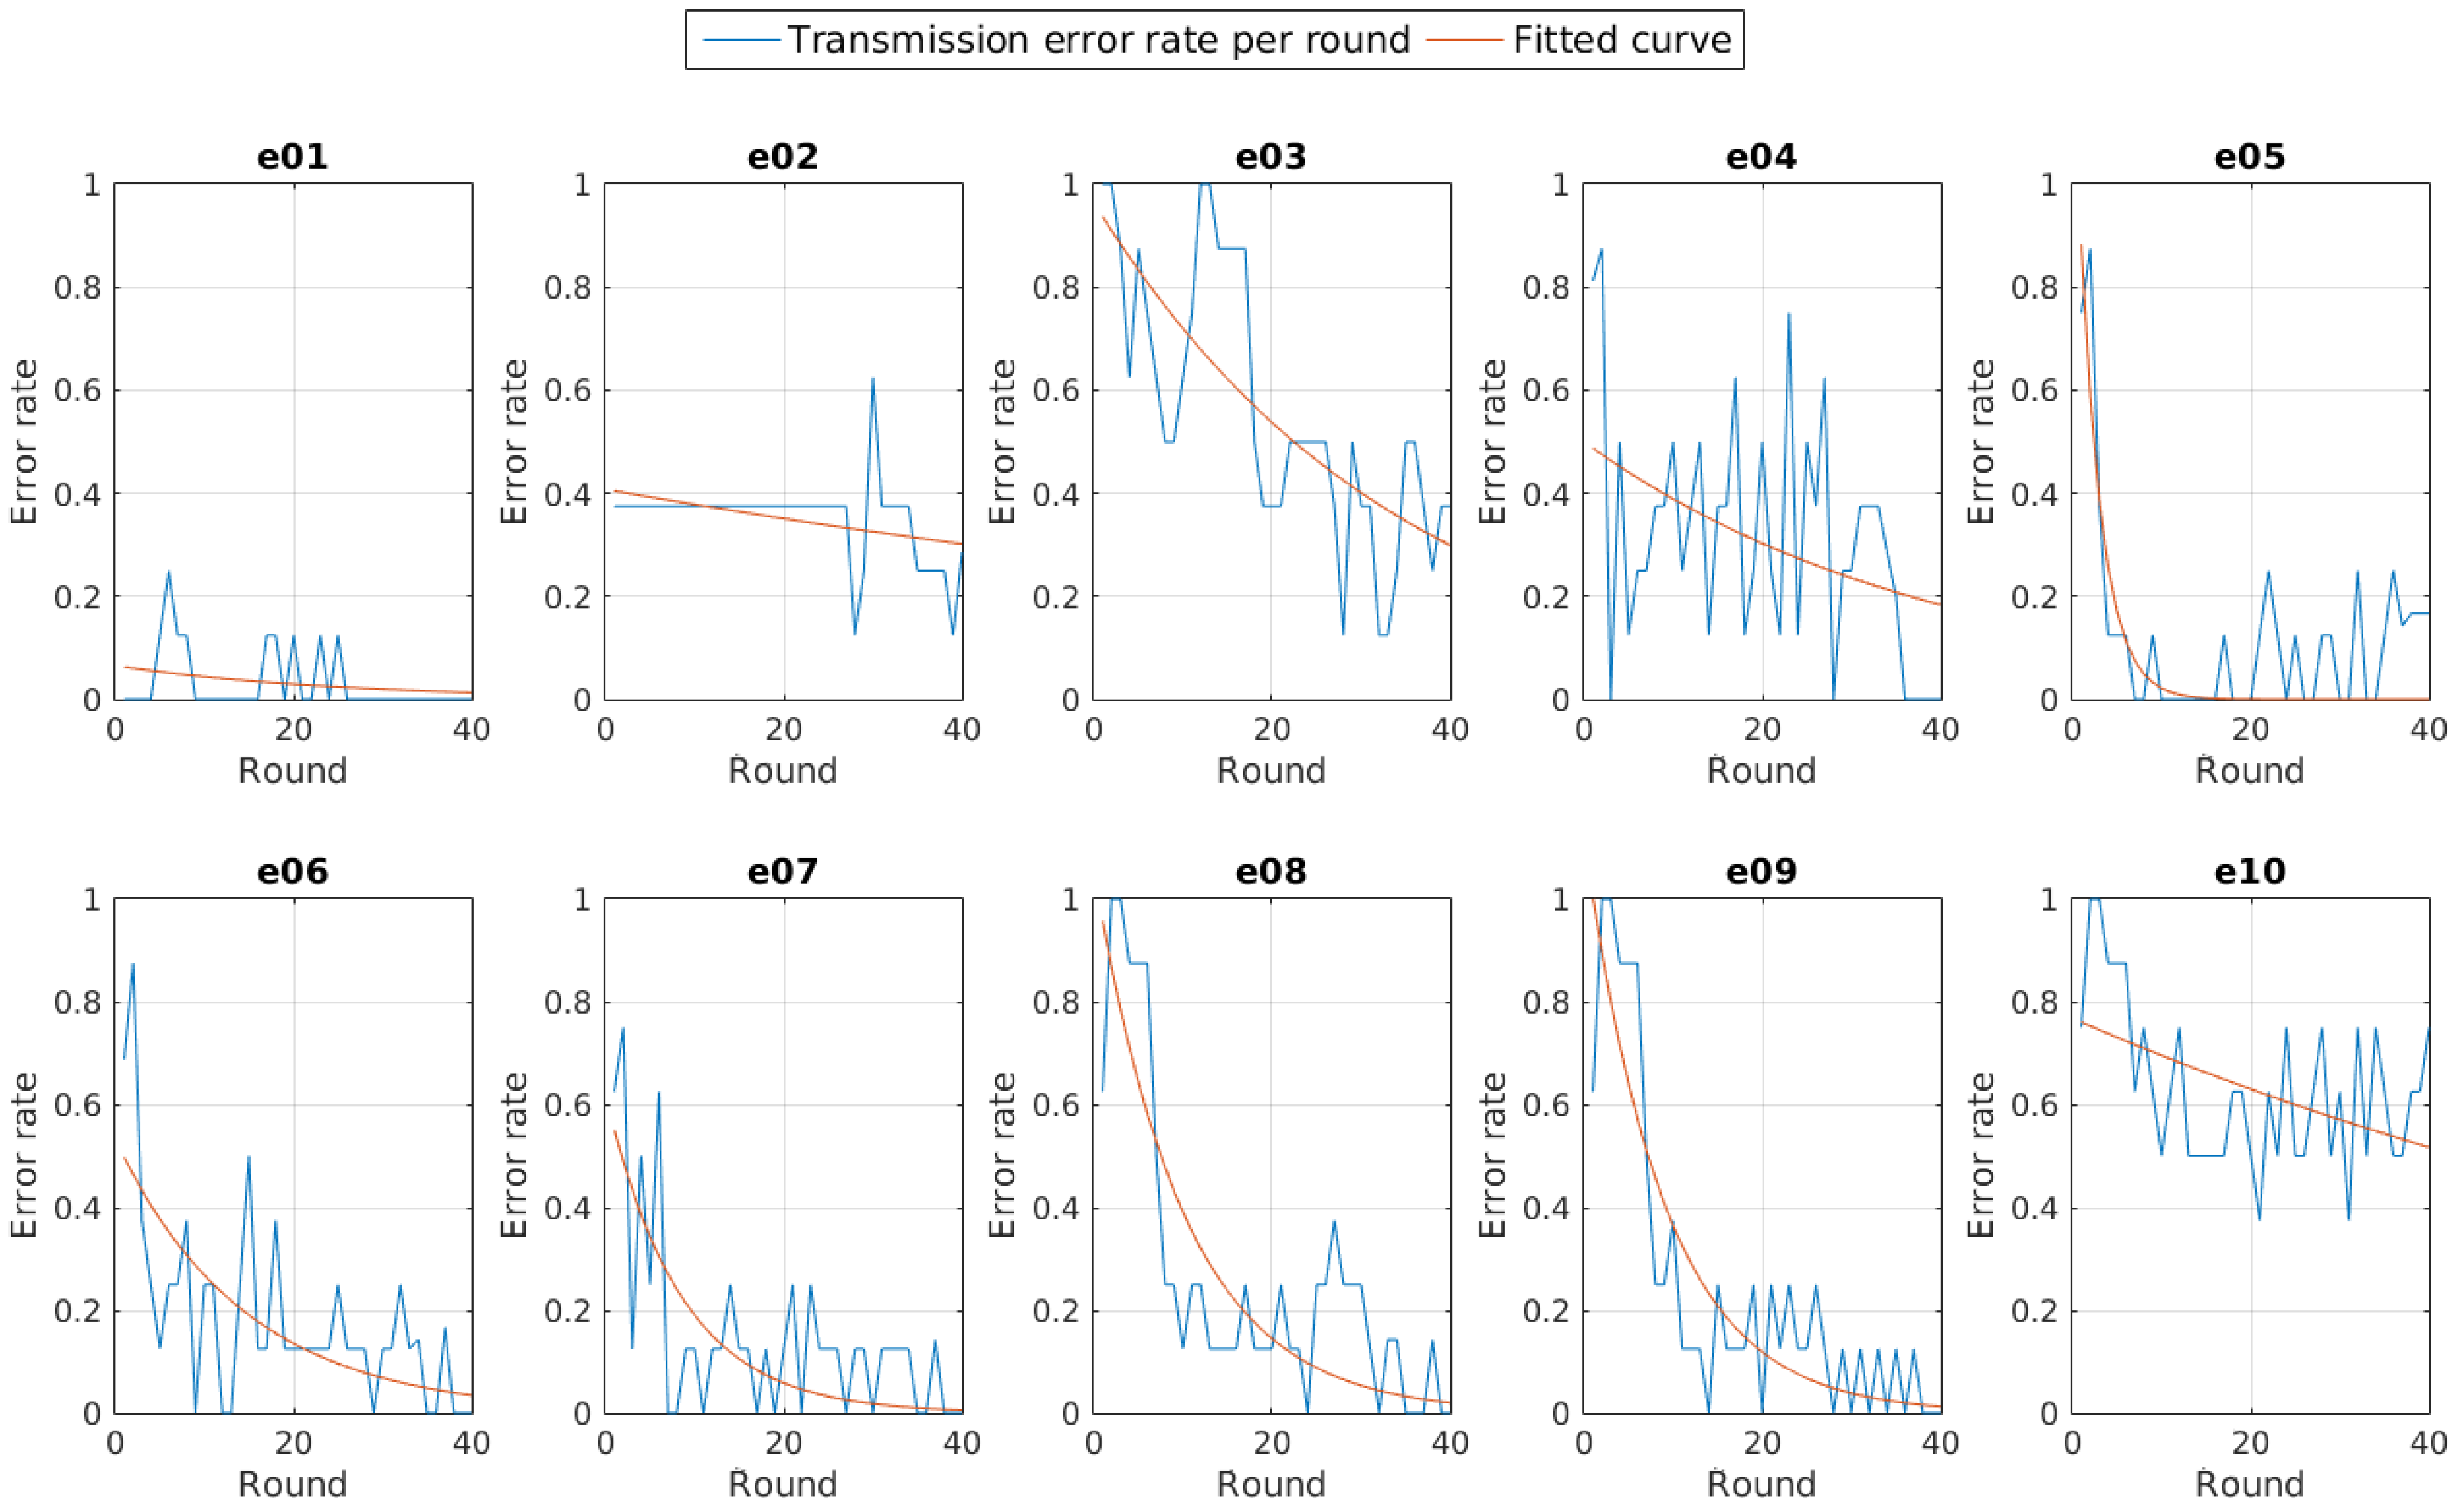
In this paper we focus on the first three ones. We also did two control experiments with the self-adaptive system inactive to compare the system performance when the self-adaptive system is on and off. The total number of experiments was ten: two with a fixed transmission power, and eight with an adaptive transmission power ruled by the proposed control system and a set of different parameters to test their performance. The parameters used for these control experiments are shown in
Table 1.
Table 1.
Parameter values used in the experiments.
Table 1.
Parameter values used in the experiments.
| Experiment | | | | | |
|---|
| e01 | — | — | — | — | dBm |
| e02 | — | — | — | — | dBm |
| e03 | 2 | 0 | 1 | 150 | — |
| e04 | 2 | 0 | 3 | 150 | — |
| e05 | 2 | 1 | 3 | 150 | — |
| e06 | 3 | 1 | 3 | 150 | — |
| e07 | 3 | 0 | 3 | 150 | — |
| e08 | 3 | 0 | 1 | 150 | — |
| e09 | 3 | 1 | 1 | 150 | — |
| e10 | 2 | 1 | 1 | 150 | — |
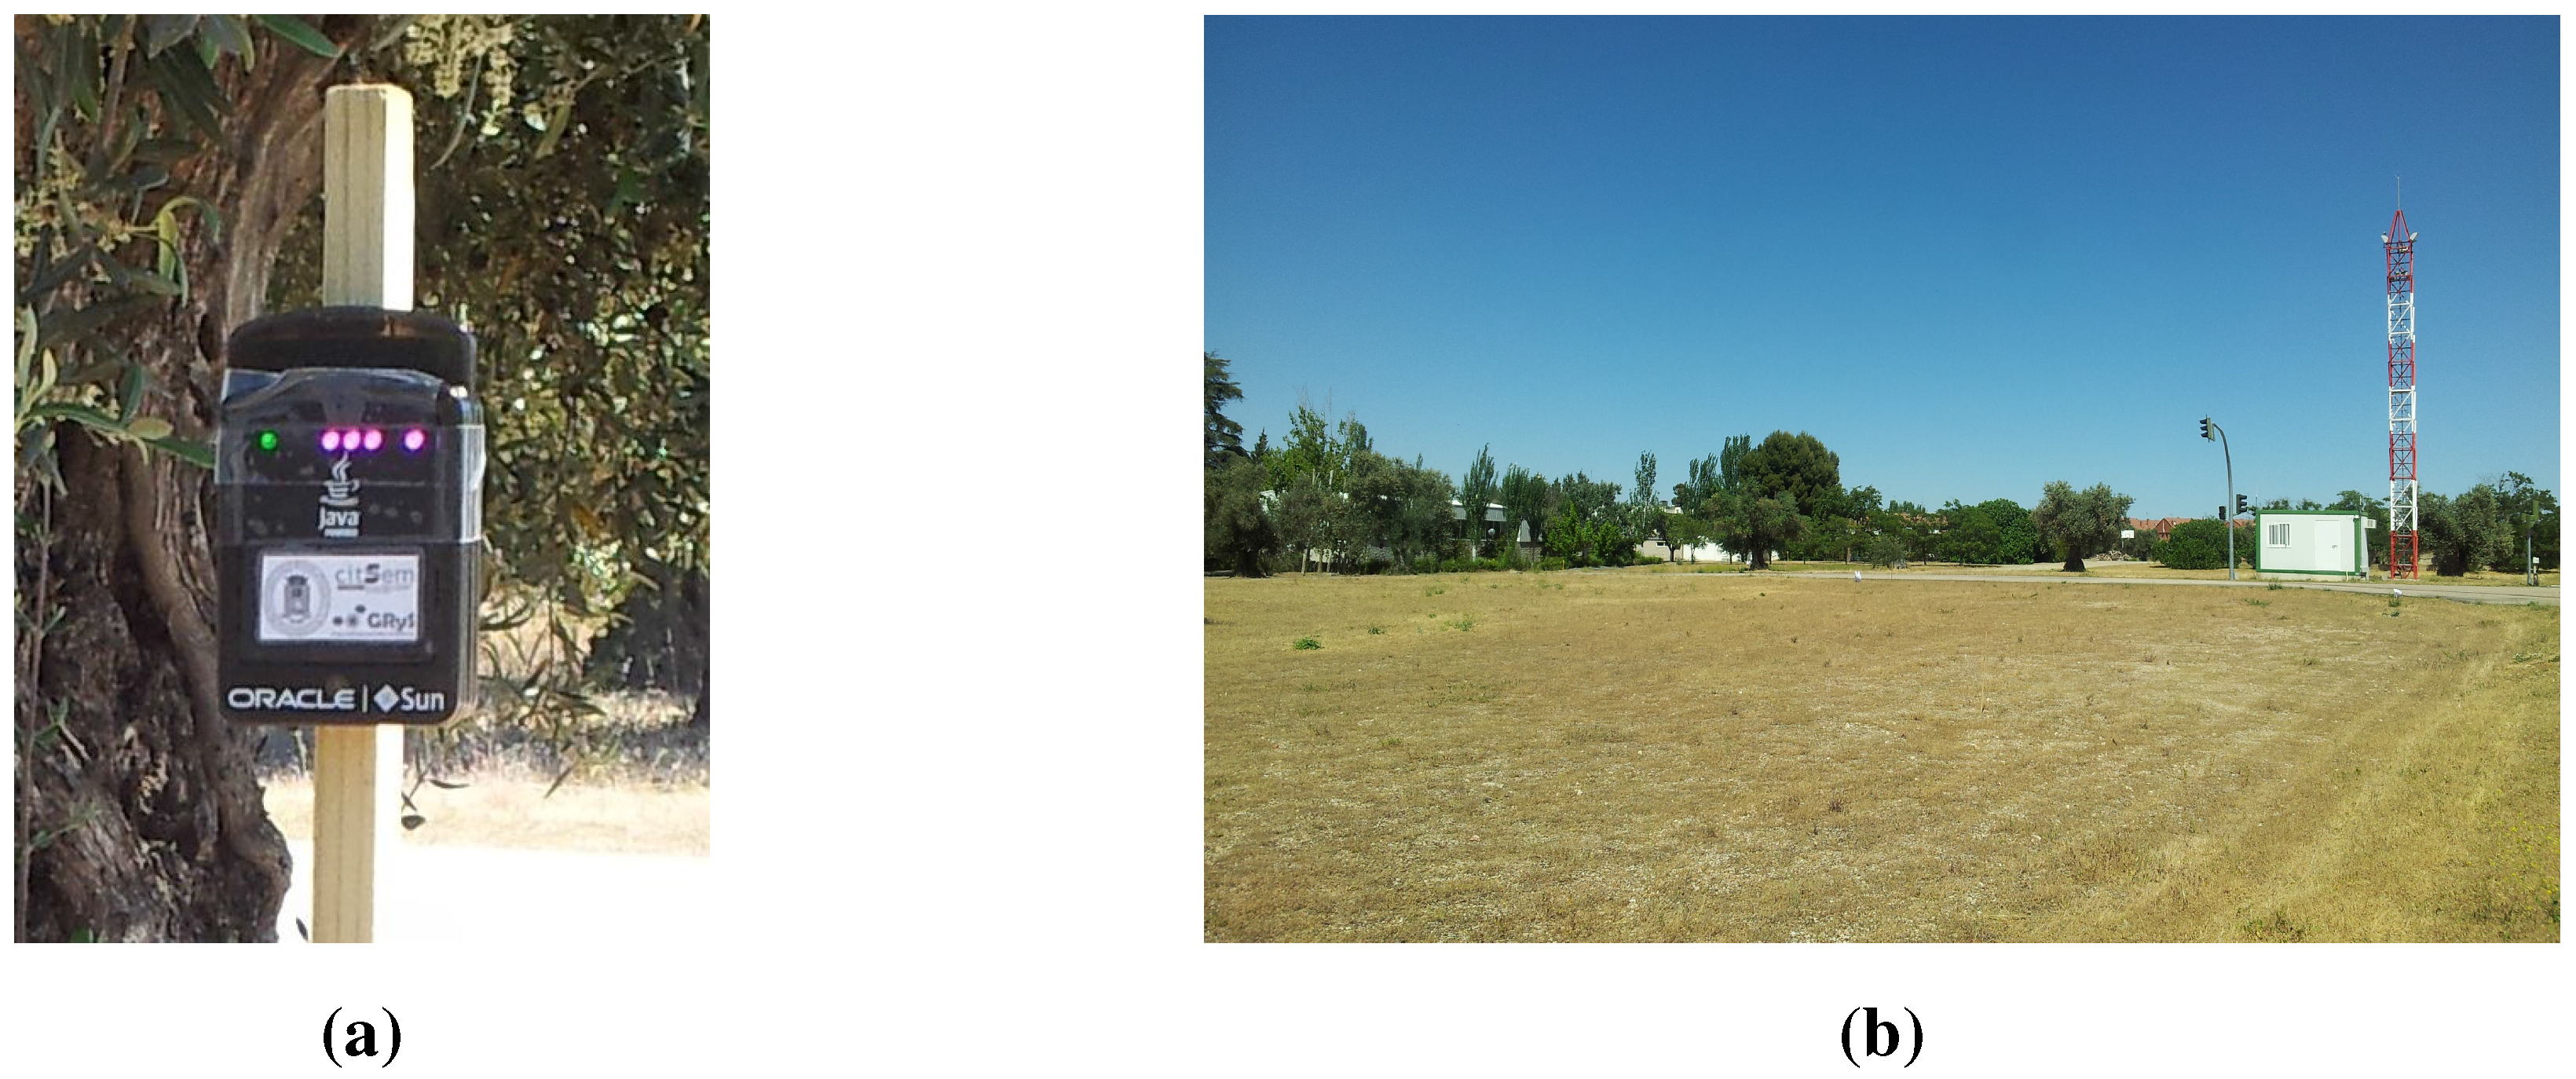
The nodes used in the experiments were eight SunSPOT wireless sensors nodes [
10], like the one in
Figure 5a. All the SunSPOT nodes used in the experiments use the same hardware revision, that is revision 8.2 for the main board, and revision 8.1 for the sensor board. They were updated to the developer version codenamed “
teal-120517” in order to solve an issue with the readings of the battery values in the previous SunSPOT SDK release.
Figure 5.
Experiment deployment; (a) One of the sensor nodes used in the experiments; (b) Deployment area.
Figure 5.
Experiment deployment; (a) One of the sensor nodes used in the experiments; (b) Deployment area.
We also used a SunSPOT base station, which is just like any other SunSPOT device, but without the sensor board. The SunSPOT base station was attached to a computer through the USB port, and was used as a sink for the status messages sent by the sensor nodes, as well as to enable the remote management of the control system parameters used in the deployed sensor nodes. It also took a passive role in the neighbor discovery protocol, and an active role in the routing protocol. The status messages had a fixed length of 60 bytes, and carried out information regarding the round of the experiment, the time-stamp, the current number of neighbors, the maximum and available battery capacity, the configuration parameters used in the associated round and the next hop as indicated by the node routing protocol.
All the SunSPOTs are equipped with a CC2420 transceiver that provides radio capabilities using the 2.4 GHz for the IEEE 802.15.4. This transceiver allows a transmission power range from
dBm to
dBm when using channel 26, and from 0 dBm to
dBm for the rest. The range is discrete, and the available transmission powers are shown in
Table 2. For the experiments we have used channel 26, so in our case the maximum transmission power is limited to
dBm.
Table 2.
Available transmission powers in the SunSPOT nodes.
Table 2.
Available transmission powers in the SunSPOT nodes.
| Channel | Available Transmission Powers (dBm) |
|---|
| 11 to 25 | −32, −31, −30, −25, −22, −19, −17, −15, −13, −12, −11, −10, −9, −8, −7, −6, −5, −4, −3, −2, −1, 0 |
| 26 (default channel) | −32, −31, −30, −25, −22, −19, −17, −15, −13, −12, −11, −10, −9, −8, −7, −6, −5, −4, −3 |
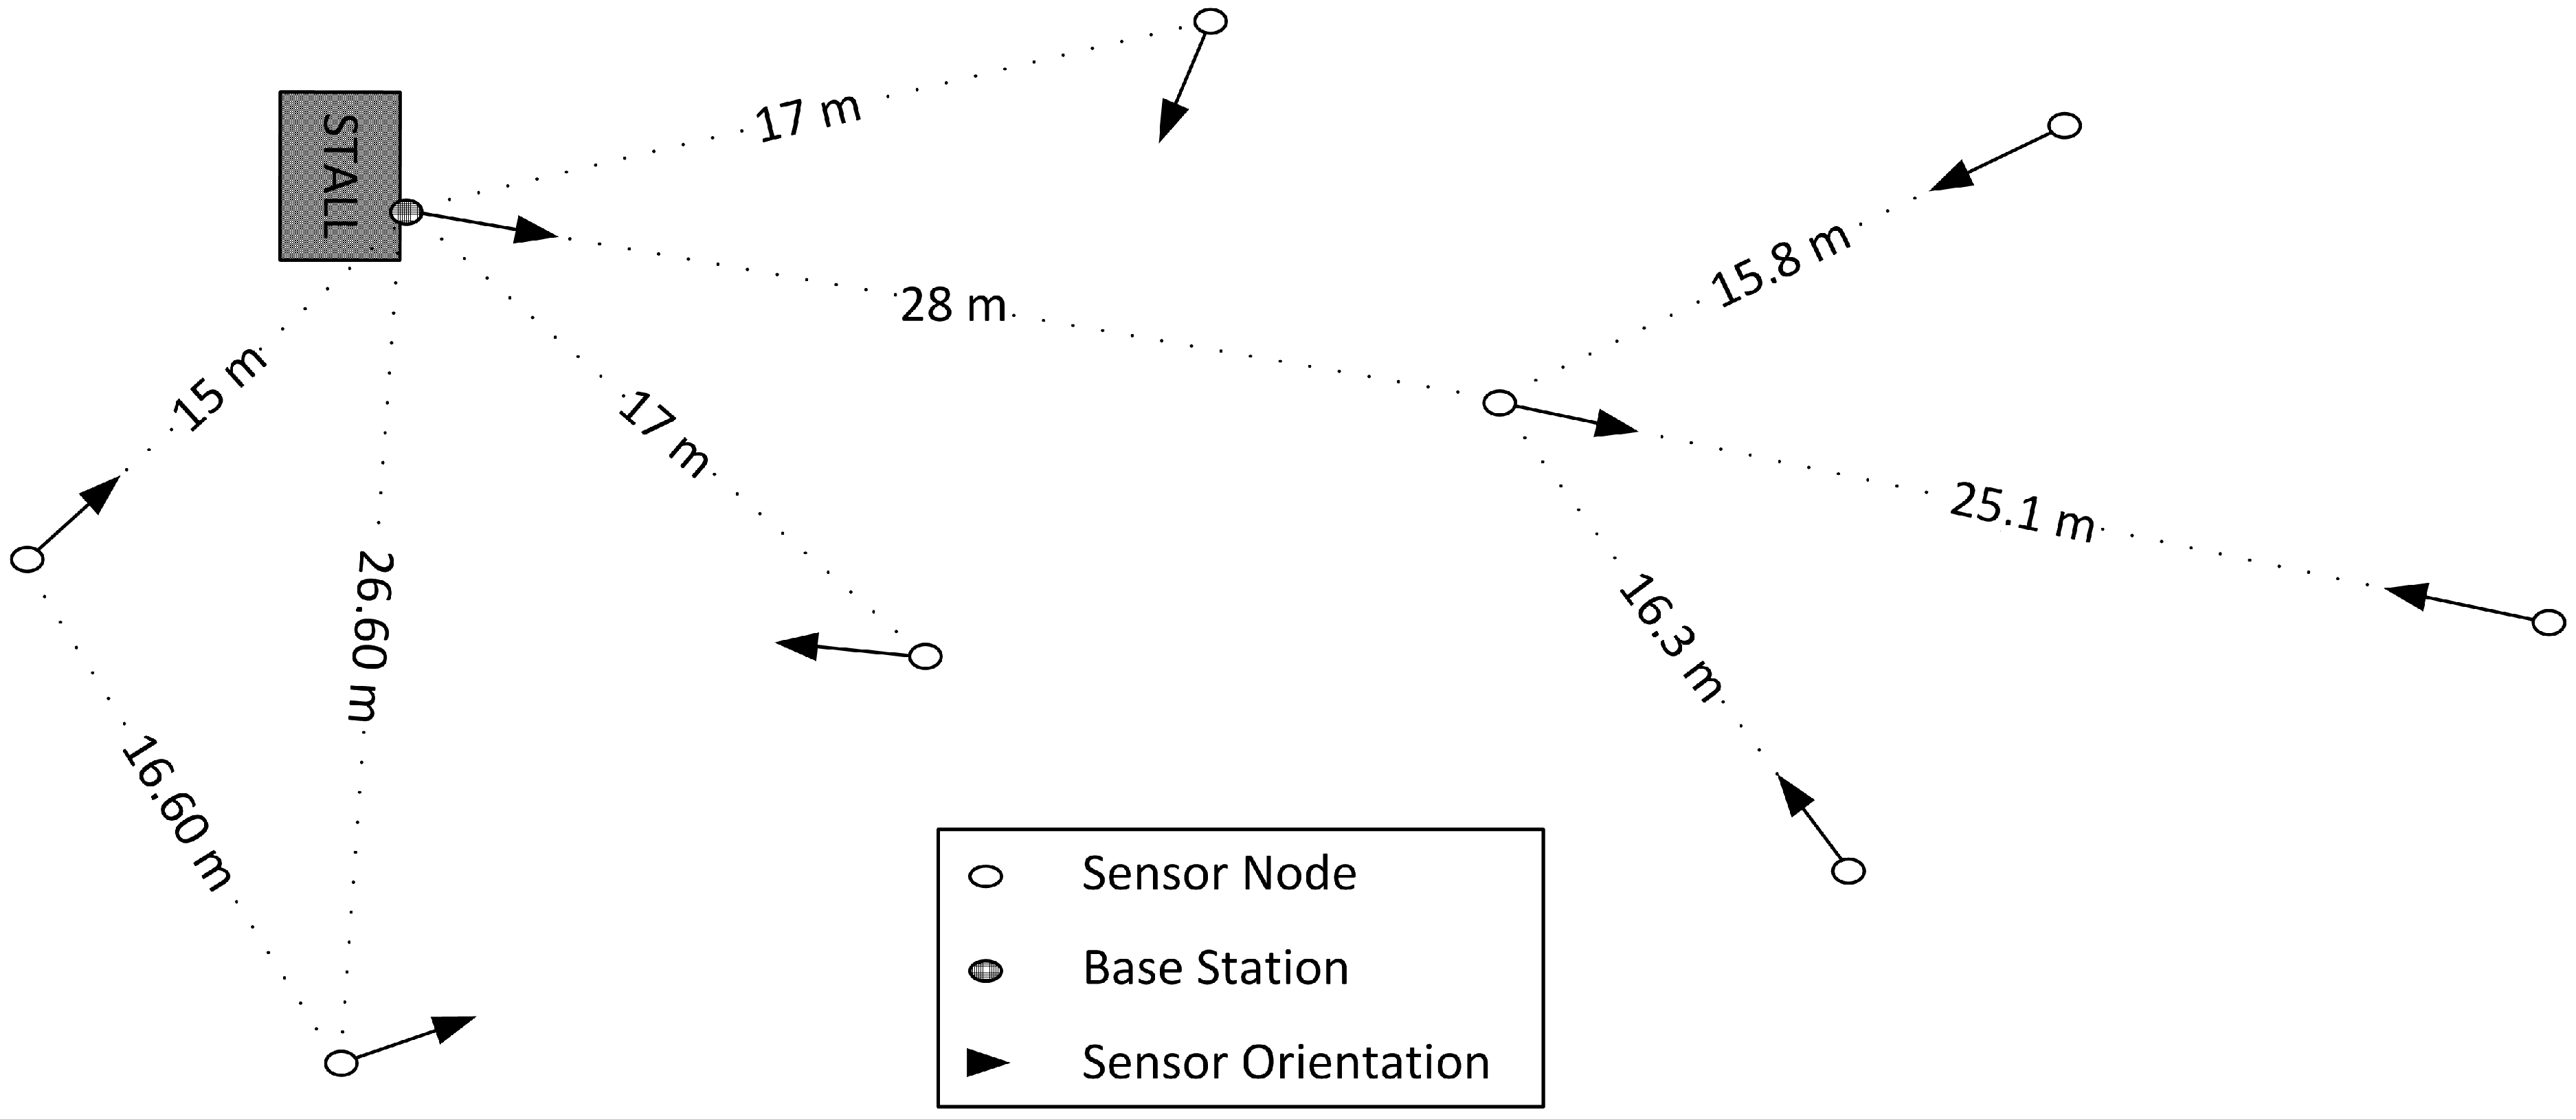
The nodes were deployed in an outdoor area at the facilities of the Centro de Automática y Robótica in Arganda del Rey, as shown in
Figure 5a,b. The distribution and heights of the nodes were mostly random, trying to force the use of the multi-hop routing capabilities provided by the SunSPOTs, so we could expect the creation of groups of nodes. A scheme of the deployment is shown in
Figure 6. The heights were above one meter in all the nodes but in one, which was closer to the ground, at a height of about 40 cm. The base station was fixed to the outside of the stall, at an approximate height of 1.5 m.
Figure 6.
Experiment deployment.
Figure 6.
Experiment deployment.
Figure 6 also shows the orientation of the sensors, and therefore of their inverted-F antennas. As explained in [
5], the orientation of the antennas, along with the irregularity in their radiation patterns introduce a non-negligible phenomenon that has an impact in the strength of the received signal (RSSI). The orientations were also selected randomly.
In the previous section we have introduced the idea that the control system is executed periodically. The interval used in the experiments was fixed to 20 s in order to guarantee the neighbor discovery and the route establishment for all the status messages generated in each iteration. A shorter interval may be used taking into account the number of messages that can be generated in each iteration and the values obtained in [
19]. Moreover, each sensor node was configured to sent a status message addressed to the base station at the end of each iteration of the control system.
5. Conclusions
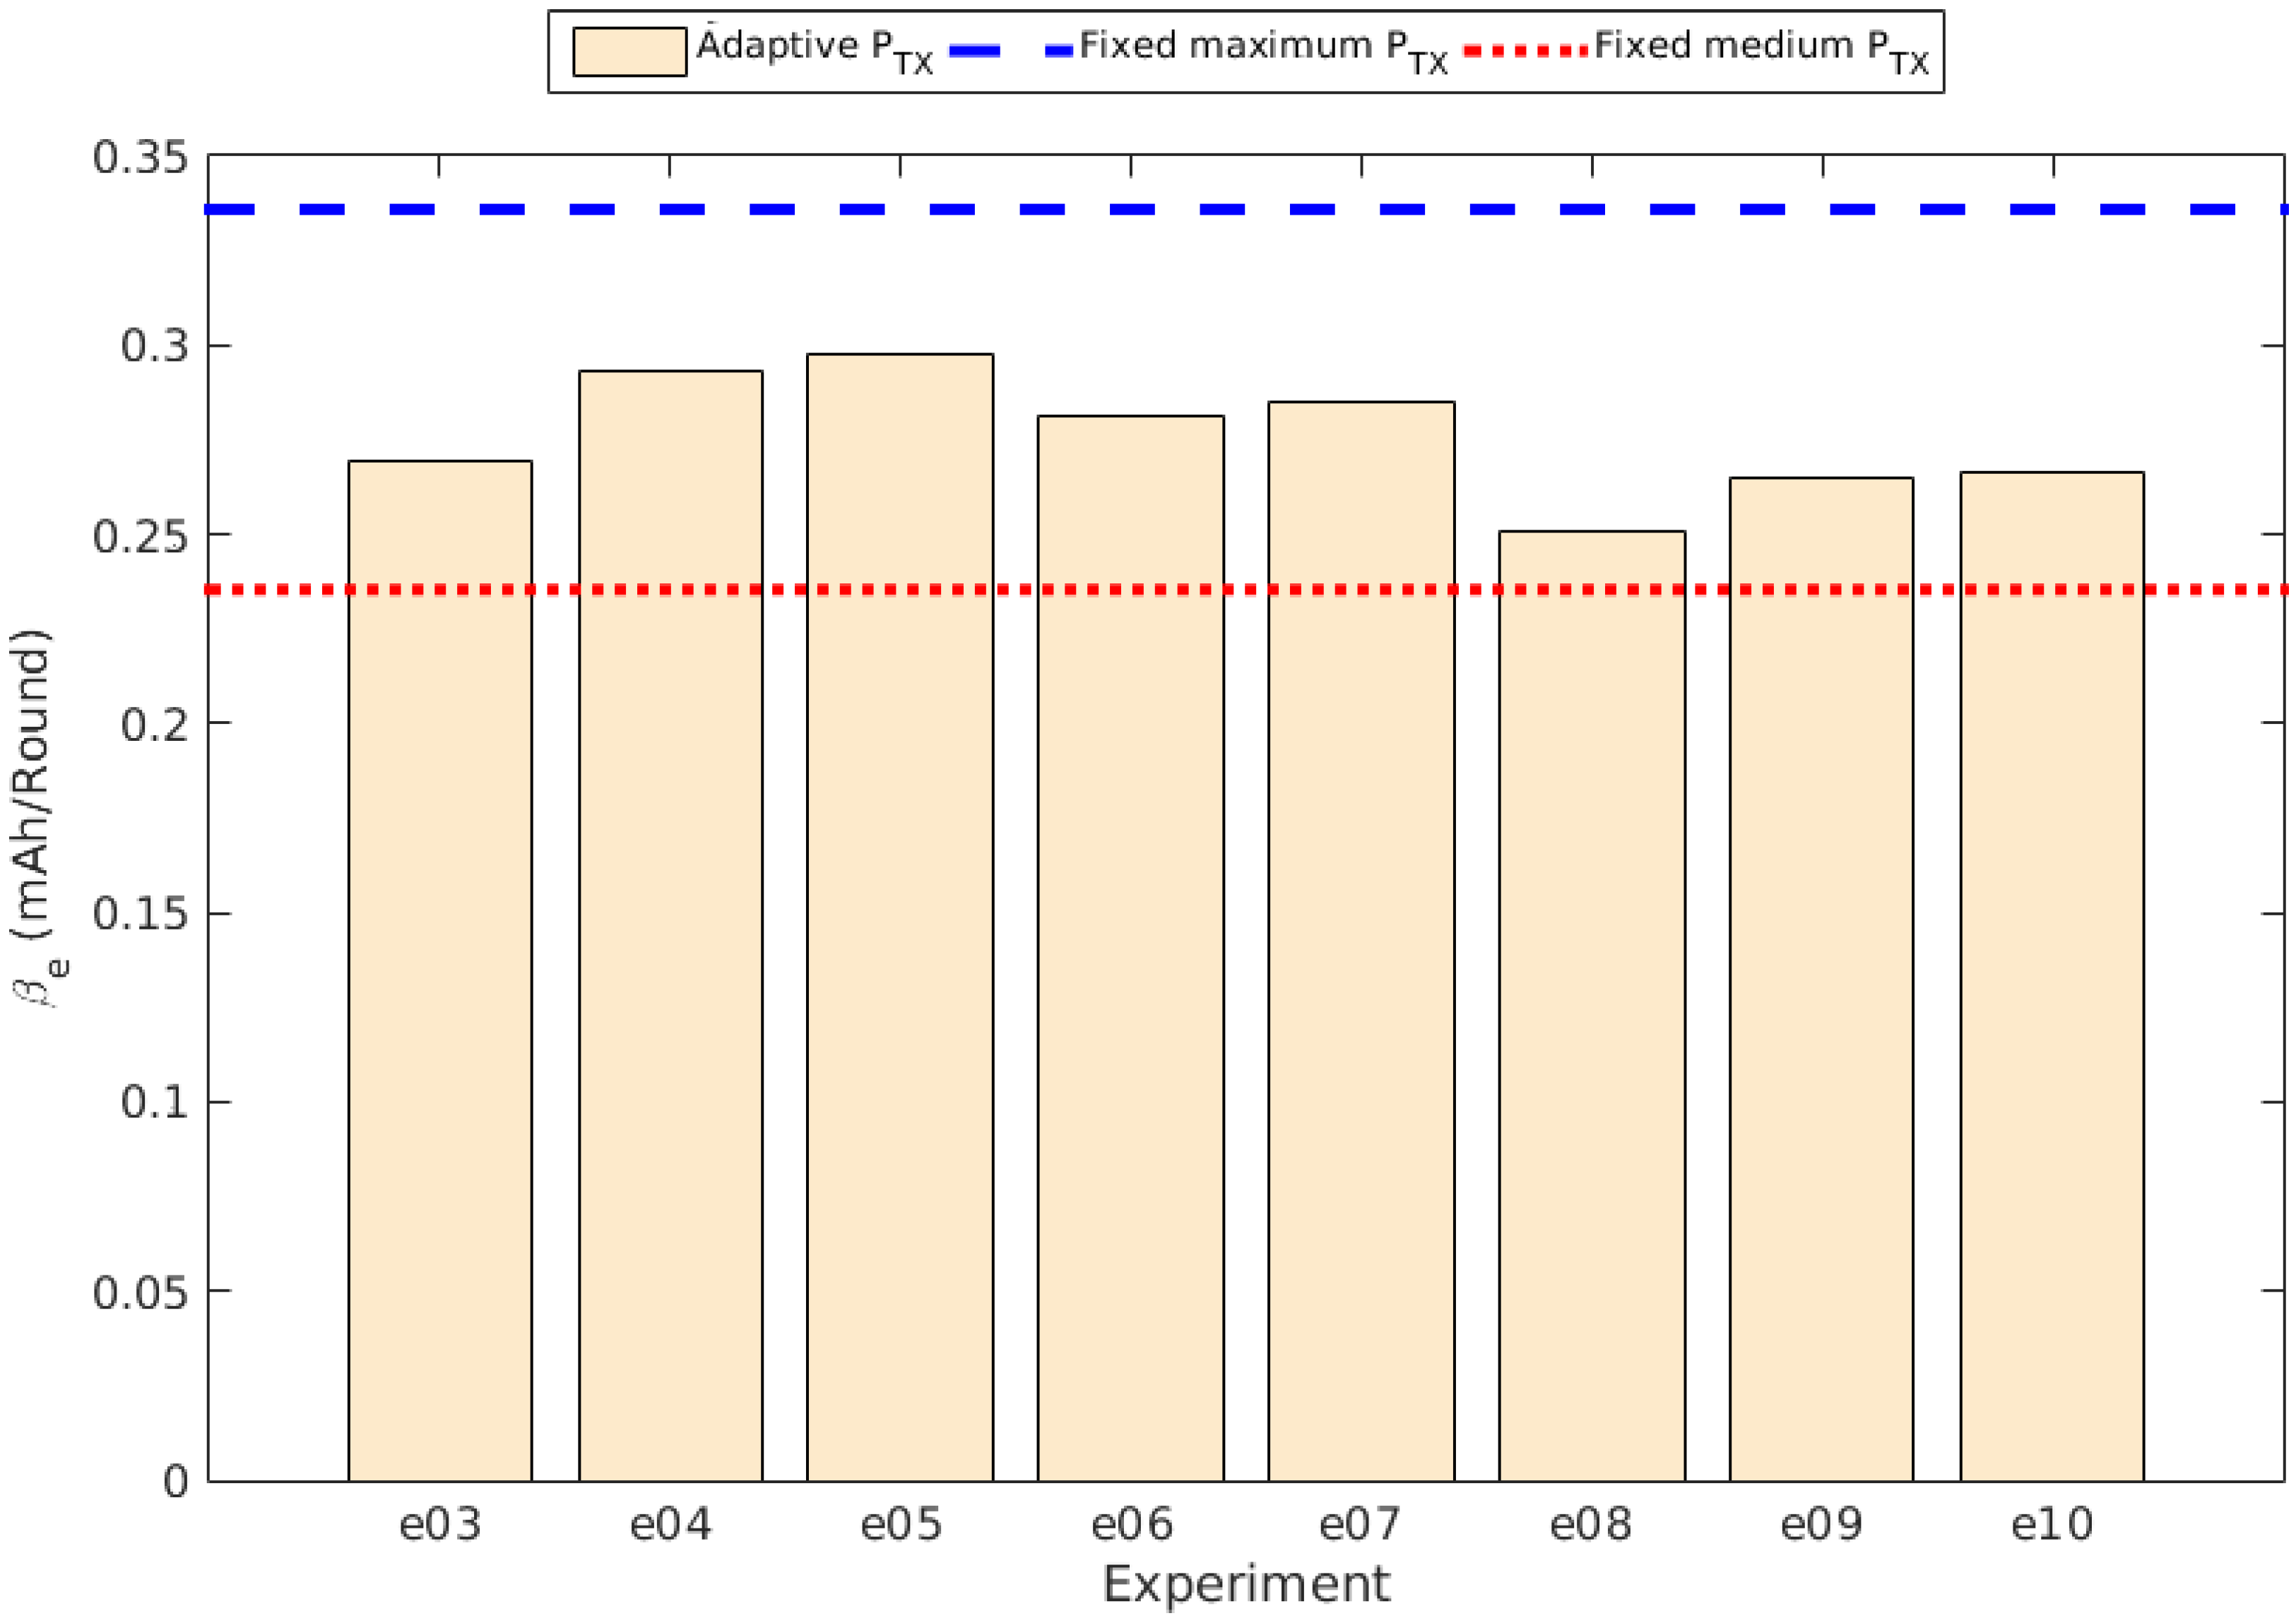
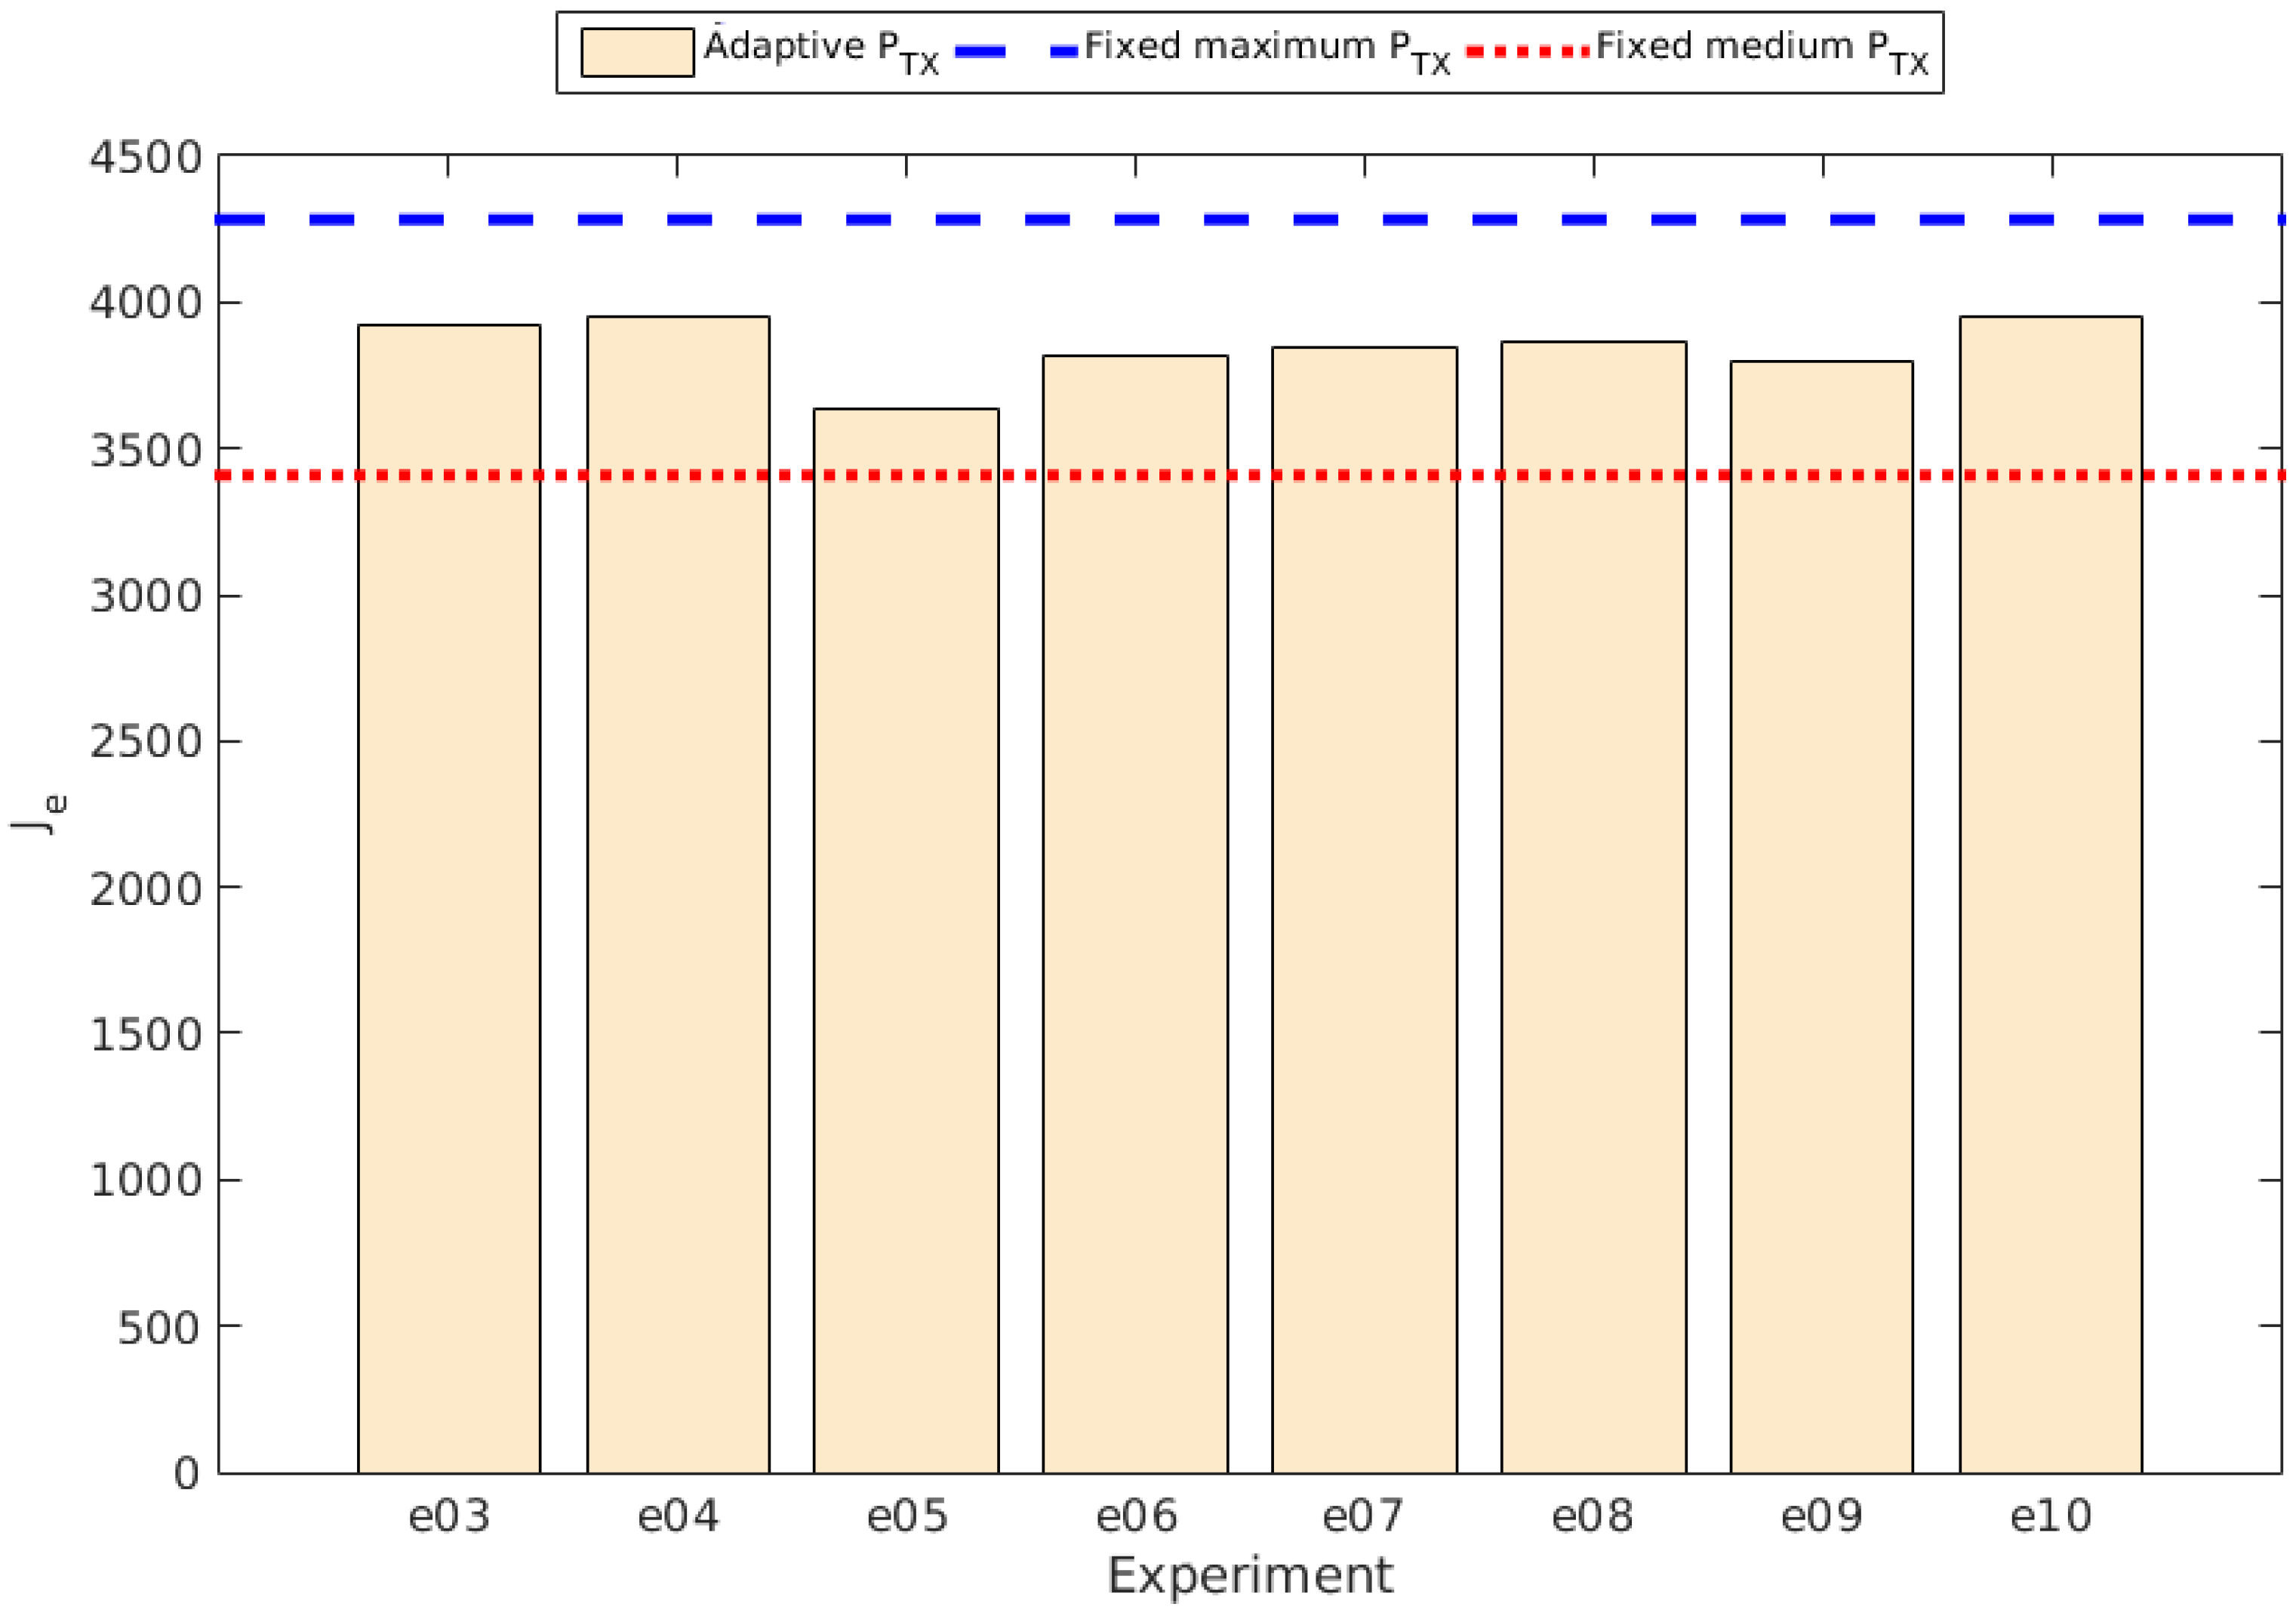
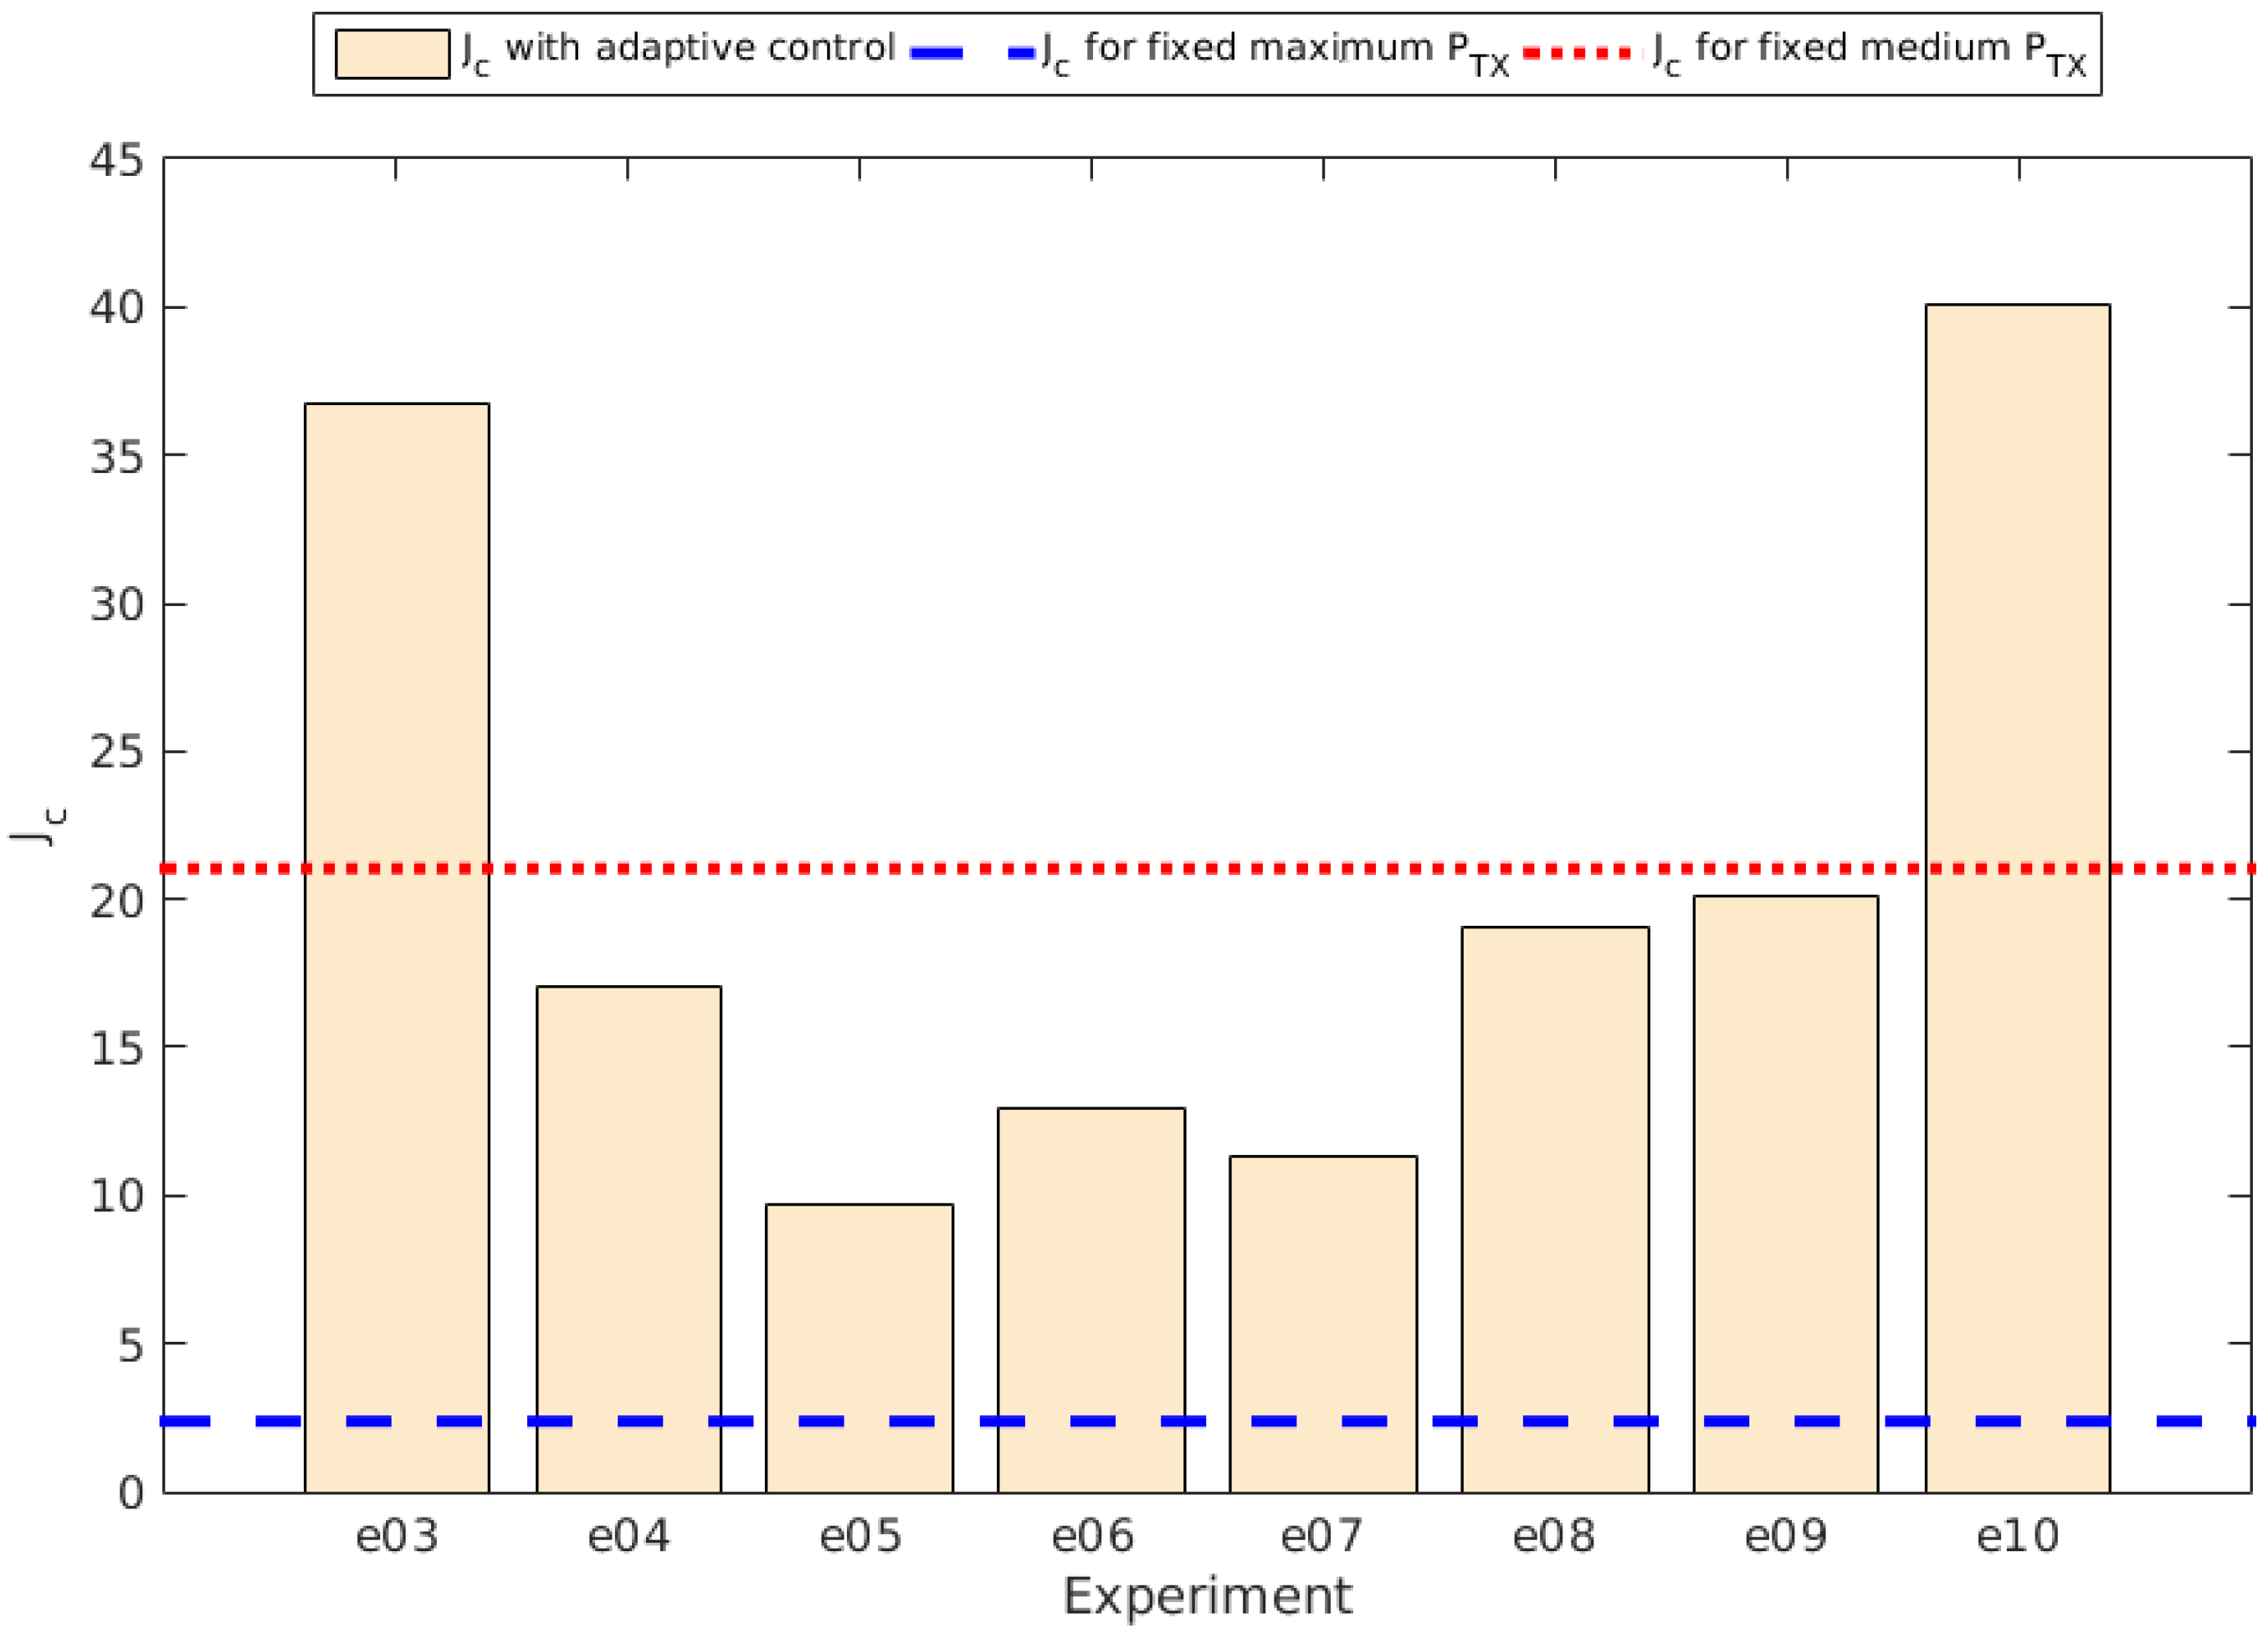
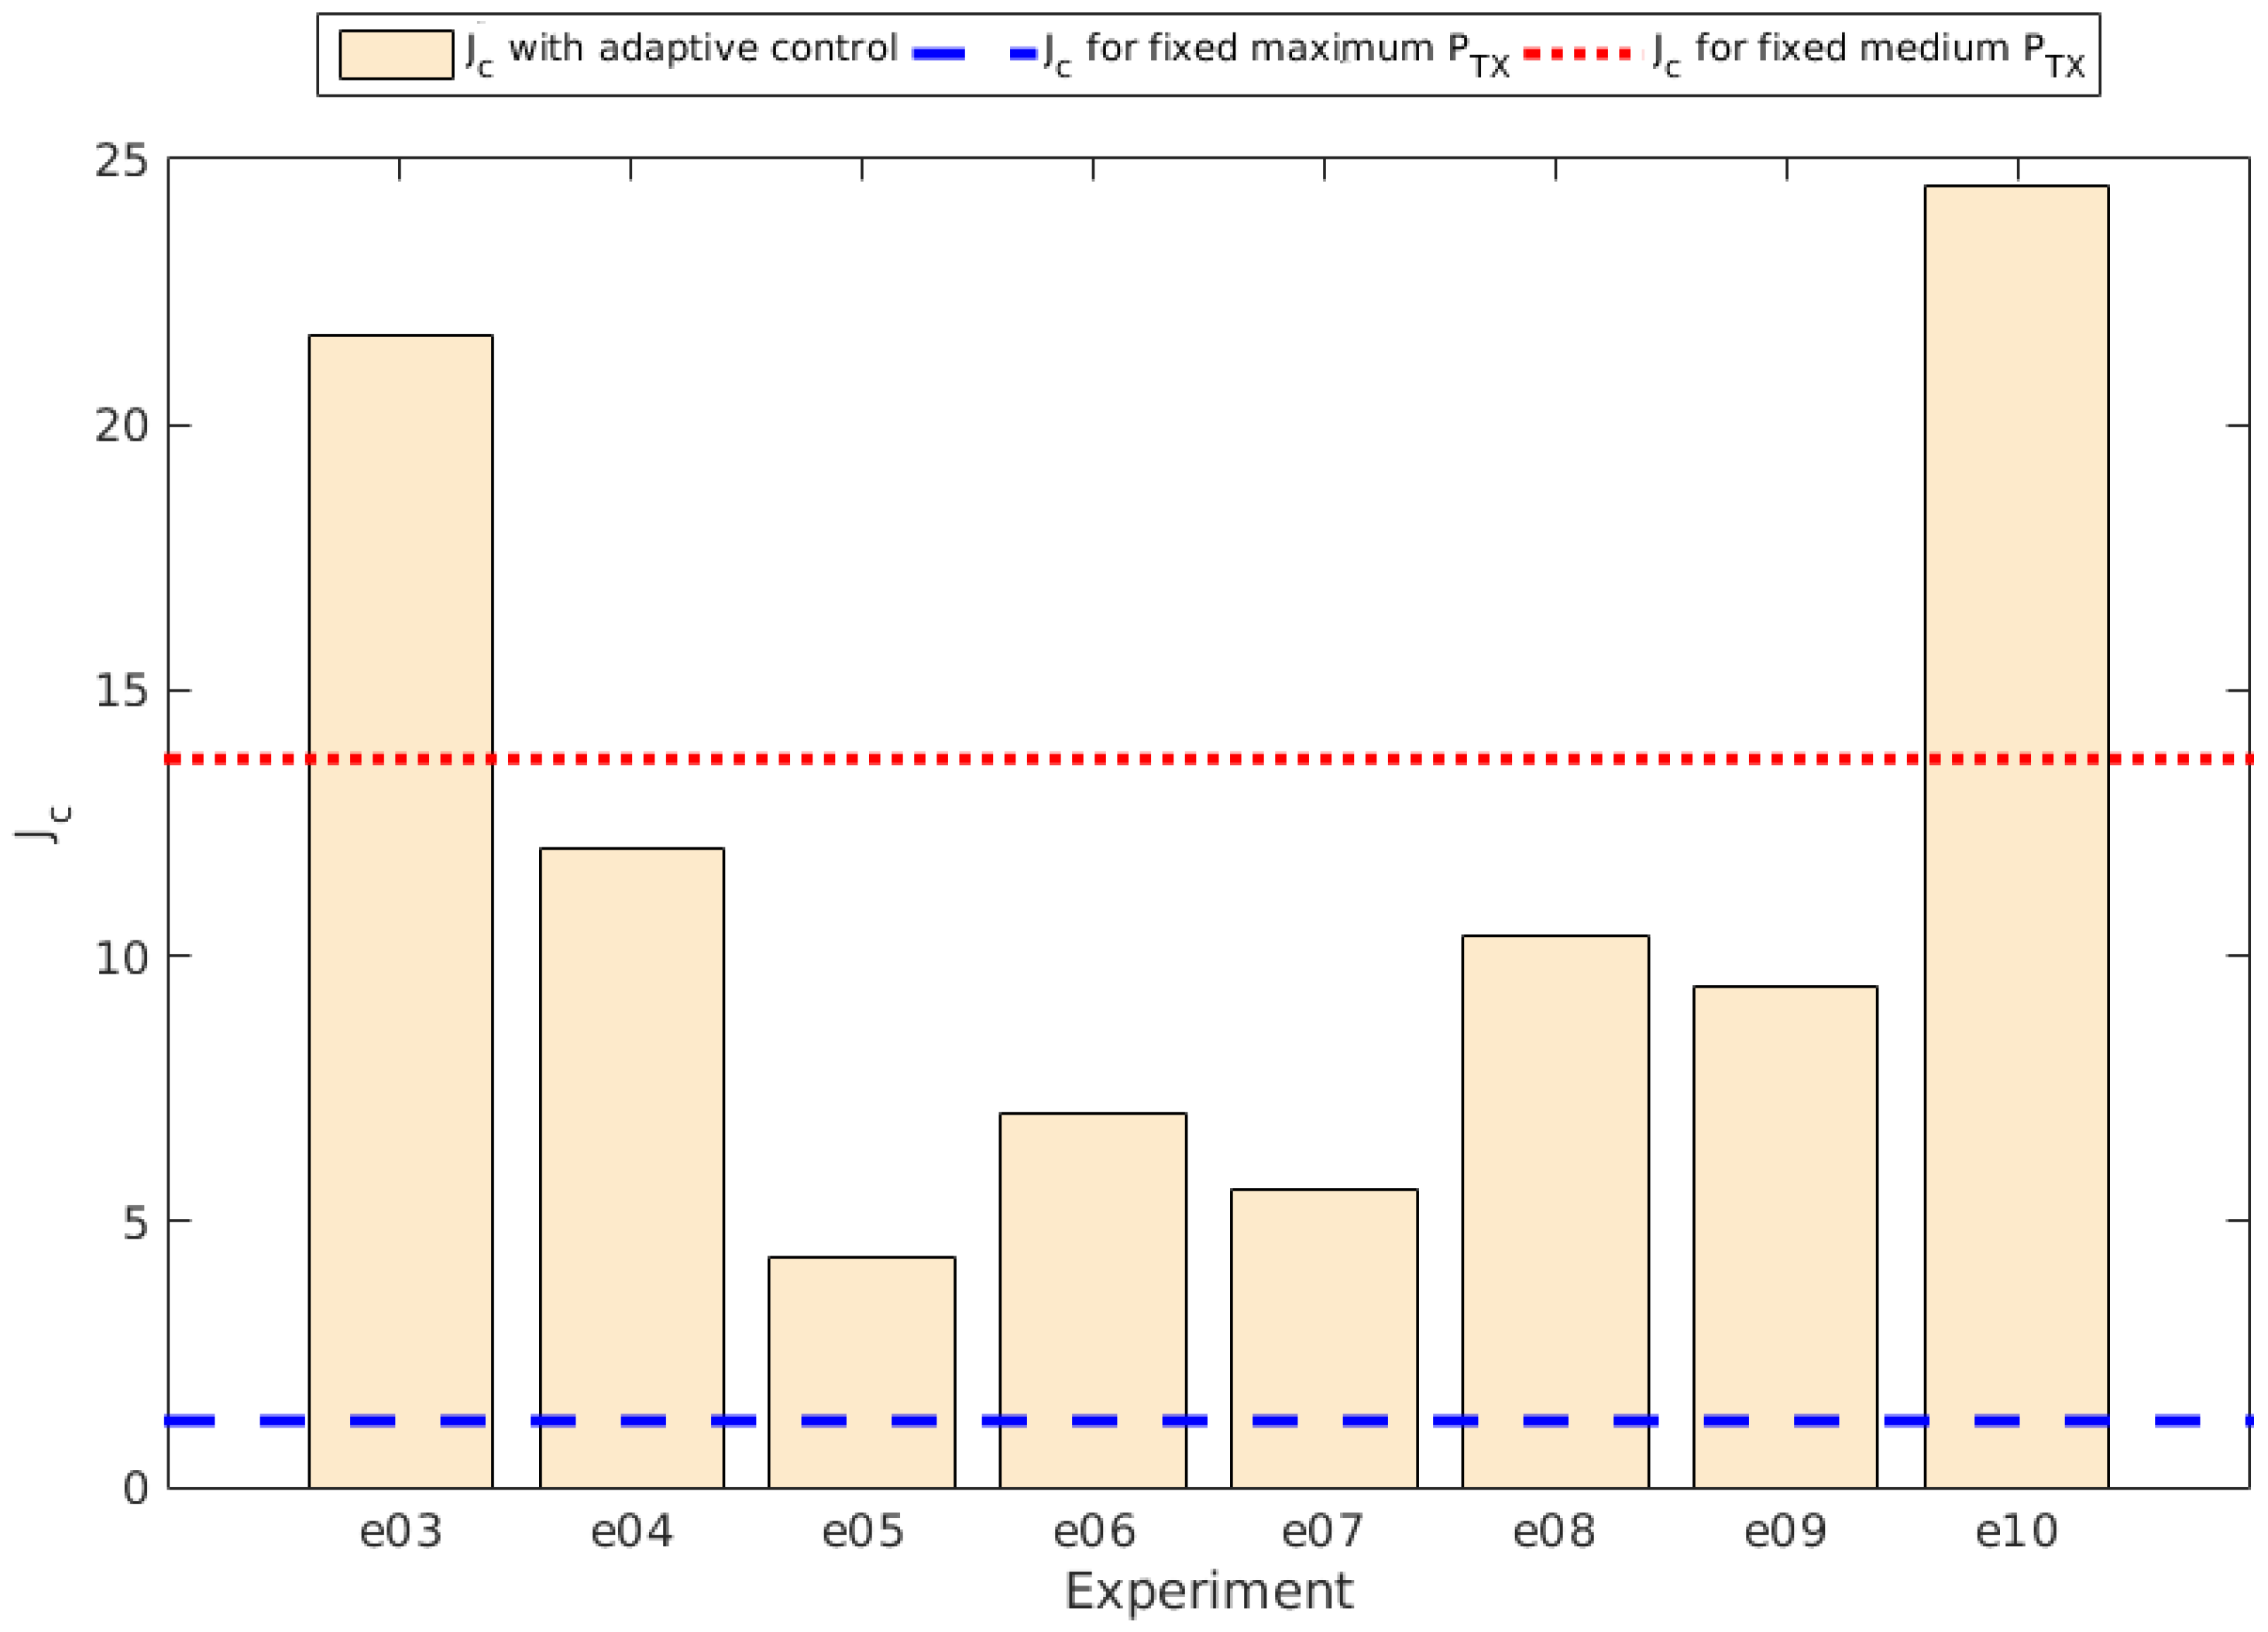
We have observed in the results that when all nodes in a WSN are using a fixed transmission power, the system exhibits either a good connectivity or good power savings, but not both at the same time. Thereby in the first part of the results analysis we have observed that using the higher transmission power available means having the poorest power saving, but still we have nearly a perfect connectivity. On the other hand, if we choose to use a medium transmission power, we get the better power saving of all the experiments, but with a very poor connectivity. From the same observations we can conclude that experiment e05 offers the best trade-off between energy saving and communications reliability. Also experiments e06 and e07 offer good results. These three experiments have in common that they use a high value for the parameter, that is related to the variation rate of the transmission power. In future works we shall explore for the definition of a performance index for the estimation of the better trade-off of energy and communications reliability.
The fuzzy control based self-adaptive system allows the nodes in the network to achieve a balance between those two targets. It can provide a good enough power saving while keeping a high reliability of the communications. And this is specially useful when the network topology is random, and/or prone to changes, like networks with mobile nodes. Anyway the parameters with the best and the worst results in the experiments described in this paper should be tested in longer experiments.
Another open issue that worth exploring is to study how the network react to unexpected changes, like new nodes in the neighborhood, or known nodes disappearing for whatever reason. It is expected that the self-adaptive system reacts properly reaching an steady state after a while. And this is also an important issue: how long does it take to the network to reach an steady or equilibrium state?
In our experiments, we have used a fixed interval at each node for monitoring the state of the network. Of course this has influence on the observation on the current dynamic behavior of the network, and on how long it takes for the transient period. However, it can also be updated adaptively. For instance, the interval can be lower when the network is in the transient period, and higher when it has reached a steady state.
A deeper knowledge about what is the best solution will require different studies related to the dynamic behavior of networks following also cyber-physical systems approaches. The rationality of this proposal is that the dynamic behavior of the network is influenced by the topology, the physical environment, the computational load of the nodes and their processing capacity, among others.


