Article

Disposable, Paper-Based, Inkjet-Printed Humidity and H2S Gas Sensor for Passive Sensing Applications

1
Research Institute for Microwave and Millimeterwave Studies (RIMMS), National University of Sciences and Technology (NUST), Islamabad 44000, Pakistan
2
Computer, Electrical and Mathematical Sciences and Engineering (CEMSE), King Abdullah University of Science and Technology (KAUST), Thuwal 23955-6900, Saudi Arabia
*
Author to whom correspondence should be addressed.
Sensors 2016, 16(12), 2073; https://doi.org/10.3390/s16122073
Submission received: 31 July 2016 / Revised: 26 November 2016 / Accepted: 28 November 2016 / Published: 6 December 2016
(This article belongs to the Special Issue Gas Nanosensors)

Abstract

:
An inkjet-printed, fully passive sensor capable of either humidity or gas sensing is presented herein. The sensor is composed of an interdigitated electrode, a customized printable gas sensitive ink and a specialized dipole antenna for wireless sensing. The interdigitated electrode printed on a paper substrate provides the base conductivity that varies during the sensing process. Aided by the porous nature of the substrate, a change in relative humidity from 18% to 88% decreases the electrode resistance from a few Mega-ohms to the kilo-ohm range. For gas sensing, an additional copper acetate-based customized ink is printed on top of the electrode, which, upon reaction with hydrogen sulphide gas (H2S) changes, both the optical and the electrical properties of the electrode. A fast response time of 3 min is achieved at room temperature for a H2S concentration of 10 ppm at a relative humidity (RH) of 45%. The passive wireless sensing is enabled through an antenna in which the inner loop takes care of conductivity changes in the 4–5 GHz band, whereas the outer-dipole arm is used for chipless identification in the 2–3 GHz band.

1. Introduction

An estimated 200 billion devices will be connected to the Internet by the year 2025 in the Internet-of-Things (IoT) realm [1]. A typical IoT system requires three ingredients: firstly, the wide variety of sensors that measure environmental, industrial, biological, activity, imaging, and other parameters; secondly, the connectivity mechanism between these sensors and their central controller; and thirdly, the plethora of applications using these two enablers in the domain of healthcare, wearables, transportation, smart homes, connected cities, and industries [2,3,4,5,6,7,8,9].
The staggering number of required sensors and their associated cost has motivated research to find ways of making them pervasive and reduce their cost to such an extent that they can potentially become disposable. To that end, radio frequency identification (RFID) technology has emerged as a strong candidate for widespread usage in the above-mentioned scenarios. In the last few years, RFID has transitioned from a mere identification technology to a versatile platform that has been used for tracking, localization, and remote sensing. In the last of these categories, RFID has been demonstrated for wireless gas and humidity sensing [10,11,12]. In addition, many similar inkjet-printed sensors, without RFID functionality, have also been presented on various substrates such as paper, polyimide, and polyethylene terephthalate (PET) [13,14,15,16,17,18]. Among these sensors, resistive response types tend to have a slow response time (~60 min) [10,11]. On the other hand, capacitive response type sensors have a faster response time (<10 min); however, their integration with antenna for remote identification has not been widely published [14,15,16,17,18,19]. Lastly, sensors utilizing special materials such as carbon nanotubes pose challenges of fabrication and can be less selective in an ambient environment [12].
This paper presents a dual-functionality, paper-based, inkjet-printed humidity and gas sensor. For humidity sensing, the resistive response of an interdigitated electrode, made of silver nanoparticle ink is evaluated to yield a fast response time of ~3 min. On the other hand, for hydrogen sulfide sensing, a copper acetate-based sensing material that is sensitive to H2S is printed over the electrode. The detection of hydrogen sulfide, due to its toxic nature, is critically important in many industrial and residential settings [20]. The sensor electrode is integrated with an antenna which is a combination of a loop and a dipole, potentially enabling wireless sensing using the frequency domain chipless RFID technique. The proposed design omits the use of discrete components and provides a low-cost alternative for humidity and gas sensing.

2. Sensor Design and Working Principle

Humidity and gas sensing through printed and passive methods pose few basic requirements. For the former, a structure that is able to change its electrical properties based on ambient humidity is desirable. On the other hand, for gas sensing, a specific reagent that is sensitive to the target gas and results in a measurable electrical, physical, or optical change is needed. Lastly, a mechanism to detect and interpret these changes is required for the meaningful usage of such sensors. To that end, this paper combines three elements to achieve the above-mentioned tasks. Firstly, an interdigitated electrode, made using silver nano-particle ink combined with an underlying paper substrate, together perform as a humidity sensor. Secondly, aiming for the sensing of toxic hydrogen sulfide (H2S) gas, a printable chemi-resistive film of copper acetate is utilized as a reagent. Due to the chemical reaction between the reagent and H2S, the physical, optical, and electrical features of the electrode change in real time. The third element of the system involves the passive detection of these changes by adopting the chipless RFID technique [21]. This is achieved by placing the sensor electrode as a load to a double loop folded dipole antenna whose design will be discussed in subsequent sections.

2.1. Paper Substrate

The choice of substrate for inkjet printing of the electrode, reagent, and the antenna requires careful consideration of parameters such as porosity, surface roughness, thickness, permittivity, and cost. Organic flexible substrates such as paper and plastic are regularly being used to design antennas, sensors, and chipless RFID tags [10,11,12,13,21,22,23,24,25,26]. More specifically, paper, due to it lower cost and scalability to roll-to-roll and reel-to-reel printing has become a preferable choice for inkjet printing. One downside associated with a paper substrate, especially if it is of porous nature, is the inferior printing resolution, as the conductive ink during the printing process seeps into adjacent pores, leading to deformation in the printed designs. To avoid this issue, Kodak photo paper is utilized in this work which is glossy and flexible with low porosity. The selected paper has a permittivity, loss tangent, and thickness of 2.6, 0.05, and 0.28 mm respectively.

2.2. Interdigitated Electrode

The layout of the sensor’s interdigitated electrode is shown in Figure 1. With dimensions of 45.75 × 20 mm2, the electrode is connected to the inner loop of the antenna at its edges and acts as the base for printing of the chemi-resistive layer. Each electrode includes a total of 14 fingers with lengths and widths of 40 mm and 200 μm, respectively. The spacing between the adjacent electrode fingers is also 200 μm. These dimensions are optimized after a number of printing iterations to achieve optimum fabrication results. The electrode is inkjet-printed using Dimatix DMP 2831 printer using silver nano-particle ink from UT Dots on the Kodak photo paper substrate discussed above. The drop spacing for the nano-particle ink (silver 20% by weight) is 25 μm with a nozzle size of 10 pL. After printing 5 layers of the conductive ink on top of each other, the electrode is heat sintered at 120 °C for 10 min to achieve a conductivity of 6 × 10⁶ S/m with a conductor height of ~2 μm. Post-sintering resistance measurements show a high initial resistance of 10 MΩ.

2.3. Chemi-Resistive Ink
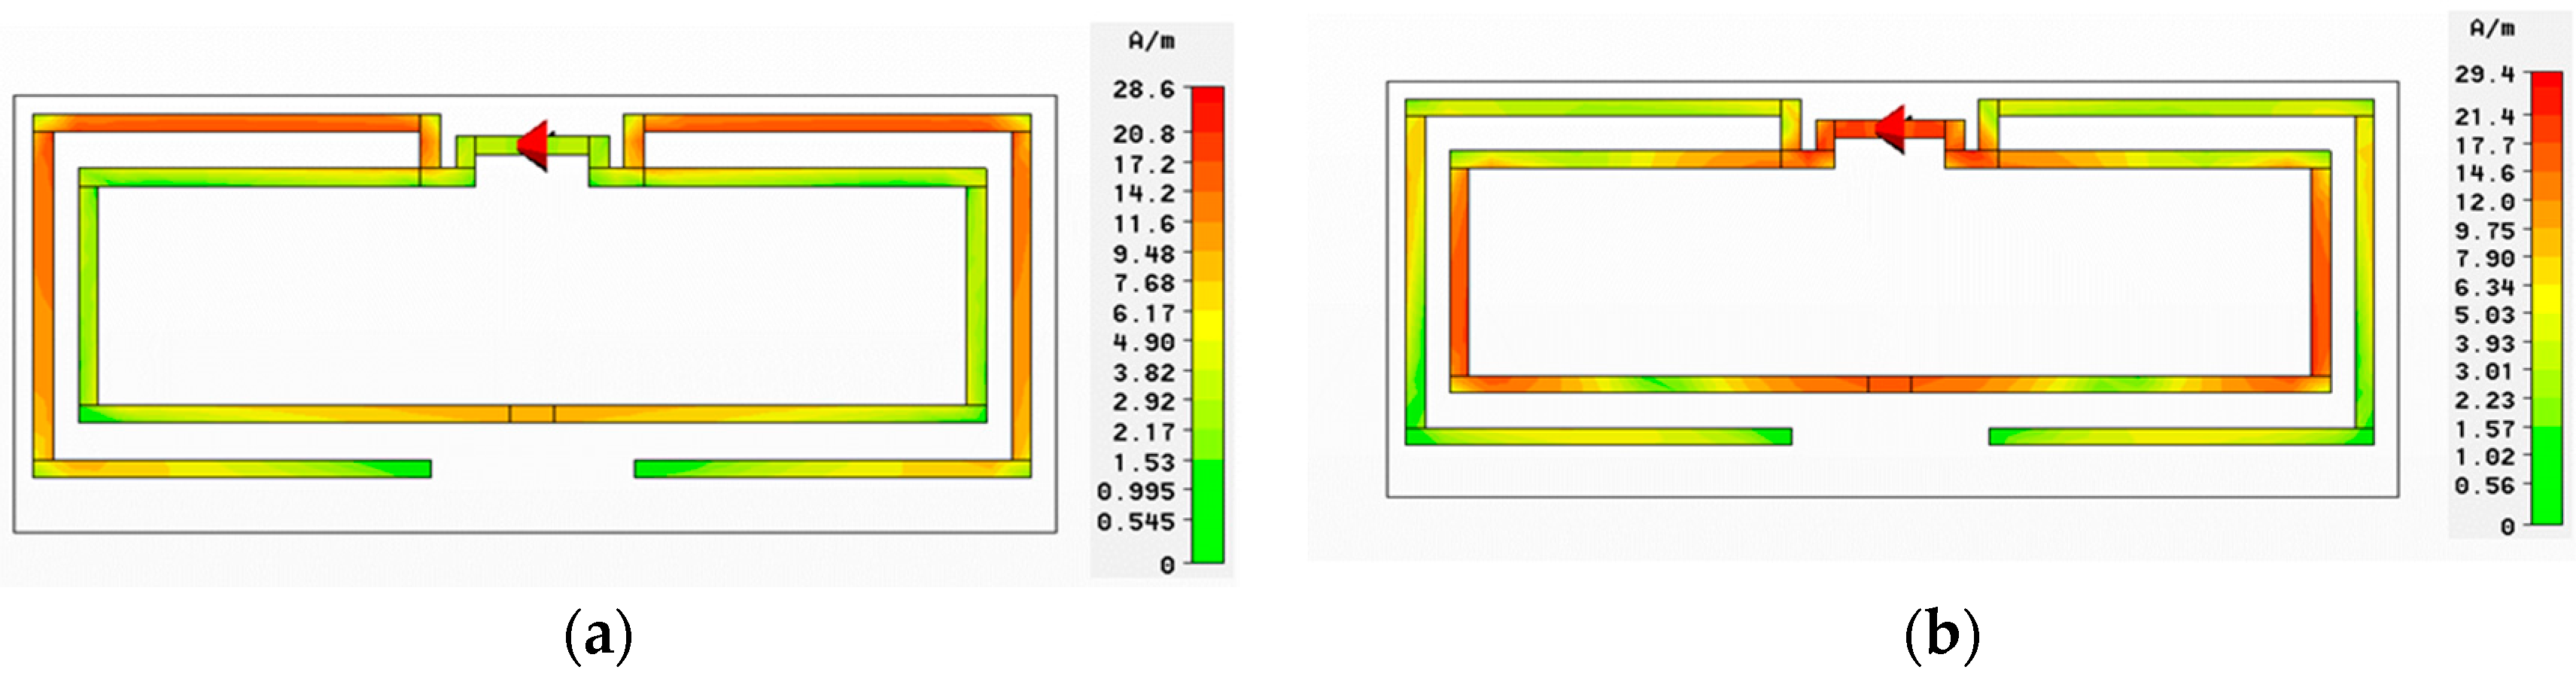
After preparation of the electrode, a mechanism for gas sensing is devised. For this purpose, chemicals that are sensitive to H2S and are printable using the inkjet printing process are investigated. The latter requirement is critical, as the specific viscosity and surface tension is required for accurate printing on the paper substrate. The printable chemical ink when exposed to gas leads to a visual change in its color as well as variation in its chemical properties. The latter is responsible for the change in the resistivity of the ink, hence the name “chemi-resistive layer”.
Hydrogen sulfide gas is known to react with metal acetates that typically result in a formation of metal sulfides. The electrical response of copper acetate films in the presence of hydrogen sulfide gas has been reported [13,23] and is governed by the following chemical equation:
Cu ( CH 3 COO ) 2 ( s ) + H 2 S ( g ) yields CuS + 2 CH 3 COOH
The original chemi-resistive ink of copper acetate has low conductivity; however, in the presence of H2S, copper sulfide is formed, increasing the conductivity [27]. This change in turn affects the electrode’s conductivity and the antenna’s behavior as the electrode acts as a load to the antenna.
The composition of the copper-acetate solution is critical for successful printing using the inkjet printer. This is achieved by mixing metal salt in three solvents namely water, ethylene glycol (EG), and iso-propanol (IPA). A volume ratio of 8:1:1 is used for a water/EG/IPA solvent mixture for a copper-acetate solution with a final concentration of 0.1 mol. For inkjet printing of the chemi-resistive film, three layers are printed on top of the interdigitated electrode with a drop spacing of 30 μm. This tag is again heat sintered at a temperature of 150 °C for 15 min before it is used for gas sensing.

3. Antenna Design

The specialized antenna designed in this work plays two distinct roles (Figure 2). Firstly, the inner loop connects and encircles the interdigitated electrode that acts as its load. Any change in the electrode’s properties manifests as a change in frequency behavior of the inner loop. The second role of the antenna is to achieve a unique identification for each specific tag. This is realized by altering the dimensions of the outer dipole arms of the antenna. Using this chipless RFID approach, wherein each tag has a unique electromagnetic signature, passive sensing through its radar cross-section (RCS) can thus be accomplished [21]. Based on these requirements, the outer identification dipole is designed to resonate in the 2–3 GHz range, whereas the inner sensing loop resonates between 5 and 6 GHz as verified by the current distribution shown in Figure 3. The frequency and bandwidth are controlled by the dipole length, horizontal arm lengths L5, L6, and L7, and vertical arm lengths W4 and W5. The antenna is simulated in CST Microwave Studio (ver. 14), and its optimized parameters are shown in Table 1. The horizontal arm lengths L6 and L7 control the resonance frequency in the identification band. For instance, increasing L6 and L7 decreases the resonating frequency while maintaining the operational bandwidth due to constant vertical arm lengths.
The 2.8 GHz frequency band due to the outer dipole is utilized for the tag’s chipless identification. This is achieved by creating minor changes in the dimensions L6 and L7, thereby getting varied resonances between 2.7 GHz and 2.9 GHz. Table 2 enlists dimensions of five such example tags, whereas preliminary simulation results (Figure 4) show the corresponding unique resonances. Following the same procedure and utilizing frequency shift encoding technique as presented in [21], a large number of individual tags can thus be generated.
In order to enable characterization of the antenna via an SMA connector, a balun is also included in the design. The balun introduces a 180° phase shift between the two microstrip lines that differentially excite the dipole antenna. To obtain this phase shift, the difference in the microstrip lengths at the center frequency is approximately λ 2 . The balun is realized on the same layer as the antenna, whereas its partial ground plane is printed on a separate layer and subsequently glued to the antenna layer.

4. Experimental Results

The interdigitated electrode, dipole antenna, and the chemi-resistive film are all fabricated using inkjet printing as discussed earlier through individually optimized steps for each [21]. The fabricated prototypes are shown in Figure 5. An SMA connector is mounted using conductive silver epoxy and an Agilent VNA (Model: N5232A) is used for s-parameter measurements.
The experimental setup for conductivity measurements under controlled H2S exposure is shown in Figure 6. The details of the setup are discussed in [28,29]. The system consists of the following:
-
A gas line with a flow control valve coming from the H2S gas cylinder with controllable concentration. The Mass Flow Controller (MFC) is provided by Alicat Scientific Inc. (Tucson, AZ, USA).
-
An aluminum chamber for housing the sensor with two leads for external connections. In addition, the chamber consists of commercial humidity sensor (Honeywell HIH-4000-003) for calibration purposes.
-
The chamber is connected to an LCR meter (Agilent E4980A) that is accessed by a PC through RS-232 to USB interface and National Instruments (NI) LabVIEW software (ver. 2011).

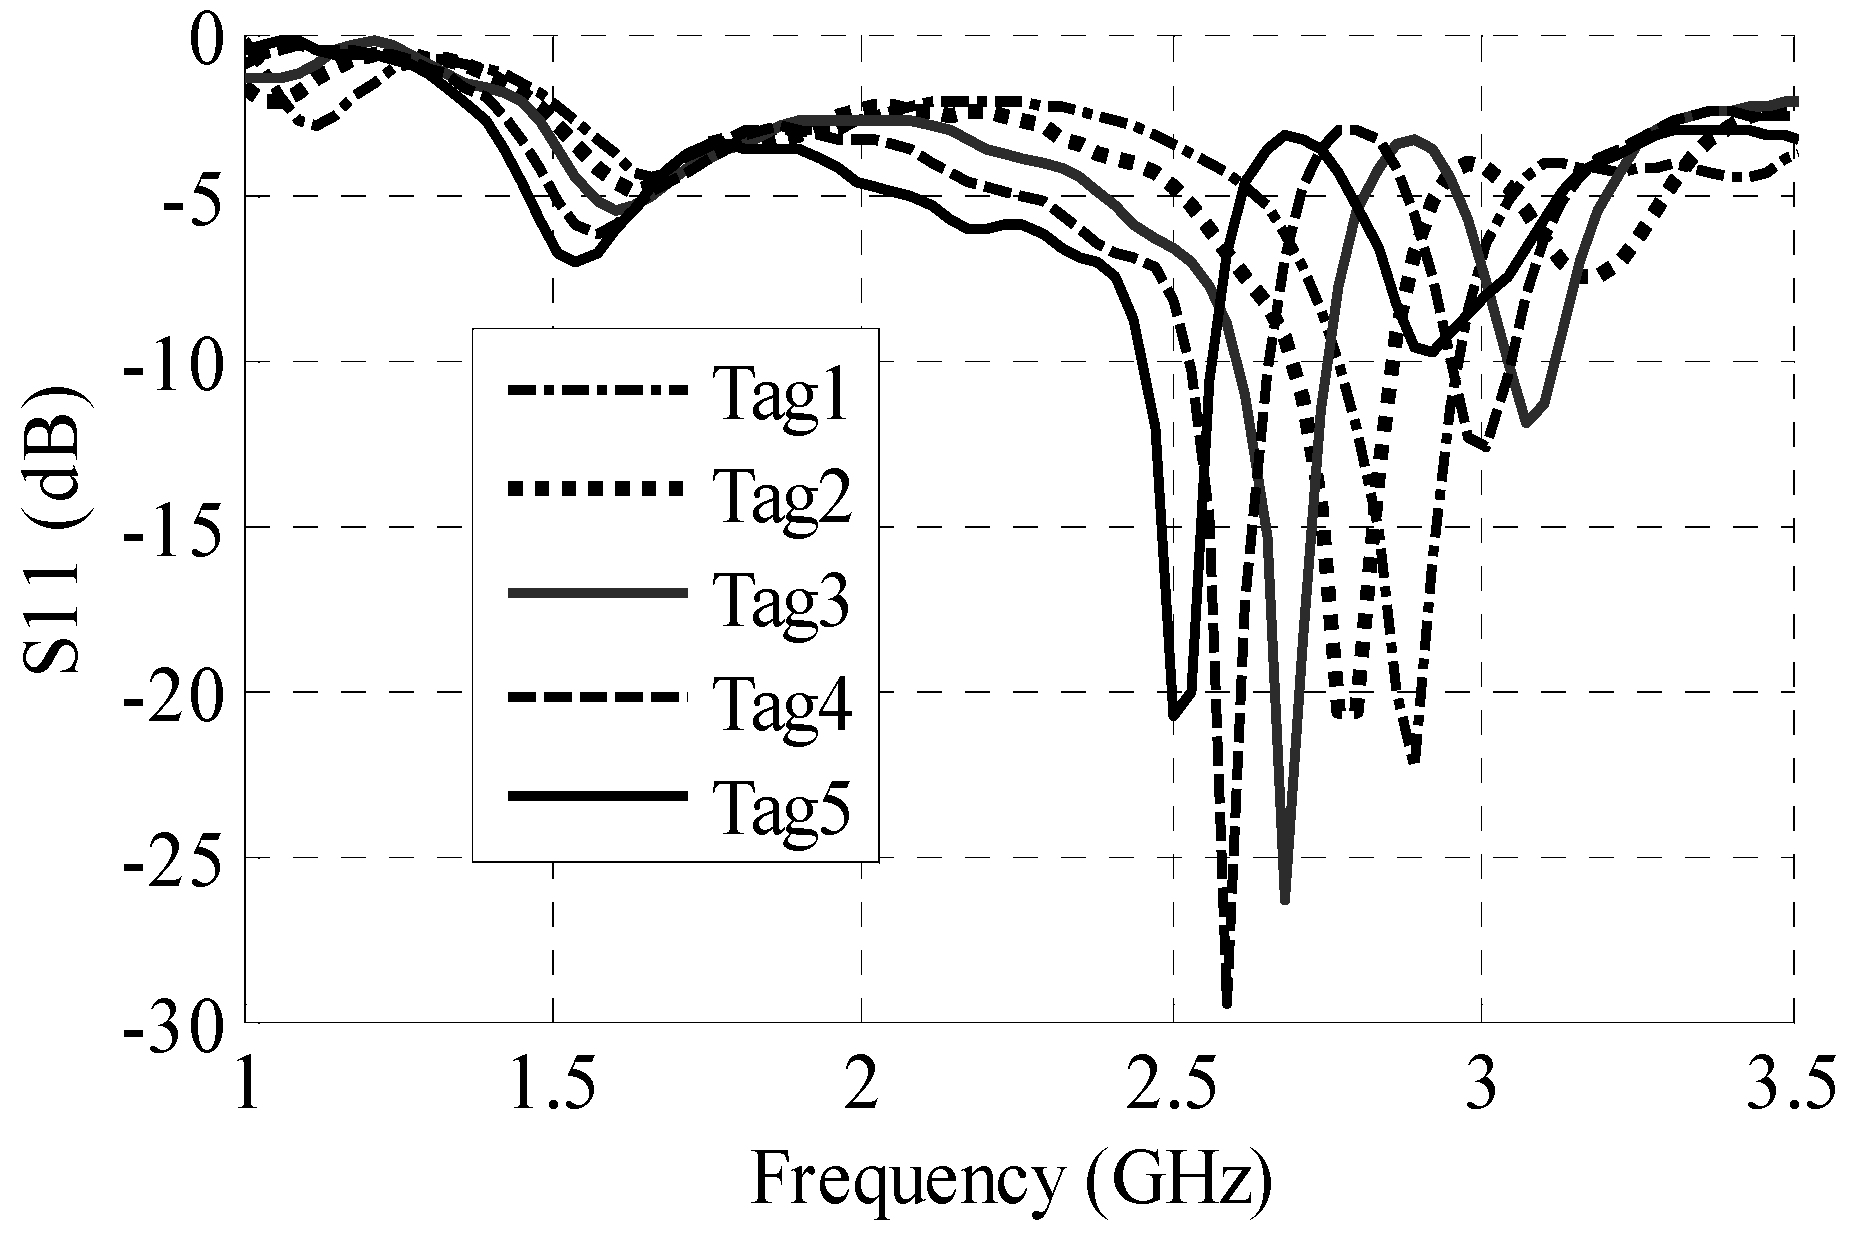
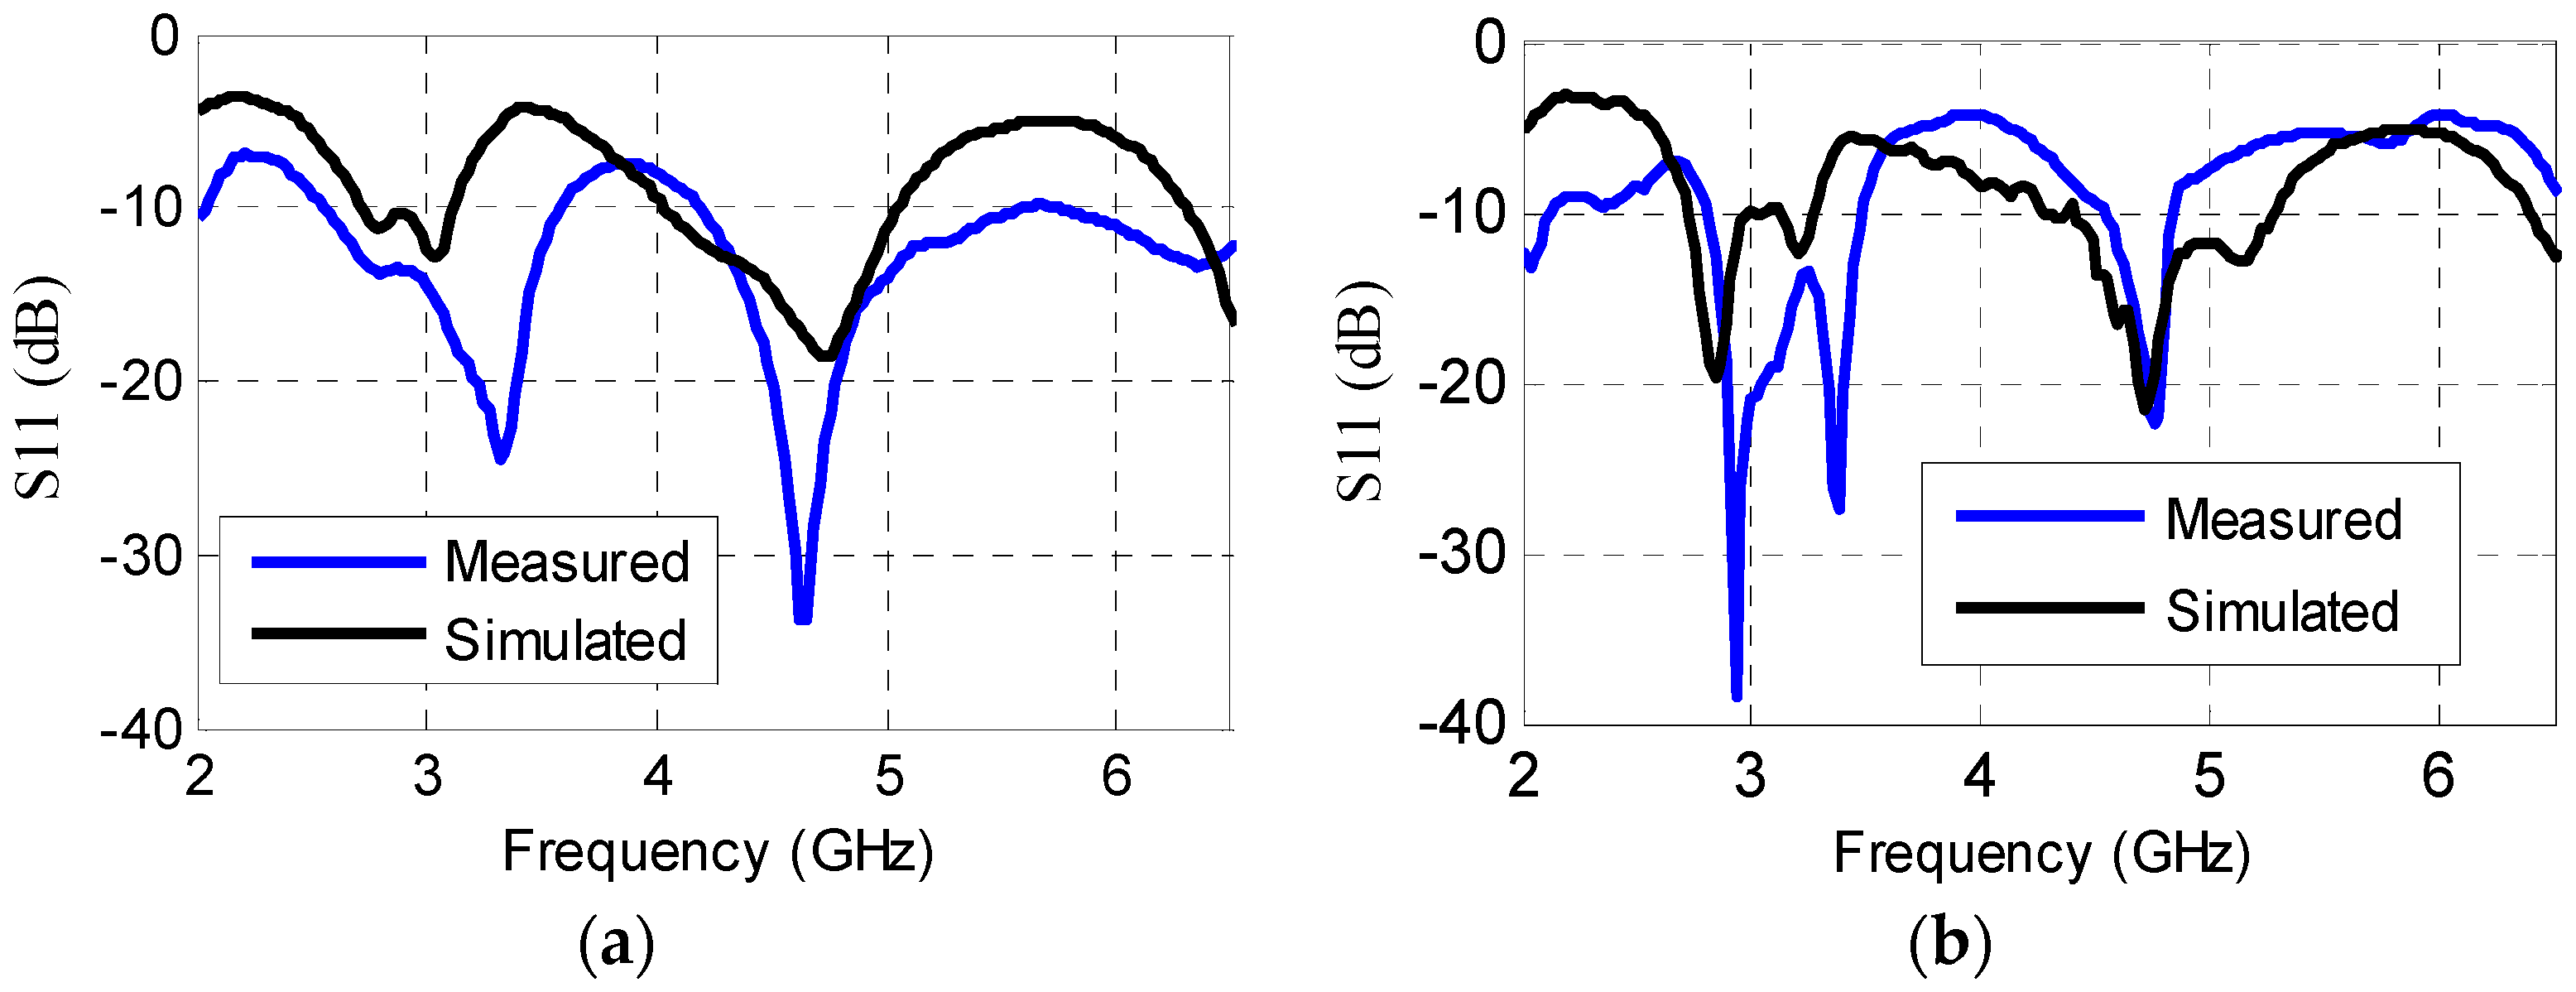
4.1. Antenna Characterization

The dipole antenna is fabricated on a paper substrate. Figure 7a shows adequate agreement between simulated and measured results with two distinct bands appearing at 2.8 GHz and 4.6 GHz. As only one side of this paper is glossy, two individual layers are used, first to print antenna and interdigitated electrode and second to print the partial ground plane. The two layers are subsequently glued together, thus increasing the thickness from 0.280 mm to 0.560 mm. In Figure 7b, the simulated and measured return loss of the antenna with an interdigitated electrode is shown. The slight shift between the simulated and measured results is attributed to the glue used between the two layers of photo paper.

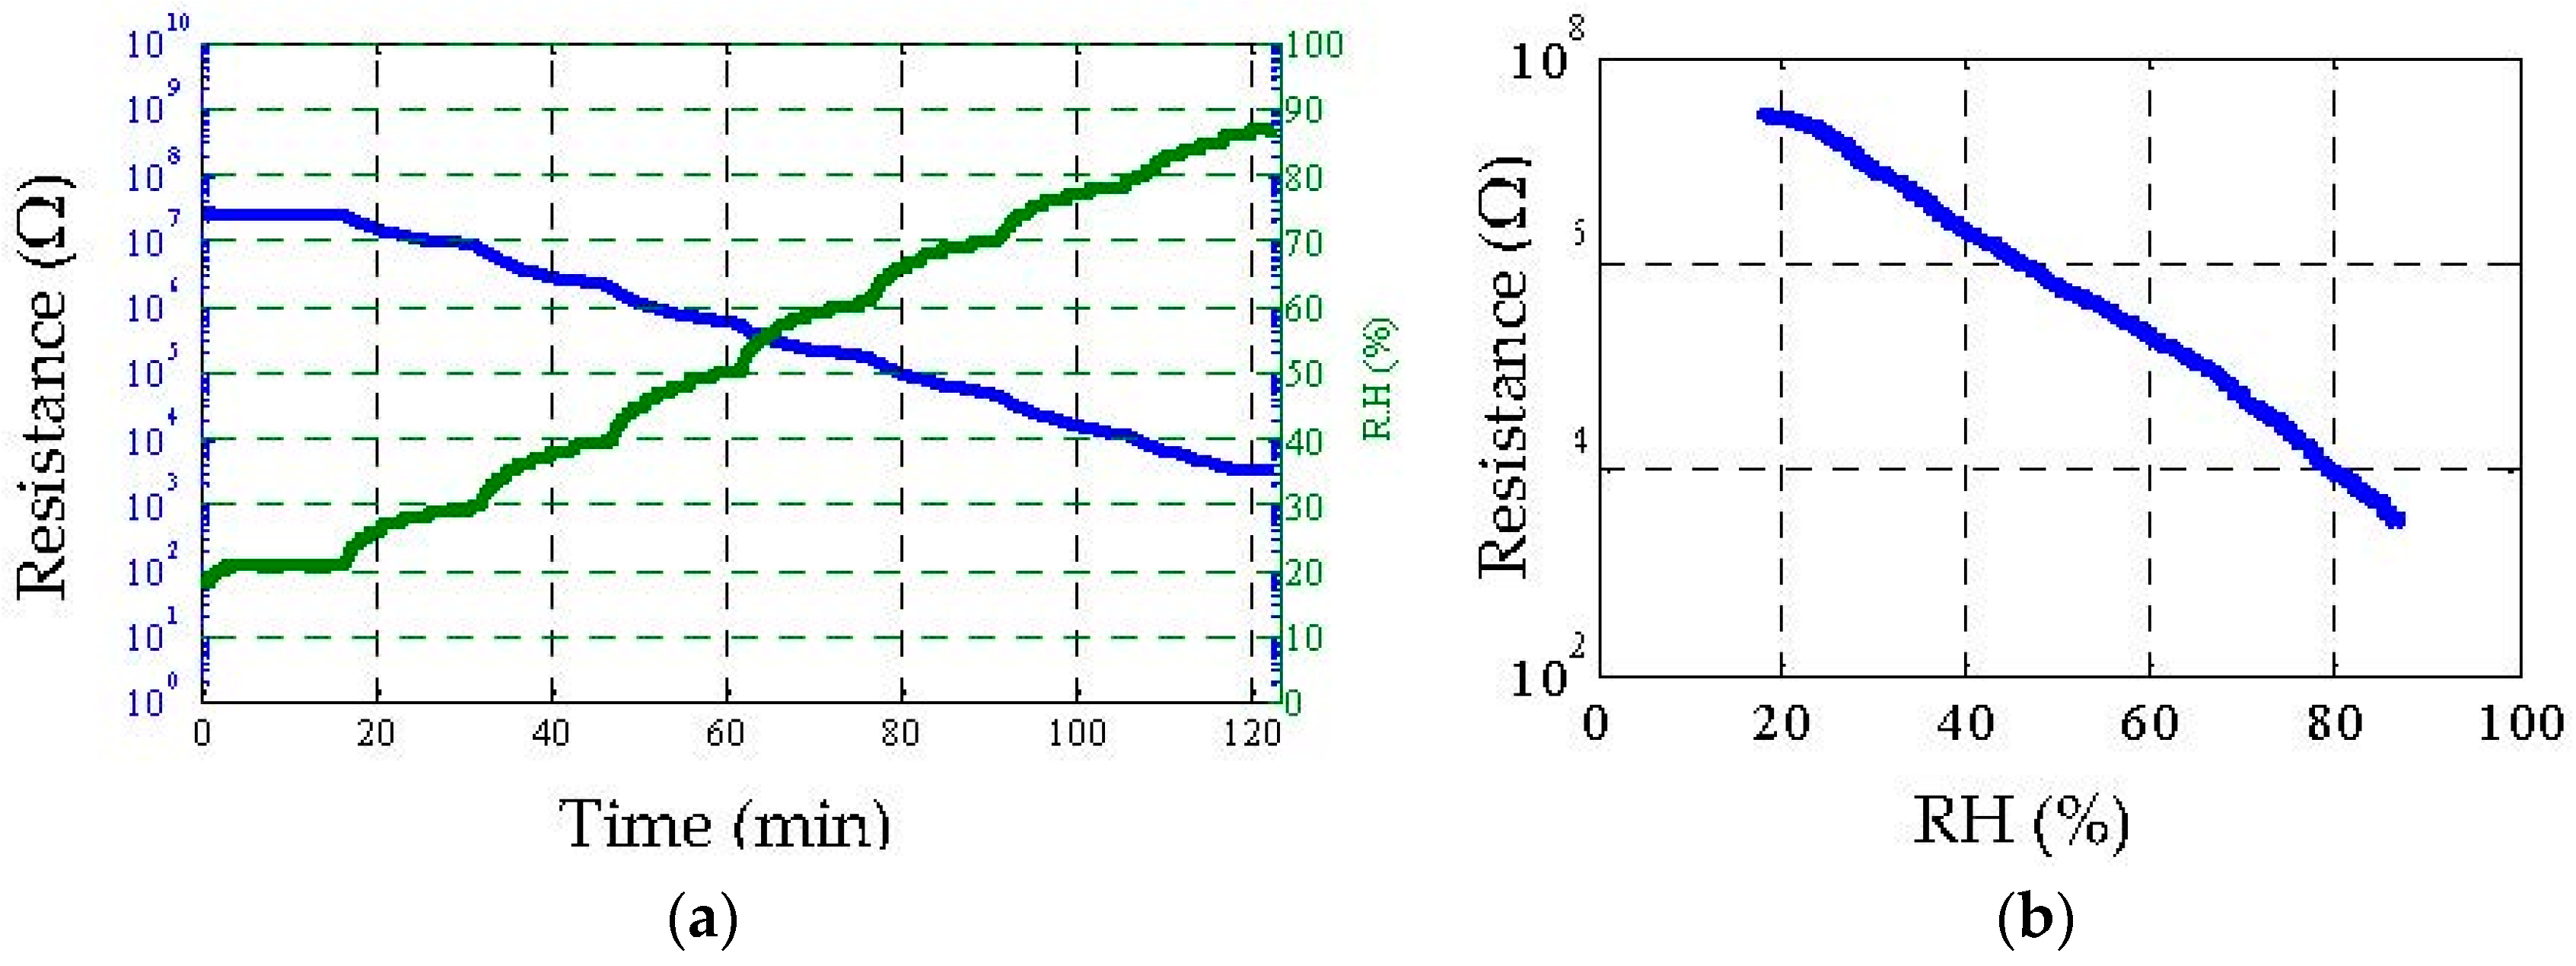
4.2. Humidity Sensing
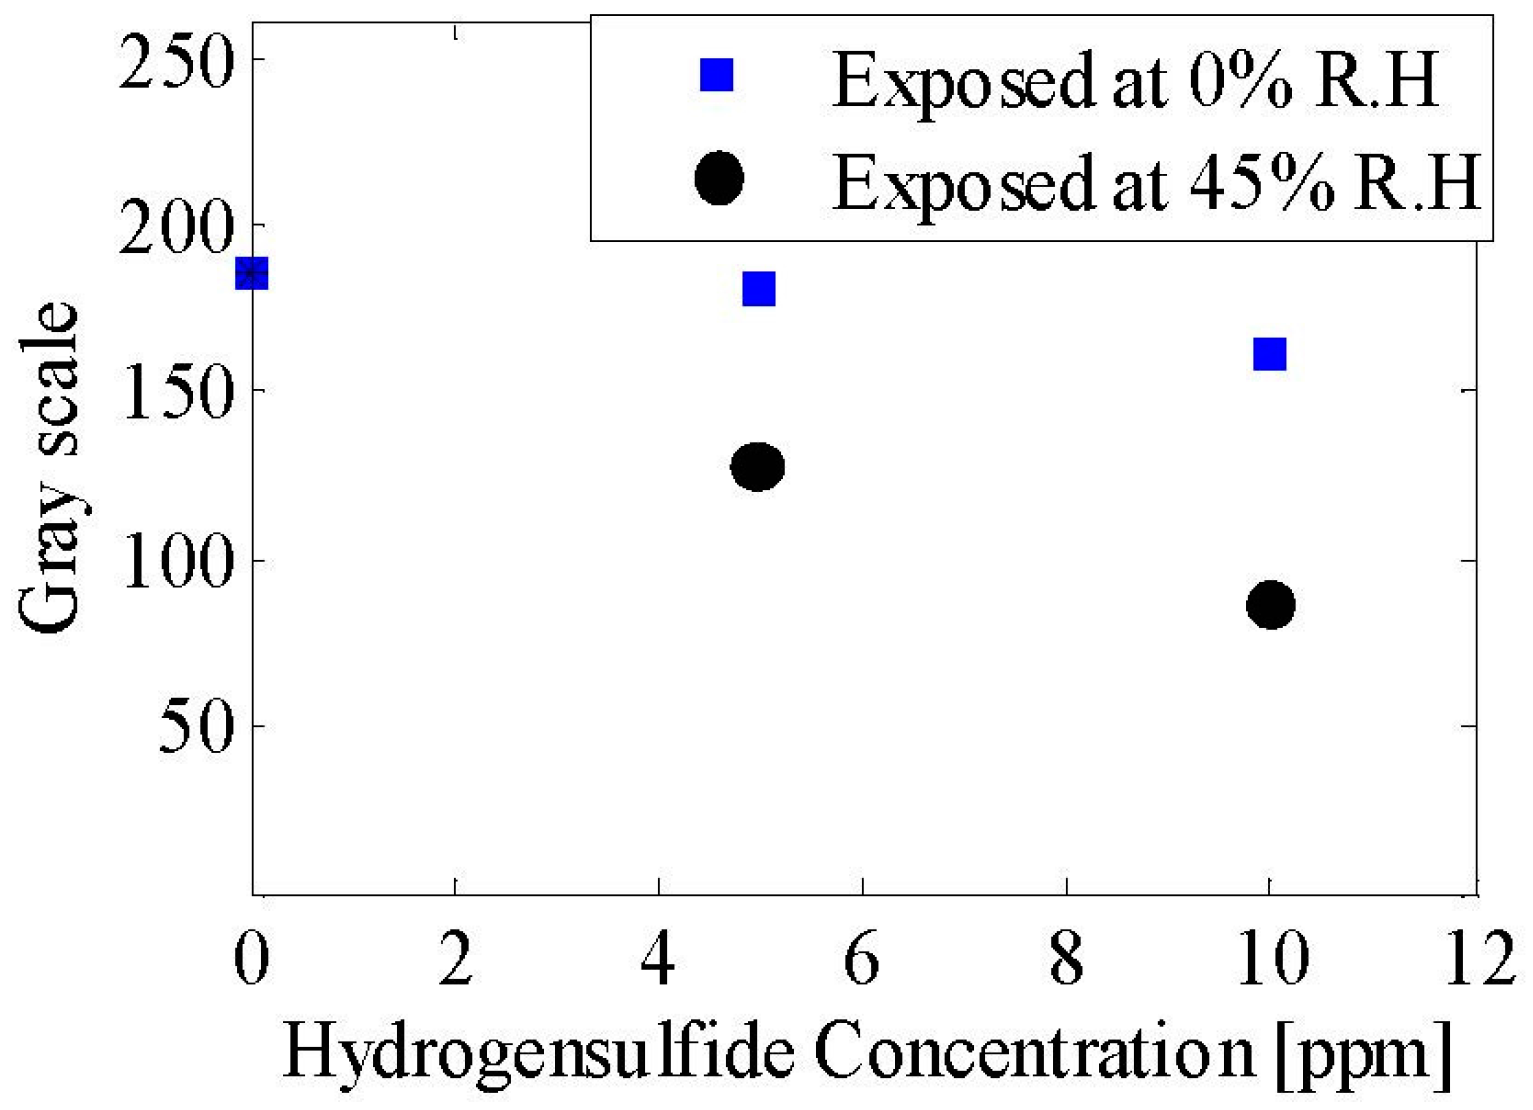
Utilizing the measurement setup of Figure 6, the humidity sensing capability of the sensor was analyzed. The bare interdigitated electrode without the chemi-resistive ink was placed in the chamber, and the relative humidity (RH) was increased with time. As the paper substrate has a tendency to absorb moisture, the conductivity of the electrode was expected to increase due to initiation of ion conduction as explained in [26]. This was verified, as shown in Figure 8a,b, by a decrease in resistance from 10 MΩ to a few tens of kΩ as the RH was increased from 18% to 88%. The decrease in resistance, measured through the LCR meter, started at about the 20 min mark and continued to decrease linearly as RH was increased.

4.3. Gas Sensing

After the antenna and humidity measurements, the copper-acetate solution was inkjet-printed on the tags and subsequently exposed to H2S concentrations of 5 ppm and 10 ppm for 100 min without humidity (0% RH) and with humidity (45% RH). All the experiments discussed in this paper were performed at room temperature. The response of the sensor was assessed in two ways: the optical response and the electrical response. In the former, the exposure to H2S changes the greenish-blue color of the copper acetate to a darker shade due to the formation and growth of copper sulfide particles, Cu2S and CuS, whose characteristic color is dark grey and indigo blue, respectively. Exposure to a 10 ppm concentration of H2S changes the color to dark brown/blackish green. The un-exposed and exposed samples of the sensor module are shown in Figure 9, verifying that the sensor can be used as a simple optical indicator for the presence of H2S gas. The exact color depends on the humidity, exposure time, and gas concentration. It is important to note that the change in color is an irreversible process making the sensor suitable for a one-time use only. This disposability characteristic is justified due to the sensor’s low cost of fabrication when scaled from lab-scale inkjet printing to mass scale roll-to-roll and reel-to-reel printing. To represent the optical response in a meaningful way, a graph with a color scale from 0 to 255, where 0 corresponds to black and 255 corresponds to white color. Shown in Figure 10, as the H2S concentration is increased from 0 ppm to 10 ppm, the scale reading decreases. Furthermore, as the humidity is increased to 45%, the scale reading decreases further as high humidity improves the sensitivity of the chemi-resistive layer; hence, more copper sulfide particles are formed on the sensor surface, leading to a decrease in color scale reading.
In addition to the optical changes, the electrical properties of the sensor also change under exposure to H2S gas. This happens due to the formation of Cu2S particles on top of the electrode fingers, thus forming a conductive path resulting in a decrease in resistance. At the particle level, this increase in conductivity is attributed to the percolation in the continuous conducting networks and tunneling between the isolated conducting particles [30,31]. Figure 11a shows the resistance variation of the sensor exposed to concentrations of 5 and 10 ppm H2S at a relative humidity of 45%. A sharp decrease is observed in the initial few minutes, after which both curves saturate. The response time, which is defined as the time required to attain a 90% change of the total resistance change, is 3 min for a 10 ppm concentration, as compared to 7 min for 5 ppm. This is a consequence of a faster chemical reaction and a formation of copper sulfide particles. Similar behavior is observed for the reactive part of the sensor, as shown in Figure 11b. Figure 12 illustrates the dependence of the sensor response on two different levels of humidity. An inverse relationship is observed between humidity and response time. More specifically, response time increases from being less than 10 min to more than 60 min as humidity decreases from 45% RH to 0% RH. Nevertheless, for typical humidity levels of 30%, response time can be extrapolated to around 10 min. Furthermore, as the variation in the sensor’s resistance is different for humidity and H2S, and optical changes also happen for the latter, differentiation between humidity and gas sensing can be achieved.
The repeatability of sensor performance was verified by fabricating and characterizing three samples through the same process. Shown in Figure 13a, the response of these three sensors, under 0% RH and 5 ppm H2S gas exposure, shows a very close match in the steady state. Using the mean resistance values from the three sensors for each time instant, the deviation of each sensor response from the mean was calculated, which was subsequently used to calculate the average and maximum deviation. These are plotted in Figure 13b,c, respectively, alongside the mean response. Slightly higher spread is observed during the initial transient period, whereas response closely matches the steady state.
In order to validate the overall operation of the sensor including the antenna, the change in conductivity of the sensor is included in a full-wave 3D post-measurement simulation. This method is adopted, as it is not possible to measure the s-parameters, while the tags are placed in the gas measurement chamber. Thus, as shown in Figure 14, four measured resistance values of the electrode are used in the simulation model of CST Microwave Studio, yielding four distinct frequencies of the chipless RFID tag. This emulates how the sensor along with the antenna would behave in reality for varying concentrations of H2S gas. These frequencies when passively sensed can be directly related to the level of H2S concentration, thus verifying the overall operation.
A detailed comparison with published works is presented in Table 3. It is interesting to note that, due to the electrode structure used, the presented work shows the fastest response time of 3 min among resistive type sensors [10,11,12]. Furthermore, it is the only gas sensor among the reported fully-printed sensors that not only has wireless sensing capability but also identification functionality [14,15,16,17,18]. Lastly, compared to [13], in which H2S sensing is offered in a smaller tag dimension, the presented work demonstrates a sixfold lower response time along with the antenna integration for wireless identification.

5. Conclusions

A dual-functionality, paper-based, inkjet-printed humidity and gas sensor has been presented. The complete sensor consists of an interdigitated electrode, a copper acetate-based chemi-resistive ink, and a specialized loop-dipole antenna combination to enable passive sensing. The miniaturized electrode results in a fast response time of ~3 min, which is the best among resistive type sensors. The gas sensing behavior has been characterized both electrically and optically. The novel use of the antenna’s inner loop for the wireless monitoring of the sensor’s resistance and outer loop for chipless identification makes it a promising choice as a low-cost pervasive humidity and gas sensor.

Acknowledgments

The authors would like to thank King Abdullah University of Science and Technology for fabrication and characterization facilities.

Author Contributions

Abdul Quddious and Shuai Young have equal contribution in the design, fabrication and characterization of the presented sensors. Munawar M. Khan wrote the manuscript and analyzed the data. Farooq A. Tahir supervised the antenna and sensor design. Atif Shamim and Khaled N. Salama supervised the fabrication and characterization. Hammad M. Cheema led the research, wrote the manuscript and revisions.

Conflicts of Interest

The authors declare no conflict of interest.

References

  1. A Guide to Internet of Things; Intel Corporation: Santa Clara, CA, USA, 2010.
  2. Amendola, S.; Lodato, R.; Manzari, S.; Occhiuzzi, C.; Marrocco, G. RFID Technology for IoT-Based Personal Healthcare in Smart Spaces. IEEE Internet Things J. 2014, 1, 144–152. [Google Scholar] [CrossRef] [Green Version]
  3. Pasluosta, C.F.; Gassner, H.; Winkler, J.; Klucken, J.; Eskofier, B.M. An Emerging Era in the Management of Parkinson’s Disease: Wearable Technologies and the Internet of Things. IEEE J. Biomed. Health Inform. 2015, 16, 1873–1881. [Google Scholar] [CrossRef] [PubMed]
  4. He, W.; Yan, G.; Xu, L.D. Developing Vehicular Data Cloud Services in the IoT Environment. IEEE Trans. Ind. Inform. 2014, 10, 1587–1595. [Google Scholar] [CrossRef]
  5. Chan, M.; Estève, D.; Escriba, C.; Campo, E. A review of smart homes—Present state and future challenges. Comput. Methods Prog. Biomed. 2008, 91, 55–81. [Google Scholar] [CrossRef] [PubMed]
  6. Chan, M.; Campo, E.; Estève, D.; Fourniols, J.Y. Smart homes—Current features and future perspectives. Maturitas 2009, 64, 90–97. [Google Scholar] [CrossRef] [PubMed]
  7. Kelly, S.D.T.; Suryadevara, N.K.; Mukhopadhyay, S.C. Towards the Implementation of IoT for Environmental Condition Monitoring in Homes. IEEE Sens. J. 2013, 13, 3846–3853. [Google Scholar] [CrossRef]
  8. Zanella, A.; Bui, N.; Castellani, A.; Vangelista, L.; Zorzi, M. Internet of Things for Smart Cities. IEEE Internet Things J. 2014, 1, 22–32. [Google Scholar] [CrossRef]
  9. Perera, C.; Liu, C.H.; Jayawardena, S.; Chen, M. A Survey on Internet of Things from Industrial Market Perspective. IEEE Access 2014, 2, 1660–1679. [Google Scholar] [CrossRef]
  10. Andersson, H.; Manuilskiy, A.; Gao, J.; Lidenmark, C.; Siden, J.; Forsberg, S.; Unander, T.; Nilsson, H.-E. Investigation of humidity sensor effect in silver nanoparticle ink sensors printed on paper. IEEE Sens. J. 2013, 14, 623–628. [Google Scholar] [CrossRef]
  11. Gao, J.; Sidén, J.; Nilsson, H.-E.; Gulliksson, M. Printed Humidity Sensor with Memory Functionality for Passive RFID Tags. IEEE Sens. J. 2013, 13, 1824–1834. [Google Scholar] [CrossRef]
  12. Yang, L.; Zhang, R.; Staiculescu, D.; Wong, C.; Tentzeris, M. A novel conformal RFID-enabled module utilizing inkjet-printed antennas and carbon nanotubes for gas-detection applications. IEEE Antennas Wirel. Propag. Lett. 2009, 8, 653–656. [Google Scholar] [CrossRef]
  13. Sarfraz, J.; Maattanen, A.; Ihalainen, P.; Keppeler, M.; Lindén, M.; Peltonen, J. Printedcopper acetate based H2S sensor on paper substrate. Sens. Actuators B Chem. 2012, 173, 868–873. [Google Scholar] [CrossRef]
  14. Harrey, P.; Ramsey, B.; Evans, P.; Harrison, D. Capacitive-type humidity sensors fabricated using the offset lithographic printing process. Sens. Actuators B Chem. 2002, 87, 226–232. [Google Scholar] [CrossRef]
  15. Molina-Lopez, F.; Briand, D.; de Rooij, N. All additive inkjet printed humidity sensors on plastic substrate. Sens. Actuators B Chem. 2012, 166, 212–222. [Google Scholar] [CrossRef]
  16. Rivadeneyra, A.; Fernández-Salmerón, J.; Banqueri, J.; López-Villanueva, J.A.; Capitan-Vallvey, L.F.; Palma, A.J. A novel electrode structure compared with interdigitated electrodes as capacitive sensor. Sens. Actuators B Chem. 2014, 204, 552–560. [Google Scholar] [CrossRef]
  17. Weremczuk, J.; Tarapata, G.; Jachowicz, R.S. The ink-jet printing humidity sorption sensor—Modelling, design, technology and characterization. Meas. Sci. Technol. 2012, 23, 014003. [Google Scholar] [CrossRef]
  18. Molina-Lopez, F.; Quintero, A.V.; Mattana, G.; Briand, D.; de Rooij, N. Large-area compatible fabrication and encapsulation of inkjet-printed humidity sensors on flexible foils with integrated thermal compensation. J. Micromech. Microeng. 2013, 23, 025012. [Google Scholar] [CrossRef]
  19. Rivadeneyra, A.; Fernández-Salmerón, J.; Agudo-Acemel, M.; López-Villanueva, J.A.; Capitan-Vallvey, L.F.; Palma, A.J. Printed electrodes structures as capacitive humidity sensors: A comparison. Sens. Actuators A Phys. 2016, 244, 56–65. [Google Scholar] [CrossRef]
  20. Doujaiji, B.; Al-Tawfiq, J.A. Hydrogen sulfide exposure in an adult male. Ann. Saudi Med. 2010, 30, 76–80. [Google Scholar] [PubMed]
  21. Khan, M.M.; Tahir, F.A.; Farooqui, M.F.; Shamim, A.; Cheema, H.M. 3.56 bits/cm2 Compact Inkjet Printed and Application Specific Chipless RFID Tag. IEEE Antenna Wirel. Propag. Lett. 2016, 15, 1109–1112. [Google Scholar] [CrossRef]
  22. Vena, A.; Perret, E.; Tedjini, S.; Tourtollet, G.M.P.; Delattre, A.; Garet, F.; Boutant, Y. Design of Chipless RFID Tags Printed on Paper by Flexography. IEEE Trans. Antennas Propag. 2013, 61, 5868–5877. [Google Scholar] [CrossRef]
  23. Sarfraz, J.; Tobjork, D.; Osterbacka, R.; Linden, M. Low-cost hydrogen sulfide gas sensor on paper substrates: Fabrication and demonstration. IEEE Sens. J. 2012, 12, 1973–1978. [Google Scholar] [CrossRef]
  24. Ahmed, S.; Tahir, F.A.; Shamim, A.; Cheema, H.M. A Compact Kapton-Based Inkjet Printed Multiband Antenna for Flexible Wireless Devices. IEEE Antenna Wirel. Propag. Lett. 2015, 14, 1802–1805. [Google Scholar] [CrossRef]
  25. Sarfraza, J.; Ihalainena, P.; Maattanena, A.; Gulina, T.; Koskelab, J.; Wilénc, C.E.; Kilpeläb, A.; Peltonenaa, J. A printed H2S sensor with electro-optical response. Sens. Actuators B Chem. 2014, 191, 821–827. [Google Scholar] [CrossRef]
  26. Tobjörk, D.; Österbacka, R. Paper Electronics. Adv. Mater. 2011, 23, 1935–1961. [Google Scholar] [CrossRef] [PubMed]
  27. Virji, S.; Kaner, R.; Weiller, B. Direct electrical measurement of the conversion of metal acetates to metal sulfides by hydrogen sulfide. Inorg. Chem. 2006, 45, 10467–10471. [Google Scholar] [CrossRef] [PubMed]
  28. Sapsanis, C.; Omran, H.; Chernikova, V.; Shekhah, O.; Belmabkhout, Y.; Buttner, U.; Eddaoudi, M.; Salama, K.N. Insights on Capacitive Interdigitated Electrodes Coated with MOF Thin Films: Humidity and VOCs Sensing as a Case Study. Sensors 2015, 15, 18153–18166. [Google Scholar] [CrossRef] [PubMed]
  29. Omran, H.; Arsalan, M.; Salama, K.N. An Integrated Energy-Efficient Capacitive Sensor Digital Interface Circuit. Sens. Actuators A Phys. 2014, 216, 43–51. [Google Scholar] [CrossRef]
  30. Abeles, B.; Pinch, H.L.; Gittleman, J.I. Percolation conductivity in W-Al2O3 granular metal films. Phys. Rev. Lett. 1975, 35, 247–250. [Google Scholar] [CrossRef]
  31. Sheng, P.; Abeles, B.; Arie, Y. Hopping conductivity in granular metals. Phys. Rev. Lett. 1973, 31, 44–47. [Google Scholar] [CrossRef]
Figure 1. Layout of the proposed sensor’s interdigitated electrode. L5 = 45.75 mm and W5 = 20 mm.
Sensors 16 02073 g001
Figure 2. Layout of the proposed antenna fed using a balun. The wide space in the center is left intentionally for sensor integration.
Sensors 16 02073 g002
Figure 3. Current distribution in the two loops of the antenna. (a) Outer dipole at 2.8 GHz; (b) Inner loop at 4.6 GHz.
Sensors 16 02073 g003
Figure 4. Antenna response for unique identification.
Sensors 16 02073 g004
Figure 5. Fabricated prototypes. (a) Top view of antenna; (b) Bottom view of antenna; (c) Inkjet-printed interdigitated electrode; (d) Complete prototype with antenna, balun, and interdigitated electrode.
Sensors 16 02073 g005
Figure 6. Measurement setup for humidity and gas sensing. (a) Block diagram; (b) Laboratory setup. 1. Gas cylinder. 2. MFC (Mass Flow Controller) connected to H2S gas. 3. MFC connected to dry Nitrogen. 4. Gas flow through this MFC going to bubbler. 5. MFM (Mass Flow Meter). 6. Connected to bubbler for humidity measurement. 7. LCR meter. 8. Multimeter. 9. Measurement chamber with gas inlet and gas outlet; test leads connected to LCR and Multimeter, contains sensor tag. 10. Bubbler to provide humidity.
Sensors 16 02073 g006
Figure 7. Simulated and measured results on Kodak photo paper (a) Return loss of antenna only; (b) Return loss of antenna with electrode on Kodak photo paper.
Sensors 16 02073 g007
Figure 8. Humidity sensing results. (a) Measured resistance (Blue) of sensor for different humidity levels (Green) with respect to time; (b) Measured resistance of sensor with respect to varying humidity only.
Sensors 16 02073 g008
Figure 9. Inkjet-printed sensor module (a) before exposure; and (b) after exposure to H2S.
Sensors 16 02073 g009
Figure 10. Optical response of the sensor with different concentrations of H2S and relative humidity.
Sensors 16 02073 g010
Figure 11. Change in (a) real impedance; and (b) reactance of sensor exposed to 5 ppm and 10 ppm concentrations of H2S at a relative humidity of 45% and measured at 2 MHz.
Sensors 16 02073 g011
Figure 12. Comparison of change in sensor’s real impedance exposed to 5 ppm and 10 ppm concentration of H2S at 0% and 45% RH.
Sensors 16 02073 g012
Figure 13. (a) Response of three sensors to 0% RH and 5 ppm H2S concentration; (b) Average deviation between three sensor responses; (c) Maximum deviation between three sensor responses.
Sensors 16 02073 g013
Figure 14. Return loss of antenna integrated with sensor with conductivity values at different time instances obtained from experimental data. R1 = 280 Ω, R2 = 200 Ω, R3 = 166 Ω, and R4 = 136 Ω.
Sensors 16 02073 g014
Table 1. Detailed dimensions of proposed antenna.
ParameterDimensionParameterDimension
L050.25 mmW035 mm
L11.64 mmW110.75 mm
L213.75 mmW23.00 mm
L314.57 mmW32.75 mm
L43.5 mmW414 mm
L545.75 mmW520 mm
L620.5 mmL720 mm
Table 2. L6 and L7 dimensions for unique identification.
L6L7
Tag 120.5 mm20 mm
Tag 221.5 mm21 mm
Tag 322.5 mm22 mm
Tag 423.5 mm23 mm
Tag 524.5 mm24 mm
Table 3. Comparison with published works.
ReferenceSensor TypeTag SizeResponse TimeSubstrateIntegrated with AntennaIdentification Capability
[10]Humidity, Resistive type2.9 mm × 0.6 mmMore than 60 minPaperNoNo
[11]Humidity, Resistive type188 mm × 9 mm20–100 minPaperYesNo
[12]Gas (Ammonia & Nitrogen Oxide), Resistive type118 mm × 27 mm-PaperYesNo
[13]Gas (Hydrogen Sulfide), Resistive type20 mm × 11 mmApprox. 20 minPaperNoNo
[14]Humidity, Capacitive type Sensor area is 200 mm24–11 minPolyimide and PolyethersulphoneNoNo
[15]Humidity, Capacitive type12 mm × 8 mm Approx. 24 sPET No No
[16]Humidity, Capacitive type6.3 mm × 1.85 mm5–6 minPolyimide NoNo
[17]Humidity, With both resistive and capacitive measurements5.4 mm × 5.4 mmLess than 20 sPolyimideNo No
[18]Humidity, Capacitive type12 mm × 12 mmApprox. 20 minPET NoNo
This workDual functionality Humidity & Gas (Hydrogen Sulfide), Resistive type45.75 mm × 20 mm3 minPaperYesYes

