Article

Binding Affinity of a Highly Sensitive Au/Ag/Au/Chitosan-Graphene Oxide Sensor Based on Direct Detection of Pb2+ and Hg2+ Ions

by
Nur Hasiba Kamaruddin
1,
Ahmad Ashrif A. Bakar
1,*,
Nadhratun Naiim Mobarak
2,
Mohd Saiful Dzulkefly Zan
1 and
Norhana Arsad
1
1
Department of Electric, Electronic and Systems Engineering, Faculty of Engineering and Built Environment, Universiti Kebangsaan Malaysia, 43600 UKM Bangi, Selangor, Malaysia
2
School of Chemical Sciences and Food Technology, Faculty of Science and Technology, Universiti Kebangsaan Malaysia, 43600 UKM Bangi, Selangor, Malaysia
*
Author to whom correspondence should be addressed.
Sensors 2017, 17(10), 2277; https://doi.org/10.3390/s17102277
Submission received: 7 August 2017 / Revised: 8 September 2017 / Accepted: 14 September 2017 / Published: 6 October 2017
(This article belongs to the Special Issue Carbon Materials Based Sensors and the Application)

Abstract

:
The study of binding affinity is essential in surface plasmon resonance (SPR) sensing because it allows researchers to quantify the affinity between the analyte and immobilised ligands of an SPR sensor. In this study, we demonstrate the derivation of the binding affinity constant, K, for Pb2+ and Hg2+ ions according to their SPR response using a gold/silver/gold/chitosan–graphene oxide (Au/Ag/Au/CS–GO) sensor for the concentration range of 0.1–5 ppm. The higher affinity of Pb2+ to binding with the CS–GO sensor explains the outstanding sensitivity of 2.05 °ppm−1 against 1.66 °ppm−1 of Hg2+. The maximum signal-to-noise ratio (SNR) upon detection of Pb2+ is 1.53, and exceeds the suggested logical criterion of an SNR. The Au/Ag/Au/CS–GO SPR sensor also exhibits excellent repeatability in Pb2+ due to the strong bond between its functional groups and this cation. The adsorption data of Pb2+ and Hg2+ on the CS–GO sensor fits well with the Langmuir isotherm model where the affinity constant, K, of Pb2+ and Hg2+ ions is computed. The affinity of Pb2+ ions to the Au/Ag/Au/CS–GO sensor is significantly higher than that of Hg2+ based on the value of K, 7 × 10⁵ M−1 and 4 × 10⁵ M−1, respectively. The higher shift in SPR angles due to Pb2+ and Hg2+ compared to Cr3+, Cu2+ and Zn2+ ions also reveals the greater affinity of the CS–GO SPR sensor to them, thus supporting the rationale for obtaining K for these two heavy metals. This study provides a better understanding on the sensing performance of such sensors in detecting heavy metal ions.

1. Introduction

The development of a surface plasmon resonance (SPR) sensor in various applications such as drug discovery, disease monitoring and effluent detection normally originates in the possible interactions between the analyte of interest and its immobilised ligands on the surface of the sensing layer [1]. Macromolecular interactions which result in successful binding between the analyte and ligands will vary the refractive index in the vicinity of the sensing surface, thus manipulating the response of the SPR sensor. The binding affinity constant, K, is a parameter that quantifies the effectiveness of these macromolecular interactions [2].
The binding affinity constant provides quantitative information on the binding interactions between the analyte and sensing layer, which explains the sensing performance of an SPR sensor in terms of sensitivity and selectivity. Evaluating the binding affinity under interference of a multiple-analyte system can provide an information on the selectivity of the sensor [3]. Binding interaction under various conditions, such as different pH values, enables the determination of the right regeneration mechanism of an SPR sensor [4]. Analysing the binding affinity at varying temperatures can also extract the thermodynamic nature of the macromolecular interactions [5].
The derivation of the binding affinity constant is normally based on the kinetic and thermodynamic model [6]. Nevertheless, the SPR technique provides a practical tool for retrieving such a constant by leveraging the Langmuir isotherm model, which is analogous to the kinetic approach [7]. However, careful interpretation is needed such that the derived value can be regarded as the “apparent binding affinity constant” instead of at equilibrium. This is to accommodate the kinetic controls on the macromolecular interactions that might still be occurring between the analyte and ligands during measurement. The practicality of this technique in deriving the value of K inspired many researchers to study the binding affinity of various types of analyte, including heavy metal ions on different SPR sensors [8,9,10,11].
Heavy metals refer to any metallic element with atomic density four to five times greater than water, such as lead (Pb), mercury (Hg), arsenic (As) and cadmium (Cd) [12]. Assuming that atomic density and toxicity are interrelated, heavy metals are considered detrimental to the environment and organisms [13]. Therefore, their detection plays an important role in monitoring the emission of effluents in our environment. The most common techniques for detecting heavy metals are mass spectroscopy, atomic absorption spectrometry [14], inductively coupled plasma mass spectrometry (ICPMS) [15,16] and microwave induced plasma atomic emission spectroscopy (MIP–AES) [17,18]. Although these detection techniques are known for their high sensitivity, the technologies involve expensive instrumentation that is complex to operate and immobile. Therefore, electrochemical techniques such as fluorimetry [19], colorimetry [20] and voltammetry [21,22,23] have been studied to provide a cheaper alternative offering simplicity and mobility.
Anodic stripping voltammetry (ASV) is one of the commonly used electrochemical techniques that can achieve a very low limit of detection (LOD), i.e., in ppt levels. For instance, Lu et al. fabricated an ASV glassy carbon electrode (GCE) coated with graphene, Au nanoparticles and CS that can detect down to 1 ppt of Pb2+ ions [24]. Although this technique is appealing for its low LOD and portability through miniaturisation, the interference from several species in the analyte can degrade the sensitivity of the electrode. On the other hand, Zhou et al. leveraged the ion interference to simultaneously detect Pb2+ and Cd2+ ions using L-cysteine/graphene–chitosan GCE [25]. Even though simultaneous detection is possible through multiplexing circuitry, an individual electrode still needs to be fabricated and optimised for each analyte, hence limits to the practicality of this approach.
Other than the electrochemical techniques, an SPR sensor is another attractive method that also offers cost-efficiency and simplicity. Although many SPR sensors for heavy metal detection have been developed, their portability has hardly been examined. Nevertheless, recent work by several researchers has shown that the portability of this sensor is viable through fabrication with optical fibre [26,27]. Not only that, some SPR sensors based on smartphone platforms have also been studied for the same purpose [28,29]. Progressive interest in the portability of SPR sensing technology shows a promising future for this sensor for in situ heavy metal detection. Consequently, various types of SPR sensor for heavy metal detection have been employed in order to further explore the potential of this device.
Recently, Wang et al. presented a study on the competitive adsorption of albumin for the detection of Cu2+ ions and other heavy metal ions in tap water [10]. The study exhibited an explicit analysis of the SPR data using the Langmuir isotherm model to obtain the dissociation constant, Kd. Considering the definition of Kd as the reciprocal of K [7], the values of binding affinity deduced from this study are relatively small, i.e., 2.4 × 10² and 4.3 × 10² for both Pb2+ and Hg2+, in comparison with the values obtained by other SPR sensors in Table 1. The small values of K obtained by Wang and his co-workers suggests that albumin might not be a good ligand for heavy metal ions.
The magnitude of the binding affinity depends on the strength of the interactions between the heavy metal ions and immobilised ligands of the SPR sensor. Chitosan (CS) is known for its high affinity towards heavy metal ions such as Pb2+ and Hg2+ due to abundant amino groups (–NH2) that bind easily with such cations [33]. Therefore, CS has been widely used as the sensing layer of SPR sensors for heavy metal detection [30,34,35]. McIlwee et al. studied the performance of CS as the SPR sensor for Fe3+ ions, and proposed 9.49 × 10⁵ M−1 to describe quantitatively the binding affinity between the cation and CS. Abdi et al. added polypyrrole to the CS nanocomposite to improve its sensitivity to Pb2+ and Hg2+ ions [34]. The binding affinity of the polypyrrole–CS was further analysed using Cu2+, Zn2+ and Ni2+ ions, which yielded the binding affinity constants of 1.3 × 10⁴, 2.3 × 10⁴ and 1.7 × 10⁴, respectively [31,32].
Other materials that have recently driven many studies in SPR sensing are graphene-based materials such as graphene oxide (GO), which has a large surface area and high π-conjugation structure that significantly improve the sensitivity of an SPR sensor [36,37,38]. In addition, GO supports the surface plasmon in the visible range, and its planar sheet structure provides extra protection to the SPR sensor [36]. Apart from that, GO also carries a significant volume of hydroxyl (−OH), carbonyl (C=O) and carboxylic (C(=O)OH) functional groups, which are readily available binding sites for the heavy metal ions [39].
The abundance of functional groups in CS and GO that are readily available for binding with the heavy metal ions has prompted the development of a CS–GO nanocomposite as an SPR sensor. The first CS–GO SPR sensor, which was fabricated by Lokman et al., demonstrated an outstanding sensitivity of 1.1 °ppm−1 for 5 ppm Pb2+ ions. However, the conventional CS–GO SPR sensor on a single Au layer has a limited linearity range of only up to 1 ppm [40]. Therefore, an advanced CS–GO SPR sensor based on an Au/Ag/Au multi-metallic nanostructure was proposed to provide an enhanced evanescent field which can further detect the increasing concentration of Pb2+ ions without saturation, thus extending the existing linearity range [41]. However, previous studies on the Au/CS–GO and Au/Ag/Au/CS–GO SPR sensors did not include work to derive the binding affinity constant.
Therefore, the aim of this study is to quantify the binding affinity of Pb2+ and Hg2+ to an Au/Ag/Au/CS–GO SPR sensor by deriving their binding affinity constant, K. It is important to highlight that the Au/Ag/Au/CS–GO SPR sensor was used in this study to ensure a strong and stable evanescent field is maintained in order to detect the whole range of ion concentration, i.e., 0.1 ppm, 0.5 ppm, 1 ppm, 3 ppm and 5 ppm, without saturation. The extended linearity range due to the enhanced evanescent field is important for providing sufficient SPR data for the whole range of heavy metal concentrations, thus enabling the binding affinity constants to be derived accurately. Both cations were considered in this study due to their strict maximum contaminant levels (MCL) in drinking water of 0.015 ppm and 0.002 ppm, as per established by the United States Environmental Protection Agency (US EPA). However, since the Au/Ag/Au/CS–GO SPR sensor was proposed for heavy metal detection in groundwater, the range of concentration was based on the toxicity characteristic leaching procedure (TCLP), which is the lab procedure that sets the regulatory level of leachable effluent such as Pb2+ and Hg2+ that might leach into soil and groundwater and hence be used as drinking water. According to the US EPA, the threshold levels for Pb2+ and Hg2+ which were determined by this procedure were 5 ppm and 0.2 ppm, respectively [42]. The Langmuir isotherm model was used to derive the binding affinity constants for both heavy metal ions and the results were compared. This study is essential for validating the performance of such a sensor in detecting the emission of these heavy metal ions in our environment.
To the best of our knowledge, this is the first derivation of K for Pb2+ and Hg2+ ions on a CS–GO SPR sensor that quantitatively describes the interaction between them, thereby confirming the superior performance of such a sensor in heavy metal monitoring. The sensing performances were presented in terms of sensitivity, linearity range, repeatability and signal-to-noise ratio (SNR).

2. Materials and Methods

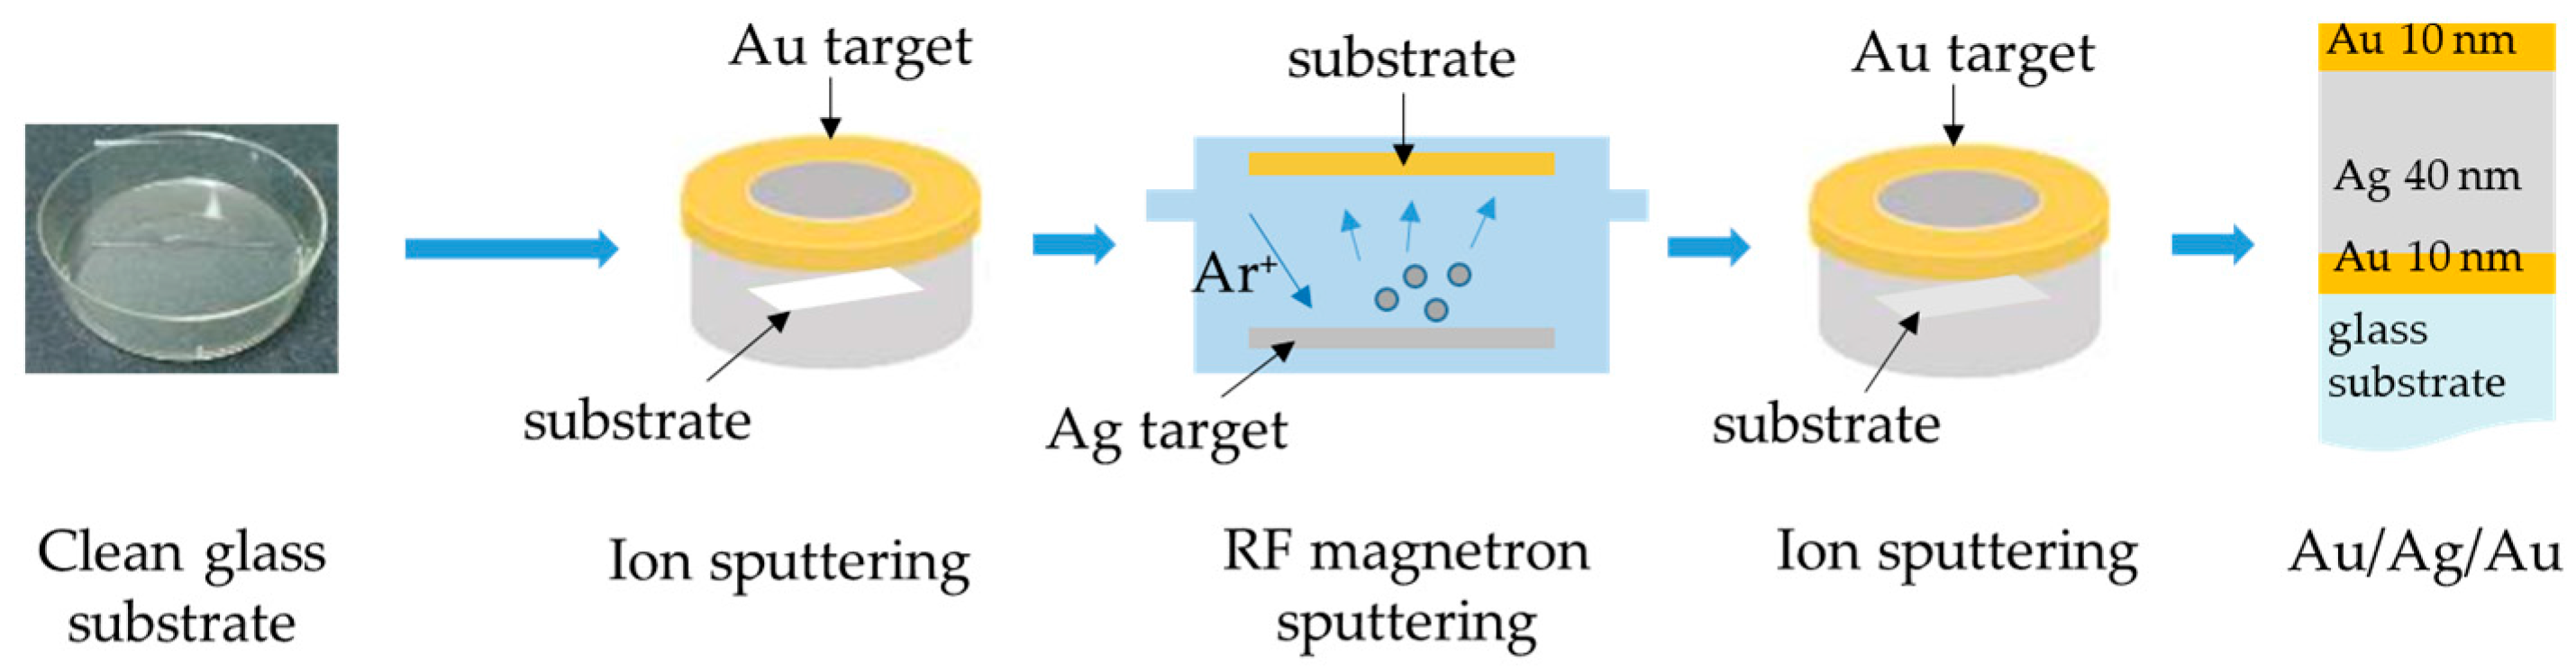
2.1. Fabrication of Au/Ag/Au/CS–GO SPR Sensor

The CS–GO nanocomposite was prepared in-house by dispersing 0.4 g chitosan (Sigma Aldrich, St. Louis, MO, USA) into 50 mL of 1% acetic acid and stirring this for 24 h. The cross-linking of CS was achieved by adding 0.05 mL glutaraldehyde (GLA), and then the synthesis of the CS–GO nanocomposite was continued by combining 3 mL of GO into the solution. The nanocomposite was stirred for another hour, then the process finally proceeded to a 10 min sonication to achieve homogeneity. Figure 1 illustrates the synthesis of the CS–GO nanocomposite.
The multi-metallic Au/Ag/Au nanostructures were coated on a glass substrate by initially sputtering a 10 nm bottommost Au layer. The subsequent 40 nm Ag inner layer was deposited using a K.J. Lesker PVD 75 RF magnetron sputtering machine in an argon atmosphere. The working pressure and RF power were set to 0.67 Pa and 50 W, respectively. The 10 nm topmost Au layer was finally deposited to cover the Ag layer. Both Au depositions were performed in a vacuum using a Hitachi E-1010 ion sputtering machine. The working pressure and discharge current were set to 10 Pa and 15 mA, respectively. All depositions were carried out at room temperature using targets of 99.99% purity. Figure 2 depicts the deposition process in making the multi-metallic Au/Ag/Au nanostructures.
The final step in the fabrication method is immobilising the CS–GO ligands by spin-coating 1 mL of the nanocomposite on to the multi-metallic nanostructures at 6000 rpm rotational speeds for 30 s. One sample was fabricated for each concentration of both Pb2+ and Hg2+ ion solutions.

2.2. Characterisation of Au/Ag/Au/CS–GO Nanostructure

In this study, an energy dispersive X-ray (EDX) analysis was performed to obtain the elemental composition of the Au/Ag/Au/CS–GO SPR sensor using a Zeiss/SUPRA 55VP Field Emission Scanning Electron Microscope (FESEM) operated at 15 kV. Additionally, sectional analysis and the height profile of the CS–GO nanolayer were also obtained using an NT-MDT NtegraPrima Atomic Force Microscope (AFM).
The cross section of the Au/Ag/Au/CS–GO SPR sensor has been discussed in a previous publication, together with other characteristics such as surface topography, crystallinity, molecular composition and chemical bonding [41].

2.3. Execution of SPR Measurement

The SPR measurement in this study was realised using lab-scale SPR spectroscopy based on the Kretschmann configuration, as in Figure 3. In this set-up, an 850 nm excitation light source was provided by a single mode vertical cavity semiconductor-emitting laser diode (LD). A collimating lens was used to minimise any divergence in the excitation source, thus producing an output beam of parallel rays. In order to control the amount of light passing through the system, an iris was mounted together with the collimator. Finally, the light travelled through a half-wave plate and a polarising beam splitter, where it was manipulated to illuminate only the p-polarised light.
The p-polarised light, which is the prerequisite for exciting the SPR, was then given angular incidence to the BK 7 prism. The angular modulation of the incident light was set from 20–90°, where the reflected beam was detected by a photodetector (PD) and measured using a power meter. These procedures, i.e., p-polarised light angular modulation, reflected power retrieval and data manipulation, were executed by the SPR signal processor, which was then developed in the LabVIEW environment in order to plot the SPR reflectivity curves.
The automation steps of the SPR signal processor were performed after the dispersion of analyte on to the Au/Ag/Au/CS–GO SPR sensor. These procedures were repeated five times for each Pb2+ and Hg2+ ion concentration. The analytes were prepared from the standard solutions (1000 ppm) of Pb2+ and Hg2+ ions. Five different concentrations i.e., 0.1 ppm, 0.5 ppm, 1 ppm, 3 ppm and 5 ppm were diluted from each cation standard solution using deionised water (DIW). The DIW was of resistivity 18 megohm-cm in order to minimise potential interference from other species in the analyte during measurement.

3. Results and Discussion

3.1. Elemental Composition of Au/Ag/Au/CS–GO SPR Sensor

Table 2 shows the elemental composition of the CS–GO sensing surface obtained using the EDX. The analysis shows the elements detected on the surface of the sensor, i.e., carbon (C), oxygen (O), Ag and Au. Notably, O is more dominant than other elements of greater content in the CS–GO SPR sensor. This is because the CS that was grafted on to the GO promotes the presence of O on the surface of the sensor. Since the superficial nature of EDX only detects the prominent element on the surface, O prevails over other elements in this analysis [43]. The effects of grafting and chemical modification also suppressed the detection of nitrogen (N) in CS, despite its higher volume than GO [44]. Similarly, the weight percentage of N in the CS–GO nanocomposite that was synthesized by Kumar and Jiang was also the lowest compared to other elements [45]. Furthermore, the weight percentage of Ag and Au were significantly high, which could also be one of the reasons for the undetected N in this analysis. On a positive note, the weight percentage of Ag and Au proves the availability of the multi-metallic nanostructures in the CS–GO SPR sensor.

3.2. Cross-Sectional Analysis and Height Profile of the CS–GO Nanolayer

The cross-sectional analysis of the CS–GO nanolayer is indicated by the blue line in the left image of Figure 4, while the plot on the right is the height profile produced by it. The estimated thickness of the CS–GO nanolayer based on the vertical displacement, which is marked by the arrows in the height profile, is about 3 nm, while that measured by the FESEM in our previous study was about 5 nm [41].
The thickness of GO depends on its degree of exfoliation, where complete exfoliation down to an individual sheet may yield a minimum thickness of approximately 0.8 nm. The functionalisation of CS on to the GO sheets has notably changed the latter structure, hence the increase in its thickness. The thickness of CS–GO nanocomposites obtained by Bustos-Ramirez, Kim, Yan and their co-workers are in the range of 3–6 nm, 3–4 nm and 3 nm, respectively [43,46,47]. Clearly, the thickness of the CS–GO nanolayer in this study is in accordance with these CS–GO nanocomposites, which infers that the CS has been successfully functionalised on to the GO layer through our in-house synthesis.

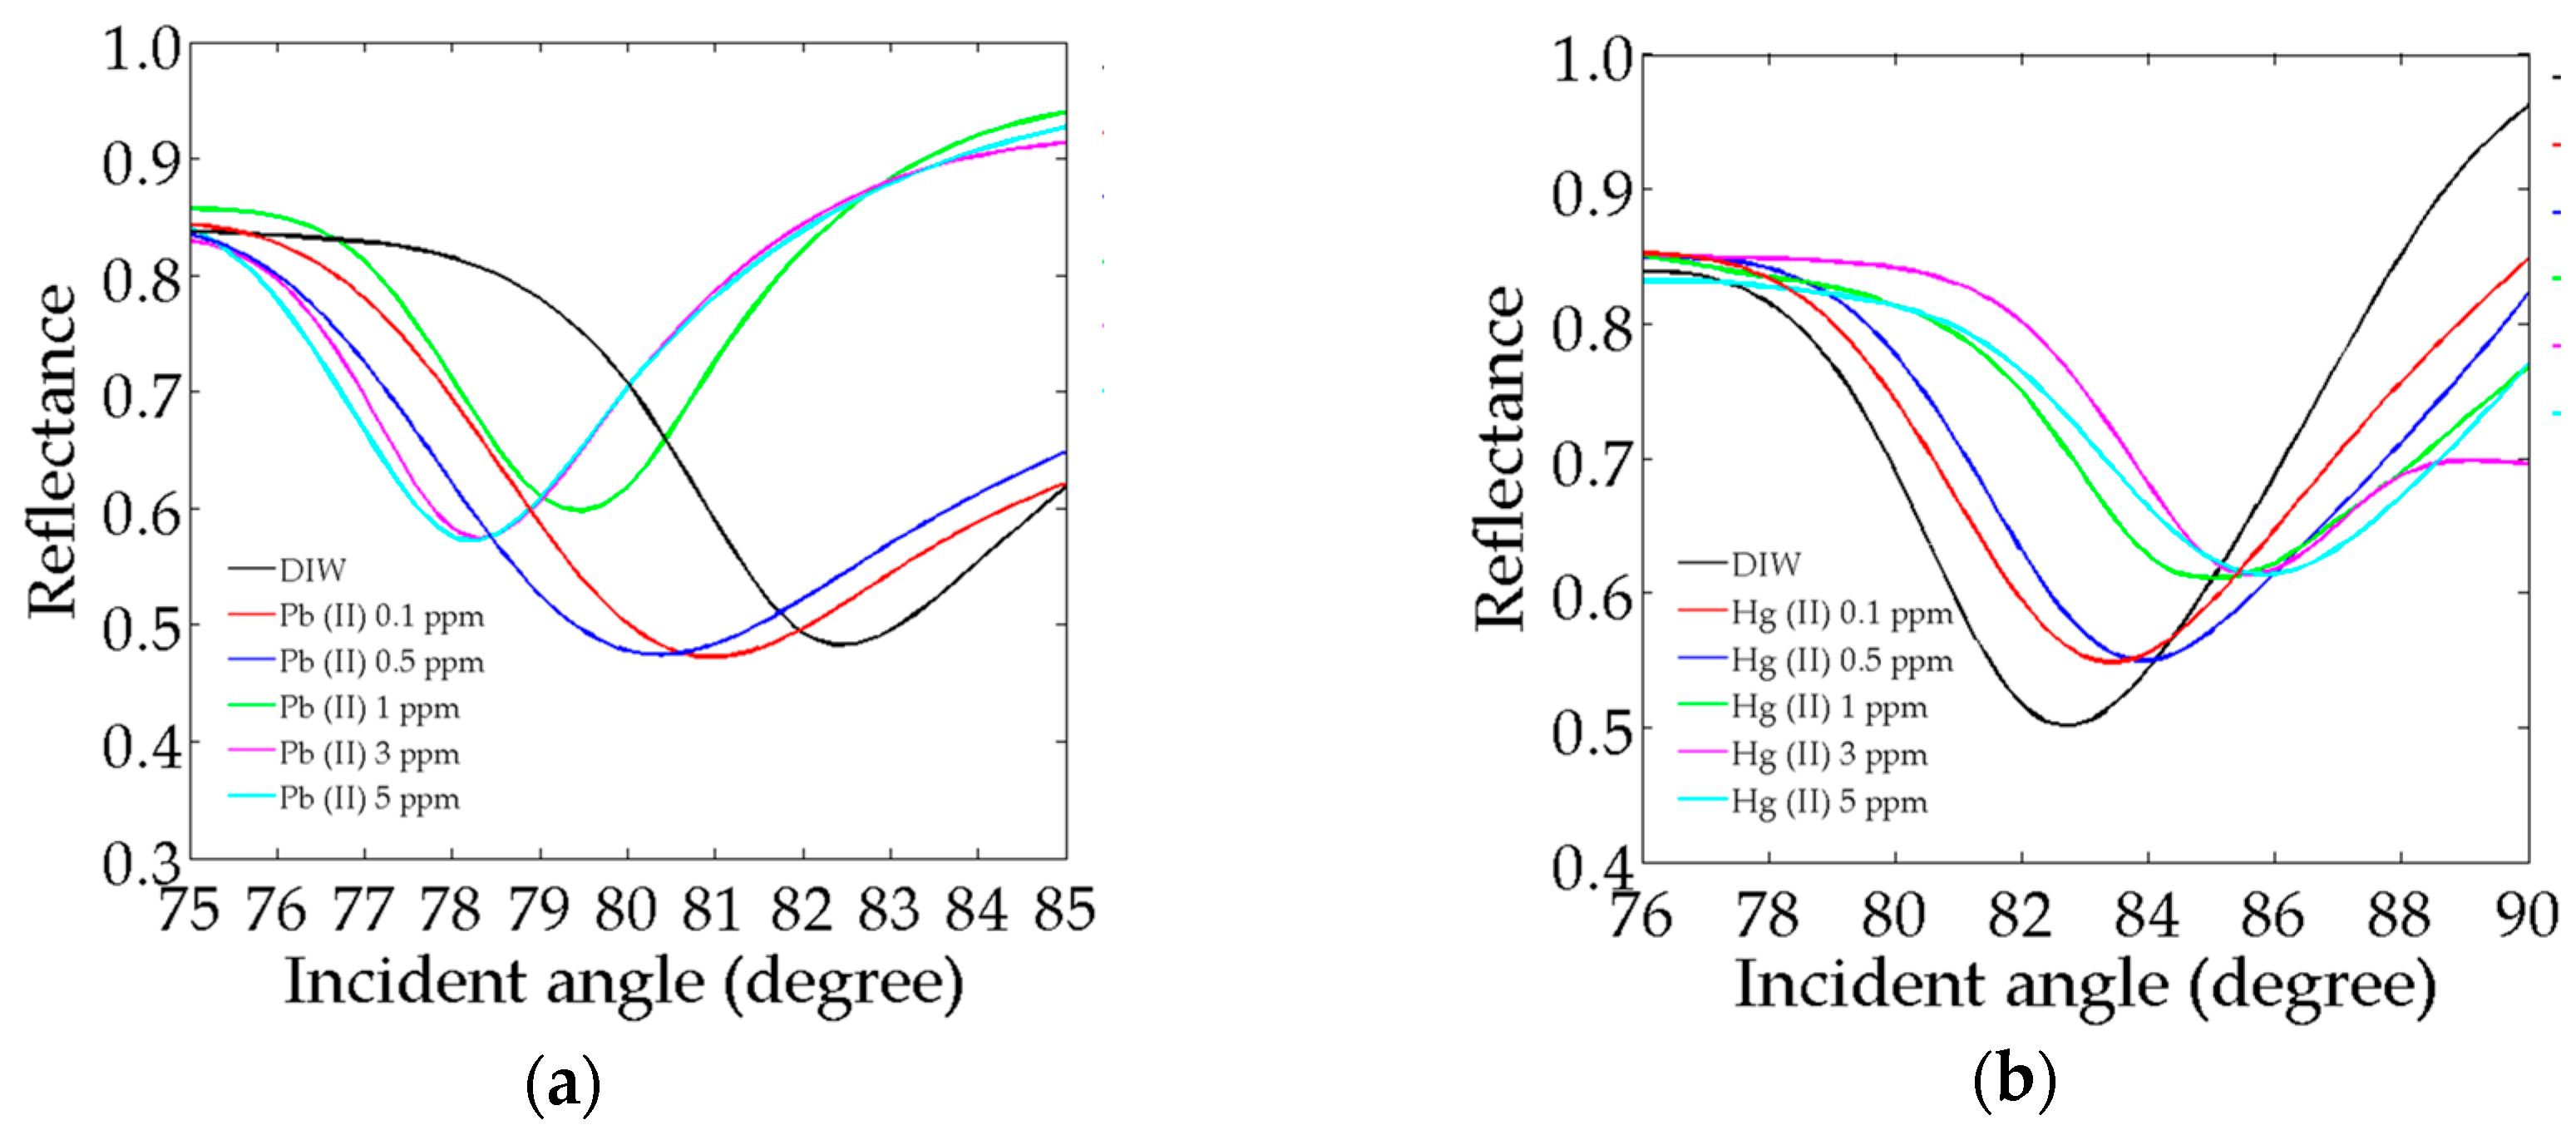
3.3. SPR Reflectivity in Pb2+ and Hg2+ Ions

Figure 5 exhibits the SPR reflectivity curves of the Au/Ag/Au/CS–GO SPR sensor upon adsorption of Pb2+ and Hg2+ ion concentrations. In Figure 5a, the Au/Ag/Au/CS–GO SPR sensor depicts a negative-shift from the reference SPR angle, which is that of the deionised water (DIW), i.e., 82.5°. The SPR angles for 0.1–5 ppm Pb2+ ions move towards smaller values, which are approximately 81.0°, 80.3°, 79.5°, 78.3° and 78.0°. The positive-shift of the SPR angle is more frequently found in the literature compared to the negative-shift. This is because most SPR sensors produce an increase in the refractive index of the sensing layer due to the analyte-ligand interaction. However, there are several other SPR sensors that exhibit negative-shift behavior for various reasons [40,48,49,50,51]. According to Saha and Sarkar, the adsorption of As (III) ions on to their CS-based SPR sensor might have reduced the thickness of the sensing layer, which consequently decreased the SPR angle with the cation concentration [50]. On the other hand, Singh and Gupta proposed that the negative-shift of their SPR sensor was due to the decrease in refractive index as a result of a chemical reaction between glucose and oxygen at the sensing layer [51]. Lokman et al. [40] as well as Fen and his co-workers [48,49] did not justify the negative-shift produced by their SPR sensors. Therefore, it is inferred that the Pb2+ adsorption on to the CS–GO sensing matrix might have caused other effects that are not only limited to the increase in refractive index and thus yielded the negative-shift.
A rather classic reasoning attributes this phenomenon to the leaky waves, which propagate in a backward direction at the metal-dielectric interface [52,53]. The thickness of the Au/Ag/Au/CS–GO SPR sensor, which exceeds 60 nm [54], and the multi-metallic nanostructures, which are capable of exciting multiple SPR [55], could also be reasons for the uncommon SPR response. Nonetheless, the results are deemed acceptable as the direction of the shifts are consistent for all measurements with Pb2+ ions, and this behavior is known a priori.
On the contrary, Figure 5b shows the SPR reflectivity curves upon adsorption of Hg2+ ions exhibiting a positive-shift. It shows that the SPR angle moves to greater values as the concentration of Hg2+ increases, which contradicts the results obtained for Pb2+ ions. This is a manifestation of several effects. First, the adsorption of the Hg2+ ions on to the CS–GO matrix might have increased the latter’s refractive index, thus producing the positive-shift in the SPR angle. Second, the binding event between the Hg2+ ions and CS–GO nanolayer might have not caused any conformational changes to the latter, hence the effective thickness of the sensor remains unaffected, thus maintaining the positive-shift for the whole range of concentration [50].

Full-Width-Half-Maximum (FWHM)

Moving on, the full-width-half-maximum (FWHM) of the SPR curves for the Au/Ag/Au/CS–GO SPR sensor in Pb2+ are roughly 5.5° and 5.0° for 0.1 ppm and 0.5 ppm; meanwhile, the higher region of concentration, i.e., 1–5 ppm, demonstrates a smaller FWHM of approximately 3.0°. The fact that the FWHM for each SPR curve is high might be due to the intensified internal loss produced by the increase in total thickness of Au, as per previous studies [56,57]. The fact that smaller FWHM is observed for the higher concentration of Pb2+ ions could be due to the increased binding event with the available functional groups of the CS–GO nanolayer, which reduced the scattering of free electrons and consequently narrowed the FHWM [58]. Although a smaller FWHM, e.g., less than 1°, would be more appealing for a better detection accuracy, this result is still acceptable as it accords with the FWHM obtained for the Au/Ag/Au SPRi chip, i.e., 3° [59].
Next, the FWHM of the SPR curves in Hg2+ ions are about 6.0°, 5.5°, 5.0°, 4.5° and 4.5°. The FWHM produced by each Hg2+ ion concentration is generally higher by 1.0° than those due to Pb2+ ions. Since there is limited literature discussing the variation of FWHM by various heavy metal ions, a direct comparison with other studies seems unachievable. However, the broadening of the SPR curves in Hg2+ could be due to greater surface plasmon scattering produced by that cation compared to Pb2+ [60,61].

3.4. Calibration Curves for Pb2+ and Hg2+ Ions

Figure 6a,b shows the calibration curves computed from the shift of the SPR angle. The shifts of the SPR angle for each Pb2+ concentration of 0.1, 0.5, 1, 3 and 5 are approximately 1.6°, 2.7°, 3.5°, 4.3° and 4.6°, in the same order. ∂θSPR is linearly dependent on [Pb2+] in two regions of concentration, i.e., 0.1 ppm to 1 ppm and 1 ppm to 5 ppm. The calibration curves for both regions of Pb2+ concentration are given by the following equations, with correlation coefficients R2 of 0.98 and 0.93, respectively.
∂θSPR = 2.05[Pb2+] + 1.48  0.1 ppm ≤ [Pb2+] ≤ 1 ppm
∂θSPR = 0.29[Pb2+] + 3.27  1 ppm ≤ [Pb2+] ≤ 5 ppm
As shown in Figure 6b, the shifts in the SPR angle for 0.1, 0.5, 1, 3 and 5 ppm of Hg2+ are about 1°, 1.5°, 2.5°, 2.8° and 3.3°, respectively. Similar trends are also demonstrated by the SPR response of the Au/Ag/Au/CS–GO SPR sensor in Hg2+ ions, which is described by the equations below. The linear regression analysis yielded correlation coefficients R2 of 0.97 and 0.98 for the lower and higher concentration regions, respectively.
∂θSPR = 1.66[Hg2+] + 0.77  0.1 ppm ≤ [Pb2+] ≤ 1 ppm
∂θSPR = 0.20[Hg2+] + 2.27  1 ppm ≤ [Pb2+] ≤ 5 ppm
The equations show that the ∂θR is directly correlated to the concentration of both cations. The CS–GO SPR sensor also shows an excellent linearity range with no sign of saturation for both cations. This is due to the enhanced Ag inner layer, which provides a stronger evanescent field to enable further detection of heavy metal ions as compared with the CS–GO SPR sensor on a single Au layer [40].
The gradient of the curves signify the sensitivity of the CS–GO sensor within that range of concentration. The Au/Ag/Au/CS–GO SPR sensor is more sensitive towards Pb2+ than Hg2+ in both regions of concentration based on the higher gradient values. The sensitivity in the lower and higher concentration regions for Pb2+ are 2.05 °ppm−1 and 0.29 °ppm−1, respectively. Meanwhile, the sensitivity towards Hg2+ is 1.66 °ppm−1 and 0.20 °ppm−1 in the same order.
Similar results were also observed where a polypyrrole–chitosan thin film exhibits greater sensitivity to Pb2+ than Hg2+ [34]. The higher sensitivity of the CS–GO SPR sensors towards Pb2+ is clearly due to its high affinity towards this ion as compared to Hg2+. The Irving–Williams series for affinity to most organic ligands also follows the same order, i.e., Pb2+ > Hg2+. The Pb2+ ionic radii of 1.21 Å, which is bigger than that of Hg2+ (1.10 Å), was also claimed to be one of the reasons for the stronger affinity towards the CS–GO binding sites [62].

Repeatability

The repeatability of the Au/Ag/Au/CS–GO SPR sensor towards Pb2+ and Hg2+ are quantified by the relative standard deviation (RSD) of the average shift in SPR angle based on five repetitions. This performance parameter is represented by the error bars in the calibration curve. It shows clearly that the magnitude of error bars are greater for Hg2+, which indicates that more variation had occurred during its detection than for Pb2+. Therefore, the Au/Ag/Au/CS–GO SPR sensor is less repeatable when tested with Hg2+ than Pb2+.
The repeatability can be related to the stability of the bond that was formed between these heavy metal ions and the CS–GO nanolayer. The Pearson’s acid-base concept suggested that soft acids react faster and bind stronger with soft bases. A similar concept is also applicable between hard acids and hard bases [63]. Certain heavy metals such as Cu+, Ag+, Cd2+ and Hg2+ are categorised as soft acids that bind faster and stronger with ligands containing sulfur. Meanwhile, borderline acids like Ni2+, Cu2+, Zn2+ and Pb2+ are more likely to bind with nitrogen donor atoms [64,65]. The CS–GO that is loaded with the amine groups (–NH2) might have formed a stronger bond with Pb2+ compared to Hg2+, hence less variation has occurred during the detection of the former cation, thus yielding a lower RSD. As per the result, higher repeatability was obtained for Pb2+ than Hg2+ ions [66,67].

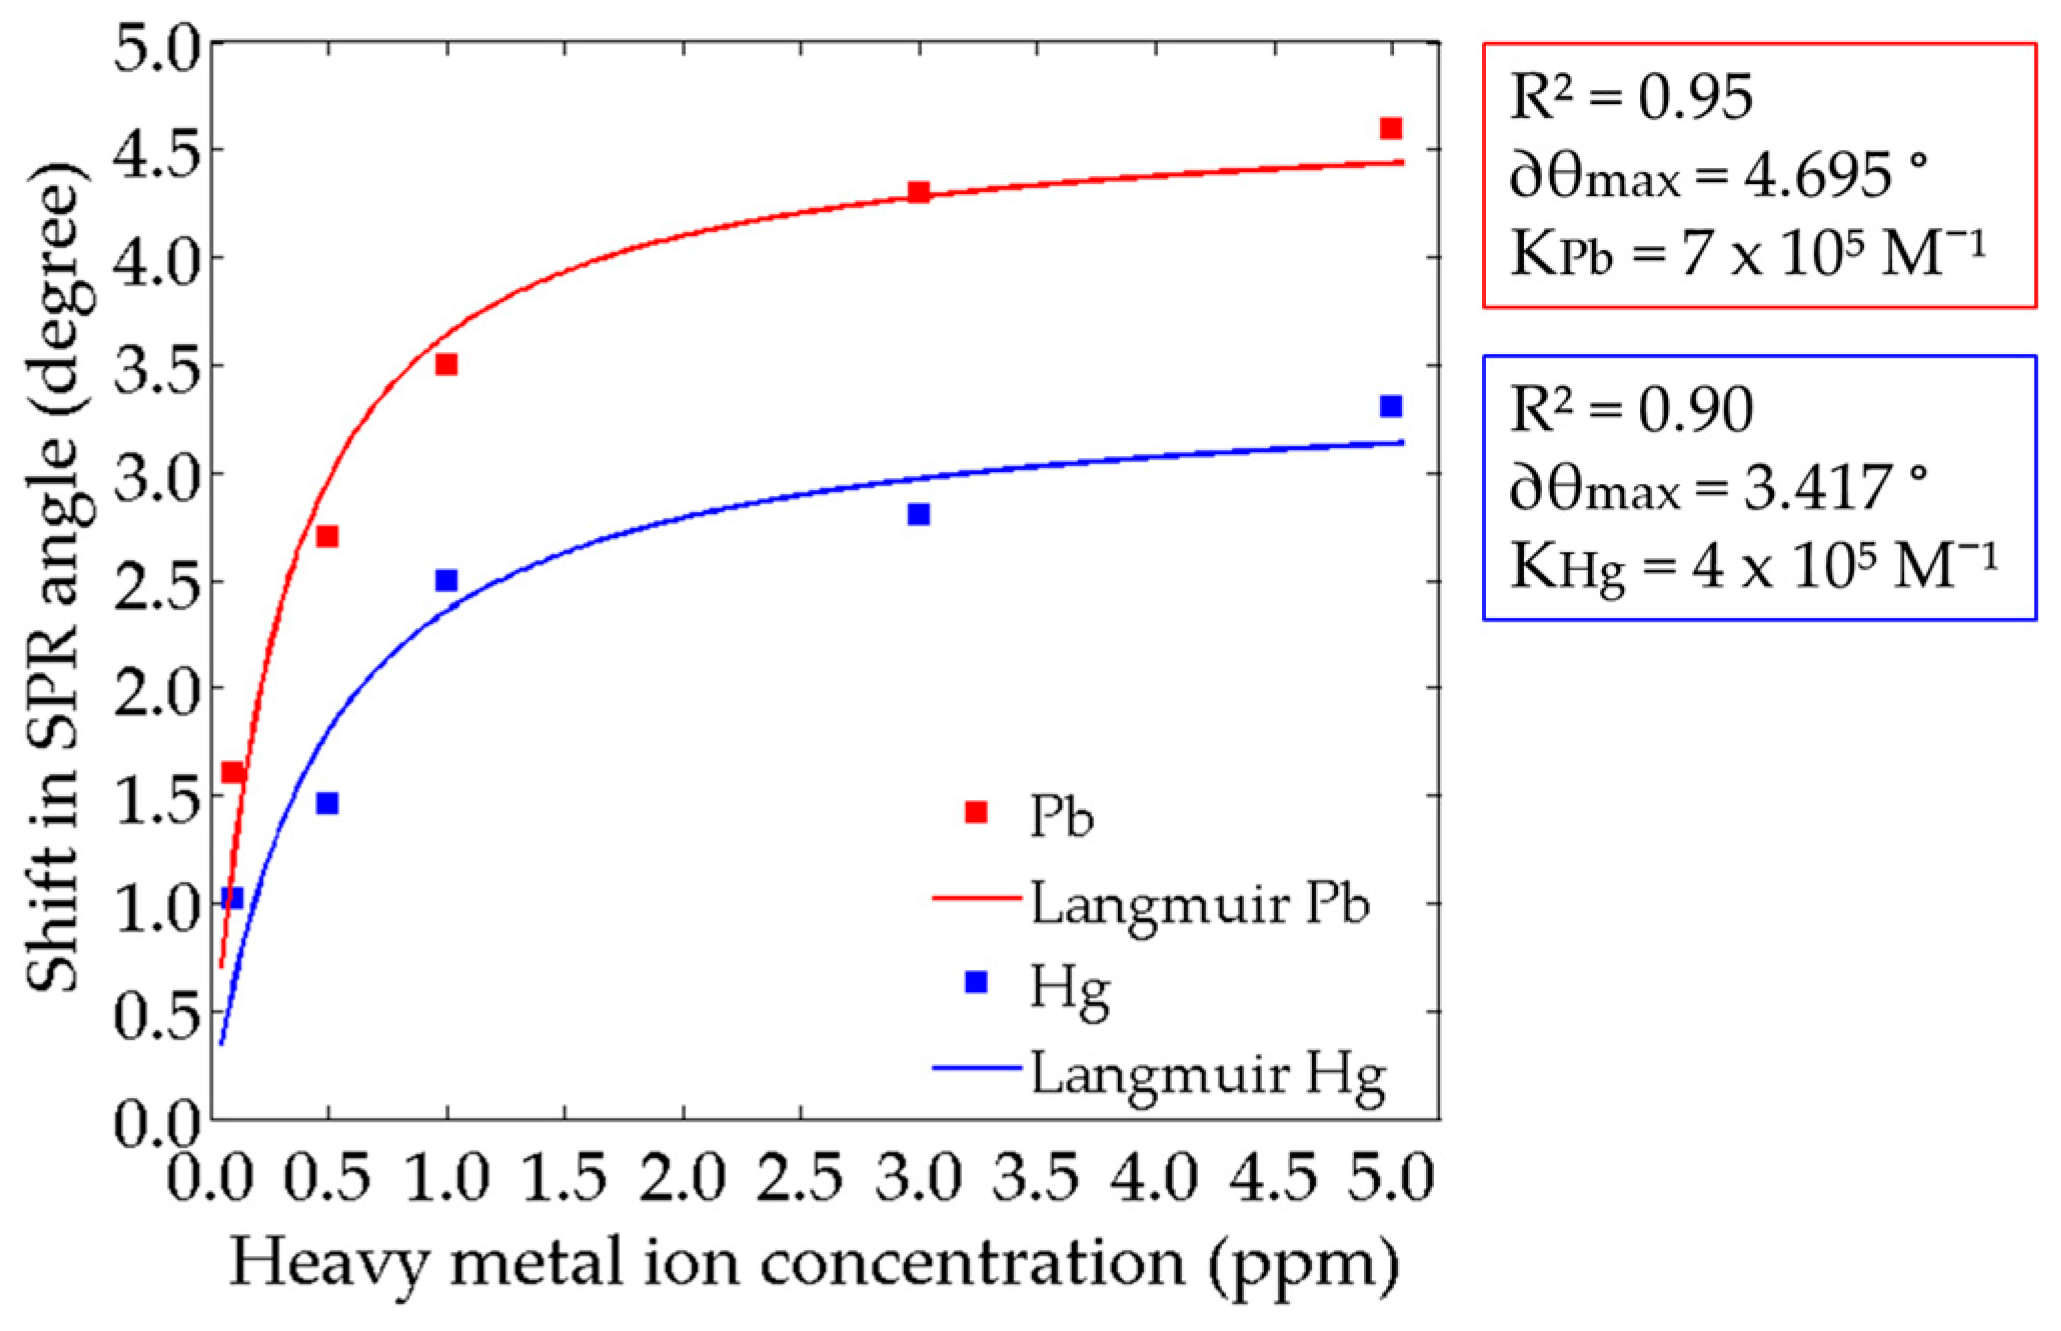
3.5. Binding Affinity Constant, K

In order to model the binding affinity of the Pb2+ and Hg2+ ions towards the CS–GO sensing layer, the calibration curves were fitted to the analogous Langmuir isotherm model, which is expressed as below:
S P R =   θ max   [ M 2 + ]   1 K + [ M 2 + ]
where ∂θmax is the maximum SPR shift or the SPR shift at saturation, [ M 2 + ] is the concentration of the heavy metal, and K is the affinity constant. The plots, which are fitted in the Langmuir model though the MATLAB fitting tool, are exhibited in Figure 7.
The fitting of the calibration curve for Pb2+ using the Langmuir model isotherm model yielded an R2 value of 0.95 and ∂θmax of approximately 4.695°, which is about 0.095° higher than the experimental maximum shift of the SPR angle, i.e., 4.6°. Similar analysis was also performed on the calibration curve for Hg2+ where a slightly lower value of R2 was obtained, i.e., 0.90. The value of ∂θmax for Hg2+ ions is about 3.417°, which is also greater than the experimental value of 3.3°. The fitting outcome shows that the calibration curve for Pb2+ fits better to the Langmuir isotherm model compared to that for Hg2+.
From this model, the binding affinity constants, K, for Pb2+ and Hg2+ to the Au/Ag/Au/CS–GO were also derived. It is calculated that the value of K for Pb2+ is about 7 × 10⁵ M−1 while 4 × 10⁵ M−1 for Hg2+. A higher affinity constant is observed for Pb2+, which infers that the CS–GO layer is more attracted to Pb2+ than Hg2+. This could be due to the higher electronegativity of Pb2+ than Hg2+, which accounts for a stronger interaction with the CS–GO layer. Following the Pauling scale of electronegativity, the Pb2+ has a value of 2.33 over 2.00 of Hg2+ [68]. Most importantly, the values of K for Pb2+ and Hg2+ in this study are comparable with those obtained using the listed SPR sensors in Table 1.
However, it is crucial to note that the derivation of the binding affinity constants via SPR response is rather challenging because it is based on the variation in the refractive index in the vicinity of the CS–GO layer due to the changing concentration of Pb2+ or Hg2+. Thus, it may not represent the overall kinetic behavior of the binding. It is important, therefore, to note that the estimated binding affinity constant using this model is an “apparent affinity”, since the reaction may still be under kinetic control and have yet to reach equilibrium [8,9,10,11]. However, as suggested by previous authors, the analogous Langmuir isotherm model should be seen as a practical tool that facilitates the determination of reasonable kinetic parameters for a better understanding of the binding event between the analyte and ligands [7].
Other than that, it is also worth highlighting that the multi-metallic nanostructure has indeed facilitated the derivation of the binding affinity constant by extending the linearity range, thus providing sufficient data for fitting the Langmuir isotherm model.

3.6. Detection Accuracy and Signal-to-Noise-Ratio

Detection accuracy (DA) is the inverse of the FWHM which measures how accurately the SPR angle was obtained from the SPR curve. It depends solely on the width of the SPR curve. The narrower the FWHM given, the higher the DA. Figure 8a shows the DA of the Au/Ag/Au/CS–GO SPR sensor upon adsorption of Pb2+ and Hg2+. It can be observed that the DA for 0.1 and 0.5 ppm of Pb2+ ions are approximately 0.25/° and 0.22/°, where the value for 1–5 ppm is 0.33/°. On the other hand, the DA in Hg2+ increased with concentration, i.e., from about 0.17/°, 0.18/°, 0.20/°, and remains stagnant at 0.22/° for 3 ppm and 5 ppm.
On average, the DA of the Au/Ag/Au/CS–GO SPR in Hg2+ is roughly 0.10/° lower than the values in Pb2+. This result signifies that the FWHM of the sensor is higher in Hg2+ than when it was exposed to Pb2+. Apart from the probability that Hg2+ might have induced greater surface plasmon scattering due to its weaker bond with CS–GO, some shortcomings during the measurements could also produce undesired noise that broadens the FWHM [69].
Another performance parameter that combines the effects of ∂θSPR and DA is the signal-to-noise ratio (SNR). The SNR can be regarded as the basic figure-of-merit (FOM) of an SPR sensor and is determined by multiplying ∂θSPR by DA. The SNR of the Au/Ag/Au/CS–GO SPR sensor in both heavy metal ions is depicted in Figure 8b. It is notable that despite the ambiguous variation of DA, the SNR for each CS–GO SPR sensor still increases with the Pb2+ concentration. Such a result shows that SNR is also another indication of binding affinity [3] because the quantity is highly dependent on the ∂θSPR. This also demonstrates that the shape of the SNR curve mirrors the shift in the SPR angle, which shows that ∂θSPR has greater effect than DA in determining the value of SNR.
Notably, the SNR is higher in Pb2+ than Hg2+ for each concentration i.e., 0.40, 0.60, 1.15, 1.43 and 1.53 for 0.1 ppm, 0.5 ppm, 1 ppm, 3 ppm and 5 ppm, respectively. Following the same order, the SNR for each concentration of Hg2+ is 0.17, 0.27, 0.5, 0.7 and 0.66, respectively. The SNR of Pb2+ for each concentration is more than twice that of Hg2+, which is due to the higher affinity of CS–GO towards the former than the latter. Sharma et al. suggested that a logical criterion of an SNR for bi-metallic SPR fiber optic SPR sensors should be around 0.6 and above [70]. The values of SNR for Pb2+ in this study are definitely higher than the proposed value, thus supporting the reliability of the results.

3.7. Shift in SPR Angle for Various Heavy Metal Ions

Figure 9a exhibits the SPR curves of the Au/Ag/Au/CS–GO SPR sensor in 1 ppm of Pb2+, Hg2+, Cu2+, Zn2+ and Cr3+. The SPR angles for 1 ppm of Cu2+, Zn2+ and Cr3+ are roughly 81.8°, 81.4° and 80.8°, respectively. The SPR curves of 1 ppm Pb2+ and Hg2+ were also plotted in the same graph for comparison. Apparently, all analytes produced a negative-shift towards the lower values of the SPR angle from the reference (82.5°) except Hg2+. The similar trend between Pb2+, Cu2+ and Zn2+ is due to their similar chemistry as borderline acids [63]. Because of this, their binding event with the CS–GO nanolayer might have decreased the refractive index of the latter, thus yielding a negative-shift. A similar trend was also observed for the trivalent ion Cr3+.
Conversely, the only SPR curve which shifts towards the higher values of the SPR angle is that of Hg2+. The reason for such variation is because Hg2+ is the only ion that falls into the category of soft acids which might interact differently with the CS–GO nanolayer. The binding between Hg2+ and the CS–GO nanolayer has increased the latter’s refractive index, which is translated into the positive-shift.
The shift in SPR angle for each heavy metal ion was also measured in order to further study the affinity of the Au/Ag/Au/CS–GO SPR sensor. Figure 9b depicts the shift of the SPR angle for Pb2+ (3.5°) prevailing over Hg2+, Cr3+, Zn2+ and Cu2+ of 2.5°, 2.0°, 1.8° and 1.5°, respectively. Based on the graph, it is shown that the CS–GO matrix has a different extent of affinity towards each cation, which in turn affects the amount of adsorption that causes the change in the refractive index, and hence the shift in SPR angle. The different extent of affinity between the heavy metal ions and CS–GO SPR sensors could be due to their individual value on the Pauling scale of electronegativity, i.e., 1.90 for Cu2+, 1.65 for Zn2+ and 1.66 for Cr3+, which might have caused them to interact uniquely with the –NH2, –OH and –COOH functional groups of the CS–GO matrix [68]. Apparently, Pb2+ and Hg2+, with higher values of electronegativity, i.e., 2.33 and 2.00, respectively, have produced greater shifts in SPR angle, signifying that the CS–GO has a higher affinity towards them compared with the other heavy metal ions. This result also supports the rationale for deriving the binding affinity of these two cations instead of the others.
On a different note, it is worth highlighting that the SPR response that is solely based on the change in refractive index could not provide conclusive information in terms of which ion would cause the variation when it comes to a multiple-ions analyte. This is due to the nature of SPR sensing itself, which is a label-free technique where the change of refractive index could be induced by any ion [10,71]. Furthermore, there is no specific ligand for each heavy metal ion, and henceforth developing a selective SPR sensor for this analyte can be very challenging [72]. Due to this consideration, it is more favourable to highlight herein the study of the binding affinity of the Au/Ag/Au/CS–GO SPR sensor than selectivity. Nevertheless, according to Homola, the selectivity of an SPR sensor can still be interpreted by comparing the shift in SPR angle produced by several types of analyte. An SPR sensor is considered to be selective towards a target analyte if it is able to produce the highest shift in SPR angle upon exposure to that particular analyte [73].
In a nutshell, this study demonstrates the derivation of the binding affinity constant, based on the Langmuir isotherm model, in order to validate the outstanding sensitivity, repeatability, DA as well as SNR of the Au/Ag/Au/CS–GO SPR sensor in detecting Pb2+ ions. The extended linearity range provided by the enhanced electromagnetic field of Au/Ag/Au nanostructures facilitates the analysis by providing sufficient SPR data for the whole range of heavy metal concentration, thus enabling the binding affinity constants to be derived. This study has expanded the other sensing modality of the Au/Ag/Au/CS–GO SPR sensor for environmental monitoring.

4. Conclusions

An Au/Ag/Au/CS–GO SPR sensor, which is very sensitive to Pb2+ and Hg2+ ions, was deployed to realise a quantitative study on the binding affinity of these cations. The binding affinity constant, K, based on the Langmuir isotherm model, gives a value of 7 × 10⁵ M−1 for Pb2+ and 4 × 10⁵ M−1 for Hg2+. The higher value of K for Pb2+ signifies that the CS–GO sensing layer is more favorable to this cation than Hg2+, due to its greater electronegativity and ionic radii. The high binding affinity between Pb2+ and the multi-metallic CS–GO SPR sensor justifies the maximum sensitivity of 2.05 °ppm−1 as compared to 1.66 °ppm−1 upon exposure of Hg2+. The repeatability for Pb2+ also prevails over Hg2+, with 50% lower relative standard deviation (RSD) than the latter. The result also exhibits greater SNR for Pb2+ of 1.53, which exceeds the proposed logical criterion of an SNR, i.e., 0.6. The CS–GO SPR sensor also shows high affinity towards Pb2+ followed by Hg2+ compared to Cr3+, Zn2+ and Cu2+ ions. For the first time, this study has demonstrated derivation of the binding affinity parameters for Pb2+ and Hg2+ by direct detection using an Au/Ag/Au/CS–GO SPR sensor that are comparable to other SPR techniques. This finding validates the outstanding performance of the multi-metallic CS–GO SPR sensor, suggesting that its application as a heavy metal detector in environmental monitoring is promising.

Acknowledgments

The authors are grateful to the Physics Department of the Science and Technology Faculty, the Laboratory of Photonics Institute of Microengineering and Nanoelectronics (IMEN), and the Centre for Research and Instrumentation Management (CRIM), Universiti Kebangsaan Malaysia, for providing their facilities. The authors would also like to acknowledge the support of the Malaysian Ministry of Higher Education (MOHE) for funding this work under the Research University Grant scheme (FRGS/1/2015/TK04/UKM/02/3 and FRGS/1/2016/TK04/UKM/02/7). We would also like to thank MyPhD/MyBrain15 for the scholarship awarded to the first author of this paper.

Author Contributions

All authors contributed extensively to the work presented in this article and in preparing the manuscript. Nur Hasiba Kamaruddin and Ahmad Ashrif A. Bakar were the main contributors to the experimental work and analysis. Nur Hasiba Kamaruddin wrote the paper and worked on each section of the present manuscript. Ahmad Ashrif A. Bakar was the scientific coordinator of the study. Nadhratun Naiim Mobarak, Mohd Saiful Dzulkefly Zan and Norhana Arsad provided progressive detailed feedback to improve the manuscript contents.

Conflicts of Interest

The authors declare no conflict of interest. The founding sponsors had no role in the design of the study; in the collection, analyses, or interpretation of data; in the writing of the manuscript; or in the decision to publish the results.

References

  1. McDonnell, J.M. Surface plasmon resonance: Towards an understanding of the mechanisms of biological molecular recognition. Curr. Opin. Chem. Biol. 2001, 5, 572–577. [Google Scholar] [CrossRef]
  2. Kastritis, P.L.; Bonvin, A.M. On the binding affinity of macromolecular interactions: Daring to ask why proteins interact. J. R. Soc. Interface 2013, 10, 20120835. [Google Scholar] [CrossRef] [PubMed]
  3. Cennamo, N.; Massarotti, D.; Galatus, R.; Conte, L.; Zeni, L. Performance comparison of two sensors based on surface plasmon resonance in a plastic optical fiber. Sensors 2013, 13, 721–735. [Google Scholar] [CrossRef] [PubMed]
  4. Wu, C.-M.; Lin, L.-Y. Immobilization of metallothionein as a sensitive biosensor chip for the detection of metal ions by surface plasmon resonance. Biosens. Bioelectron. 2004, 20, 864–871. [Google Scholar] [CrossRef] [PubMed]
  5. Wei, Y.; Latour, R.A. Determination of the adsorption free energy for peptide-surface interactions by spr spectroscopy. Langmuir 2008, 24, 6721–6729. [Google Scholar] [CrossRef] [PubMed]
  6. O’Shannessy, D.J. Determination of kinetic rate and equilibrium binding constants for macromolecular interactions: A critique of the surface plasmon resonance literature. Curr. Opin. Biotechnol. 1994, 5, 65–71. [Google Scholar] [CrossRef]
  7. De Mol, N.J.; Fischer, M.J. Kinetic and thermodynamic analysis of ligand-receptor interactions: Spr applications in drug development. In Handbook of Surface Plasmon Resonance; Royal Society of Chemistry: Cambridge, UK, 2008; pp. 123–172. [Google Scholar]
  8. Forzani, E.S.; Foley, K.; Westerhoff, P.; Tao, N. Detection of arsenic in groundwater using a surface plasmon resonance sensor. Sens. Actuators B Chem. 2007, 123, 82–88. [Google Scholar] [CrossRef]
  9. Forzani, E.S.; Zhang, H.; Chen, W.; Tao, N. Detection of heavy metal ions in drinking water using a high-resolution differential surface plasmon resonance sensor. Environ. Sci. Technol. 2004, 39, 1257–1262. [Google Scholar] [CrossRef]
  10. Wang, R.; Wang, W.; Ren, H.; Chae, J. Detection of copper ions in drinking water using the competitive adsorption of proteins. Biosens. Bioelectron. 2014, 57, 179–185. [Google Scholar] [CrossRef] [PubMed]
  11. Zhang, Y.; Xu, M.; Wang, Y.; Toledo, F.; Zhou, F. Studies of metal ion binding by apo-metallothioneins attached onto preformed self-assembled monolayers using a highly sensitive surface plasmon resonance spectrometer. Sens. Actuators B Chem. 2007, 123, 784–792. [Google Scholar] [CrossRef] [PubMed]
  12. Hawkes, S.J. What is a “heavy metal”? J. Chem. Educ. 1997, 74, 1374. [Google Scholar] [CrossRef]
  13. Nagajyoti, P.C.; Lee, K.D.; Sreekanth, T.V.M. Heavy metals, occurrence and toxicity for plants: A review. Environ. Chem. Lett. 2010, 8, 199–216. [Google Scholar] [CrossRef]
  14. Habila, M.A.; Yilmaz, E.; Alothman, Z.A.; Soylak, M. Combination of dispersive liquid–liquid microextraction and multivariate optimization for separation-enrichment of traces lead by flame atomic absorption spectrometry. J. Ind. Eng. Chem. 2016, 37, 306–311. [Google Scholar] [CrossRef]
  15. Taylor, H.E. Inductively Coupled Plasma-Mass Spectrometry: Practices and Techniques; Academic Press: San Diego, CA, USA, 2001. [Google Scholar]
  16. Shih, T.-T.; Hsieh, C.-C.; Luo, Y.-T.; Su, Y.-A.; Chen, P.-H.; Chuang, Y.-C.; Sun, Y.-C. A high-throughput solid-phase extraction microchip combined with inductively coupled plasma-mass spectrometry for rapid determination of trace heavy metals in natural water. Anal. Chim. Acta 2016, 916, 24–32. [Google Scholar] [CrossRef] [PubMed]
  17. Jankowski, K.; Yao, J.; Kasiura, K.; Jackowska, A.; Sieradzka, A. Multielement determination of heavy metals in water samples by continuous powder introduction microwave-induced plasma atomic emission spectrometry after preconcentration on activated carbon. Spectrochim. Acta Part B At. Spectrosc. 2005, 60, 369–375. [Google Scholar] [CrossRef]
  18. Lima, A.F.; Da Costa, M.C.; Ferreira, D.C.; Richter, E.M.; Munoz, R.A. Fast ultrasound-assisted treatment of inorganic fertilizers for mercury determination by atomic absorption spectrometry and microwave-induced plasma spectrometry with the aid of the cold-vapor technique. Microchem. J. 2015, 118, 40–44. [Google Scholar] [CrossRef]
  19. Neupane, L.N.; Oh, E.-T.; Park, H.J.; Lee, K.-H. Selective and sensitive detection of heavy metal ions in 100% aqueous solution and cells with a fluorescence chemosensor based on peptide using aggregation-induced emission. Anal. Chem. 2016, 88, 3333–3340. [Google Scholar] [CrossRef] [PubMed]
  20. Ermakova, E.; Michalak, J.; Meyer, M.; Arslanov, V.; Tsivadze, A.; Guilard, R.; Bessmertnykh-Lemeune, A. Colorimetric Hg2+ sensing in water: From molecules toward low-cost solid devices. Org. Lett. 2013, 15, 662–665. [Google Scholar] [CrossRef] [PubMed]
  21. Gong, J.; Zhou, T.; Song, D.; Zhang, L. Monodispersed au nanoparticles decorated graphene as an enhanced sensing platform for ultrasensitive stripping voltammetric detection of mercury(ii). Sens. Actuators B Chem. 2010, 150, 491–497. [Google Scholar] [CrossRef]
  22. Wang, Z.; Sun, X.; Li, C.; He, X.; Liu, G. On-site detection of heavy metals in agriculture land by a disposable sensor based virtual instrument. Comput. Electron. Agric. 2016, 123, 176–183. [Google Scholar] [CrossRef]
  23. Martín-Yerga, D.; Costa-García, A. Recent advances in the electrochemical detection of mercury. Curr. Opin. Electrochem. 2017. [Google Scholar] [CrossRef]
  24. Lu, Z.; Yang, S.; Yang, Q.; Luo, S.; Liu, C.; Tang, Y. A glassy carbon electrode modified with graphene, gold nanoparticles and chitosan for ultrasensitive determination of lead (ii). Microchim. Acta 2013, 180, 555–562. [Google Scholar] [CrossRef]
  25. Zhou, W.; Li, C.; Sun, C.; Yang, X. Simultaneously determination of trace Cd2+ and Pb2+ based on l-cysteine/graphene modified glassy carbon electrode. Food Chem. 2016, 192, 351–357. [Google Scholar] [CrossRef] [PubMed]
  26. Kim, J.A.; Hwang, T.; Dugasani, S.R.; Amin, R.; Kulkarni, A.; Park, S.H.; Kim, T. Graphene based fiber optic surface plasmon resonance for bio-chemical sensor applications. Sens. Actuators B Chem. 2013, 187, 426–433. [Google Scholar] [CrossRef]
  27. Patnaik, A.; Senthilnathan, K.; Jha, R. Graphene-based conducting metal oxide coated d-shaped optical fiber spr sensor. IEEE Photonics Technol. Lett. 2015, 27, 2437–2440. [Google Scholar] [CrossRef]
  28. Preechaburana, P.; Gonzalez, M.C.; Suska, A.; Filippini, D. Surface plasmon resonance chemical sensing on cell phones. Angew. Chem. 2012, 124, 11753–11756. [Google Scholar] [CrossRef]
  29. Liu, Y.; Liu, Q.; Chen, S.; Cheng, F.; Wang, H.; Peng, W. Surface plasmon resonance biosensor based on smart phone platforms. Sci. Rep. 2015, 5, 12864. [Google Scholar] [CrossRef] [PubMed]
  30. McIlwee, H.A.; Schauer, C.L.; Praig, V.G.; Boukherroub, R.; Szunerits, S. Thin chitosan films as a platform for spr sensing of ferric ions. Analyst 2008, 133, 673–677. [Google Scholar] [CrossRef] [PubMed]
  31. Sadrolhosseini, A.R.; Moksin, M.M.; Yunus, W.M.M.; Talib, Z.A.; Abdi, M.M. Surface plasmon resonance detection of copper corrosion in biodiesel using polypyrrole-chitosan layer sensor. Opt. Rev. 2011, 18, 331–337. [Google Scholar] [CrossRef]
  32. Sadrolhosseini, A.R.; Noor, A.; Moksin, M.M.; Abdi, M.; Mohammadi, A. Application of polypyrrole-chitosan layer for detection of Zn (II) and Ni (II) in aqueous solutions using surface plasmon resonance. Int. J. Polym. Mater. Polym. Biomater. 2013, 62, 284–287. [Google Scholar] [CrossRef]
  33. Varma, A.; Deshpande, S.; Kennedy, J. Metal complexation by chitosan and its derivatives: A review. Carbohydr. Polym. 2004, 55, 77–93. [Google Scholar] [CrossRef]
  34. Abdi, M.M.; Abdullah, L.C.; Sadrolhosseini, A.R.; Mat Yunus, W.M.; Moksin, M.M.; Tahir, P.M. Surface plasmon resonance sensing detection of mercury and lead ions based on conducting polymer composite. PLoS ONE 2011, 6, e24578. [Google Scholar] [CrossRef] [PubMed]
  35. Lin, C.-W.; Lin, S.; Chang, C.-C. A reversible optical sensor based on chitosan film for the selective detection of copper ions. Biomed. Eng. Appl. Basis Commun. 2012, 24, 453–459. [Google Scholar] [CrossRef]
  36. Chiu, N.-F.; Huang, T.-Y.; Lai, H.-C. Graphene oxide based surface plasmon resonance. Biosensors 2013. [Google Scholar] [CrossRef]
  37. Fan, L.; Luo, C.; Sun, M.; Li, X.; Lu, F.; Qiu, H. Preparation of novel magnetic chitosan/graphene oxide composite as effective adsorbents toward methylene blue. Bioresour. Technol. 2012, 114, 703–706. [Google Scholar] [CrossRef] [PubMed]
  38. Szunerits, S.; Maalouli, N.; Wijaya, E.; Vilcot, J.-P.; Boukherroub, R. Recent advances in the development of graphene-based surface plasmon resonance (spr) interfaces. Anal. Bioanal. Chem. 2013, 405, 1435–1443. [Google Scholar] [CrossRef] [PubMed]
  39. Kyzas, G.Z.; Deliyanni, E.A.; Matis, K.A. Graphene oxide and its application as an adsorbent for wastewater treatment. J. Chem. Technol. Biotechnol. 2014, 89, 196–205. [Google Scholar] [CrossRef]
  40. Lokman, N.F.; Bakar, A.A.A.; Suja, F.; Abdullah, H.; Rahman, W.B.W.A.; Huang, N.-M.; Yaacob, M.H. Highly sensitive spr response of au/chitosan/graphene oxide nanostructured thin films toward Pb (II) ions. Sens. Actuators B Chem. 2014, 195, 459–466. [Google Scholar] [CrossRef]
  41. Kamaruddin, N.H.; Bakar, A.A.A.; Yaacob, M.H.; Mahdi, M.A.; Zan, M.S.D.; Shaari, S. Enhancement of chitosan-graphene oxide spr sensor with a multi-metallic layers of au–ag–au nanostructure for lead (ii) ion detection. Appl. Surf. Sci. 2016, 361, 177–184. [Google Scholar] [CrossRef]
  42. United States Environmental Protection Agency. Introduction to United States Environmental Protection Agency Hazardous Waste Identification (40 cfr parts 261); United States Environmental Protection Agency: Washington, DC, USA, 2005.
  43. Bustos-Ramírez, K.; Martínez-Hernández, A.L.; Martínez-Barrera, G.; Icaza, M.; Castaño, V.M.; Velasco-Santos, C. Covalently bonded chitosan on graphene oxide via redox reaction. Materials 2013, 6, 911–926. [Google Scholar] [CrossRef] [PubMed]
  44. Salam, A.; Pawlak, J.J.; Venditti, R.A.; El-tahlawy, K. Synthesis and characterization of starch citrate–chitosan foam with superior water and saline absorbance properties. Biomacromolecules 2010, 11, 1453–1459. [Google Scholar] [CrossRef] [PubMed]
  45. Kumar, A.S.K.; Jiang, S.-J. Chitosan-functionalized graphene oxide: A novel adsorbent an efficient adsorption of arsenic from aqueous solution. J. Environ. Chem. Eng. 2016, 4, 1698–1713. [Google Scholar] [CrossRef]
  46. Kim, D.S.; Dhand, V.; Rhee, K.Y.; Park, S.-J. Study on the effect of silanization and improvement in the tensile behavior of graphene-chitosan-composite. Polymers 2015, 7, 527–551. [Google Scholar] [CrossRef]
  47. Yan, T.; Zhang, H.; Huang, D.; Feng, S.; Fujita, M.; Gao, X.-D. Chitosan-functionalized graphene oxide as a potential immunoadjuvant. Nanomaterials 2017, 7, 59. [Google Scholar] [CrossRef] [PubMed]
  48. Fen, Y.W.; Yunus, W.M.M.; Yusof, N.A. Surface plasmon resonance optical sensor for detection of Pb2+ based on immobilized p-tert-butylcalix[4]arene-tetrakis in chitosan thin film as an active layer. Sens. Actuators B Chem. 2012, 171–172, 287–293. [Google Scholar] [CrossRef]
  49. Fen, Y.W.; Yunus, W.M.M.; Talib, Z.A. Analysis of Pb (ii) ion sensing by crosslinked chitosan thin film using surface plasmon resonance spectroscopy. Opt.-Int. J. Light Electron. Opt. 2013, 124, 126–133. [Google Scholar] [CrossRef]
  50. Saha, S.; Sarkar, P. Differential pulse anodic stripping voltammetry for detection of as (iii) by chitosan-fe (oh) 3 modified glassy carbon electrode: A new approach towards speciation of arsenic. Talanta 2016, 158, 235–245. [Google Scholar] [CrossRef] [PubMed]
  51. Singh, S.; Gupta, B.D. Fabrication and characterization of a surface plasmon resonance based fiber optic sensor using gel entrapment technique for the detection of low glucose concentration. Sens. Actuators B Chem. 2013, 177, 589–595. [Google Scholar] [CrossRef]
  52. Tamir, T. Leaky waves in planar optical waveguides. Nouvelle Revue d'Optique 1975, 6, 273–284. [Google Scholar] [CrossRef]
  53. Tamir, T.; Oliner, A.A. The spectrum of electromagnetic waves guided by a plasma layer. Proc. IEEE 1963, 51, 317–332. [Google Scholar] [CrossRef]
  54. Yin, X.; Hesselink, L.; Liu, Z.; Fang, N.; Zhang, X. Large positive and negative lateral optical beam displacements due to surface plasmon resonance. Appl. Phys. Lett. 2004, 85, 372–374. [Google Scholar] [CrossRef]
  55. Kim, N.-H.; Kim, T.W.; Byun, K.M. How to avoid a negative shift in reflection-type surface plasmon resonance biosensors with metallic nanostructures. Opt. Expr. 2014, 22, 4723–4730. [Google Scholar] [CrossRef] [PubMed]
  56. Zynio, S.; Samoylov, A.; Surovtseva, E.; Mirsky, V.; Shirshov, Y. Bimetallic layers increase sensitivity of affinity sensors based on surface plasmon resonance. Sensors 2002, 2, 62–70. [Google Scholar] [CrossRef]
  57. Lee, K.-S.; Son, J.M.; Jeong, D.-Y.; Lee, T.S.; Kim, W.M. Resolution enhancement in surface plasmon resonance sensor based on waveguide coupled mode by combining a bimetallic approach. Sensors 2010, 10, 11390–11399. [Google Scholar] [CrossRef] [PubMed]
  58. Zijlstra, P.; Paulo, P.M.R.; Yu, K.; Xu, Q.-H.; Orrit, M. Chemical interface damping in single gold nanorods and its near elimination by tip-specific functionalization. Angew. Chem. Int. Ed. 2012, 51, 8352–8355. [Google Scholar] [CrossRef] [PubMed]
  59. Wang, Z.; Cheng, Z.; Singh, V.; Zheng, Z.; Wang, Y.; Li, S.; Song, L.; Zhu, J. Stable and sensitive silver surface plasmon resonance imaging sensor using trilayered metallic structures. Anal. Chem. 2013, 86, 1430–1436. [Google Scholar] [CrossRef] [PubMed]
  60. Raether, H. Surface Plasmons on Smooth Surfaces; Springer: Berlin, Germany, 1988. [Google Scholar]
  61. Jose, J.; Segerink, F.; Korterik, J.; Gomez-Casado, A.; Huskens, J.; Herek, J.; Offerhaus, H. Enhanced surface plasmon polariton propagation length using a buried metal grating. J. Appl. Phys. 2011, 109, 064906. [Google Scholar] [CrossRef]
  62. Bayramoglu, G.; Yakup Arica, M.; Bektas, S. Removal of Cd(ii), Hg(ii), and Pb(ii) ions from aqueous solution using p(hema/chitosan) membranes. J. Appl. Polym. Sci. 2007, 106, 169–177. [Google Scholar] [CrossRef]
  63. Pearson, R.G. Hard and soft acids and bases. J. Am. Chem. Soc. 1963, 85, 3533–3539. [Google Scholar] [CrossRef]
  64. Parr, R.G.; Pearson, R.G. Absolute hardness: Companion parameter to absolute electronegativity. J. Am. Chem. Soc. 1983, 105, 7512–7516. [Google Scholar] [CrossRef]
  65. Pearson, R.G. Chemical hardness and density functional theory. J. Chem. Sci. 2005, 117, 369–377. [Google Scholar] [CrossRef]
  66. Fan, L.; Luo, C.; Sun, M.; Li, X.; Qiu, H. Highly selective adsorption of lead ions by water-dispersible magnetic chitosan/graphene oxide composites. Colloids Surf. B Biointerfaces 2013, 103, 523–529. [Google Scholar] [CrossRef] [PubMed]
  67. Gedam, A.H.; Dongre, R.S.; Bansiwal, A.K. Synthesis and characterization of graphite doped chitosan composite for batch adsorption of lead (ii) ions from aqueous solution. Adv. Mater. Lett. 2015, 6, 59–67. [Google Scholar] [CrossRef]
  68. Weiner, E.R. Applications of Environmental Aquatic Chemistry: A Practical Guide; CRC Press: Boca Raton, FL, USA, 2012. [Google Scholar]
  69. Sharma, A.K.; Jha, R.; Gupta, B.D. Fiber-optic sensors based on surface plasmon resonance: A comprehensive review. Sens. J. IEEE 2007, 7, 1118–1129. [Google Scholar] [CrossRef]
  70. Sharma, A.K.; Gupta, B.D. On the performance of different bimetallic combinations in surface plasmon resonance based fiber optic sensors. J. Appl. Phys. 2007, 101, 093111. [Google Scholar] [CrossRef]
  71. Yu, X.; Xu, D.; Cheng, Q. Label-free detection methods for protein microarrays. Proteomics 2006, 6, 5493–5503. [Google Scholar] [CrossRef] [PubMed]
  72. Wang, S.; Forzani, E.S.; Tao, N. Detection of heavy metal ions in water by high-resolution surface plasmon resonance spectroscopy combined with anodic stripping voltammetry. Anal. Chem. 2007, 79, 4427–4432. [Google Scholar] [CrossRef] [PubMed]
  73. Homola, J.R. SURFACE Plasmon Resonance Based Sensors; Springer Science and Business Media: Heidelberg, Germany, 2006; Volume 4. [Google Scholar]
Figure 1. The in-house synthesis of the CS–GO nanocomposite.
Sensors 17 02277 g001
Figure 2. Deposition of multi-metallic nanostructures.
Sensors 17 02277 g002
Figure 3. SPR spectroscopy based on the Kretschmann configuration.
Sensors 17 02277 g003
Figure 4. The cross-sectional analysis that computes the thickness of the CS–GO nanolayer.
Sensors 17 02277 g004
Figure 5. SPR reflectivity of the Au/Ag/Au/CS–GO SPR sensor in (a) Pb2+ and (b) Hg2+ ion.
Sensors 17 02277 g005
Figure 6. Calibration curve of the Au/Ag/Au/CS–GO SPR sensor in (a) Pb2+ and (b) Hg2+ ion.
Sensors 17 02277 g006
Figure 7. Langmuir isotherm model of the SPR angle shift for Pb2+ and Hg2+ ions.
Sensors 17 02277 g007
Figure 8. (a) Detection accuracy and (b) Signal-to-noise ratio of the Au/Ag/Au/CS–GO SPR sensor in Pb2+ and Hg2+ ions.
Sensors 17 02277 g008
Figure 9. (a) SPR reflectivity and (b) Shift in SPR angle of the Au/Ag/Au/CS–GO SPR sensor in 1 ppm of Pb2+, Hg2+, Cu2+, Zn2+ and Cr3+.
Sensors 17 02277 g009
Table 1. Langmuir affinity binding constant, K, for various heavy metal ions using the SPR technique.
Heavy Metal IonsSPR SensorK (M−1)References
Ni2+MUA-(His)6-4.0 × 10⁸[9]
Cu2+MUA/Gly-Gly-His6.0 × 108
Cu2+Cysteamine/His-Gly-Gly4.0 × 106
Fe3+CS9.5 × 105[30]
Cd2+Apo-metallothionein4.2 × 105[11]
Hg2+Apo-metallothionein2.7 × 103
Cu2+Polypyrrole–CS1.3 × 104[31]
Zn2+Polypyrrole–CS2.3 × 104[32]
Ni2+Polypyrrole–CS1.7 × 104
Cu2+Albumin2.3 × 102[10]
Pb2+Albumin2.4 × 102
Hg2+Albumin4.3 × 102
Table 2. The weight percentage of elements on the surface of the CS–GO nanolayer.
ElementWeight Percentage (%)
Carbon (C)19.25
Oxygen (O)32.62
Silver (Ag)27.58
Gold (Au)20.54

