Article

Radio-Frequency-Controlled Urea Dosing for NH3-SCR Catalysts: NH3 Storage Influence to Catalyst Performance under Transient Conditions

1
Bayreuth Engine Research Center (BERC), Department of Functional Materials, University of Bayreuth, 95447 Bayreuth, Germany
2
Continental Automotive GmbH, Division Powertrain, 93055 Regensburg, Germany
3
Ford Research and Innovation Center, Dearborn, MI 48124, USA
*
Author to whom correspondence should be addressed.
Sensors 2017, 17(12), 2746; https://doi.org/10.3390/s17122746
Submission received: 24 October 2017 / Accepted: 23 November 2017 / Published: 28 November 2017
(This article belongs to the Section Chemical Sensors)

Abstract

:
Current developments in exhaust gas aftertreatment led to a huge mistrust in diesel driven passenger cars due to their NOx emissions being too high. The selective catalytic reduction (SCR) with ammonia (NH3) as reducing agent is the only approach today with the capability to meet upcoming emission limits. Therefore, the radio-frequency-based (RF) catalyst state determination to monitor the NH3 loading on SCR catalysts has a huge potential in emission reduction. Recent work on this topic proved the basic capability of this technique under realistic conditions on an engine test bench. In these studies, an RF system calibration for the serial type SCR catalyst Cu-SSZ-13 was developed and different approaches for a temperature dependent NH3 storage were determined. This paper continues this work and uses a fully calibrated RF-SCR system under transient conditions to compare different directly measured and controlled NH3 storage levels, and NH3 target curves. It could be clearly demonstrated that the right NH3 target curve, together with a direct control on the desired level by the RF system, is able to operate the SCR system with the maximum possible NOx conversion efficiency and without NH3 slip.

1. Introduction

Since 2015, the exhaust gas aftertreatment for diesel engine driven vehicles has been of particular interest in the realm of politics, society, and media. After it became public that many cars with ammonia-based selective catalytic reduction (NH3 SCR) catalysts use illegal shut-off devices of the aftertreatment system, there is a huge mistrust in diesel driven passenger cars. However, the NH3-SCR is the only current DeNOx strategy for light and heavy-duty diesel engines with the capability to meet the current and upcoming emission legislations [1,2,3].
In this technique, aqueous urea solution of 32.5 wt % in water (diesel exhaust fluid = DEF, AdBlueTM, or AUS32 = aqueous urea solution) is injected into the exhaust to reduce toxic nitric oxides (NOx = NO + NO2) on special SCR catalysts. After injection into the hot exhaust (>180 °C), the urea solution decomposes after water evaporation by thermolysis and hydrolysis into gaseous ammonia (NH3) and carbon dioxide (CO2). The formed ammonia adsorbs on the active sites of the SCR catalyst and is able to reduce NOx into nitrogen (N2) and water (H2O) [2,4]. Owing to the present reaction pathways, the previous NH3 adsorption is the essential precondition for all SCR reactions [5,6,7,8]. The two most important SCR reactions are the so-called standard SCR reaction (Equation (1)) and the fast SCR reaction (Equation (2)), which occur depending on the present NO/NO2 ratio. Whereas in the standard SCR oxygen (O2) participates, the fast SCR reaction requires an equimolar amount of NO, NO2, and no O2 [2,4].
4 NH3 + 4 NO + O2 → 4 N2 + 6 H2O
4 NH3 + 2 NO + 2 NO2 → 4 N2 + 6 H2O
The required previous NH3 adsorption also offers additional benefits for the NOx conversion efficiency and the SCR system control. Due to the kinetical limitations of the SCR reactions, a specific NH3 surface coverage on the catalyst is required to achieve high NOx conversion, especially in the lower temperature range (<300 °C) [8,9]. Additionally, this leads to an easier dosing control, since changes in NOx emissions and gas flow from transient driving conditions can be buffered. Therefore, the catalyst material development aims for SCR catalysts with high NH3 storage capacity and high activity at low temperatures [3]. The latter is also required due to improvements in diesel engine technology, leading to continuously decreasing exhaust gas temperatures. The current SCR catalysts are mostly based on copper (Cu) exchanged zeolites that combine the above-mentioned requirements [10,11,12,13].
Today’s SCR system or DEF dosing control is model-based and uses gas sensor signals (NOx and/or NH3 sensors), and other data from the engine control unit, like the calculated exhaust gas mass flow, to approximate the actual amount of stored NH3 on the catalyst surface [14]. The applied models simulate the entire NH3 ad- and desorption equilibrium and all occurring reactions on the catalyst, and calculate the required NH3 to control the DEF dosing module [15,16,17]. This approach, however, suffers from the fact that already-existing small errors or deviations of only one part of the whole control system may lead to an over- or under-estimation of the actual amount of stored NH3, followed by NOx or NH3 emissions [18,19].
This paper reports on the continuation of the development of a radio-frequency-based (RF) measurement technique as the only approach to monitor directly (in operando) the current amount of stored NH3 on SCR catalysts. Therefore, it relies on our recently published paper [20] and uses the developed system calibration for a first transient study with automatic DEF dosing control only relying on the RF system.

2. Radio-Frequency-Based (RF) Catalyst State Monitoring

In the RF- or microwave-based catalyst or filter state determination, the catalyst or filter itself operates as the sensitive part of the sensor system. By coupling electromagnetic waves into the metal canning, resonances (i.e., standing electromagnetic waves) can be excited at specific frequencies. The resonance frequencies are dependent on the canning’s geometry and dielectric properties of the catalyst or filter. The detectable state of the catalyst or filter requires a change of the dielectric properties of the material related to its state and can be detected directly by analyzing the resonance parameters [21,22,23].
The functionality of this approach has been proven for several types of automotive catalyst and filter systems, starting with the oxidation state of three-way catalytic converters (TWC) related to the conductivity of oxidized or reduced Ceria as oxygen storage component [24,25,26]. Soot loading on particulate filters for diesel (DPF) or gasoline engines (GPF) can also be monitored related to the conductivity of the accumulated soot particles [27,28,29,30,31]. This technique also might allow a differentiation of soot and ash loading [32]. A combined system with a GPF with TWC functionality was under investigation within transient operation in the European Driving Cycle (NEDC) as well [27]. The detection of NOx storage on lean NOx traps (LNT) is also possible, but the observed catalyst samples showed a comparably small signal and might require further investigation with current catalyst formulations [33,34]. The basic capability of the RF approach to detect the NH3 storage on SCR catalysts has been demonstrated for vanadia- and several types of zeolite-based catalysts in previous work [35,36,37,38]. In our most recent work, we performed the step in engine dynamometer setup using DEF, instead of gaseous NH3, and proved the functionality of the RF approach for commercial zeolite-based SCR catalysts (Fe and Cu exchanged) under realistic conditions [20,39].
The expected measurable material effects related to NH3 storage on SCR catalysts are the polar nature of the NH3 molecule and its effects to the conductivity mechanisms inside the zeolite structure, due to adsorption on the acidic storage sites [40,41]. Both effects are mirrored in the complex dielectric permittivity (ε = ε1 − jε2), and experiments with zeolite-based catalyst powder samples in a special setup proved the linear response of both ε1 and ε2 to NH3 storage [42,43].
If the RF measurement is performed with only one coupling element (e.g., a coaxial probe feed), only one reflection signal can be analyzed with resonances appearing as local minima. If two coupling elements are applied, the number of possible RF signals increases to four, with two reflection and two transmission signals, whereas resonances appear as local maxima in transmission mode. From both types of measurement signals, two resonance parameters can be extracted from each resonance peak: the resonance frequency fres and the unloaded quality factor Q0. Described by the theory of the so-called cavity perturbation method, changes of the resonance frequency Δfres/f0 are related to the changes of the dielectric permittivity Δε1, which is a measure of polarization effects (Equation (3)). Additionally, changes of dielectric losses, including conductivity mechanisms inside the zeolite structure, are represented in Δε2 and mirrored in the change of the reciprocal unloaded quality factor ΔQ0−1 (Equation (4)).
Δfres/f0 ∝ Δε1
ΔQ0−1 ∝ Δε2
For more detailed descriptions and theoretical background of the applied cavity perturbation method, including the used assumptions for the application case and determination of the two resonance parameters fres and Q0, we refer to our previous work [27,41,44].

3. Experimental Section

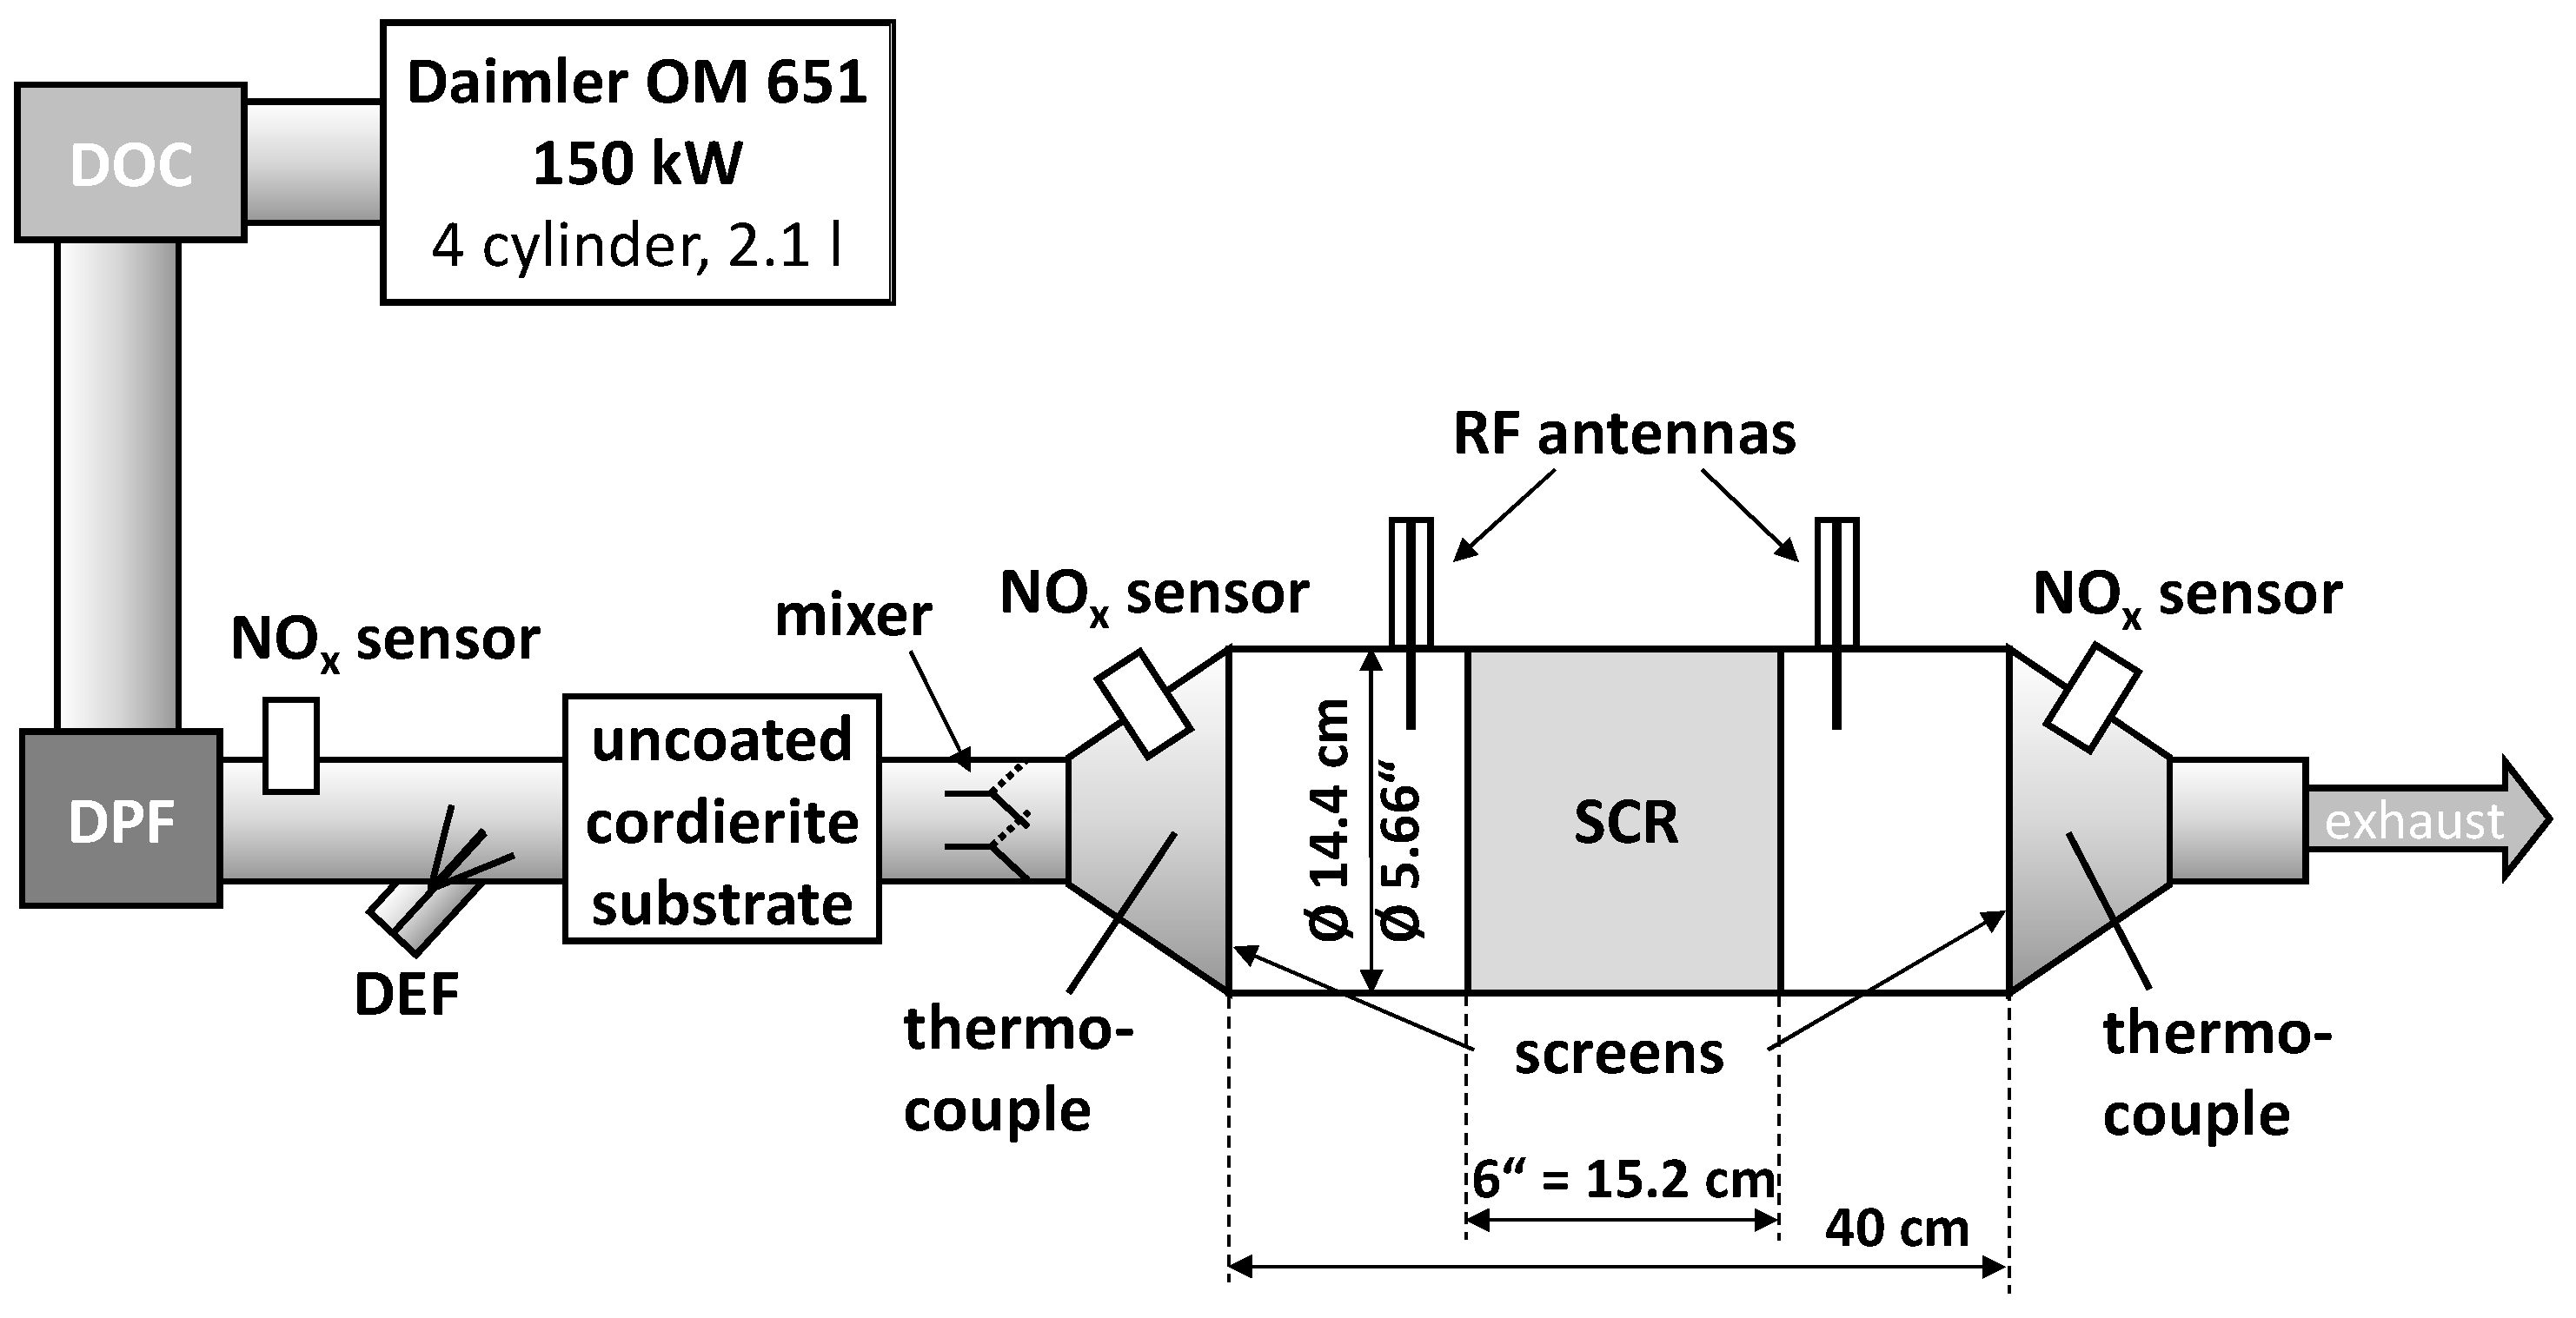
3.1. Dynamometer Setup

As this work directly continues the results of [20], the presented study was performed on the identical engine dynamometer setup and catalyst sample, as illustrated in Figure 1. It is described as follows in the order of gas flow: the turbocharged 4-cylinder and 2.1 liter diesel engine (Daimler OM 651, 150 kW), the serial type diesel oxidation catalyst (DOC) and DPF, the first NOx sensor detecting the raw NOx emissions, the DEF dosing module (Bosch Denoxtronic 3.2), an uncoated cordierite substrate to support NH3 formation, a plate mixer for a uniform NH3 concentration, the second NOx sensor that detects NOx and, due to its cross sensitivity, also NH3, the SCR catalyst canning (Ø 5.66” = 14.4 cm, length 6” = 15.2 cm) and a third NOx sensor to interpret the catalyst conversion efficiency. The catalyst sample is the well-studied copper-exchanged zeolite Cu-SSZ-13 [35,36,45] (Ford Motor Company, Dearborn, MI, USA) and was placed in the middle of the RF canning with two RF antennas, one located up- and one downstream. The ideal cylindrical shape of the resonator is defined by two metal screens and the catalyst temperature is determined indirectly by two thermocouples, located outside of the resonance cavity.
The RF signals were acquired with a vector network analyzer (VNA, MS46322A, Anritsu, Morgan Hill, CA, USA), connected by 50 Ω coaxial cables to the antennas (both not shown in Figure 1). The analyzed resonance is the lowest appearing resonance mode (TE111) with one electrical field maximum in the center of the cavity and a linear sensitivity to NH3 storage [20,39]. The RF data is measured in transmission mode (complex scattering parameter S21) and analyzed in a complex manner to determine the two RF parameters fres and Q0. Due to the applied settings, an acquisition rate of 1 Hz was used. A detailed description of the used RF data analysis can be found in [41].

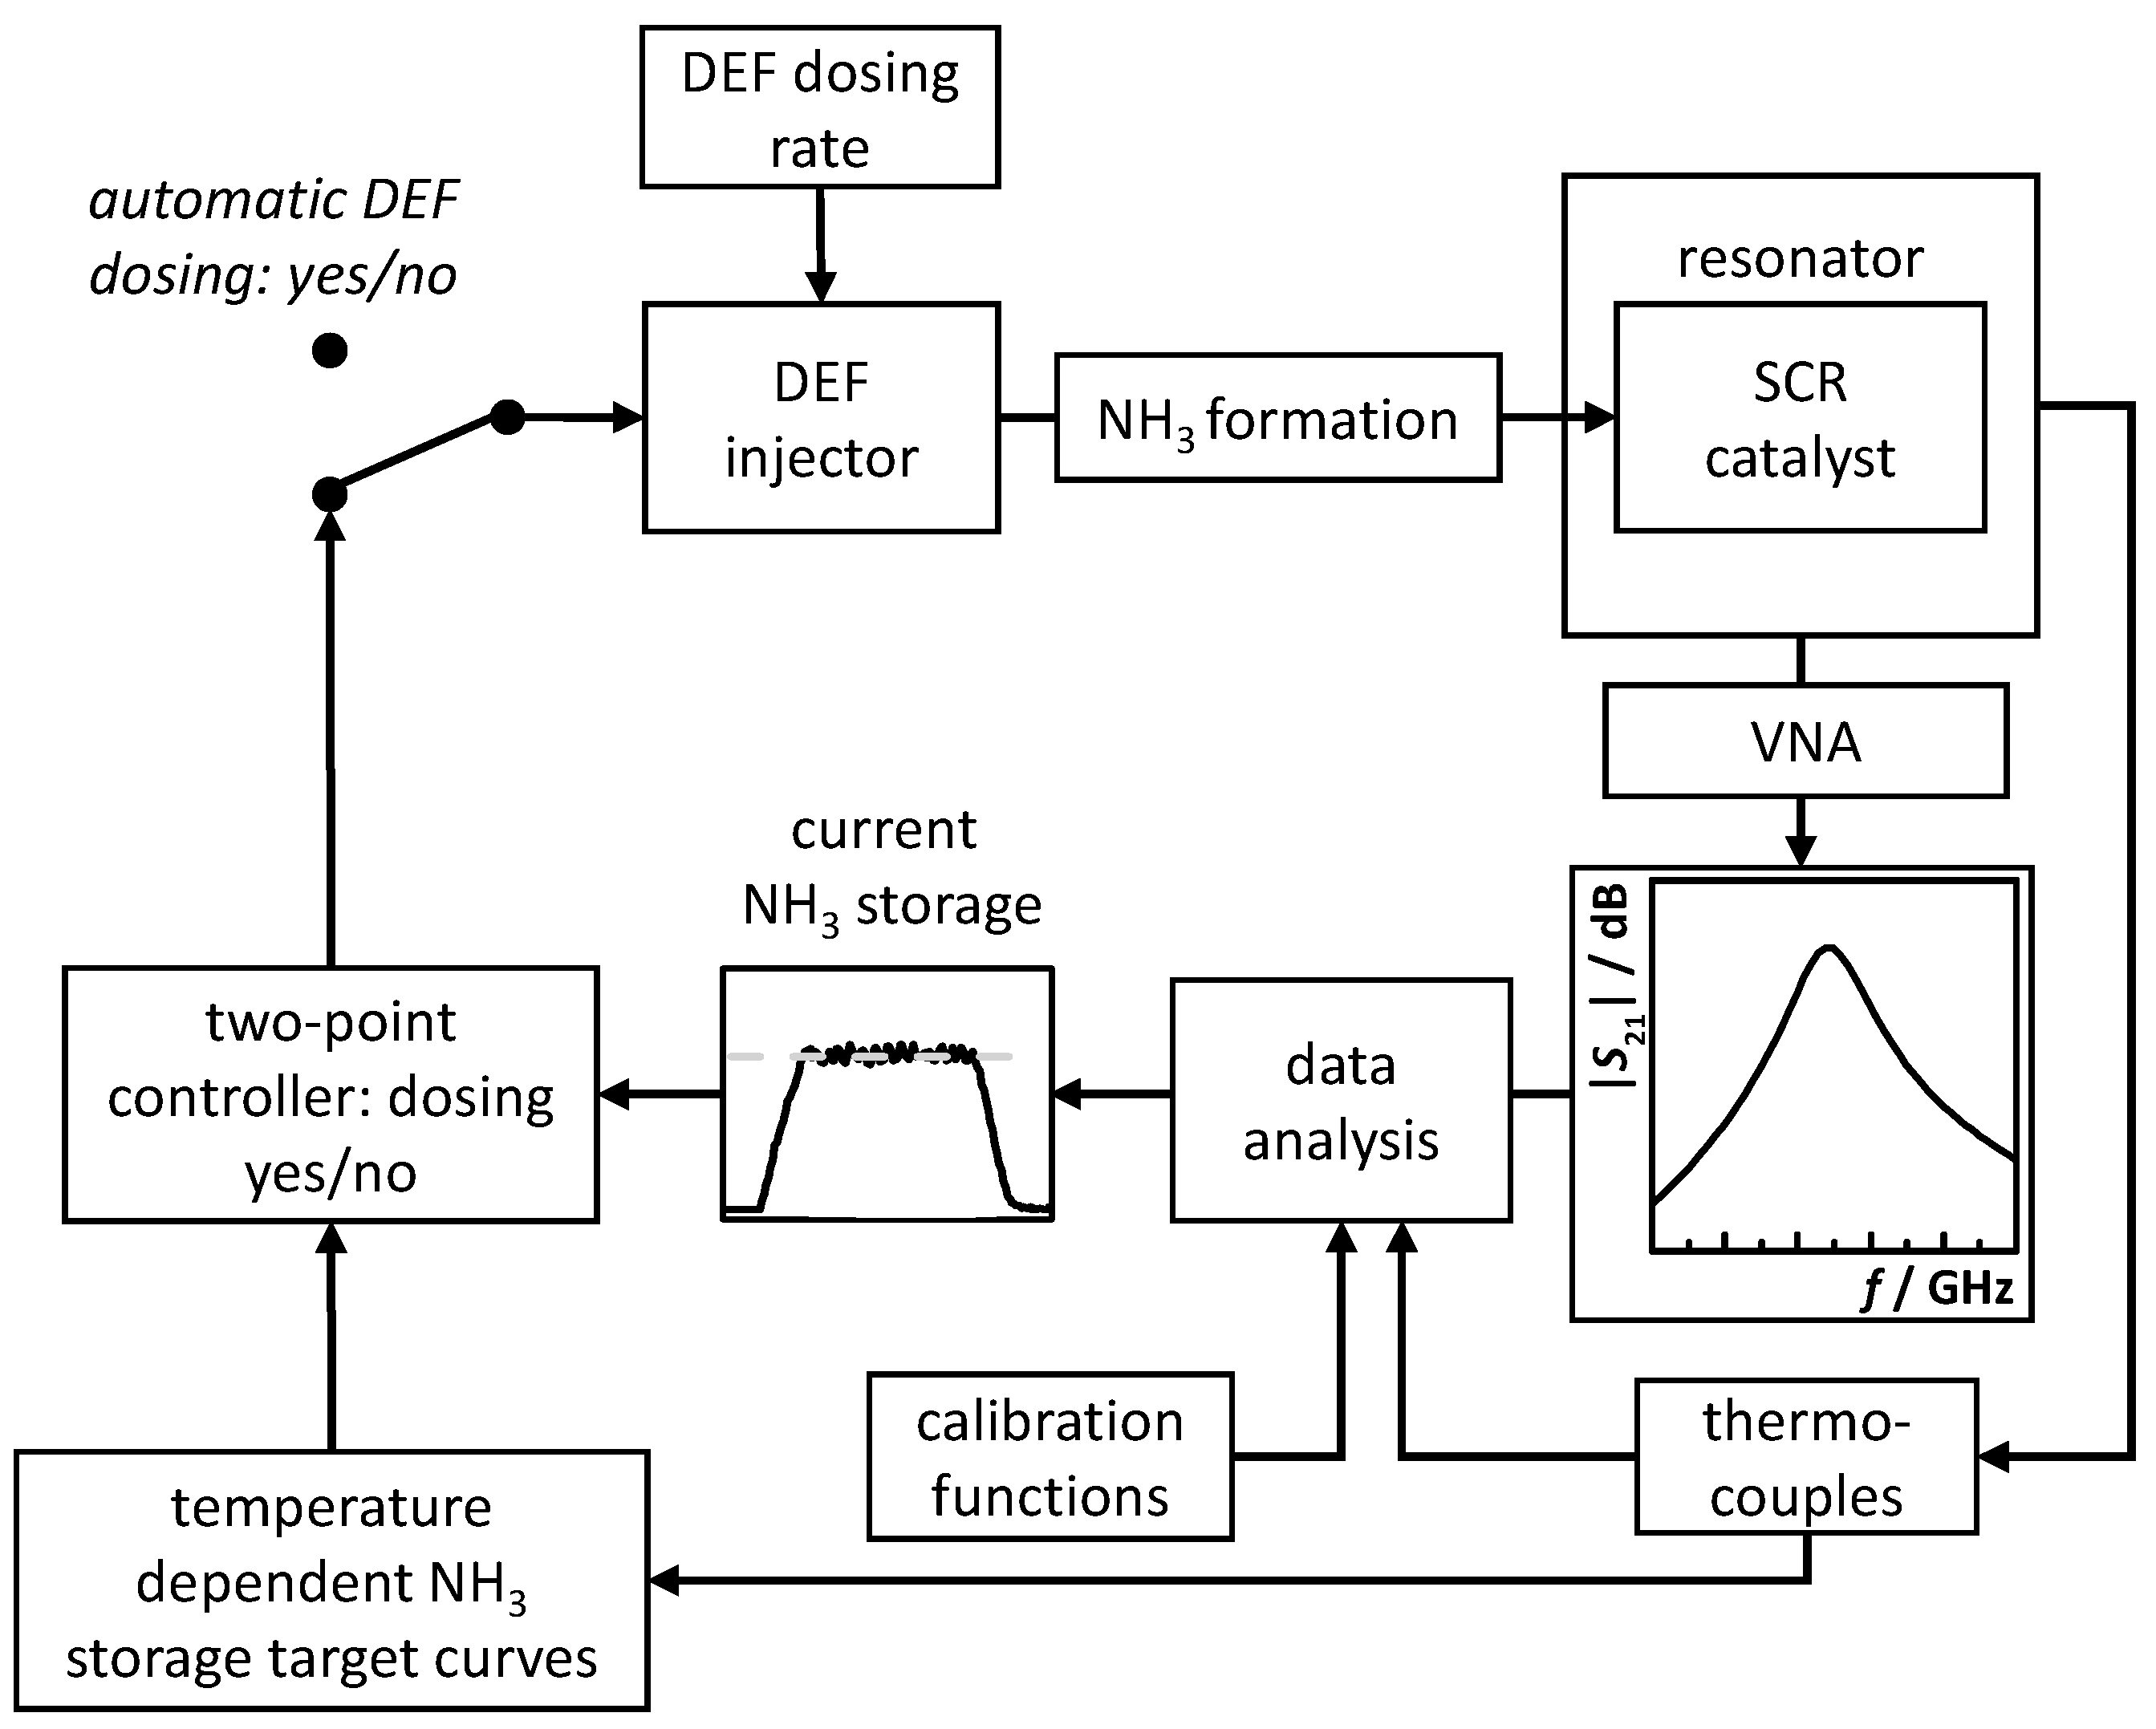
3.2. RF System Calibration, NH3 Storage Target Curves and Control Flow

The determined behavior of the RF signals of [20] is summarized in Figure 2, with fres in (a) and Q0−1 in (b) for the empty state (squares). The ideal NH3 storage degree (red triangles) represents the minimum NH3 storage to achieve the maximum possible NOx conversion efficiency and the NH3 storage level when first NH3 breakthrough occurs (circles). The determined linear sensitivities to NH3 storage of both RF signals are shown in (c), with Sf for fres (Equation (5)), and in (d) with SQ for Q0−1 (Equation (6)).
Sf = ΔfresmNH3
SQ = ΔQ0−1mNH3
The used calibration of the RF system to determine the current NH3 storage in real time by the RF signals and the catalyst temperature requires the empty state and the NH3 sensitivity. They are plotted as solid black curves in Figure 2.
Besides the RF calibration to determine the current NH3 storage on the catalyst surface, the desired NH3 storage degree as a function of catalyst temperature is the second necessary part to demonstrate the functionality and possible benefits of an RF-controlled SCR system. Therefore, this study investigates three different approaches of target NH3 storage to compare their influence on NOx conversion and NH3 slip under transient conditions, all illustrated in Figure 3. Based on the results of Ref. [20] under stationary conditions, we tested percentage gradations of the determined NH3 breakthrough loading (black) and of the ideal NH3 storage curve (red). Additionally, experiments with constant NH3 storage levels (example in grey) were also performed. In all experiments, the catalyst was prefilled in the beginning of the test cycle. Consequently, the influence of initial catalyst loading was excluded in this study.
The applied control approach is illustrated in Figure 4. The DEF injector uses a defined and constant urea dosing rate, i.e., defined dosing valve open periods and valve closed periods. The formed NH3 adsorbs on the SCR catalyst and changes its dielectric properties. The resonance behavior of the enclosing resonator changes and the VNA acquires the corresponding resonance spectrum (complex transmission S21). The latter is used to extract the resonance parameters, and together with the catalyst temperature (determined by thermocouples) and the calibration functions of Figure 2, the current amount of stored NH3 is calculated. Additionally, the temperature information is used to determine the current amount of stored NH3 target value, which is then simply compared to the amount of stored NH3 on the catalyst by a two-point controller, which starts and stops the urea dosing automatically.

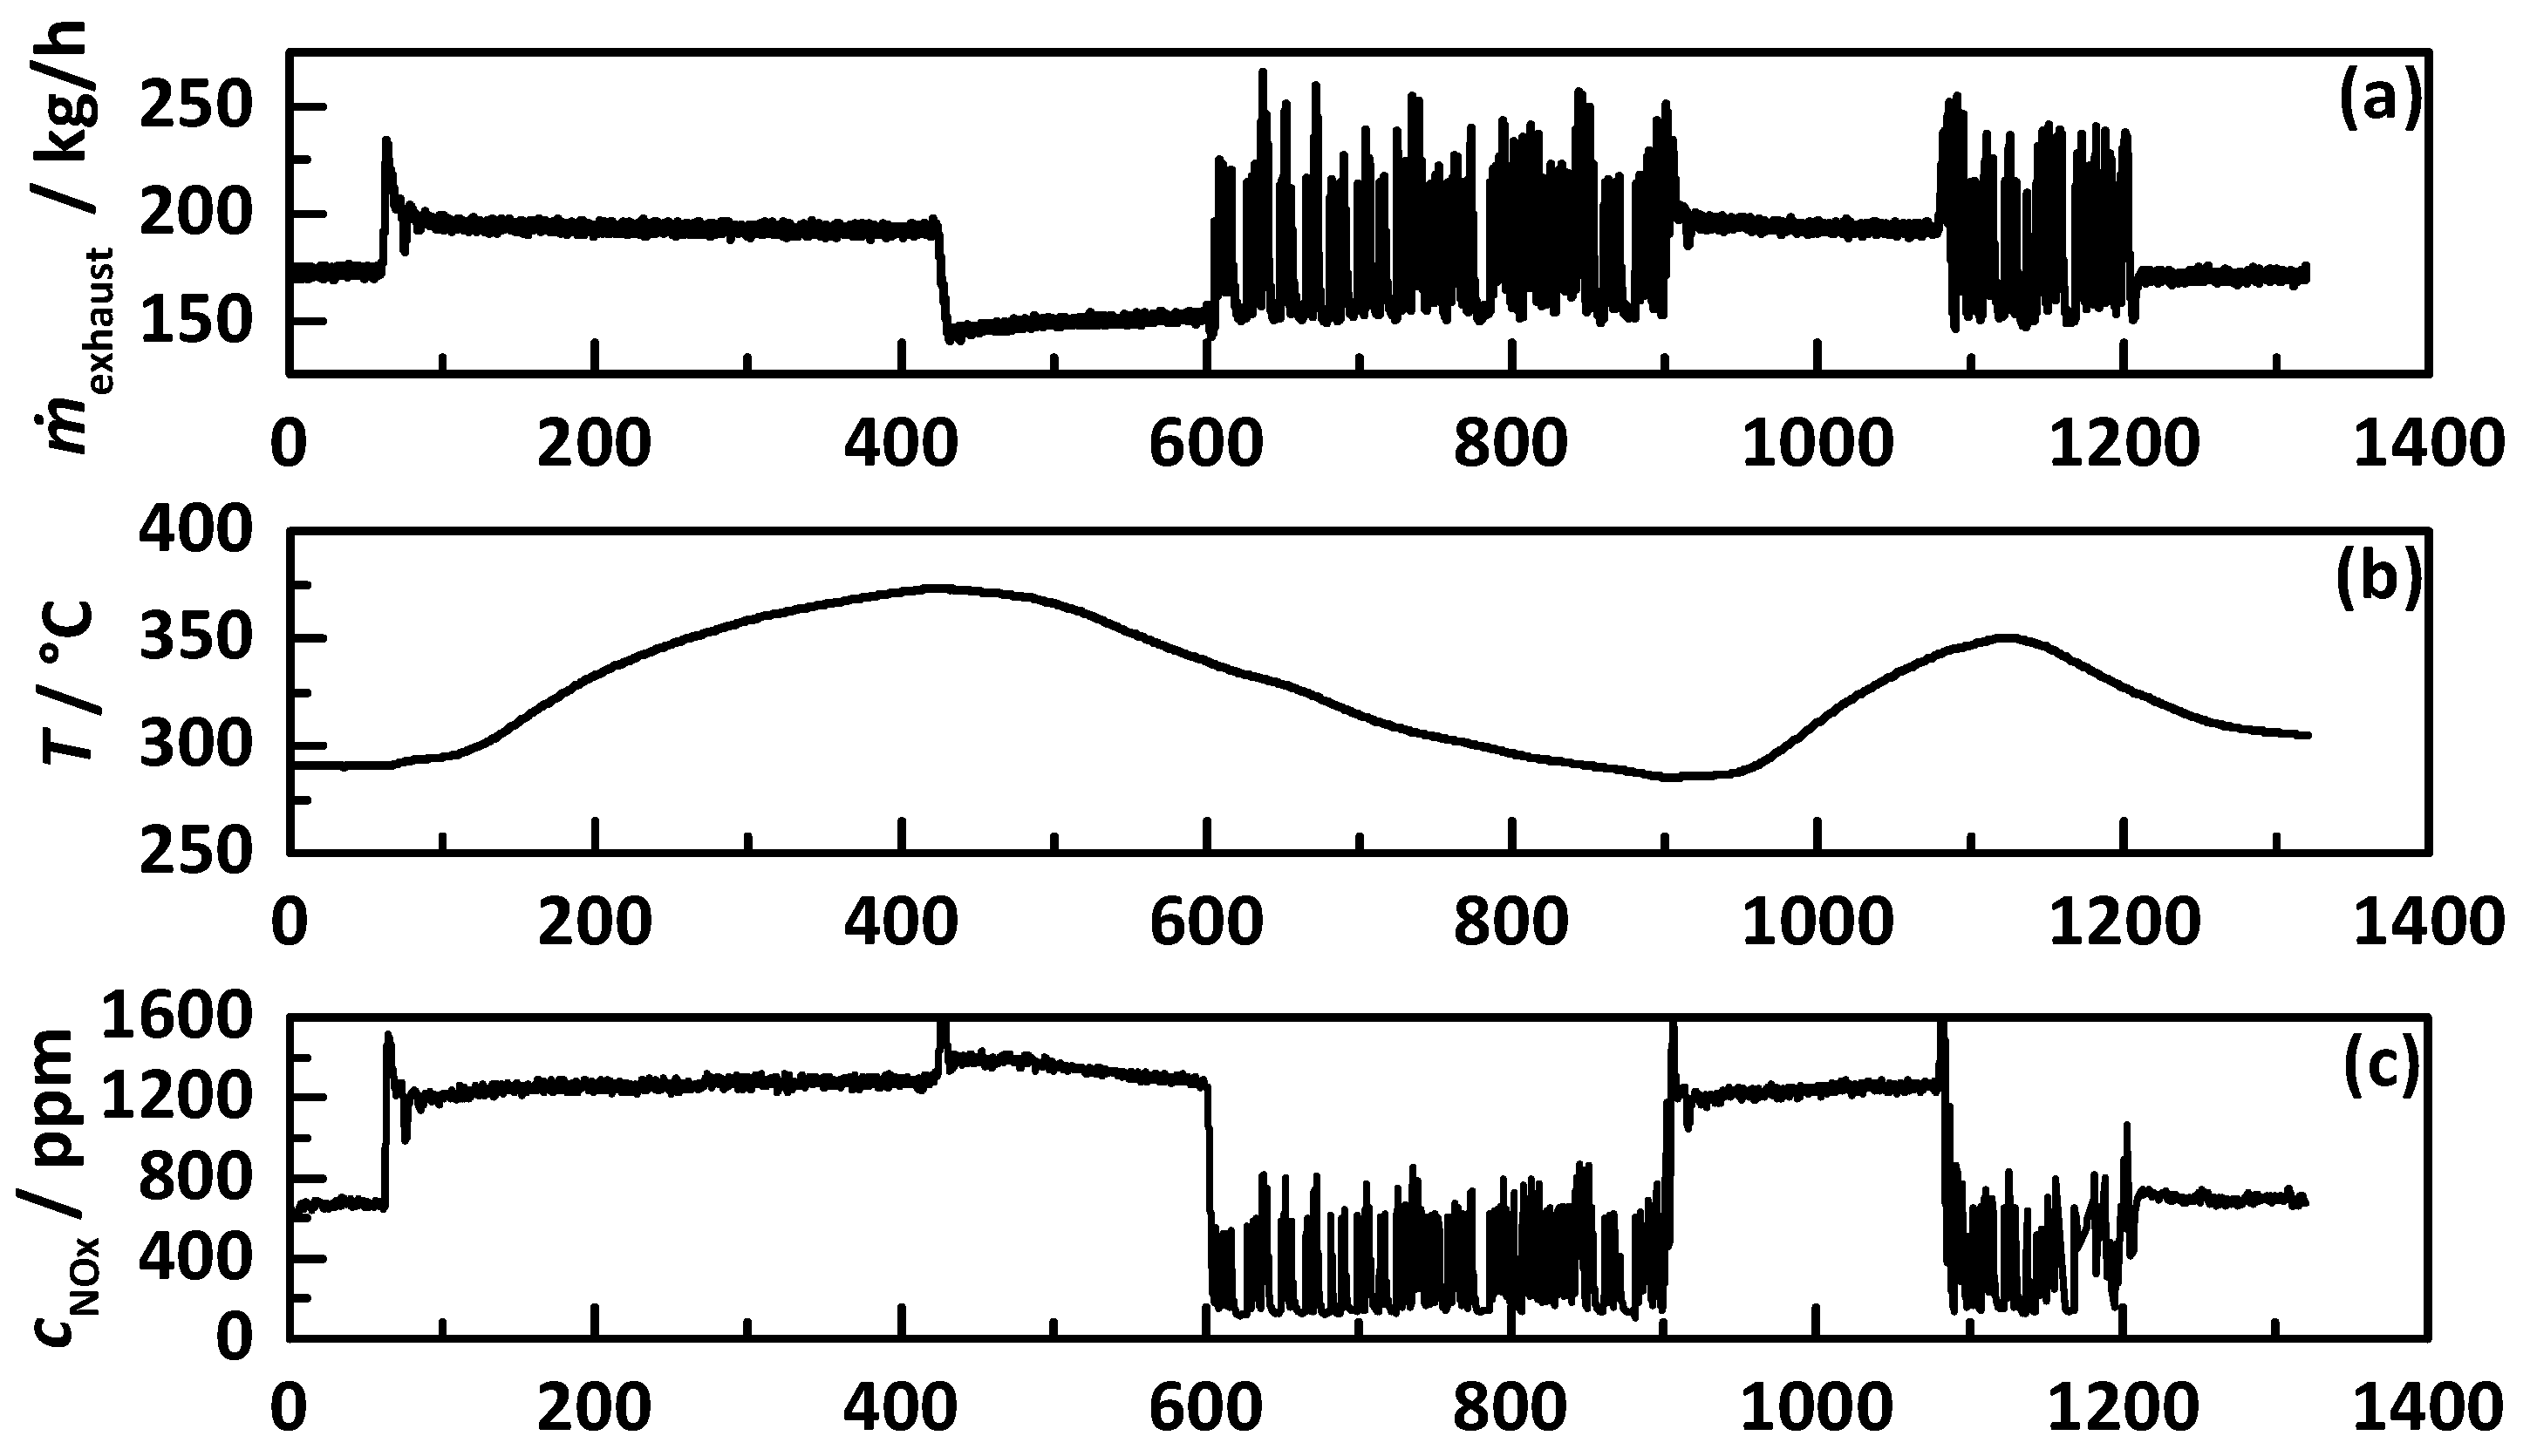
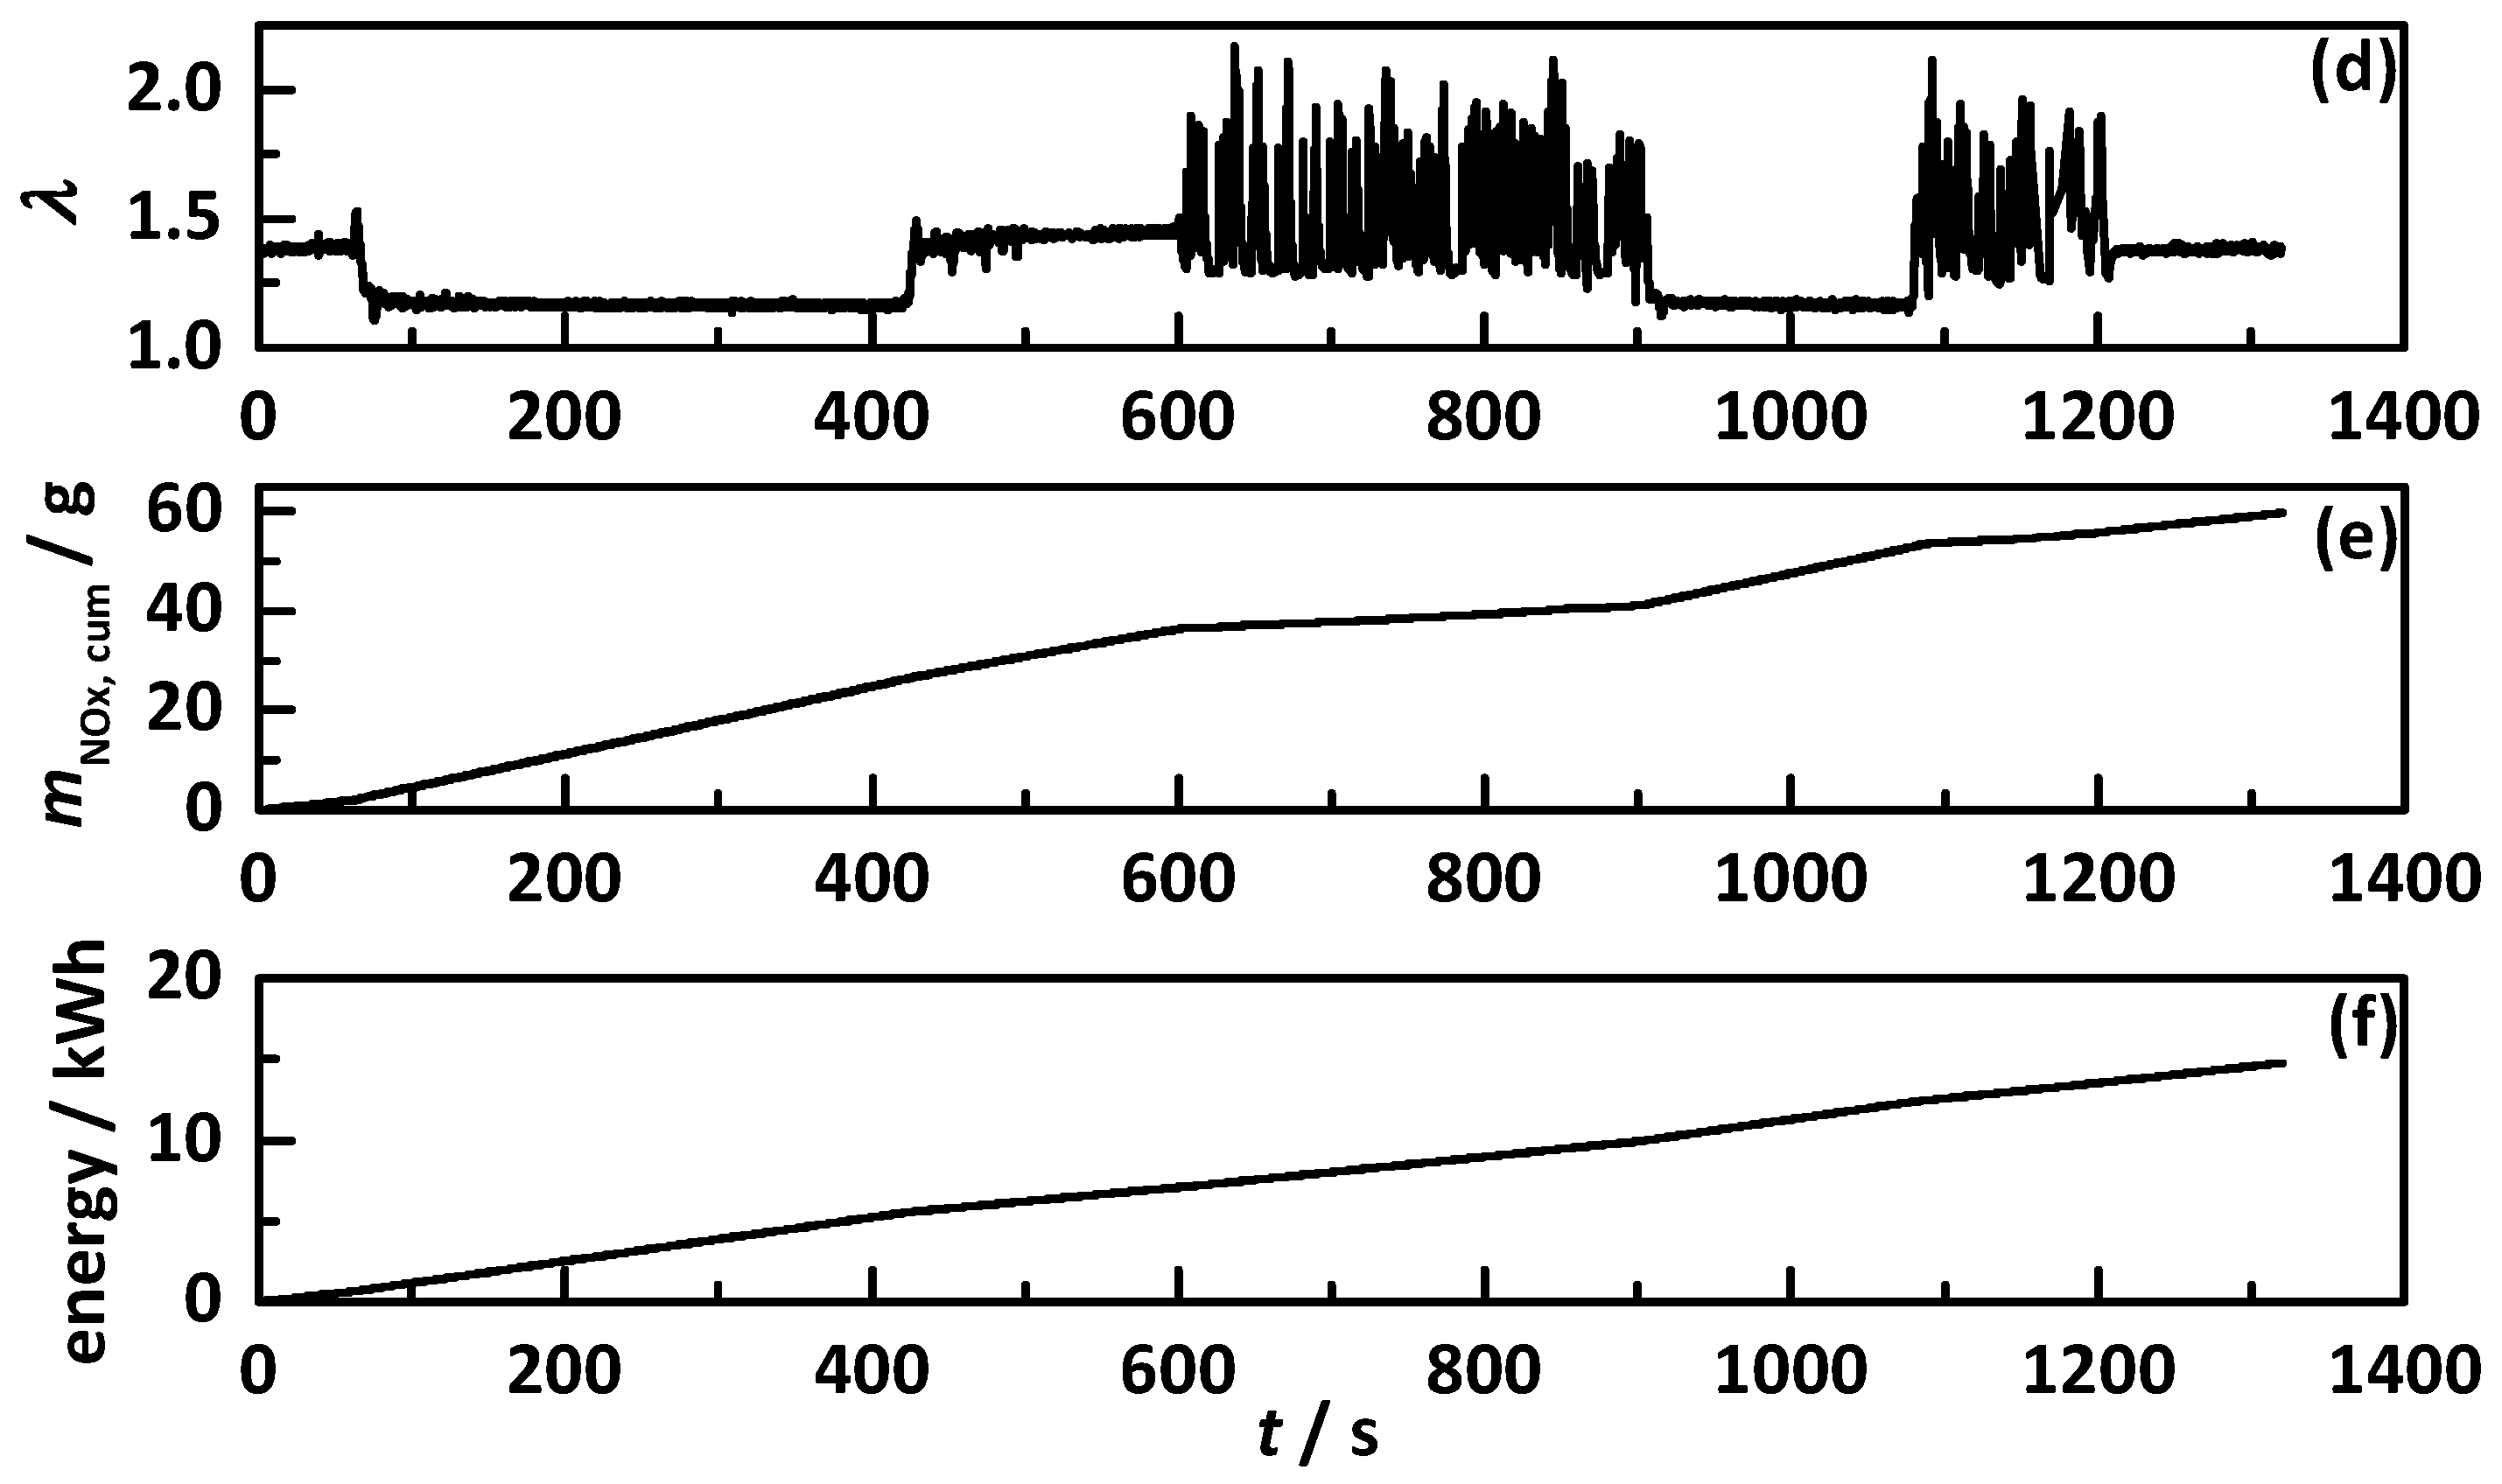
3.3. Transient Test Procedure

Since the available engine dynamometer setup was not able to drag the engine (fuel cut) and the adjusted exhaust pipe required medium and high loads to reach SCR active temperatures, we were not able to perform standard test cycles (NEDC, WLTC, or RDE) within this study. Instead, we used a self-defined test cycle similar to the WHSC (World Harmonized Stationary Cycle) for trucks with several jumps between different stationary operation points. The procedure of the 1320 s lasting test cycle is displayed in Figure 5, with (a) the exhaust gas mass flow exhaust, (b) the catalyst temperature, (c) the engine-out NOx emissions, (d) the lambda signal, (e) the cumulative emitted NOx mass, and (f) the consumed energy of the engine.
Within the test cycle, the catalyst temperature varies between 275 and 375 °C, with an exhaust mass flow of 150 up to 250 kg·h−1, and raw NOx emissions between 120 and 1500 ppm. Additionally, the already in Ref. [20] investigated operation point with continuously changing EGR rate, mirrored in changing NOx emissions and lambda (i.e., also varying humidity), was also part of the test cycle. The test procedure starts and ends with a catalyst temperature of ca. 280 °C. After a jump into full load, the catalyst heats up to the maximum temperature of ca. 375 °C within 300 s, followed by operation with medium loads and a slow cool down to ca. 275 °C. After another heat up phase in full load to ca. 350 °C, the catalyst reaches its start temperature again. Within the test cycle, the engine emits ca. 60 g NOx in total and consumes energy of ca. 14.8 kWh, leading to a normalized NOx emission of ca. 4000 mg/kWh.

4. Results and Discussion

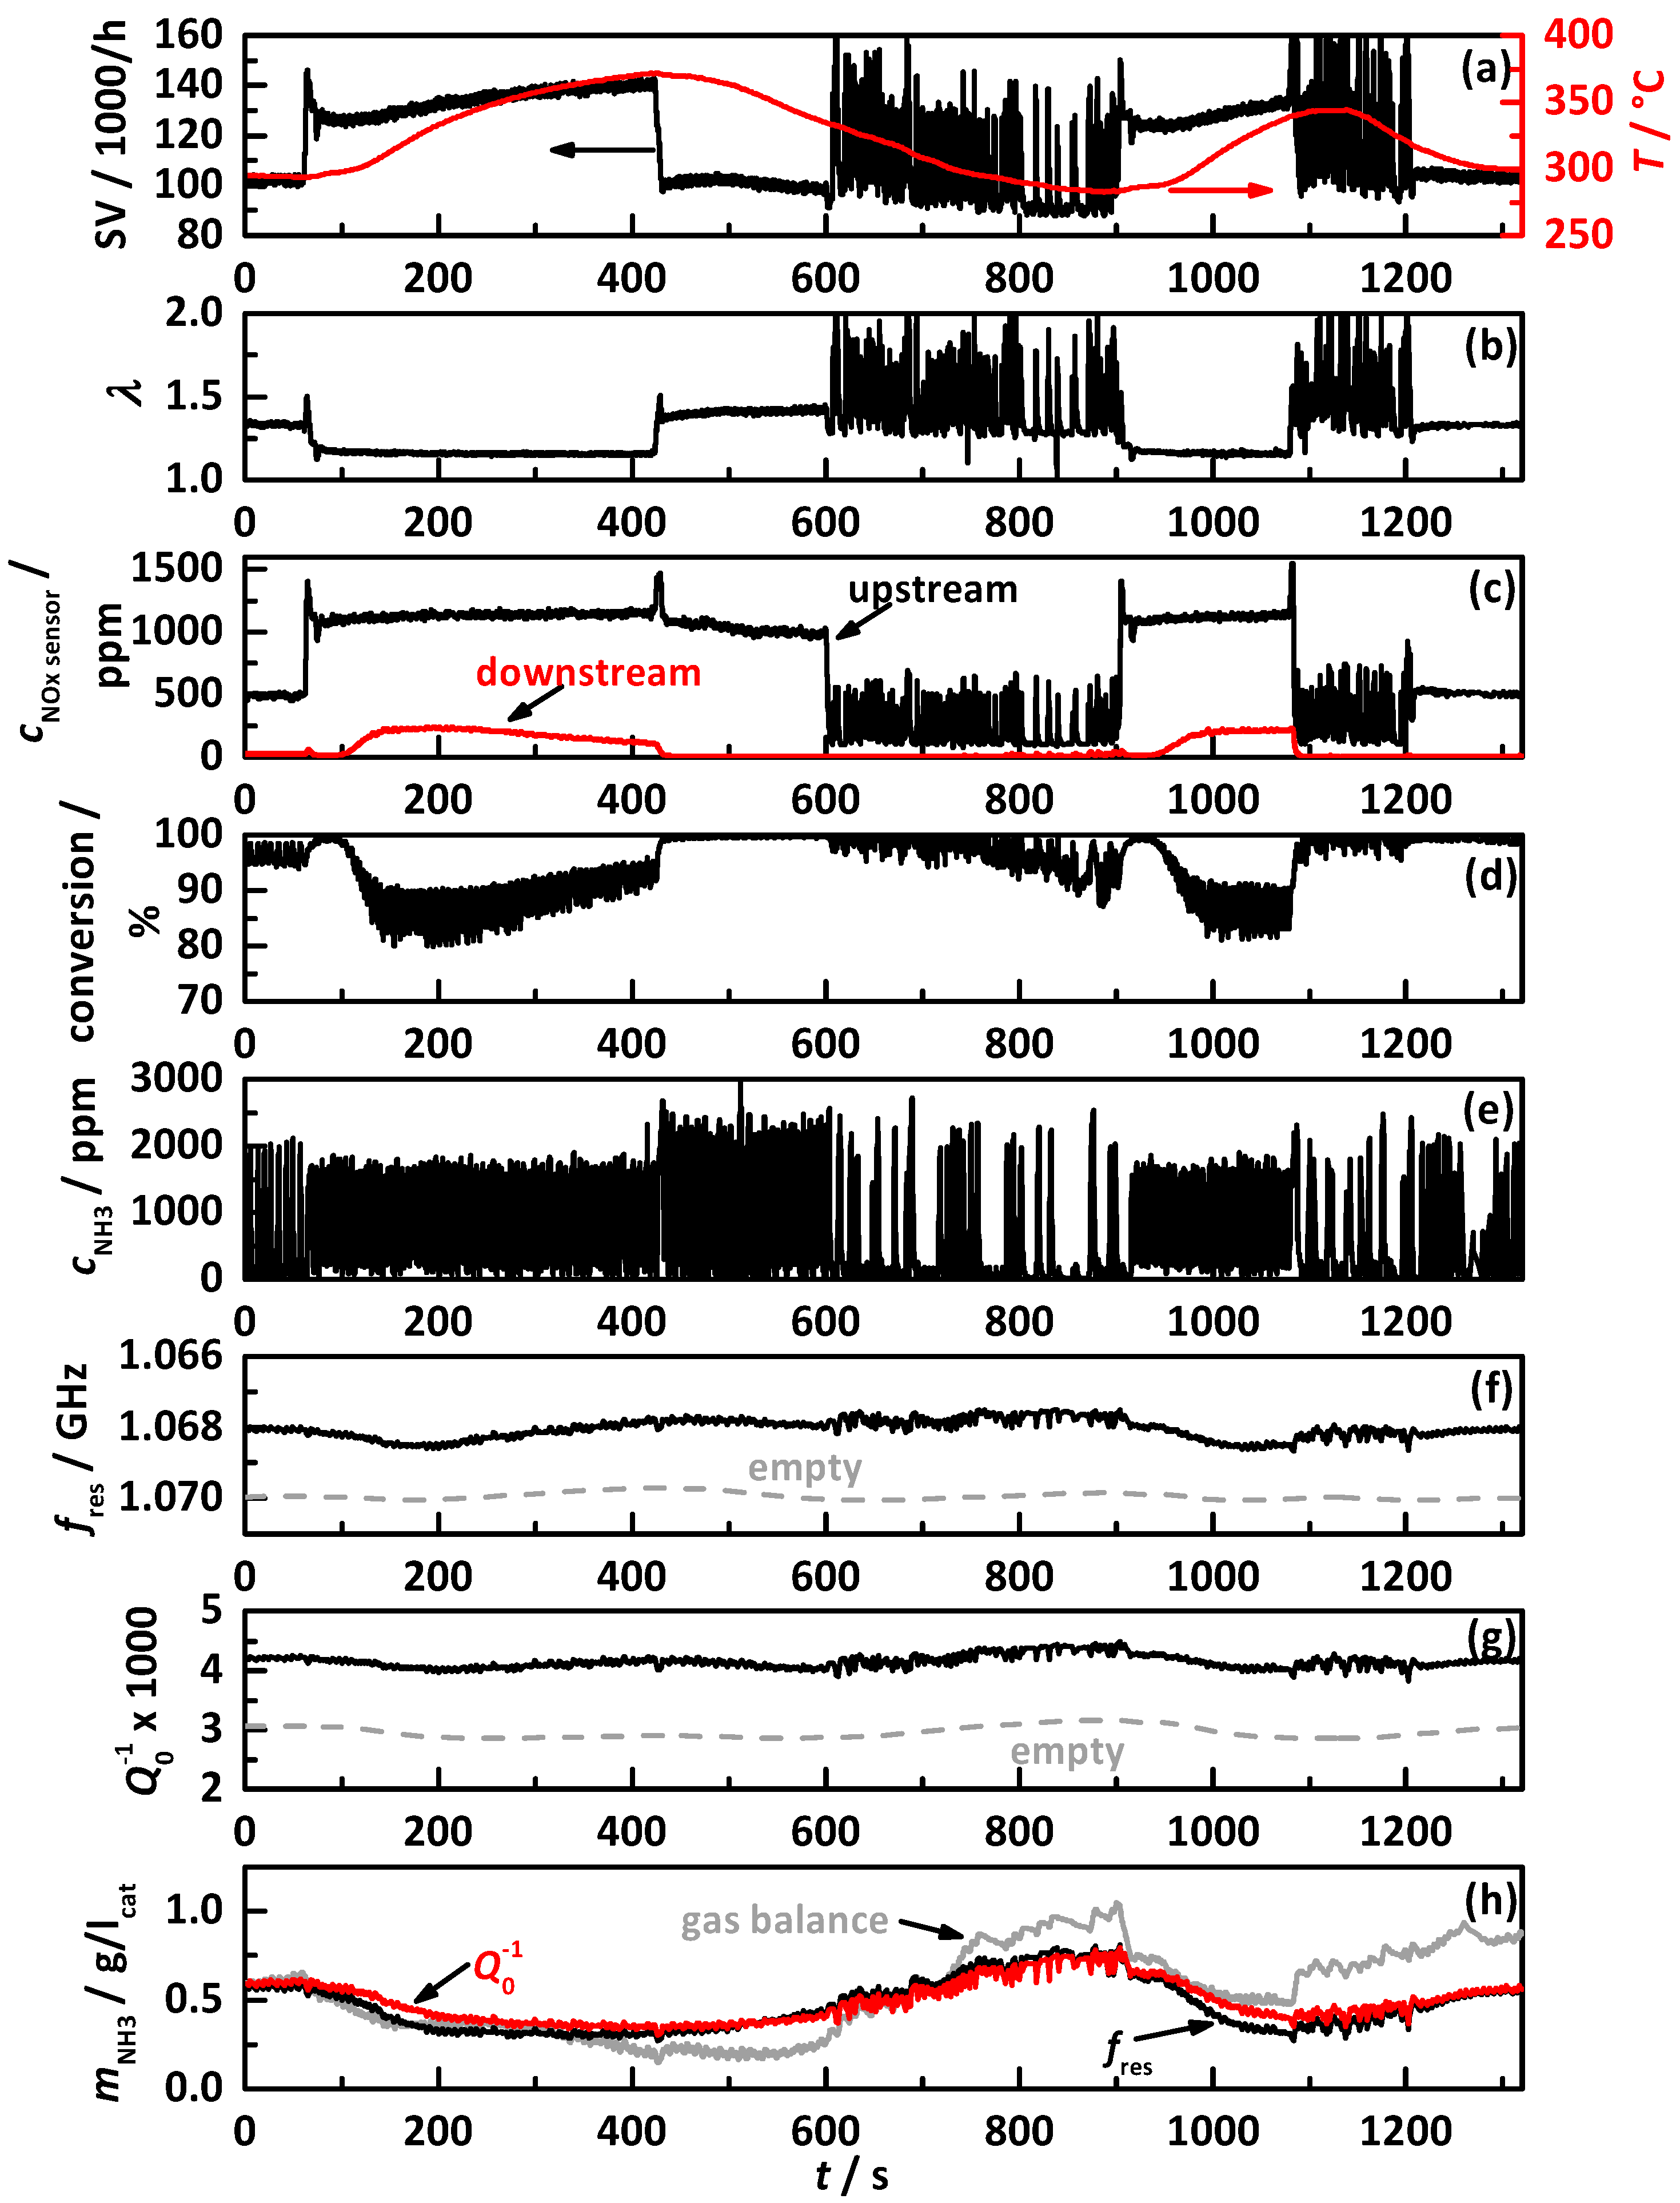
4.1. Analysis Procedure

The analysis procedure to interpret the catalyst performance and the influence of the selected NH3 storage approach is explained in the following. As an example, Figure 6 shows one experimental run with an NH3 storage target loading of 60% of the ideal NH3 storage curve controlled by Q0−1, with (a) the space velocity (black) and the catalyst temperature (red); (b) the lambda signal of the NOx sensor upstream of the DEF dosing; (c) the signals of the NOx sensors upstream of the DEF dosing (black) and downstream of the catalyst (red); (d) the thereby calculated apparent NOx conversion (NH3 slip causes a decrease in apparent NOx conversion and then the latter does not represent the real NOx conversion); (e) the dosed NH3 concentration calculated by the NOx sensor signals up- and downstream of the DEF dosing; (f) fres; and (g) Q0−1 (black) with the calculated (by the calibration function) corresponding value for the NH3-free state (grey dashed); and (h) the NH3 loading on the catalyst determines by fres (black), Q0−1 (red, control value), and calculated by gas balance (grey).
At the beginning of the test cycle with ca. 500 ppm NOx emissions, the catalyst converts almost fully. By switching into full load with over 1,000 ppm NOx and a space velocity of ca. 130,000 h−1, a short increase in conversion efficiency is visible, followed by an increase of the downstream NOx sensor signal starting at second 100, which reaches its maximum of ca. 220 ppm around second 200. Until second 100, the catalyst temperature remained almost constant. So, this effect might by explained with the increased space velocity and resulting shift in reaction equilibrium, respectively, a shift of the reaction front on the catalyst surface closer to its end. With increasing catalyst temperature until second 430, a continuous decrease of downstream NOx sensor signal is visible. This effect fits with the previous explanation, since the reaction front shifts more of the front of the catalyst with the thermal activated reaction rates of the SCR reactions increase. With the subsequent change to a smaller space velocity with almost the same NOx emissions, the NOx sensor indicates instantaneously full conversion. This behavior is also continued with further decreasing temperature after the change into the operation point, with the continuously changing EGR rate around second 600. From around second 800 on, when the catalyst temperature drops below 300 °C, first NOx peaks are visible in the downstream sensor signal. The second heat-up and cool-down from second 900 on shows almost identical behavior. The dosed NH3 in (e) mirrors with the timely period between the dosing peaks the higher and lower required amount of NH3 corresponding to the current NOx emission.
Within the whole test cycle, both RF signals show the almost identical course, again with the already-reported in increased uncertainty with continuously changing EGR rate Ref. [20]. The values for the NH3-free state are calculated by the calibration functions and the catalyst temperature. They mirror the latter. In addition, the thereby determined amount of stored NH3 is almost identical for both RF signals. The amount of stored NH3, as calculated by gas balance, suffers from increasing uncertainties especially during changing EGR rates, but generally confirms the by the RF system determined values. The NH3 loading within this test with control on 60% of the ideal storage curve leads to minimum NH3 storage of 0.3 g/lcat at 375 °C and a maximum storage of 0.7 g/lcat. This experiment demonstrates the basic functionality of the RF approach to control the SCR catalyst on a temperature-dependent NH3 storage target curve.
Since the engine setup is limited to the signals of the NOx sensors without the possibility of directly differentiating between NOx and NH3, a comparative analysis of the experiments with different gradations of the target storage curves was performed to interpret the signal of the downstream NOx sensor. This is shown in Figure 7 for the experiments with the percentage gradation of the ideal NH3 storage curve controlled by Q0−1, with (a) the engine out NOx emission (black) and catalyst temperature (red) and (b) the downstream NOx sensor signals for a control of 20 to 140% of the ideal storage curve. It can be seen within both heat-up phases that the downstream NOx sensor signal decreases with increasing NH3 storage until a value 120% of the ideal storage curve (blue). The signal increases again with 140% (green). The sensor signal of 20% shows, in contrast to the higher NH3 loadings, very noisy behavior. This can be attributed to the urea dosing pulses that occur because of the very low surface coverage. In contrast, the 140% storage (green) shows, even at the lower temperatures, a high NOx sensor signal as a proof for too high NH3 loading and resulting high NH3 slip.
To also prove whether lower NH3 storage levels than 140% lead to NH3 slip, characteristic points of the test cycle were analyzed. For this purpose, the stationary conditions in the beginning of the tests cycle were used including the jump into the full load at second 60 and the change of the operation point at the highest temperature within the cycle at second 420. Due to the strong increase in space velocity at the first characteristic point, a too high NH3 storage, including the weaker bonded NH3, would be pushed out of the catalyst and detected by the NOx sensor. An NH3 breakthrough at the second characteristic point (around second 420) at the maximum catalyst temperature would be caused by broadening and shifting of the reaction and NH3 storage front to the end of the catalyst. When the space velocity drops instantaneously, the reaction front moves quickly closer to the front of the catalyst. However, the remaining NH3 in the end would still desorb and cause NH3 slip that can be seen in the downstream NOx sensor signal, since the temperature remains almost the same.
These two characteristic points of the test cycle are displayed as a detail view of the downstream NOx sensor signals of Figure 7b for 80, 100, and 120% of the ideal storage curve in Figure 8, with the first characteristic point in (a) and the second in (b). It is clearly visible, for the first point, that the NOx conversion increases, i.e., the sensor signal decreases from 80% (black) to 100% (red). The increase of sensor signal for 120% (blue) can be assigned easily to a constant NH3 slip. Still, even the control on 100% of the ideal storage curve leads to ca. 15 ppm NOx downstream of the catalyst, which might be explained as the maximum possible conversion for the used conditions with high raw NOx emissions and a comparable small catalyst volume, i.e., a very high space velocity of 130,000 h−1. A closer view on the second characteristic point shows that the signals of 80 and 100% behave almost identically with both below 10 ppm after the jump to medium load. The control on 120% leads to a higher conversion at full load but after the change of the operation point, and a clear increase in the NOx sensor signal is visible and proves that 120% is already causing NH3 slip.

4.2. Comparison of the Influence of Different NH3 Storage Approaches on Catalyst Performance

With the above-described procedure, all performed test cycles with control by fres and Q0−1 on the storage approaches were analyzed, as illustrated in Figure 3. The following discussion is based on the apparent cumulative and normalized NOx mass emission as determined by the downstream NOx sensor and on the resulting apparent NOx conversion efficiency within the test cycle. In addition, the experiments with NH3 slip were identified and the best storage level without NH3 slip for all three storage approaches was determined.

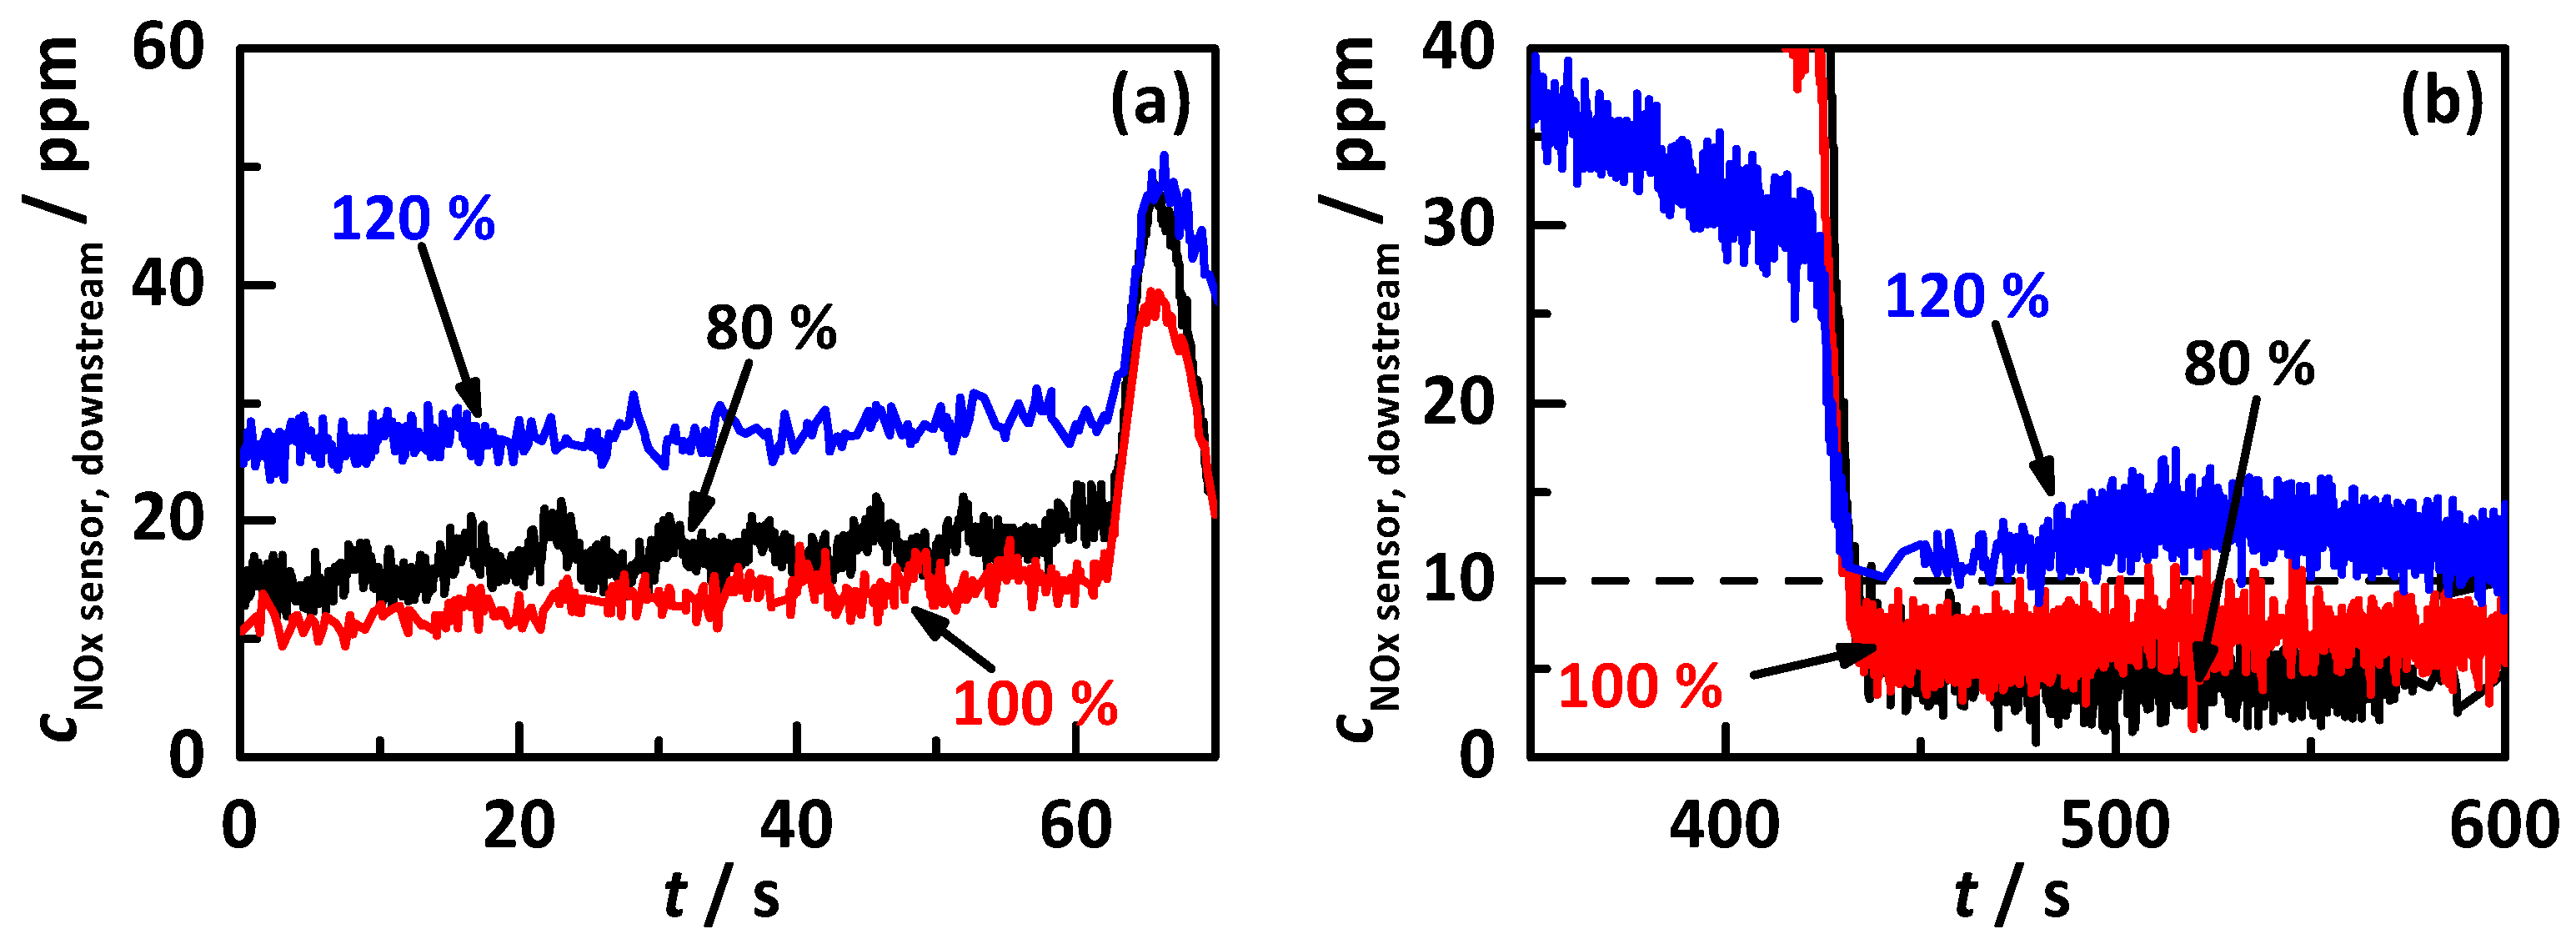
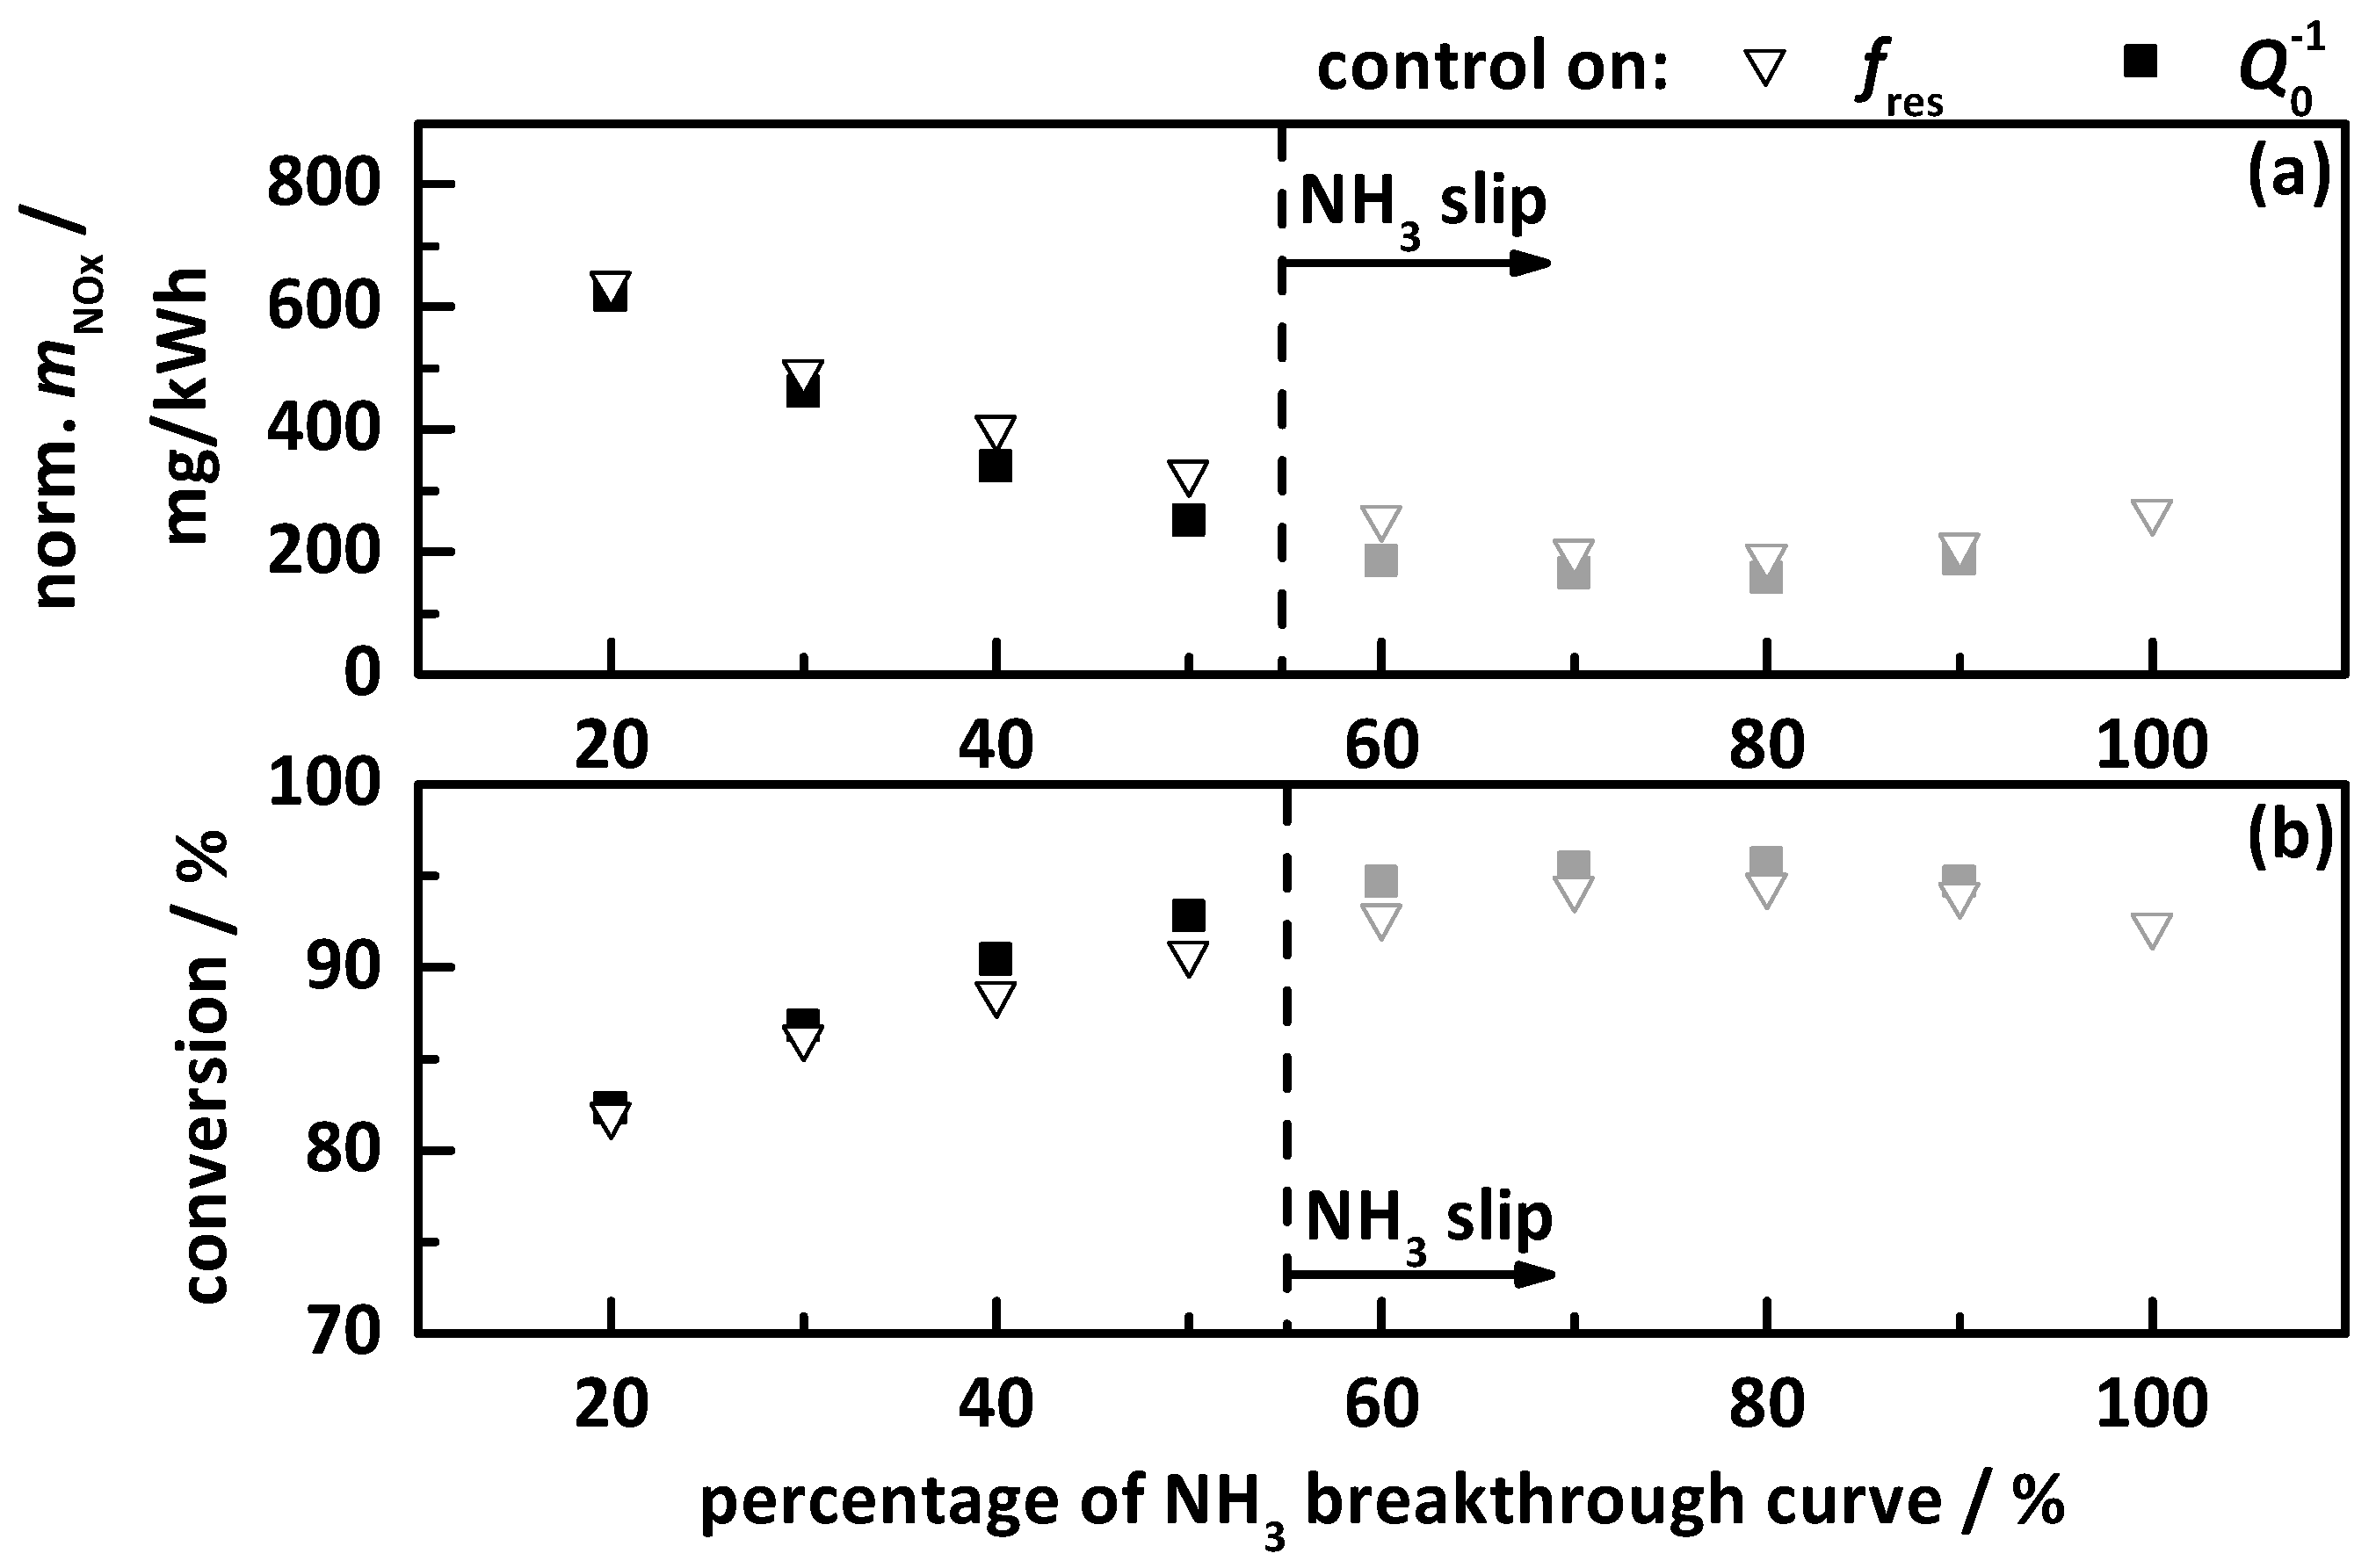
4.2.1. Control on a Percentage Gradation of the NH3 Breakthrough Curve

The results of the transient study for the control on a percentage gradation of the NH3 breakthrough curve (black curve in Figure 3) with 10% steps are displayed in Figure 9. This is for the control on fres (hollow triangles) and on Q0−1 (filled squares), with (a) the apparent emitted and normalized NOx mass in mg/kWh as determined by the downstream NOx sensor, and (b) the thereby calculated apparent NOx conversion within the test cycle. All the experiments, when NH3 slip was determined, are marked grey and located right to the dashed line.
In general, one can clearly see that the control on fres and Q0−1 show almost identical results. A control on 20% of the NH3 breakthrough curve already leads to reduced NOx emission of 600 mg/kWh, which corresponds to a total NOx conversion of over 80%. With increasing NH3 storage, the emitted NOx decreases continuously, until at 80% of the NH3 breakthrough curve, the lowest apparent NOx emission of 200 mg/kWh, respectively, the highest apparent NOx conversion of 95%, is reached. With further increased NH3 dosing, the apparent NOx conversion decreases again as more and more NH3 slips. The analysis of the characteristic points within the cycle showed that already 60% of the breakthrough curve led to NH3 slip. This can be explained by the fact that the breakthrough curve only represents the storage when first breakthrough appears after the catalyst (that was empty before) was filled by a continuous NH3 dosing rate. In the transient tests, continuous dosing a specific storage value is applied for a longer time and NH3 can migrate to the end of the catalyst. This leads much earlier to a slip than applying the 100% curve. Therefore, the maximum achieved conversion efficiency without NH3 slip was only 90% for 50% of the breakthrough curve. With this storage control approach, the catalyst seems not to use its full potential.

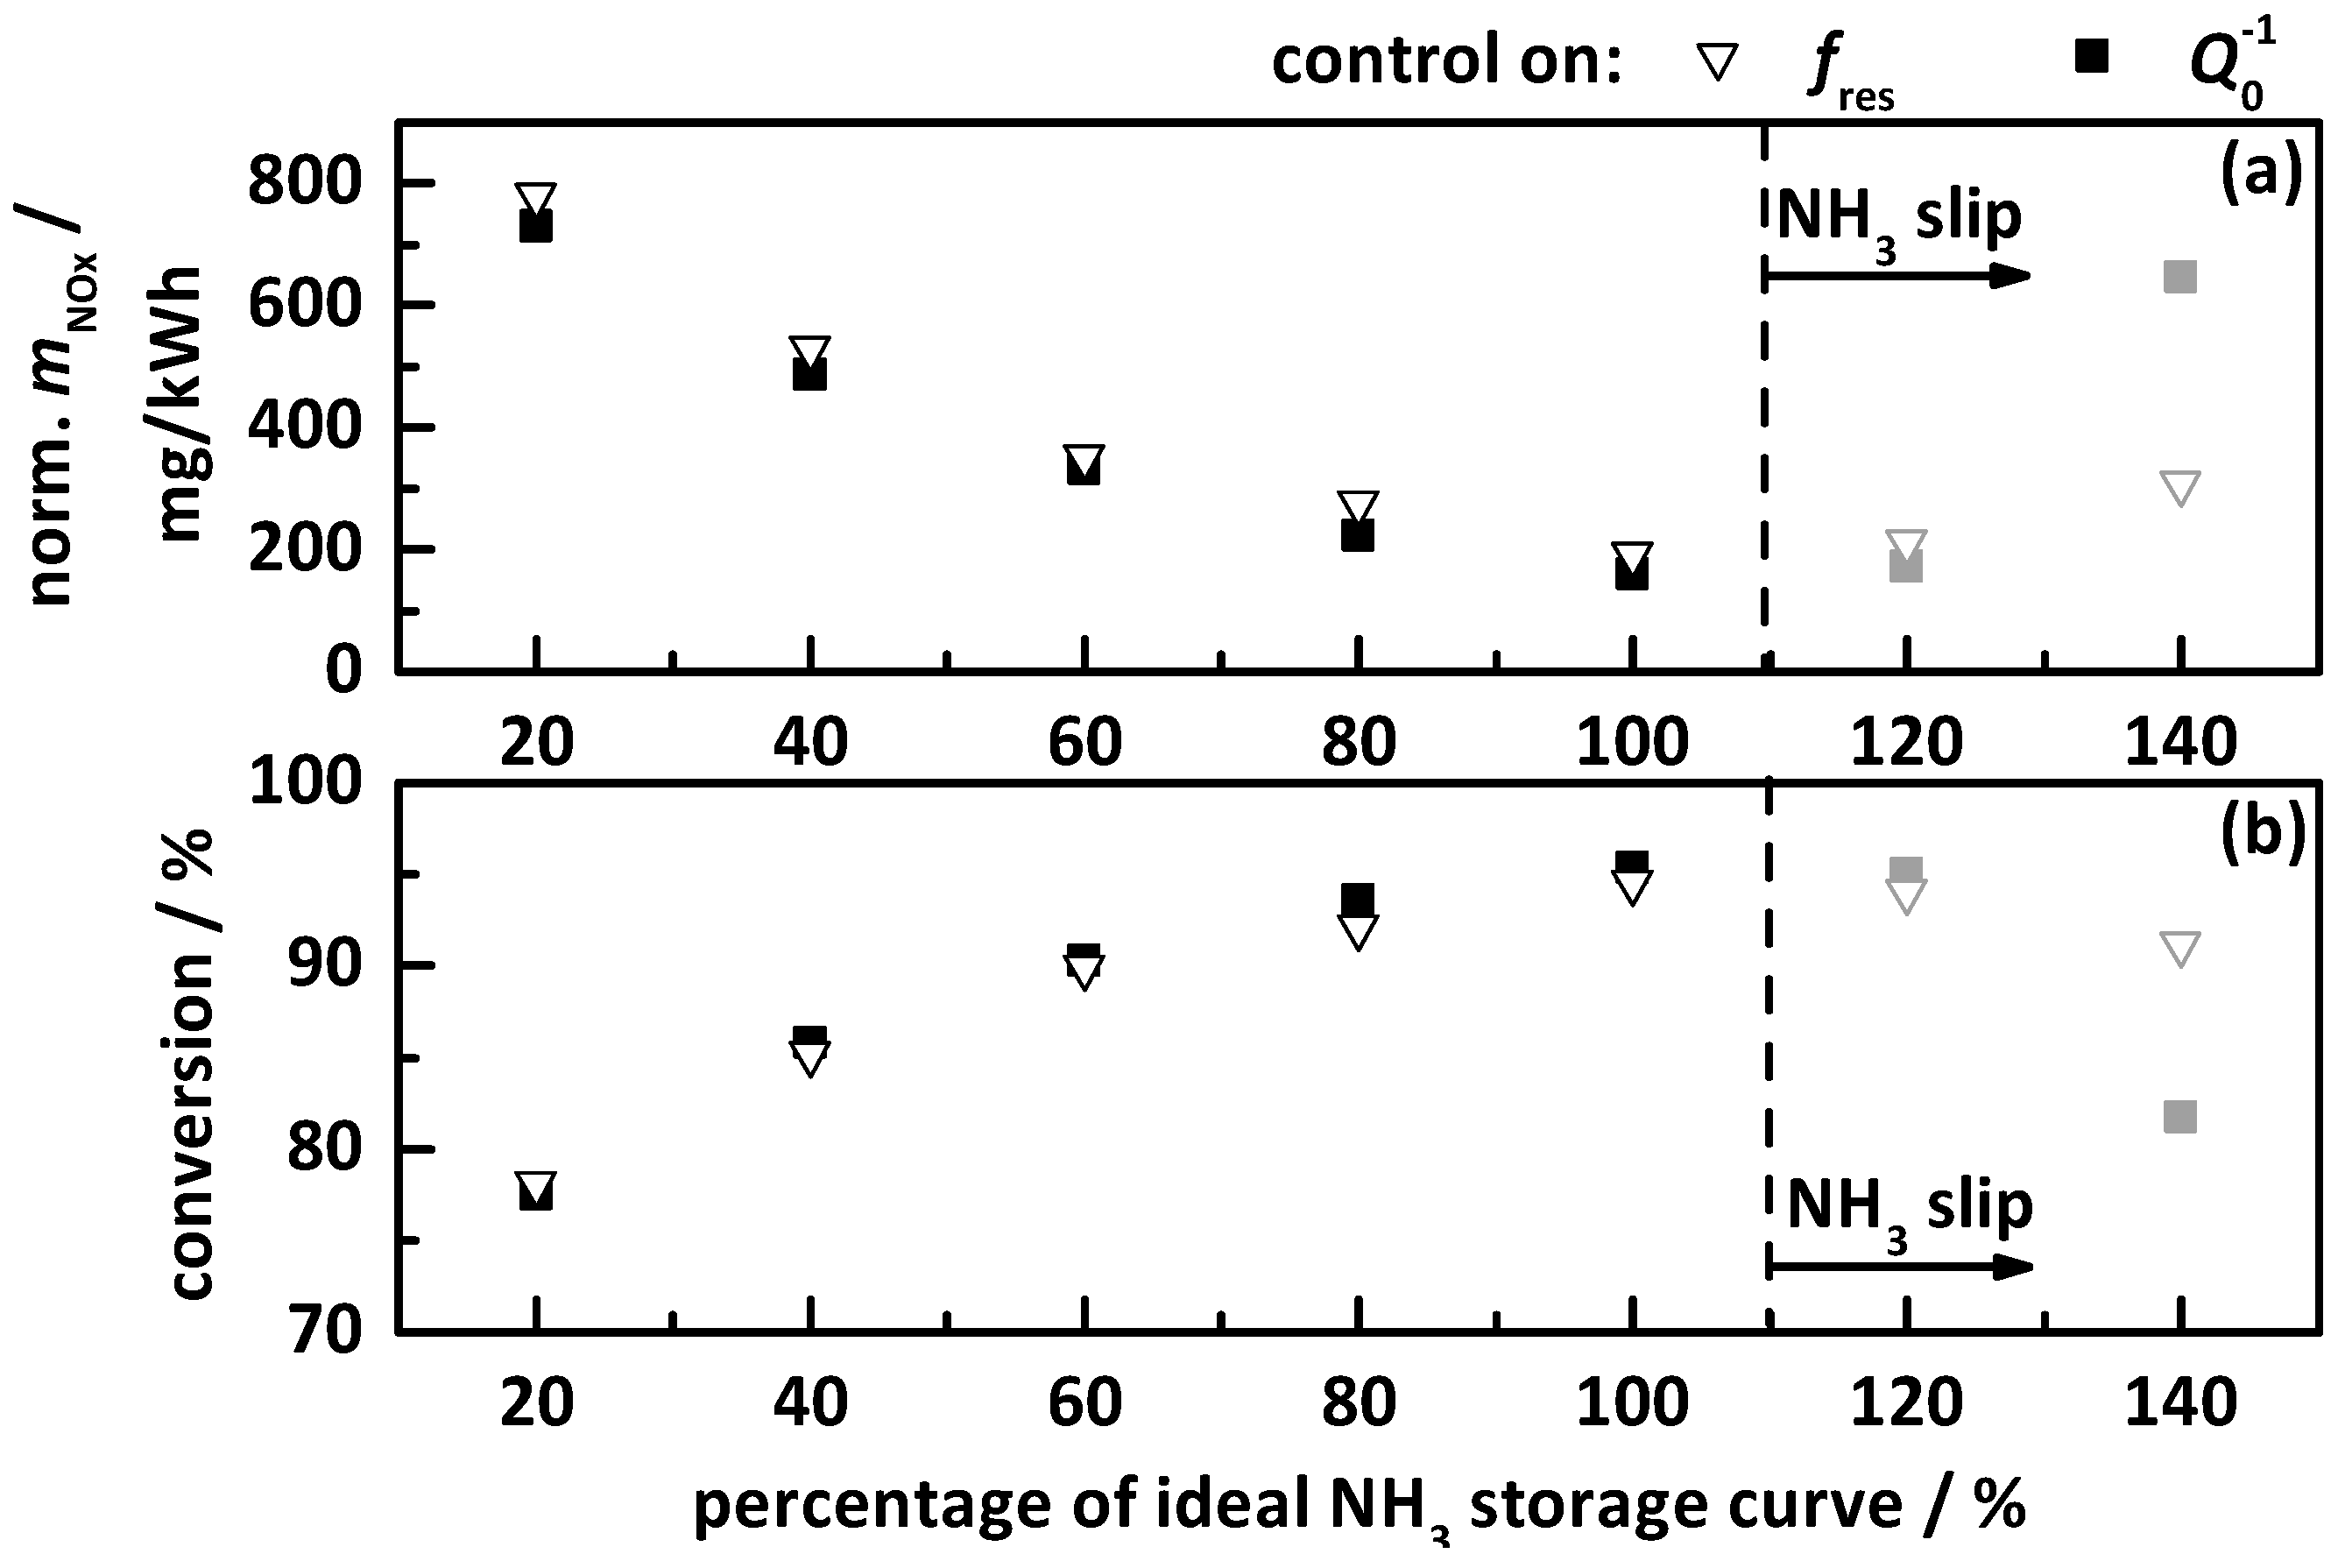
4.2.2. Control on a Percentage of the Ideal Storage Curve

The second tested control approach was discussed in detail in the previous section in control on a percentage gradation of the ideal storage curve with 20% steps (red curve in Figure 3). The results are displayed in Figure 10 for the control on fres (hollow triangles) and Q0−1 (filled squares) with (a) the apparent emitted and normalized NOx mass in mg/kWh, as determined by the downstream NOx sensor, and (b) the calculated apparent total NOx conversion. NH3 slip is marked with grey and placed right of the dashed line. Again, fres and Q0−1 led to almost identical results. The lowest tested storage of 20% led to NOx conversion efficiency below 80%. At this point, it is important to mention that the ideal NH3 storage curve is always below the NH3 breakthrough curve (see Figure 3), which represents a lower storage for the same percentage value, also resulting in lower NOx conversion due to lower NH3 surface coverage. As with the breakthrough curve, the conversion efficiency increases with NH3 storage level until a maximum at 100 and 120% is visible. With further increase to 140%, a drop in the apparent conversion efficiency can be seen. The maximum achieved apparent conversion is ca. 95%, which corresponds to ca. 200 mg/kWh. The NH3 slip analysis showed first slip at 120% and confirmed the in Ref. [20] under stationary conditions determined ideal NH3 storage curve also under transient conditions.
That this storage curve shows better results than the NH3 breakthrough curve might be explained by the more reduced storage at higher temperatures (compare Figure 3). Due to the better kinetics of the SCR reactions in the upper temperature range, especially with variable speeds and loads as well as non-constant raw NOx emissions and space velocities, a lower surface coverage is required and too high storage yields NH3 slip. This demonstrates that the RF-controlled SCR system, together with the right NH3 storage target curve, is able to operate the catalyst with maximum NOx conversion efficiency by avoiding NH3 slip. A bigger catalyst volume in conjunction with test cycles with more realistic conditions (e.g., lower engine loads, lower NOx raw emissions, and especially more realistic space velocities) will most likely cause even better results.

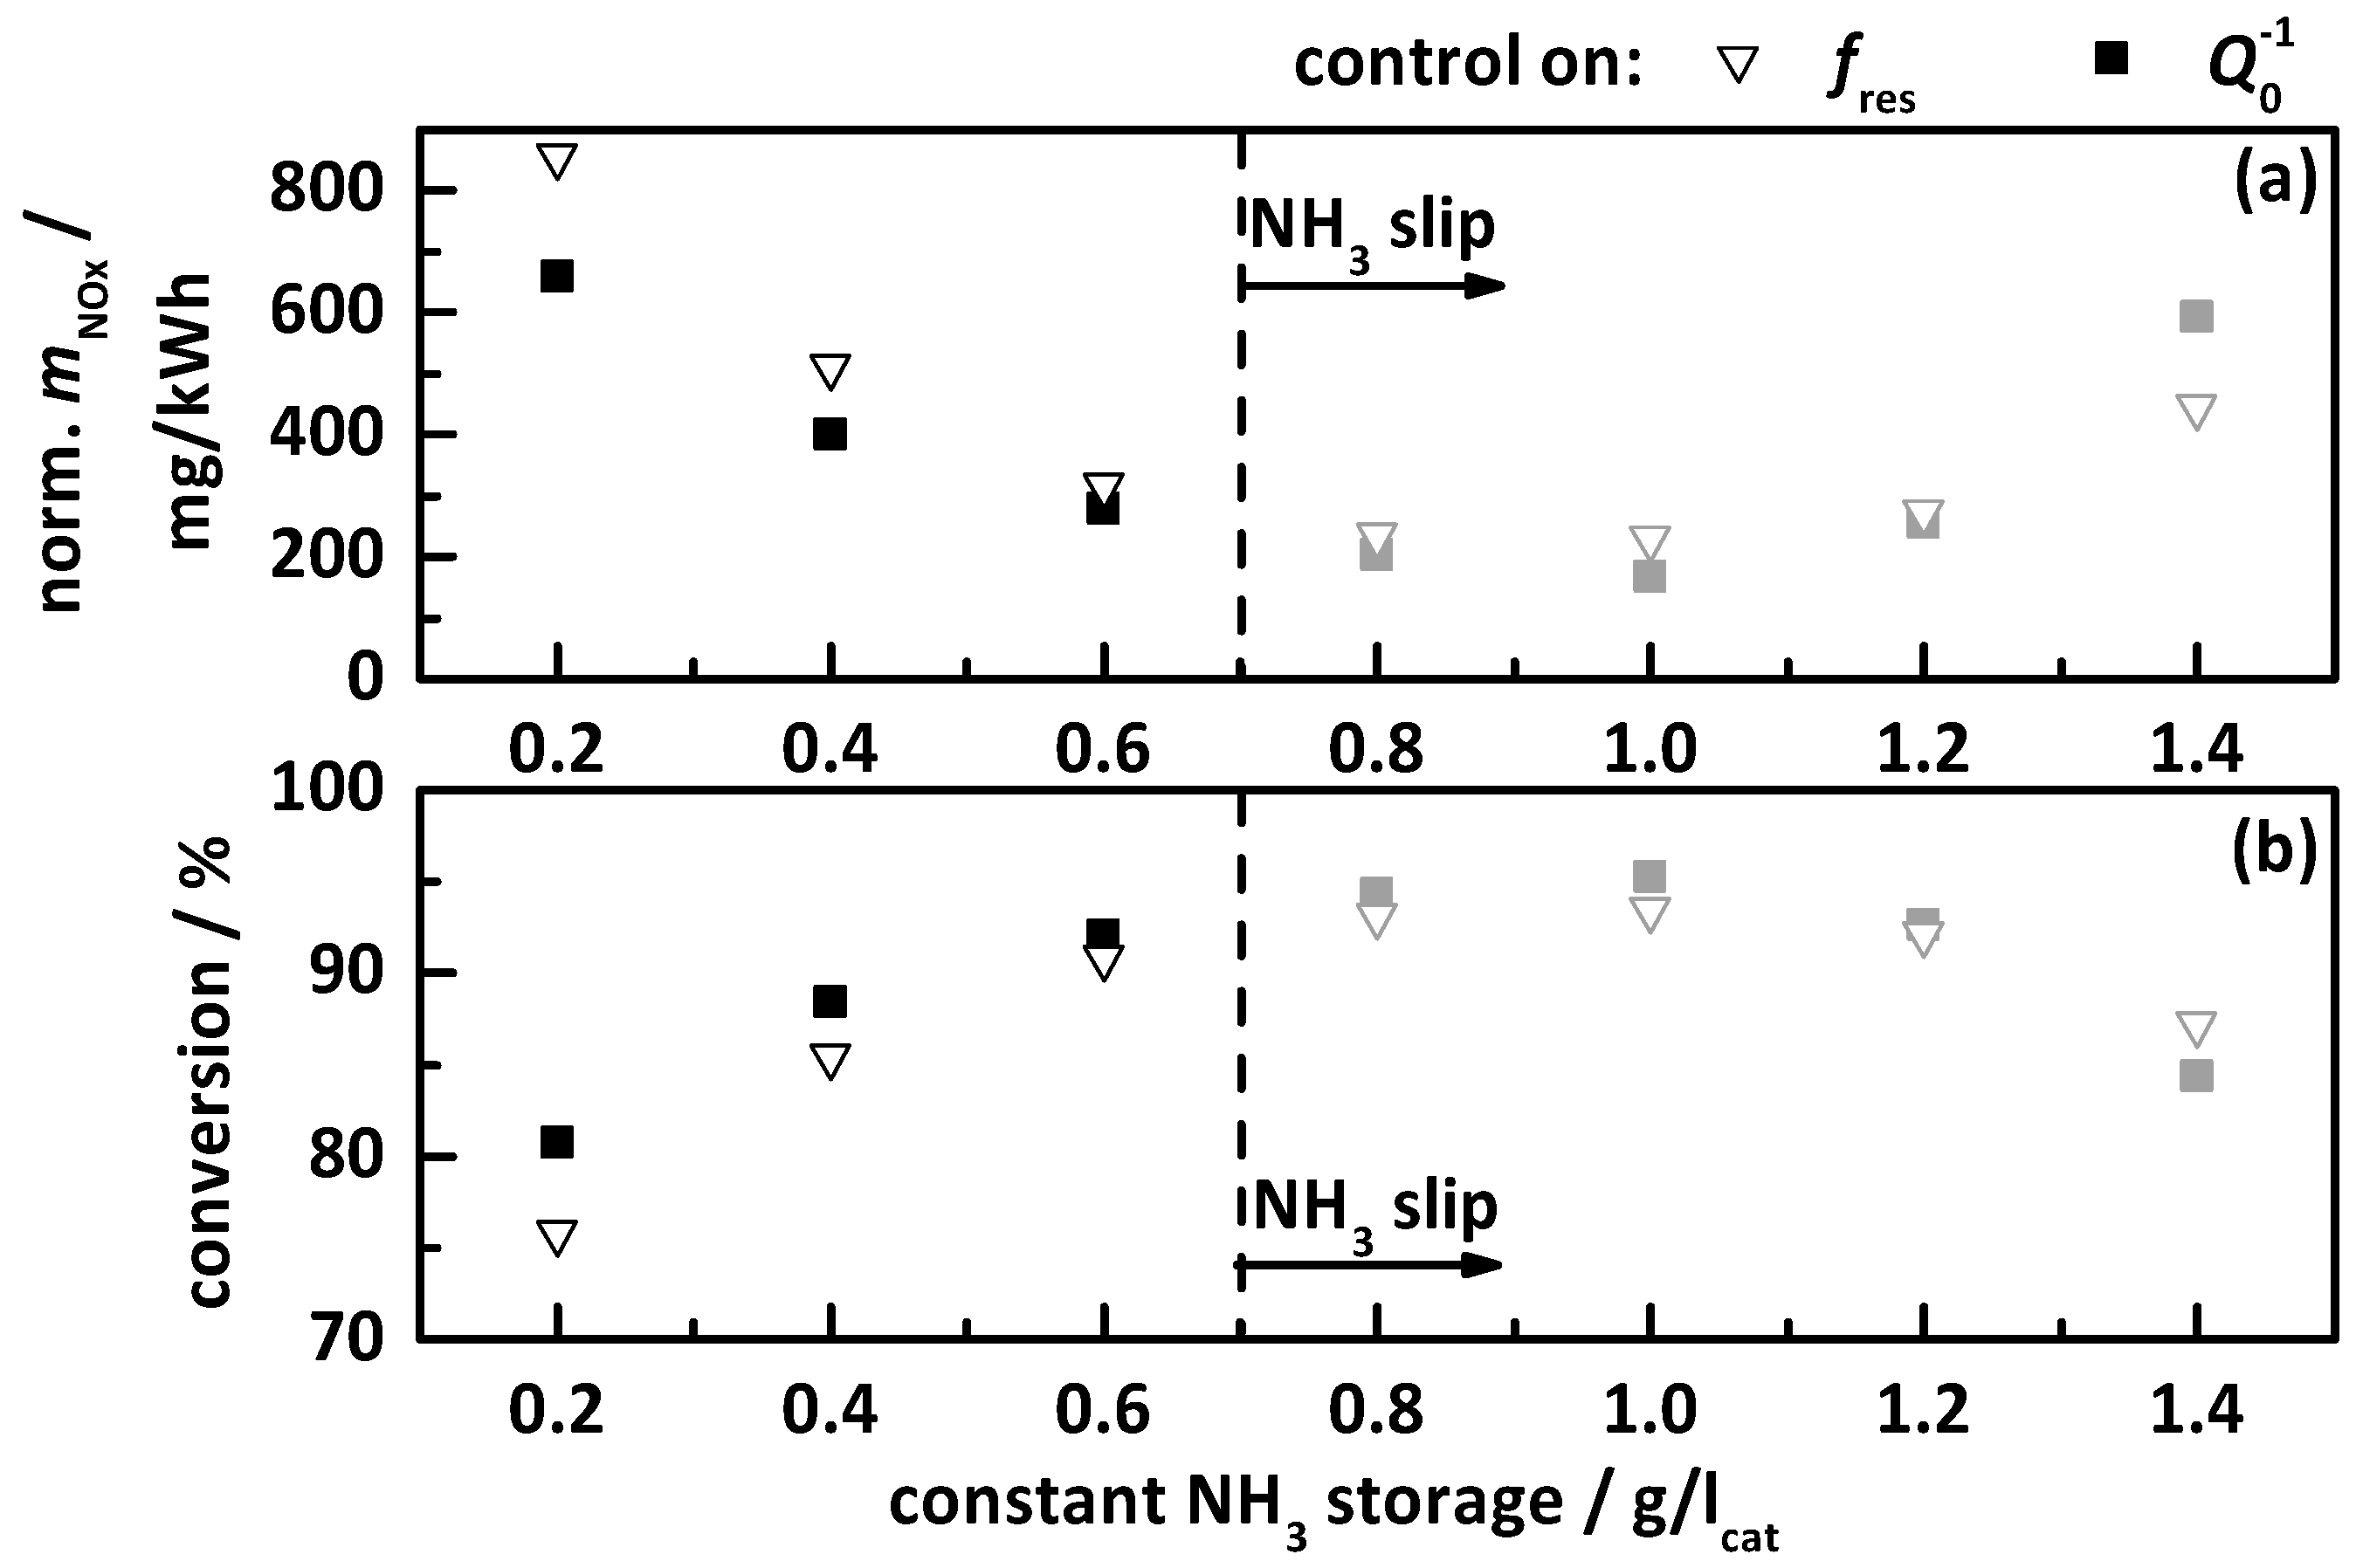
4.2.3. Control on a Constant Storage Value

The last tested approach was a control on a constant storage value between 0.2 and 1.4 g/lcat with steps of 0.2 g/lcat (exemplarily shown as grey curve in Figure 3). The test results are displayed as analog to the breakthrough and ideal storage curves in Figure 11. There are deviations visible between the test cycles controlled on fres and Q0−1, especially at highest and lowest NH3 storage levels. With the lowest observed constant amount of stored NH3 of 0.2 g/lcat, a maximum conversion efficiency of ca. 75 to 80% was achieved. Corresponding to the other control approaches, the apparent NOx conversion efficiency based on the downstream NOx sensor signal increases with NH3 storage, reaching its maximum at 1.0 g/lcat. A further increased storage level leads again to a decrease in apparent NOx conversion. But based on the slip analysis, NH3 slip could already be the determined for 0.8 g/lcat, which leads to a maximum NH3 storage without slip of 0.6 g/lcat and a NOx conversion of 90%, representing 300 mg/kWh. This result fits very well to these of the experiments with the ideal storage curve. The latter provides a maximum storage of ca. 0.6g/lcat at the maximum temperature of the test cycle. Once this storage value is exceeded, it causes NH3 slip. As already assumed, a control on a constant NH3 storage level for all temperatures is not capable for ideal operation of SCR catalysts controlled by the RF system.

5. Conclusions and Outlook

Although the RF-based state monitoring of NH3 storage on SCR catalysts has been in focus of research for years, large steps towards application have been made lately. Whereas in the previous works, catalyst core samples were used and the tests were conducted in gas test benches in synthetic exhausts, the lasted results have been achieved on an engine dynamometer setup in application size, and by using DEF instead of gaseous NH3. At first, the basic capability of this technique in real exhaust and with DEF was proven, and a first automatic RF-controlled DEF dosing on a measured NH3 storage degree on the catalyst surface was applied [39]. Within the next step, the temperature-dependent behavior of the RF signals was investigated and calibration functions were developed on the example of the well-studied and serial type Cu-exchanged zeolite-based catalyst Cu-SSZ-13 [20]. Besides the RF calibration, the influence of the NH3 storage degree on the catalyst performance was investigated as well. Nevertheless, these two studies were performed only under stationary conditions. The present paper directly continues the last-mentioned work by applying the temperature-calibrated, i.e., compensated RF system for NH3 storage determination on Cu-SSZ-13 under transient conditions with special focus on the influence of the NH3 target storage on the NOx conversion efficiency and possible NH3 slip.
The developed calibrated RF system uses the under stationary conditions determined calibrations functions for both RF parameters fres and Q0−1 in the observed temperature range of 250 to 400 °C. Together with the catalyst temperature, they were used to calculate the NH3 loading in real time and to control the DEF dosing valve for a desired NH3 storage degree. For the latter three, different storage approaches were investigated:
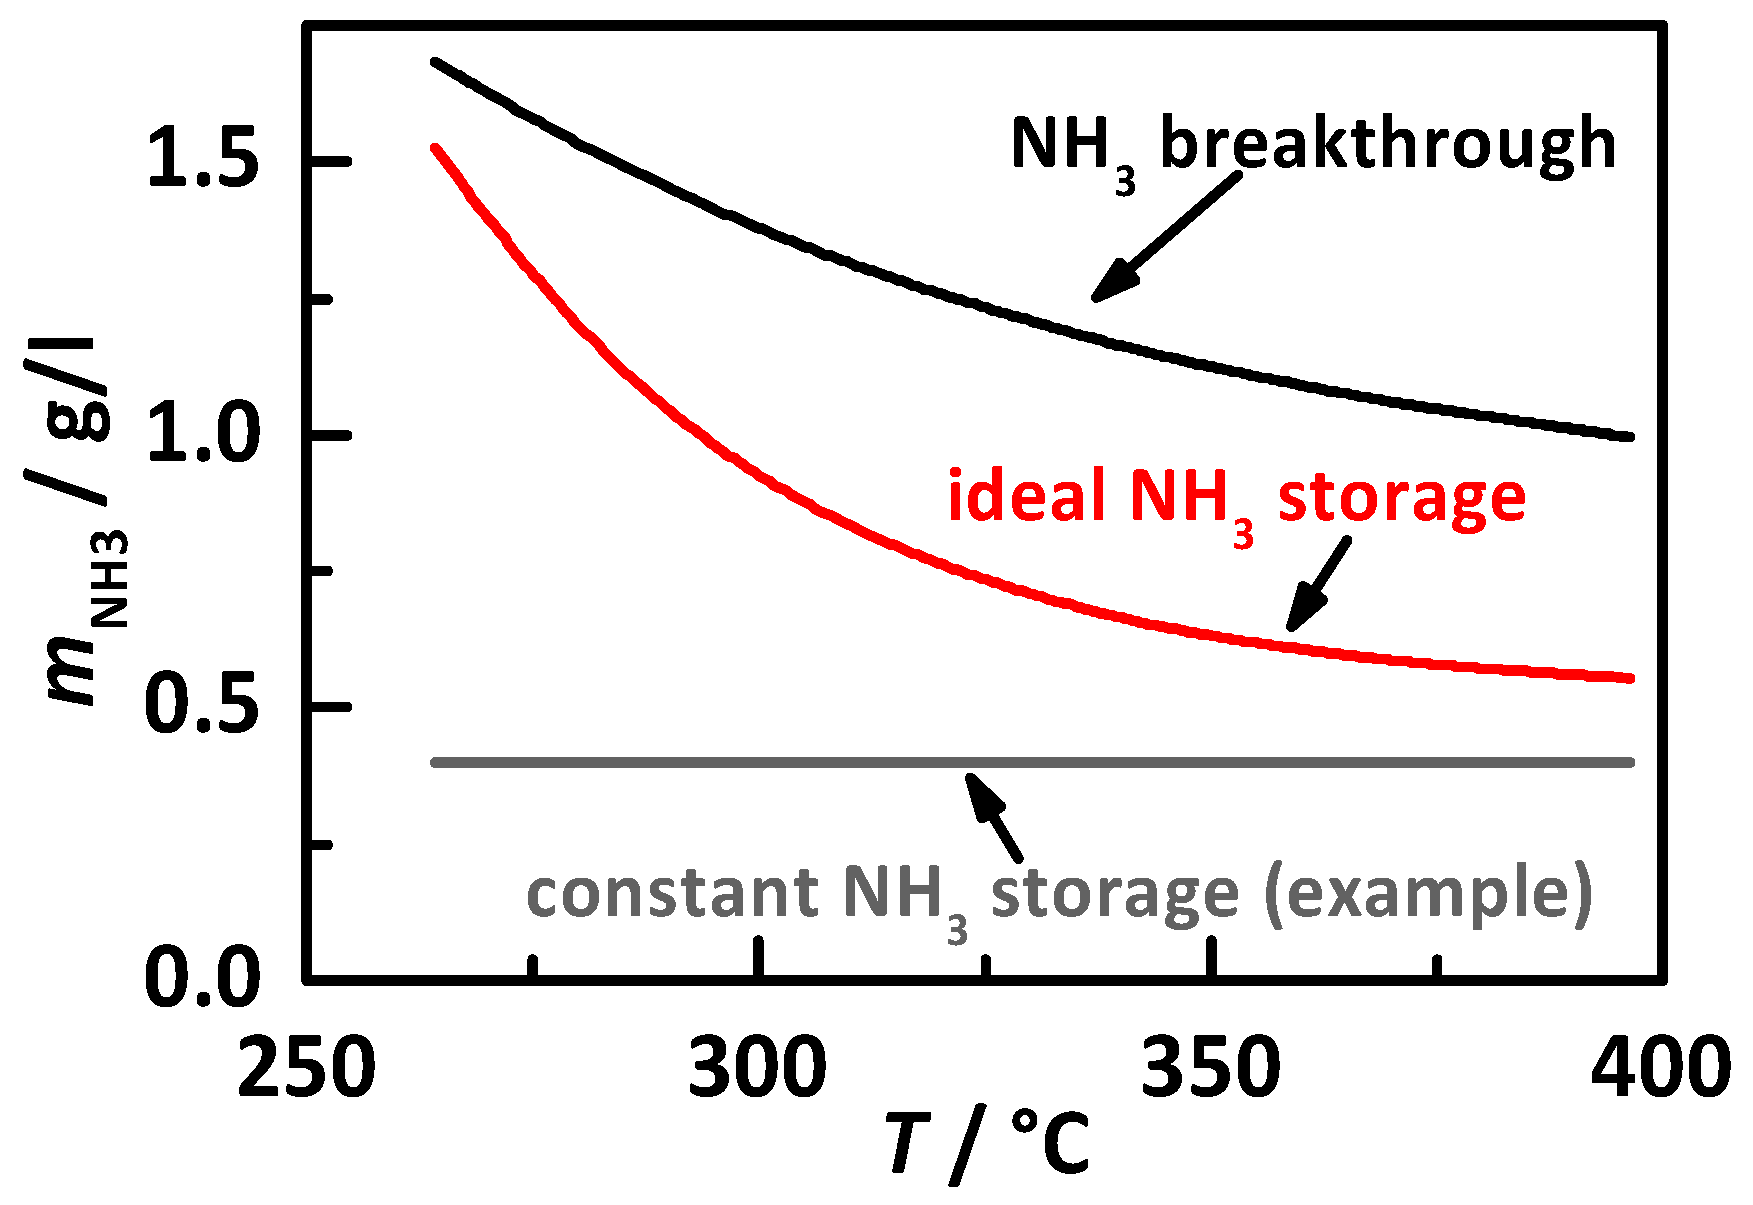
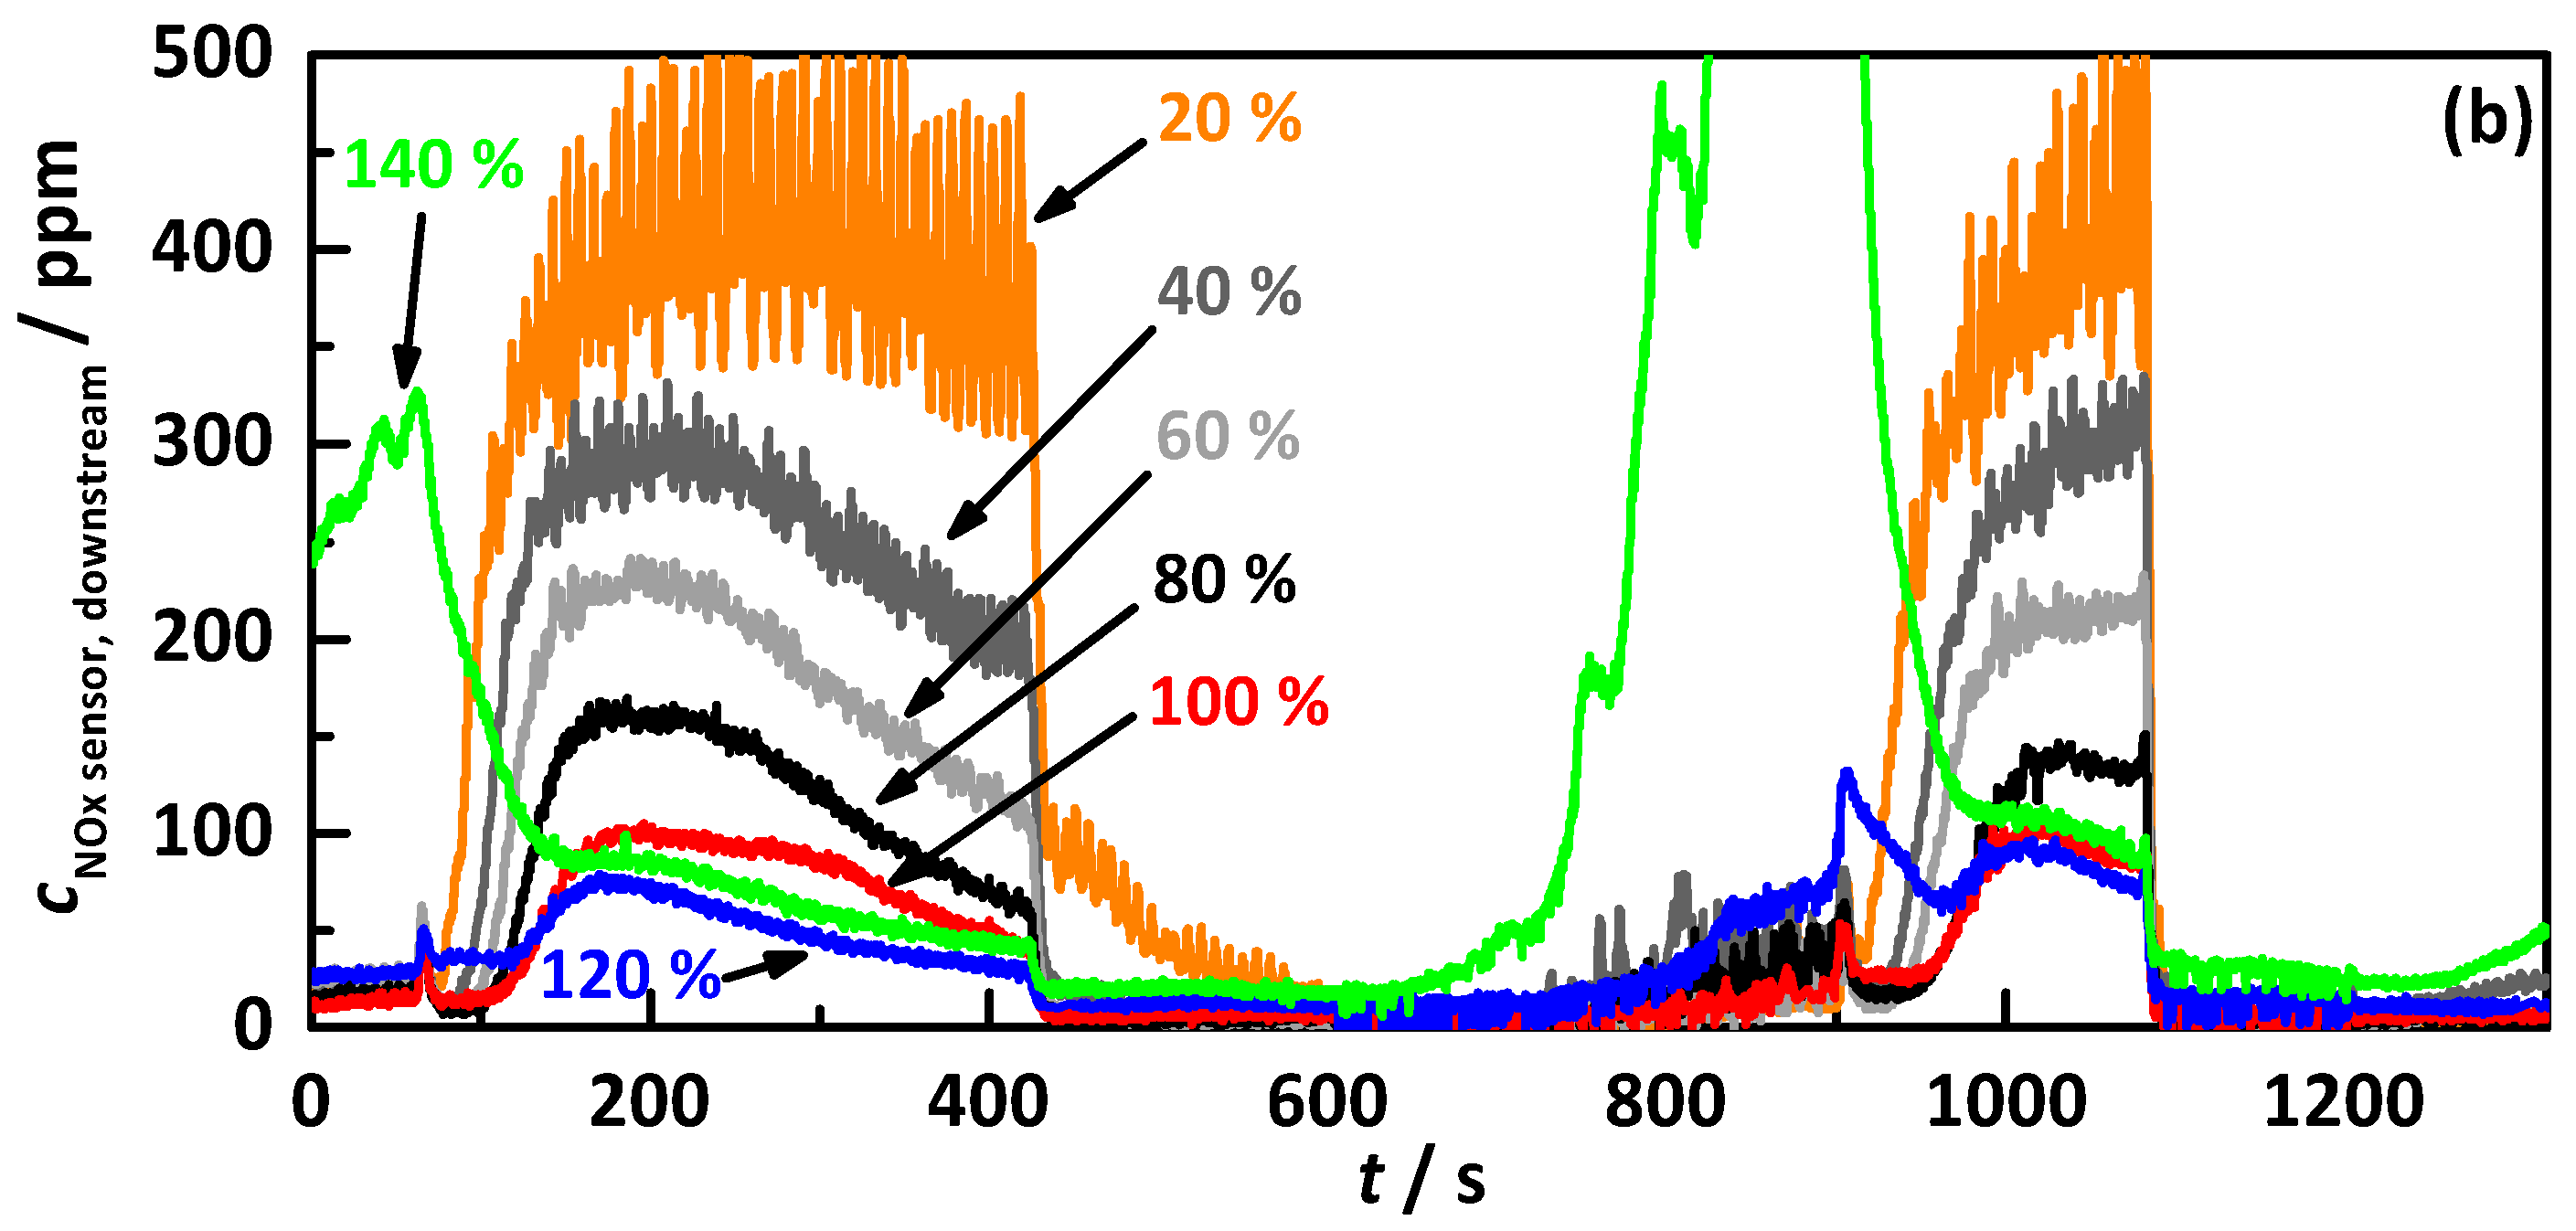
  • the percentage gradation of the NH3 breakthrough storage of Ref. [20];
  • the percentage gradation of the determined ideal NH3 storage curve of Ref. [20], i.e., the minimum required storage degree for maximum possible NOx conversion, and;
  • a constant temperature-independent NH3 storage from 0.2 to 1.4 g/lcat.
Due to dynamometer limitations, a self-defined test cycle similar to the WHSC was used. During this 1320 sec lasting test cycle, speed and load jump between several stationary operation points. This leads to catalyst temperatures between 275 and 375 °C, NOx emissions between 120 and 1500 ppm, and very high space velocities between 90,000 up and 160,000 h−1. Since this study was also limited to the use of NOx sensors for gas analysis with their well-known cross sensitivity to NH3, the entire interpretation and comparison rely on their signals. By directly comparing the downstream NOx sensor signal of the experiments with stepwise increasing NH3 target storage, possible NH3 slip was identified. Therefore, the analysis of characteristic points of the test cycle was used.
The RF-controlled DEF dosing system worked very well in all performed tests for both fres and Q0−1. Due to the transient conditions, the calculation of the stored NH3 by gas balancing is affected by small errors, but still fits well to the measured values. In the medium load operation points, full NOx conversion was achieved. Within the high load operation points with very high space velocity, NOx emissions and high temperatures a maximum conversion rate of ca. 95% was possible. The latter is most likely related to kinetical limitations and should be increased with adjusted catalyst volume.
The control on 50% of the NH3 breakthrough curve showed the best results for this approach with a maximum NOx conversion of over 90% without NH3 slip. All higher percentages already caused NH3 slip. The best results of the whole study with ca. 95% NOx conversion without NH3 slip were achieved with exactly 100% of the determined ideal NH3 storage curve, and confirmed the previous study [20]. The additionally observed control on a constant NH3 storage led to a lower maximum conversion efficiency of ca. 90% in total for a constant control on 0.6 g/lcat. This result fits well with the ideal storage curve, since 0.6 g/lcat is exactly the highest storage of the ideal storage curve within the test cycle.
The here-presented study confirms that a directly RF-controlled SCR system on a desired NH3 storage on the catalyst is able to operate the latter very close to the border of NH3 slip with the maximum possible NOx conversion efficiency. Having an application ready system may lead to a huge benefit in diesel aftertreatment control. However, in such an application, it will most likely not be used as continuous control signal, rather, it will support the existing model-based control strategies. For that purpose, an RF determined NH3 storage signal might be sufficient from time to time under defined conditions like constant driving for a specific time frame to be highly beneficial to the current model, as presented in Ref. [46].
The ongoing work is focusing on the implementation of the RF-SCR system in current serial application systems with special interest in field experiments on the road. Additionally, the effects of production-related influences to the catalyst substrates and their effects to system calibration and stability are still under investigation. Further interest focuses on possible poisoning effects like sulfur to the RF signal. In summary, this study was another big step towards application, with still some more to go.

Acknowledgments

The authors thank Carsten Steiner for his support in developing the RF dyno setup. The publication of this paper was funded by the German Research Foundation (DFG) and the University of Bayreuth in the funding program “Open Access Publishing”.

Author Contributions

M.D., G.H., W.R., P.G., M.H., K.B. and R.M. conceived the experiments. D.K. and J.V. provided the catalyst samples. M.D. performed the experiments. All together analyzed the data, evaluated and discussed the results, and wrote the paper.

Conflicts of Interest

The authors declare no conflict of interest.

References

  1. Forzatti, P. Present status and perspectives in de-NOx SCR catalysis. Appl. Catal. A 2001, 222, 221–236. [Google Scholar] [CrossRef]
  2. Koebel, M.; Elsener, M.; Marti, T. NOx-Reduction in Diesel Exhaust Gas with Urea and Selective Catalytic Reduction. Combust. Sci. Tech. 1996, 121, 85–102. [Google Scholar] [CrossRef]
  3. Johnson, T. Review of Vehicular Emissions Trends. SAE Int. J. Engines 2015, 8, 1152–1167. [Google Scholar] [CrossRef]
  4. Koebel, M.; Elsener, M.; Kleemann, M. Urea-SCR: A promising technique to reduce NOx emissions from automotive diesel engines. Catal. Today 2000, 59, 335–345. [Google Scholar] [CrossRef]
  5. Paolucci, C.; Verma, A.A.; Bates, S.A.; Kispersky, V.F.; Miller, J.T.; Gounder, R.; Delgass, W.N.; Ribeiro, F.H.; Schneider, W.F. Isolation of the Copper Redox Steps in the Standard Selective Catalytic Reduction on Cu-SSZ-13. Angew. Chem. 2014, 126, 12022–12027. [Google Scholar] [CrossRef]
  6. Borfecchia, E.; Lomachenko, K.A.; Giordanino, F.; Falsig, H.; Beato, P.; Soldatov, A.V.; Bordiga, S.; Lamberti, C. Revisiting the nature of Cu sites in the activated Cu-SSZ-13 catalyst for SCR reaction. Chem. Sci. 2015, 6, 548–563. [Google Scholar] [CrossRef] [PubMed]
  7. Brüggemann, T.C.; Keil, F.J. Theoretical Investigation of the Mechanism of the Selective Catalytic Reduction of Nitric Oxide with Ammonia on H-Form Zeolites. J. Phys. Chem. C 2008, 112, 17378–17387. [Google Scholar] [CrossRef]
  8. Janssens, T.; Falsig, H.; Lundegaard, L.; Vennestrøm, P.; Rasmussen, S.; Moses, P.G.; Giordanino, F.; Borfecchia, E.; Lomachenko, K.; Lamberti, C.; et al. A Consistent Reaction Scheme for the Selective Catalytic Reduction of Nitrogen Oxides with Ammonia. ACS Catal. 2015, 5, 2832–2845. [Google Scholar] [CrossRef] [Green Version]
  9. Koebel, M.; Elsener, M. Selective catalytic reduction of NO over commercial DeNOx-catalysts: Experimental determination of kinetic and thermodynamic parameters. Chem. Eng. Sci. 1998, 53, 657–669. [Google Scholar] [CrossRef]
  10. Gao, F.; Wang, Y.; Kollar, M.; Washton, N.; Szanyi, J.; Peden, C. A comparative kinetics study between Cu/SSZ-13 and Fe/SSZ-13 SCR catalysts. Catal. Today 2015, 258, 347–358. [Google Scholar] [CrossRef]
  11. Guan, B.; Zhan, R.; Lin, H.; Huang, Z. Review of state of the art technologies of selective catalytic reduction of NOx from diesel engine exhaust. Appl. Therm. Eng. 2014, 66, 395–414. [Google Scholar] [CrossRef]
  12. Cavataio, G.; Girard, J.; Patterson, J.; Montreuil, C.; Cheng, Y.; Lambert, C. Laboratory Testing of Urea-SCR Formulations to Meet Tier 2 Bin 5 Emissions. SAE Tech. Pap. 2007, 1, 1575. [Google Scholar] [CrossRef]
  13. Kumar, A.; Kamasamudram, K.; Currier, N.; Yezerets, A. Effect of Transition Metal Ion Properties on the Catalytic Functions and Sulfation Behavior of Zeolite-Based SCR Catalysts. SAE Int. J. Engines 2017, 10, 1604–1612. [Google Scholar] [CrossRef]
  14. Yuan, X.; Liu, H.; Gao, Y. Diesel Engine SCR Control: Current Development and Future Challenges. Emiss. Control Sci. Technol. 2015, 1, 121–133. [Google Scholar] [CrossRef]
  15. Feng, T.; Lü, L. The characteristics of ammonia storage and the development of model-based control for diesel engine urea-SCR system. J. Ind. Eng. Chem. 2015, 28, 97–109. [Google Scholar] [CrossRef]
  16. Wang, D.; Yao, S.; Shost, M.; Yoo, J.; Cabush, D.; Racine, D. Ammonia Sensor for Closed-Loop SCR Control. SAE Int. J. Passenger Cars Electron. Electr. Syst. 2009, 1, 323–333. [Google Scholar] [CrossRef]
  17. Seibel, M.; Hofmann, F.; Christner, B.; Kaiser, A.; Fekete, N.; Weibel, M. Development and Integration Process of Control-Oriented Catalyst Models. In Proceedings of the 6th IAV MinNOx Conference, Berlin, Germany, 22–23 June 2016. [Google Scholar]
  18. Moser, M.; Carqué, G.; Heß, D.; Schrade, F. Simulationsgestützte Robustheitsanalyse von On-Board-Diagnosefunktionen. MTZ Motortech Z 2016, 77, 54–59. [Google Scholar] [CrossRef]
  19. Ning, J.; Yan, F. Detection of Injected Urea Quantity and Correction for SCR Urea Dosing Control. SAE Tech. Pap. 2015. [Google Scholar] [CrossRef]
  20. Dietrich, M.; Hagen, G.; Reitmeier, W.; Burger, K.; Hien, M.; Grass, P.; Kubinski, D.; Visser, J.; Moos, R. Radio-Frequency-Based NH₃-Selective Catalytic Reduction Catalyst Control: Studies on Temperature Dependency and Humidity Influences. Sensors 2017, 17, 1615. [Google Scholar] [CrossRef] [PubMed]
  21. Moos, R.; Rauch, D.; Votsmeier, M.; Kubinski, D. Review on Radio Frequency Based Monitoring of SCR and Three Way Catalysts. Top. Catal. 2016, 59, 961–969. [Google Scholar] [CrossRef]
  22. Moos, R. Microwave-Based Catalyst State Diagnosis–State of the Art and Future Perspectives. SAE Int. J. Engines 2015, 8, 1240–1245. [Google Scholar] [CrossRef]
  23. Moos, R.; Beulertz, G.; Reiß, S.; Hagen, G.; Fischerauer, G.; Votsmeier, M.; Gieshoff, J. Overview: Status of the Microwave-Based Automotive Catalyst State Diagnosis. Top. Catal. 2013, 56, 358–364. [Google Scholar] [CrossRef]
  24. Beulertz, G.; Votsmeier, M.; Moos, R. In operando Detection of Three-Way Catalyst Aging by a Microwave-Based Method: Initial Studies. Appl. Sci. 2015, 5, 174–186. [Google Scholar] [CrossRef]
  25. Beulertz, G.; Votsmeier, M.; Moos, R. Effect of propene, propane, and methane on conversion and oxidation state of three-way catalysts: A microwave cavity perturbation study. Appl. Catal. B 2015, 165, 369–377. [Google Scholar] [CrossRef]
  26. Beulertz, G.; Fritsch, M.; Fischerauer, G.; Herbst, F.; Gieshoff, J.; Votsmeier, M.; Hagen, G.; Moos, R. Microwave Cavity Perturbation as a Tool for Laboratory In Situ Measurement of the Oxidation State of Three Way Catalysts. Top. Catal. 2013, 56, 405–409. [Google Scholar] [CrossRef]
  27. Dietrich, M.; Jahn, C.; Lanzerath, P.; Moos, R. Microwave-Based Oxidation State and Soot Loading Determination on Gasoline Particulate Filters with Three-Way Catalyst Coating for Homogenously Operated Gasoline Engines. Sensors 2015, 15, 21971–21988. [Google Scholar] [CrossRef] [PubMed]
  28. Nanjundaswamy, H.; Nagaraju, V.; Wu, Y.; Koehler, E.; Sappok, A.; Ragaller, P.; Bromberg, L. Advanced RF Particulate Filter Sensing and Controls for Efficient Aftertreatment Management and Reduced Fuel Consumption. SAE Tech. Pap. 2015, 1, 0996. [Google Scholar] [CrossRef]
  29. Sappok, A.; Bromberg, L.; Parks, J.E.; Prikhodko, V. Loading and Regeneration Analysis of a Diesel Particulate Filter with a Radio Frequency-Based Sensor. SAE Tech. Pap. 2010, 1, 2126. [Google Scholar] [CrossRef]
  30. Feulner, M.; Hagen, G.; Piontkowski, A.; Müller, A.; Fischerauer, G.; Brüggemann, D.; Moos, R. In-Operation Monitoring of the Soot Load of Diesel Particulate Filters: Initial Tests. Top. Catal. 2013, 56, 483–488. [Google Scholar] [CrossRef]
  31. Feulner, M.; Hagen, G.; Hottner, K.; Redel, S.; Müller, A.; Moos, R. Comparative Study of Different Methods for Soot Sensing and Filter Monitoring in Diesel Exhausts. Sensors 2017, 17, 400. [Google Scholar] [CrossRef] [PubMed]
  32. Sappok, A.; Bromberg, L. Radio Frequency Diesel Particulate Filter Soot and Ash Level Sensors: Enabling Adaptive Controls for Heavy-Duty Diesel Applications. SAE Int. J. Commer. Veh. 2014, 7, 468–477. [Google Scholar] [CrossRef]
  33. Fremerey, P.; Reiß, S.; Geupel, A.; Fischerauer, G.; Moos, R. Determination of the NOx loading of an automotive lean NOx trap by directly monitoring the electrical properties of the catalyst material itself. Sensors 2011, 11, 8261–8280. [Google Scholar] [CrossRef] [PubMed]
  34. Moos, R.; Fischerauer, G. Automotive Catalyst State Diagnosis Using Microwaves. Oil Gas Sci. Technol. 2014, 70, 55–65. [Google Scholar] [CrossRef]
  35. Rauch, D.; Kubinski, D.; Cavataio, G.; Upadhyay, D.; Moos, R. Ammonia Loading Detection of Zeolite SCR Catalysts using a Radio Frequency based Method. SAE Int. J. Engines 2015, 8, 1126–1135. [Google Scholar] [CrossRef]
  36. Rauch, D.; Kubinski, D.; Simon, U.; Moos, R. Detection of the ammonia loading of a Cu Chabazite SCR catalyst by a radio frequency-based method. Sens. Actuator B-Chem. 2014, 205, 88–93. [Google Scholar] [CrossRef]
  37. Rauch, D.; Albrecht, G.; Kubinski, D.; Moos, R. A microwave-based method to monitor the ammonia loading of a vanadia-based SCR catalyst. Appl. Catal. B 2015, 165, 36–42. [Google Scholar] [CrossRef]
  38. Reiß, S.; Schönauer, D.; Hagen, G.; Fischerauer, G.; Moos, R. Monitoring the Ammonia Loading of Zeolite-Based Ammonia SCR Catalysts by a Microwave Method. Chem. Eng. Technol. 2011, 34, 791–796. [Google Scholar] [CrossRef]
  39. Dietrich, M.; Steiner, C.; Hagen, G.; Moos, R. Radio-Frequency-Based Urea Dosing Control for Diesel Engines with Ammonia SCR Catalysts. SAE Int. J. Engines 2017, 10, 1638–1645. [Google Scholar] [CrossRef]
  40. Chen, P.; Rauch, D.; Weide, P.; Schönebaum, S.; Simons, T.; Muhler, M.; Moos, R.; Simon, U. The effect of Cu and Fe cations on NH3 -supported proton transport in DeNOx-SCR zeolite catalysts. Catal. Sci. Technol. 2016, 6, 3362–3366. [Google Scholar] [CrossRef]
  41. Chen, P.; Schönebaum, S.; Simons, T.; Rauch, D.; Dietrich, M.; Moos, R.; Simon, U. Correlating the Integral Sensing Properties of Zeolites with Molecular Processes by Combining Broadband Impedance and DRIFT Spectroscopy - A New Approach for Bridging the Scales. Sensors 2015, 15, 28915–28941. [Google Scholar] [CrossRef] [PubMed] [Green Version]
  42. Rauch, D.; Dietrich, M.; Simons, T.; Simon, U.; Porch, A.; Moos, R. Microwave Cavity Perturbation Studies on H-form and Cu Ion-Exchanged SCR Catalyst Materials: Correlation of Ammonia Storage and Dielectric Properties. Top. Catal. 2017, 60, 243–249. [Google Scholar] [CrossRef]
  43. Dietrich, M.; Rauch, D.; Simon, U.; Porch, A.; Moos, R. Ammonia storage studies on H-ZSM-5 zeolites by microwave cavity perturbation: Correlation of dielectric properties with ammonia storage. J. Sens. Sens. Syst. 2015, 4, 263–269. [Google Scholar] [CrossRef]
  44. Dietrich, M.; Rauch, D.; Porch, A.; Moos, R. A laboratory test setup for in situ measurements of the dielectric properties of catalyst powder samples under reaction conditions by microwave cavity perturbation: Set up and initial tests. Sensors 2014, 14, 16856–16868. [Google Scholar] [CrossRef] [PubMed] [Green Version]
  45. Cavataio, G.; Jen, H.; Warner, J.; Girard, J.; Kim, J.; Lambert, C. Enhanced Durability of a Cu/Zeolite Based SCR Catalyst. SAE Int. J. Fuels Lubr. 2009, 1, 477–487. [Google Scholar] [CrossRef]
  46. Moser, M.; Leimkühler, L. Simulative Assessment of Tolerance Limits of new Sensor Concepts for Controls and OBD. In Proceedings of the 4th International Specialist Conference: Sensors for Exhaust Gas Aftertreatment and CO2 Reduction, Augsburg, Germany, 27–29 June 2017. [Google Scholar]
Figure 1. Illustration of the dynamometer setup: 2.1 ltr diesel engine with diesel oxidation catalyst and particulate filter, DEF dosing with uncoated cordierite substrate and plate mixer, Ø 5.66” (Ø 14.2 cm) selective catalytic reduction (SCR) catalyst canning defined by metal screens with two radio-frequency (RF) antennas, thermocouples up- and downstream of the SCR and three NOx sensors up- and downstream of SCR and upstream of DEF dosing, from [20].
Sensors 17 02746 g001
Figure 2. Results of Ref. [20] used for RF system calibration: the RF signals for different states in (a) for fres and (b) for Q0−1 with the empty state (squares), the ideal NH3 storage (red triangles) and the NH3 loading as first breakthrough occurs (circles), and the determined sensitivities to NH3 storage in (c) for fres and in (d) for Q0−1. The used calibration functions for the empty state and the NH3 sensitivity for both RF parameters are displayed by black curves.
Sensors 17 02746 g002
Figure 3. Illustration of the investigated approaches for NH3 target storage with percentage gradation of the storage degree when first NH3 breakthrough occurs (black) and of the ideal NH3 storage curve (red, minimum storage for maximum NOx conversion), both determined in stationary experiments in Ref. [20], and different constant storage levels between 0.2 and 1.4 g/lcat in a gradation of 0.2 g/lcat (example of 0.4 g/lcat displayed in grey).
Sensors 17 02746 g003
Figure 4. Control flow diagram of the applied RF-controlled and temperature-compensated NH3 storage determination and urea dosing system.
Sensors 17 02746 g004
Figure 5. Transient test procedure with (a) the exhaust gas mass flow exhaust, (b) the catalyst temperature, (c) the engine out NOx emissions, (d) the lambda signal, (e) the cumulative emitted NOx mass, and (f) the consumed energy of the engine within the test cycle.
Sensors 17 02746 g005aSensors 17 02746 g005b
Figure 6. Test cycle with NH3 storage control on 60% of the ideal storage curve by Q0−1 with (a) the space velocity (black) and the catalyst temperature (red), (b) the air/fuel ratio λ, (c) the signals of the NOx sensors upstream of the DEF dosing (black) and downstream of the SCR catalyst, (d) the calculated apparent NOx conversion, (e) the dosed NH3 determined by NOx sensors up- and downstream of DEF dosing, (f) fres and (g) Q0−1 (black) with the calibration value for the NH3-free state (grey dashed), and (h) the amount of stored NH3 on the catalyst determined by fres (black), Q0−1 (red, control value), and by gas balance (grey).
Sensors 17 02746 g006
Figure 7. Comparison of the performed test cycles with percentage gradation of the ideal NH3 storage curve controlled by Q0−1, with (a) the engine out NOx emissions (black) and the catalyst temperature (red) and (b) the signal of the downstream NOx sensor for 20 to 140% of the ideal storage curve.
Sensors 17 02746 g007aSensors 17 02746 g007b
Figure 8. Detail view of the downstream NOx sensor signals at two characteristic points of the performed test cycles with percentage gradation of the ideal storage curve for 80% (black), 100% (red) and 120% (blue), with (a) the first change of operation point and (b) the change from full into medium load at maximum catalyst temperature.
Sensors 17 02746 g008
Figure 9. Results of the transient study for the control on percentage gradation of the NH3 breakthrough curve by fres (hollow triangles) and Q0−1 (filled squares), with (a) the apparent emitted and normalized NOx mass in mg/kWh as determined by the downstream NOx sensor, and (b) the resulting apparent NOx conversion within the test cycle. The storage curves right to the dashed line (grey marked) caused NH3 slip.
Sensors 17 02746 g009
Figure 10. Results of the transient study for the control on percentage gradation of the ideal NH3 storage curve by fres (hollow triangles) and Q0−1 (filled squares), with (a) the apparent emitted and normalized NOx mass in mg/kWh as determined by the downstream NOx sensor, and (b) the resulting apparent NOx conversion within the test cycle. The storage curves right to the dashed line (grey marked) caused NH3 slip.
Sensors 17 02746 g010
Figure 11. Results of the transient study for the control on a constant NH3 storage by fres (hollow triangles) and Q0−1 (filled squares), with (a) the apparent emitted and normalized NOx mass in mg/kWh as determined by the downstream NOx sensor, and (b) the resulting apparent NOx conversion within the test cycle. The storage curves right to the dashed line (grey marked) caused NH3 slip.
Sensors 17 02746 g011

