Review

Bioluminescence Assays for Monitoring Chondrogenic Differentiation and Cartilage Regeneration

Department of Physical Therapy and Rehabilitation Science, College of Health Science, Eulji University, Gyeonggi 13135, Korea
*
Author to whom correspondence should be addressed.
Sensors 2017, 17(6), 1306; https://doi.org/10.3390/s17061306
Submission received: 8 May 2017 / Revised: 24 May 2017 / Accepted: 2 June 2017 / Published: 6 June 2017
(This article belongs to the Special Issue Whole Cell-Based Biosensors and Application)

Abstract

:
Since articular cartilage has a limited regeneration potential, for developing biological therapies for cartilage regeneration it is important to study the mechanisms underlying chondrogenesis of stem cells. Bioluminescence assays can visualize a wide range of biological phenomena such as gene expression, signaling, metabolism, development, cellular movements, and molecular interactions by using visible light and thus contribute substantially to elucidation of their biological functions. This article gives a concise review to introduce basic principles of bioluminescence assays and applications of the technology to visualize the processes of chondrogenesis and cartilage regeneration. Applications of bioluminescence assays have been highlighted in the methods of real-time monitoring of gene expression and intracellular levels of biomolecules and noninvasive cell tracking within animal models. This review suggests that bioluminescence assays can be applied towards a visual understanding of chondrogenesis and cartilage regeneration.

1. Introduction

Articular cartilage is a type of vascular connective tissue and thus cannot be accessed by blood supply and mesenchymal stem cells (MSCs) originating from the bone marrow. Hence, cartilage tissues have limited regeneration potential [1,2]. Regenerative medicine and technology based on stem cells can be an attractive strategy to repair cartilage damage in patients. For developing biological therapies for cartilage regeneration, it is important to understand the mechanisms underlying chondrogenesis of stem cells [3].
Molecular imaging enables the visual monitoring, characterization and quantitative analysis of biological processes within living organisms [4]. Thus, molecular imaging can be a powerful research tool for studying mechanisms for chondrogenesis of stem cells and developing stem-cell therapy for cartilage regeneration. Among molecular imaging techniques, bioluminescence and fluorescence-based imaging techniques have been developed with the development of cameras with highly sensitive photosensors and have their applications in living organisms [5]. Fluorescence imaging requires external light absorption for light emission at a longer wavelength, whereas bioluminescence imaging requires the oxidation of luciferin catalyzed by luciferases to release photons of light [6,7]. Advanced molecular imaging systems including the development of a cooled charged coupled device (CCCD) camera allow us to quantify photons both in vitro and in vivo despite their light-absorbing and scattering properties [4]. Thus, the combination of optical systems and bioluminescence reporter systems enables us to monitor a variety of biological processes in real-time [8]. Real-time monitoring based on these advanced bioluminescence technologies can observe biological processes continuously, instead of at discrete time points, and thus provide the essential information for understanding tissue regeneration which is the sequential processes. Therefore, researchers are now trying to apply bioluminescence assays to regenerative medicine and its clinical applications [9]. This article will review the applications of bioluminescence assays to clarify underlying mechanisms of chondrogenesis of stem cell and stem cell-based therapy for cartilage regeneration.

2. Fundamentals of Bioluminescence Assays

Fluorescence requires high-intensity excitation light which is inherently toxic for live cells and thus can lead to artifacts and abnormal responses. Thus, fluorescence imaging is not suitable for monitoring long-term processes due to continuous irradiation, causing cell damage and photobleaching (Table 1). In contrast, bioluminescence, which results from the activity of luciferase to catalyze oxidation of luciferins, has disadvantages such as lower brightness than fluorescence, requirement of luciferin and thus dependence on alterations to luciferin uptake rates due to changes in cell health, cellular location, and metabolic rates. However, it does not require excitation light, thereby having a low phototoxicity ([7], Table 1). Therefore, bioluminescence imaging is very useful for monitoring long-term processes of stem cell differentiation. Moreover, bioluminescence imaging offers higher sensitivity than fluorescent imaging due to the extremely low background signal ([6], Table 1). Until now, the Photinus pyralis (firefly) luciferase (Fluc), the Renilla reniformis luciferase (Rluc) and the Gaussia princeps luciferase (Gluc) have been widely used in biomedical research. Fluc converts D-luciferin to oxyluciferin by using ATP and Mg2+ as cofactors, resulting in green light emission at 562 nm [10], while Rluc uses coelenterazine to emit a blue light at 482 nm without any cofactors but has a significantly lower quantum yield and less enzymatic efficiency than Fluc [11]. Gaussia luciferase (Gluc) is a naturally secreted luciferase to emit the blue bioluminescence (480 nm peak) [12]. Although Gluc is much more sensitive than Fluc and Rluc, Gluc is less suitable for in vivo imaging because Gluc is highly absorbed by hemoglobin and melanin or is scattered by various tissues in living organisms [13]. The red-emitting luciferases from Pyrophorus plagiophthalamus [14], Photinus pyralis [15], Luciola italica [16] and railroad worm are known to be useful for the molecular imaging of deep tissues. Moreover, multicolor bioluminescence reporters based on beetle luciferases to emit green, orange, and red light allowed the simultaneous monitoring of the expression of multiple genes [17]. Recently, it was demonstrated that the bacterial bioluminescence lux system consisting of five genes (luxCDABE) can produce fully autonomous bioluminescence in mammalian cells without the addition of any chemical substrates [18]. The utility of these bioluminescence reporters allows for analysis of various aspects of biological functions, not only gene expression but also quantity of biomolecules, post-translational modification, and protein–protein interaction [19].

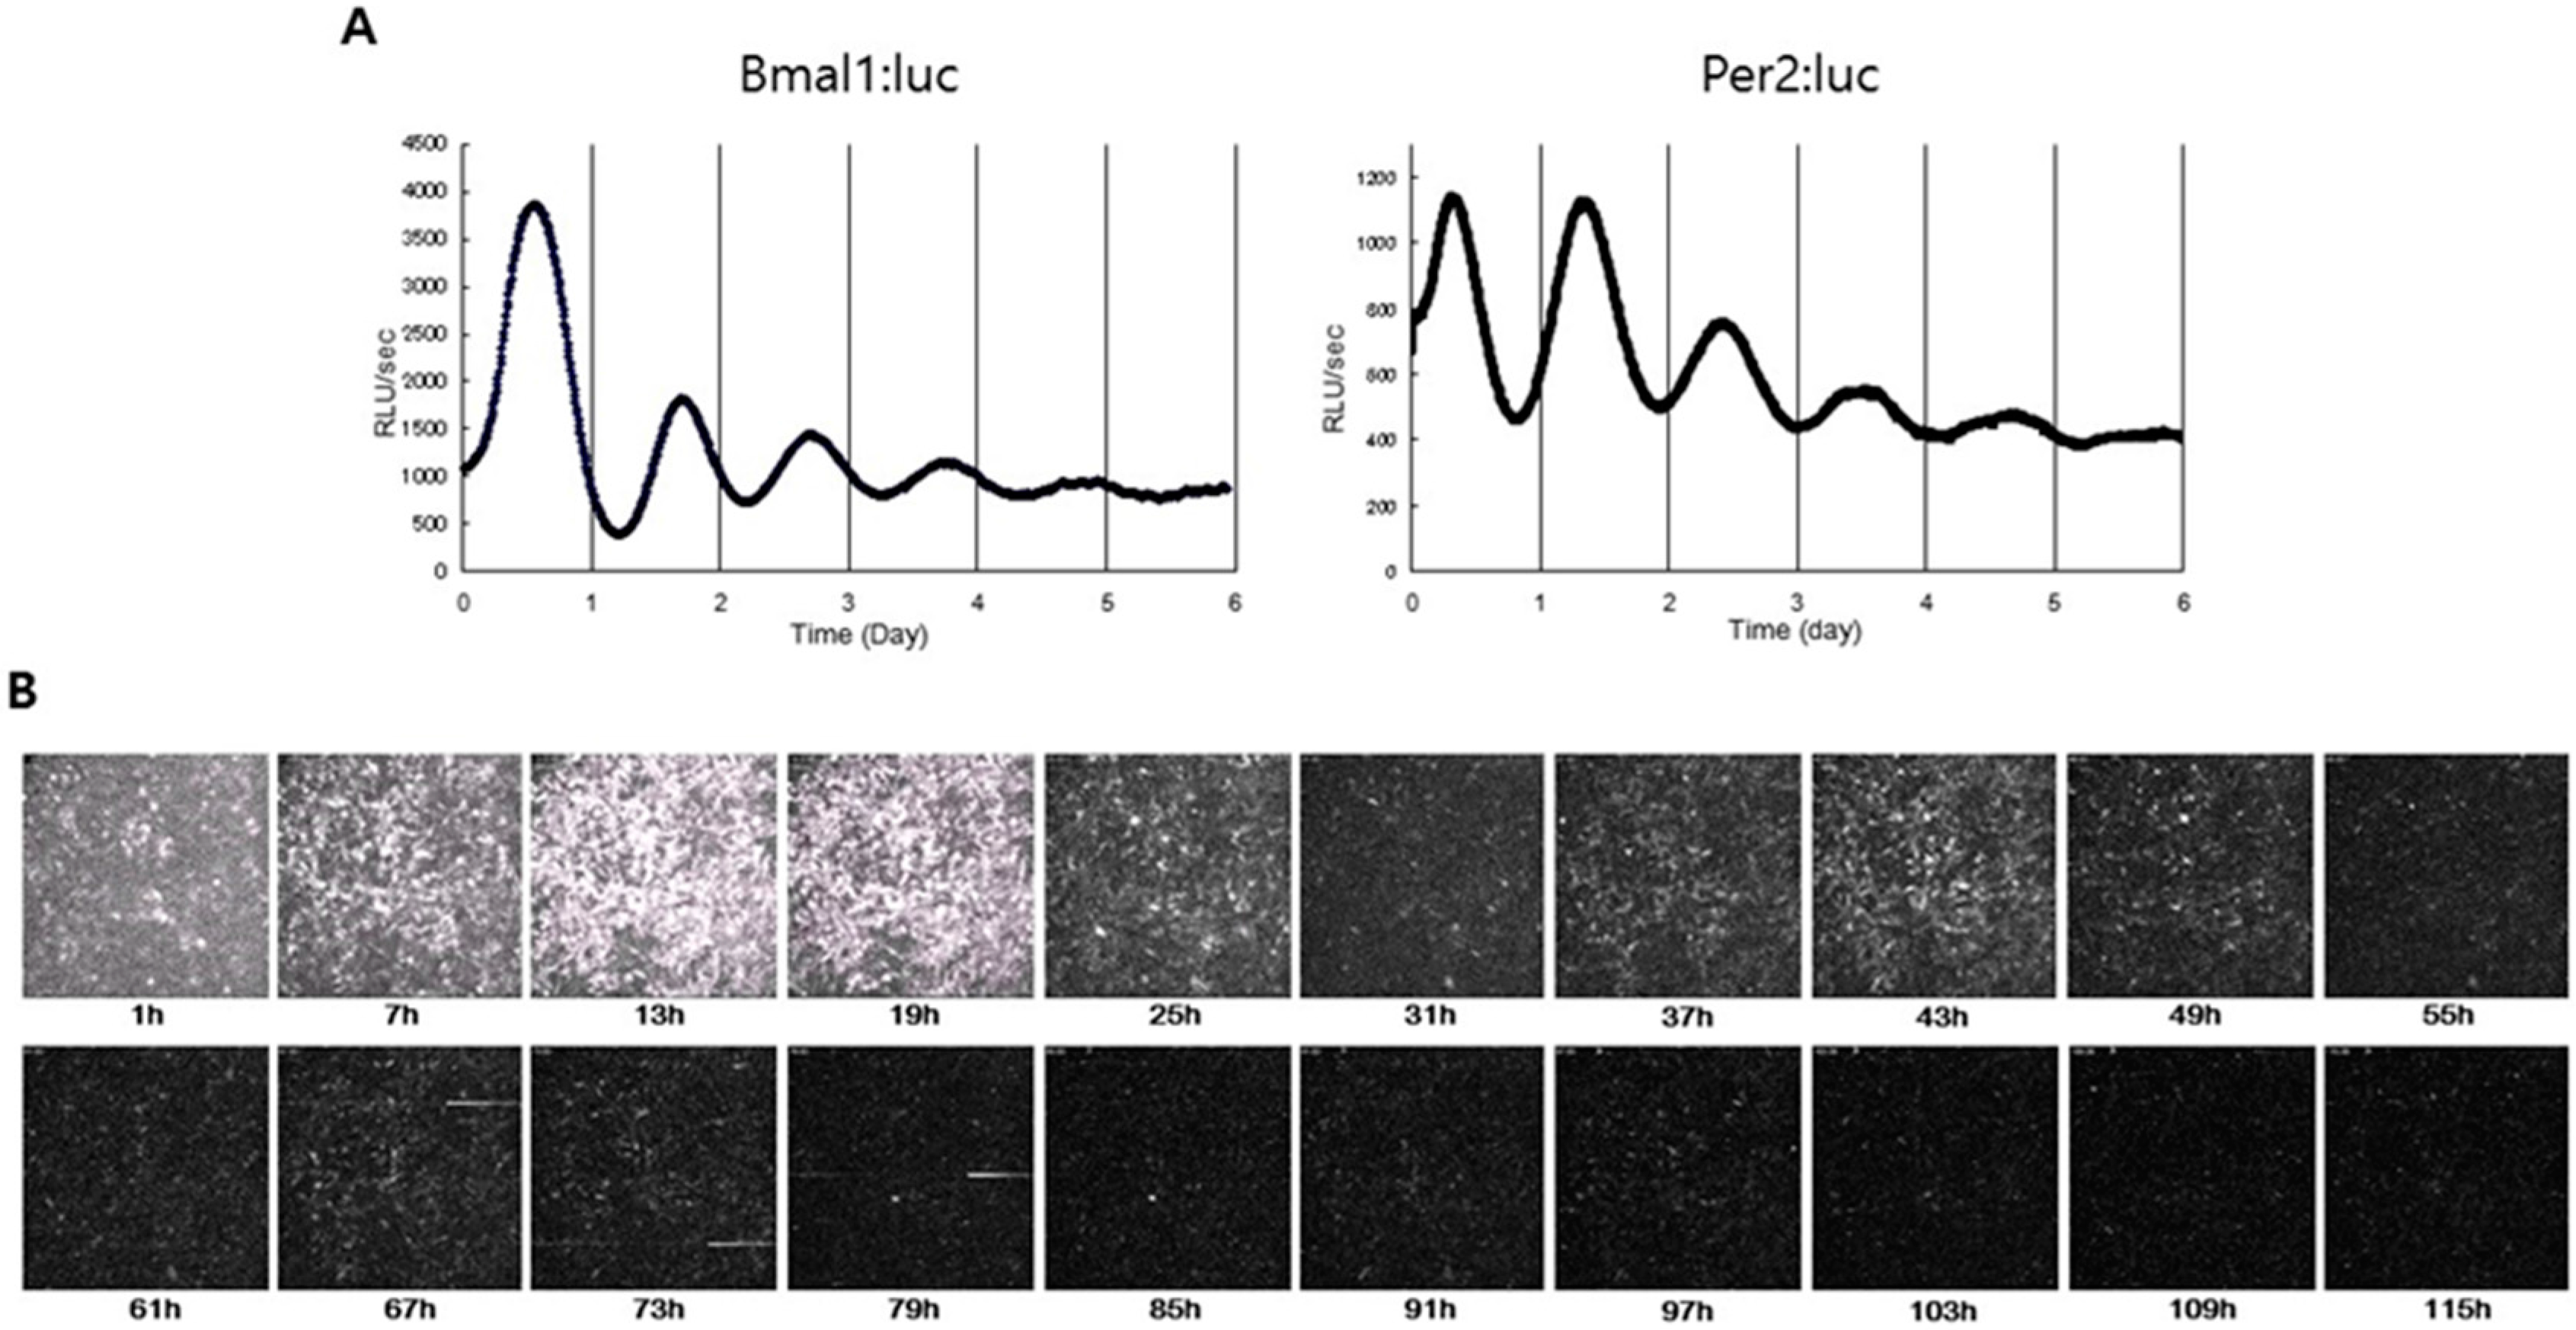
3. Real-Time Monitoring of Gene Expression

3.1. Principles

Reporters consisting of the reporter genes under the control of a selected gene promoter have been used to analyze the transcriptional activities [20]. In comparison to typical reporter enzymes such as green fluorescent protein, β-galactosidase, and chloramphenicol acetyltransferase, luciferases have high sensitivity due to greatly reduced background, thereby providing the superior linear response range and thus are the most useful reporter enzymes for the quantitative analysis of gene expression [19]. Thus, bioluminescence reporter assays have been widely used in measuring gene expression levels in a variety of biological and pathological states from embryo development to disease progression. In general bioluminescence reporter assays, the luciferase reporters are transfected into target cells, the transfected cells expressing luciferases are lysed after an appropriate period, and then the quantitative levels of the expressed luciferase are measured by detecting a light signal to estimate the target promoter activity as a light intensity [21]. Thus, bioluminescence reporter assays have shortcomings such as requirement of cell lysis and time delays between luciferin application and bioluminescent signal acquisition. However, a molecular imaging system based on a CCCD camera and the bright bioluminescence reporters enables real-time monitoring of the level, the localization, and the duration of the gene expression without cell lysis, which is required for investigating dynamic processes of cell differentiation and tissue regeneration [22]. Furthermore, advanced luciferase technology, involving progress in both the multicolor reporter system and the detection equipment, has allowed us to simultaneously monitor the expressions of multiple genes because luciferases can emit different colored light in the catalysis of a single D-luciferin substrate and each of the intensities can be quantified by splitting these mixed emission spectra with optical filters (Figure 1) [23,24,25].

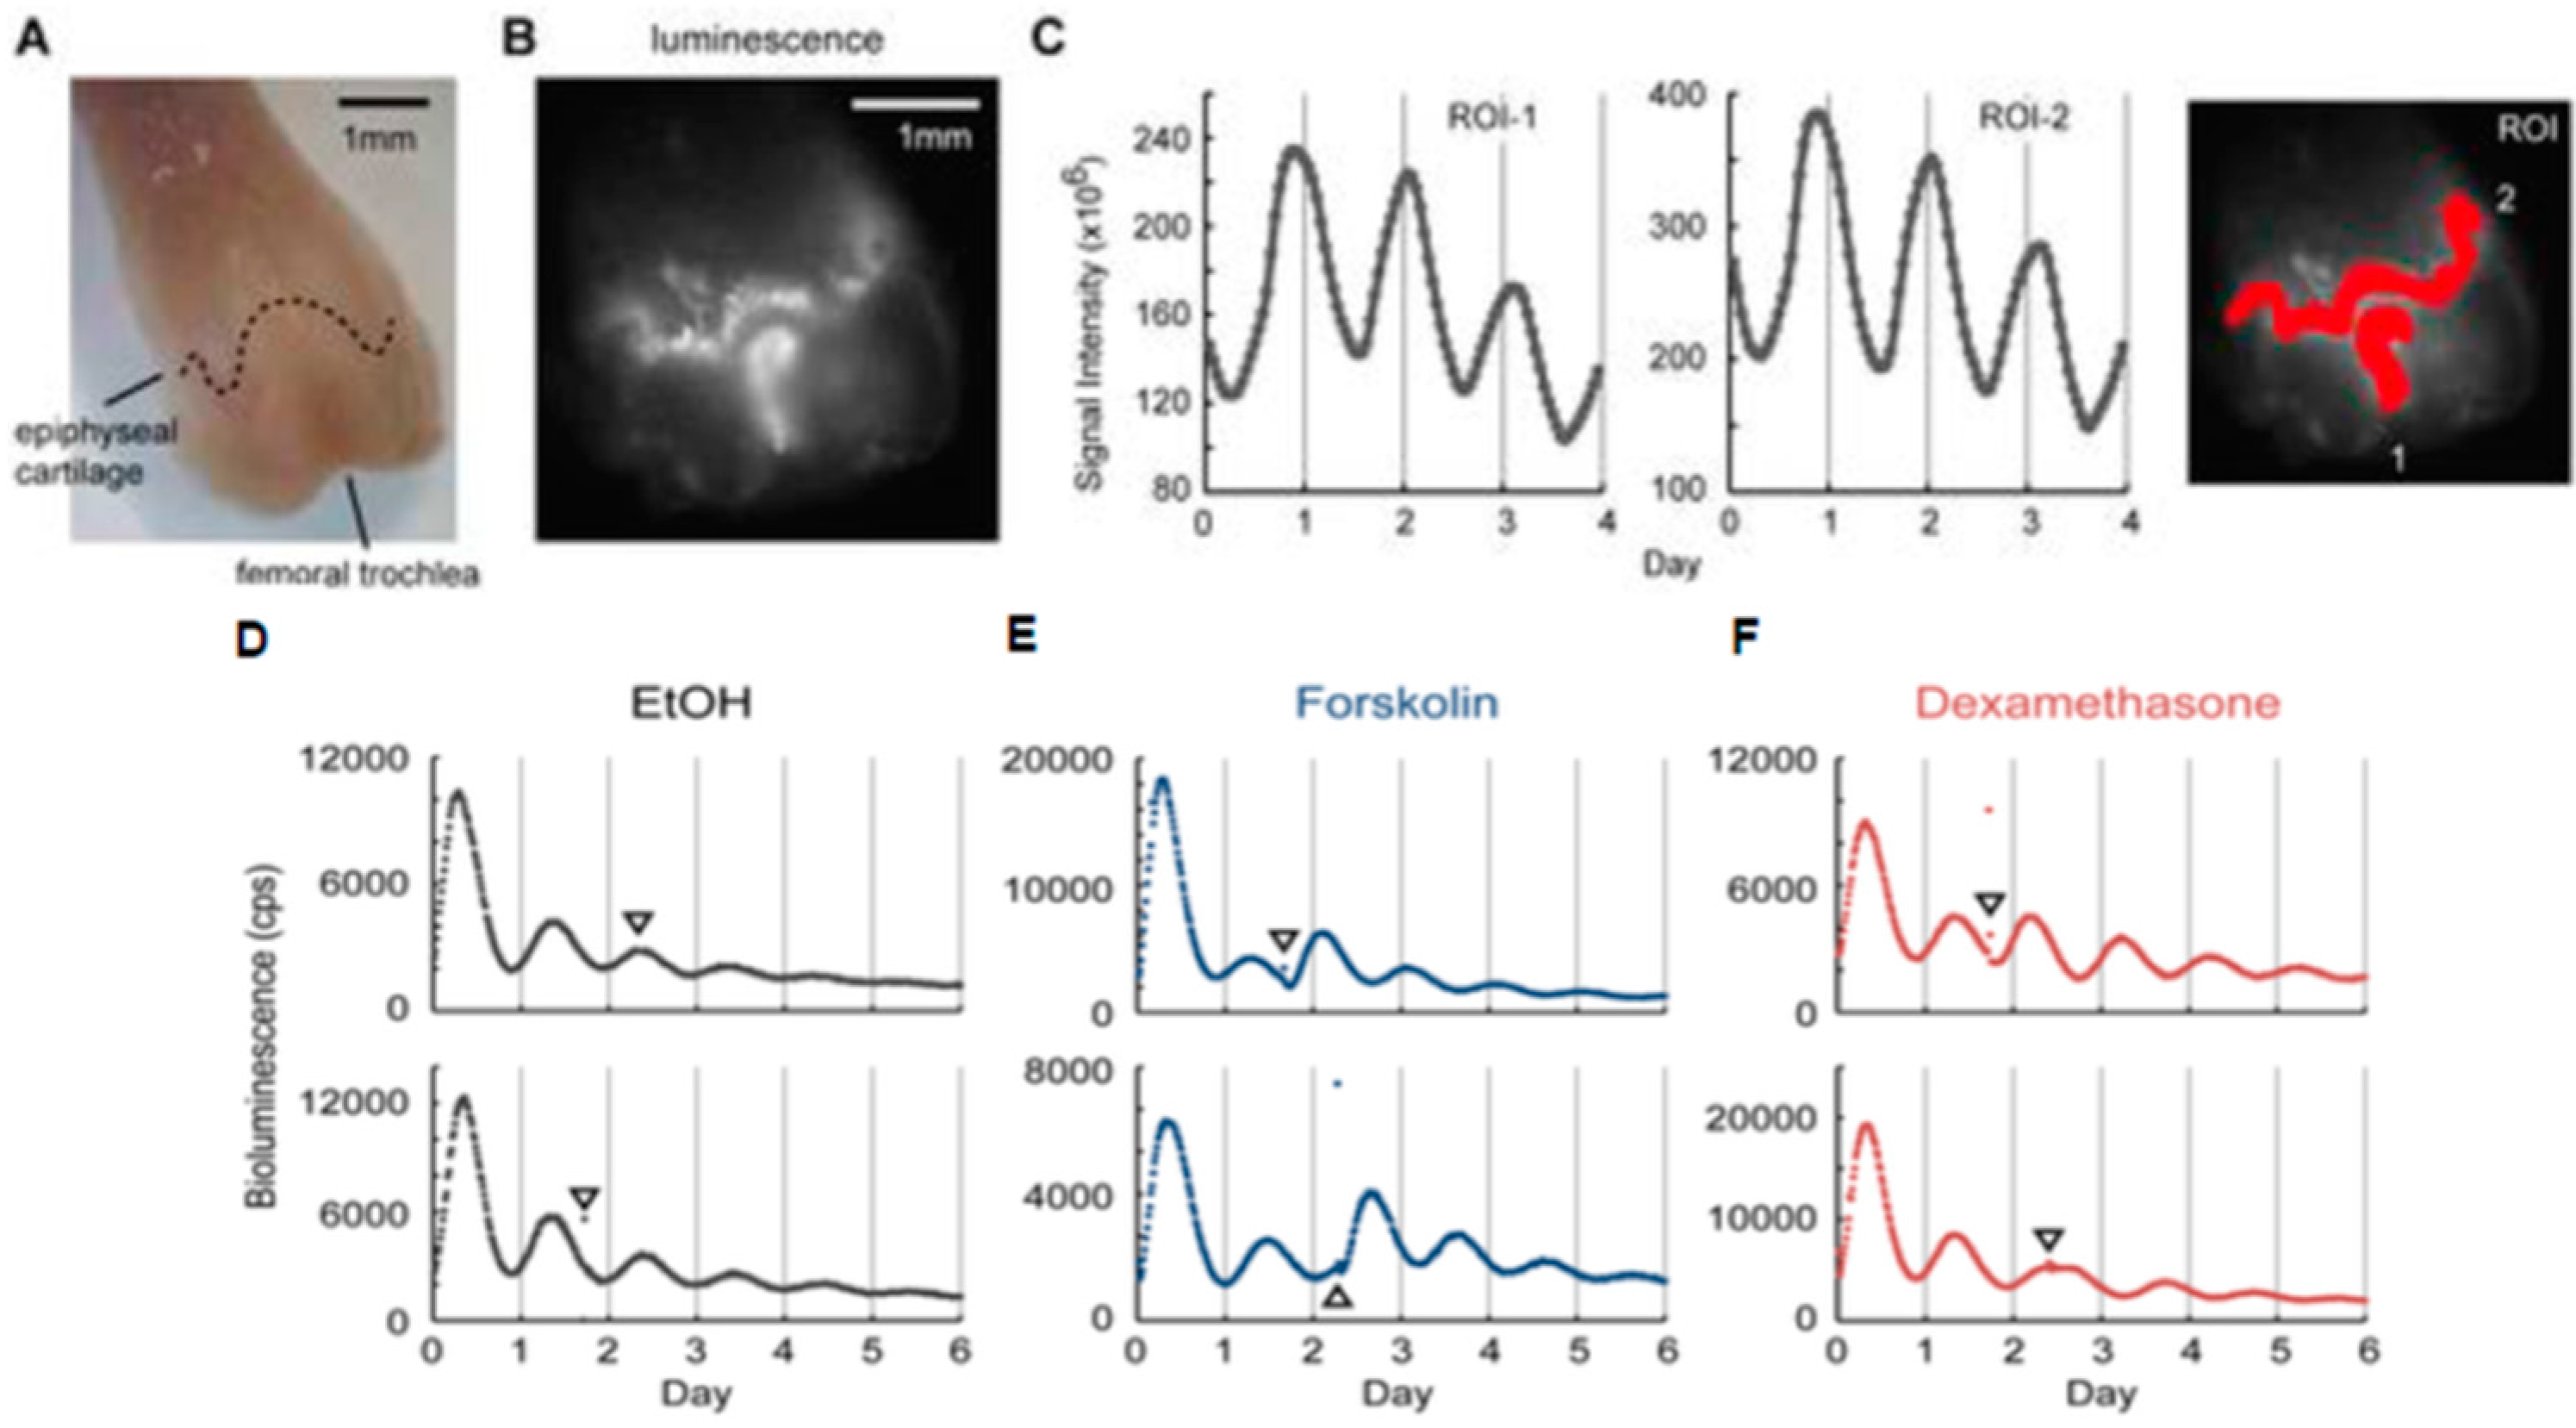
3.2. Application into Cartilage Researches

The discovery of clock genes and their organization into transcription–translation feedback loops has motivated the development of techniques to monitor messenger ribonucleic acid (mRNA) and protein levels over time. Thus, bioluminescence reporters of clock genes which consist of the luciferase genes under the promoters of clock genes were incorporated into cell or animal models as indicators of clock function [24]. In mammalian research, firefly luciferase has been used typically under the control of promoter elements from the Period1 (Per1), Period2 (Per2) or brain and muscle arnt-like 1 (Bmal1) genes [24]. Dual-color bioluminescence reporter systems using beetle luciferases enabled us to monitor simultaneously Bmal1 and Per2, which are responsible for circadian rhythm [25]. Bioluminescence imaging reported the peripheral tissues exhibit robust circadian rhythms in culture by monitoring gene expression of clock genes [26]. More recently, bioluminescence imaging found autonomous circadian rhythms in explant cultures of xiphoid and femoral head cartilage and that temperature cycles were able to entrain the cartilage circadian rhythm [27], indicating that the temperature response could provide a mechanism by which the central clock can synchronize cartilage rhythms. Our study showed that chondrogenic cell line, ATDC5, which was stably transfected with either the Bmal1-Luc reporter or the Per2-Luc reporter, revealed robust circadian rhythms by dexamethasone treatment but the amplitude of circadian rhythms gradually decreased over time (Figure 2A). Subsequently, we performed single-cell imaging of the rhythmic expression of Bmal1 in the chondrogenic cells by using Brazilian click beetle luciferase (Eluc) which reveals a much brighter signal than Fluc [28]. The bioluminescence imaging of ATDC5 cells stably transfected with the Bmal1-Eluc reporter found that Bmal1 oscillations in individual cells were synchronized by dexamethasone treatment but showed the decrease in their amplitudes and the gradual desynchronization over time (Figure 2B). Furthermore, bioluminescence imaging of chondrogenic cells also showed that the circadian clock was strongly reset by parathyroid hormone in a circadian time-dependent manner [29]. In addition, the study using a Per2-Luc transgenic mouse showed that Per2 expression continues to oscillate with circadian rhythms in the articular cartilage tissues for several months (Figure 3A–C) and that cartilage clocks were reset by forskolin and dexamethasone in a time-specific manner (Figure 3D–F), which suggests that hormones such as glucocorticoids play a role as internal time-cues for the circadian clock in cartilage tissues [30].
Bioluminescence imaging, which can monitor changes in gene expression of cells implanted in animal models, facilitates the development of cell therapies for tissue regeneration. In cartilage development, type II procollagen (COL2A1) gene expression is known to be upregulated by sex determining region Y-box (Sox) 9, L-Sox5 and Sox6 in response to environmental signals [31], which suggests that COL2A1 is a marker of chondrogenesis [32]. To monitor cartilage formation in an animal model, progenitor cells were transfected with both the Fluc under the control of the COL2A1 promoter as a reporter of chondrogenic marker and Rluc under the control of a cytomegalovirus promoter as a reporter of cell proliferation [33]. In vivo bioluminescence monitoring also showed that the Pluc/Rluc ratio represents changes in gene expression of aggrecan in the mice implanted with the CL1 cell line and MSCs, which revealed different patterns of in vivo chondrogenesis. In addition, it was shown that both bioluminescent signal intensity and area decreased with natural aging from 2 to 13 months, indicating that the bioluminescence intensity can be used as a quantitative indicator of regenerated tissues during cartilage regeneration [34].

4. Realtime Monitoring of Biomolecules

4.1. Principles

ATP serves numerous vital functions as the central molecule of metabolism in the cell because molecules used as energy sources, for instance glucose, are broken down in the cell, and the energy obtained from them is stored in the phosphate-anhydride bonds of ATP [35]. ATP also maintains the proper concentrations of other nucleotides. ATP is interchanged into the other NTPs, which are incorporated into DNA and RNA. In addition, extracellular ATP functions as an autocrine/paracrine signaling molecule which regulates many physiological functions [36]. Ligand-gated ionic channels, P2X receptors, which have been identified mainly in neurons and muscle cells, respond to ATP directly by activating depolarizing currents [37,38]. Thus, ATP detection assays are crucial for understanding many physiological and pathological conditions [39,40,41]. Beetle luciferases which catalyze the oxidation of the luciferin by using ATP in the presence of O2 and Mg2+ to emit luminescence have been widely used as an excellent ATP reporter for detecting intracellular ATP levels [6,7]. Previous studies showed that the beetle luciferases under the control of a constitutive promoter can be used for monitoring intracellular ATP level in real time [42,43], which indicates that the beetle luciferases can continuously monitor intracellular ATP levels. Luciferase-based assays can also detect ATP-converting reactions such as oxidative phosphorylation, photophosphorylation [44].
Ca2+ is an intracellular signal molecule that regulates differentiation, secretion, contraction, cellular excitability and gene expression. Ca2+ regulates many intracellular processes in the cytosol and inside organelles such as endoplasmic and sarcoplasmic reticulums, mitochondrias, endosomes, Golgi apparatus, and lysosomes [45,46]. Therefore, accurate measurement of the Ca2+ levels inside the organelles is important for understanding the physiological functions of Ca2+ signals. Since aequorin, which is the protein-based Ca2+ indicator isolated from the jellyfish Aequorea forskalea, was firstly used in the early 1970s [47], several Ca2+-binding photoproteins have been used to measure Ca2+ levels [48,49]. In comparison to synthetic fluorescence dyes, the advantage of the protein-based Ca2+ indicators is their ability to be targeted to specific intracellular locations by coupling to specific promoters and targeting sequences [50]. Furthermore, the protein-based Ca2+ indicators enable not only long-term imaging of Ca2+ signals in specific subcellular compartments and intact living animals, but also repeated imaging of the same living organisms. Aequorin emits blue light (465 nm) when Ca2+ binds to at least two sites among three Ca2+-binding sites of aequorin [51], the molecular oxygen in aequorin is released, and then the coelenterazine is oxidized to coelenteramide [52]. Thus, aequorin has been widely used for detecting Ca2+ levels in living organisms [53,54,55]. Recent work also developed fluorescent Ca2+ sensors by combining an improved GFP variant and aequorin [56].
Cyclic adenosine 3′,5′-monophosphate (cAMP) functions as one of the principal signal molecules by regulating a number of signal pathways, including those activated by G protein-coupled receptors in response to hormones and neurotransmitters [57]. Thus, biochemical cAMP assays have been developed for basic research and drug discovery. The cAMP reporter based on bioluminescent enzymes used N-terminal fragments of a click beetle luciferase from Brazil (ELucN) and one from Jamaica (CBRN) and one C-terminal fragment of carboxy-terminal fragment engineered from click beetle luciferase (McLuc1) which dimerize with the above N-terminal fragments, forming two distinct luminescent enzymes with different emission peaks well-separated from each other [58]. In this cAMP reporter, the cAMP-binding domain of PKA (RIIβ) was used for sensing cAMP levels. McLuc1 and ElucN form a functional enzyme to emit red light (613 nm) in the absence of cAMP. cAMP binding to PKA RIIβ of the cAMP reporter results in conformational rearrangement, driving separation of the red light-producing luciferase and migration of McLuc1 toward CBRN, which consequently emits green light (538 nm). Thus, cAMP levels could be expressed by red/green ratio. Other cAMP luminescent indicators were also developed by using a circularly permutated variant of a Fluc fused with cAMP-binding domain B of PKA RIIβB [59,60]. These cAMP reporters are very highly-sensitive cAMP sensors with a detection limit in low nanomolar range and also have high signal/noise ratio [60], which enables real-time monitoring of cAMP dynamics in living organisms.

4.2. Application to Cartilage Research

Continuous monitoring of biomolecules during chondrogenesis offers the exciting possibility to clarify the mechanism underlying cartilage regeneration. Prechondrogenic condensation is the most critical process for skeletal patterning during limb development [61,62]. Since the secreted molecules such as adhesion molecules and extracellular matrix (ECM) are considered to be strictly controlled to determine the patterns of condensations during cartilage formation, how secretory activity is regulated during chondrogenesis was examined by monitoring the dynamics of intracellular ATP which is required for secretion processes [63,64]. Bioluminescence monitoring using a Phrixothrix hirtus red luciferase (PxRe)-based ATP reporter showed that intracellular ATP level oscillates in chondrogenesis ([65]; Figure 4A). In addition, a dual-color bioluminescence assay which simultaneously monitors both ATP and oxygen levels in real time was developed by using PxRe to emit red and Rluc to emit blue light [66]. In this dual-color monitoring analysis, Rluc oscillations revealed troughs roughly corresponding with the peak of PxRe oscillations during chondrogenesis (Figure 4B), which can be explained by the fact that ATP is synthesized by oxygen consumption in mitochondria. However, Rluc oscillations also had an additional mode with a large phase difference relative to PxRe oscillations (Figure 4B), indicating the oscillations of non-mitochondrial oxygen consumption in chondrogenesis [67]. Since it was demonstrated that metabolic intermediates involved in glycolysis oscillate during chondrogenesis [65], the glycolytic oscillations may drive the non-mitochondrial oxygen oscillations. However, oxygen consumption by peroxidases and plasma membrane-bound NADPH-oxidase may be involved in non-mitochondrial oxygen oscillations.
Similarly, by using a blue-emitting aequorin and a red-emitting PxRe luciferase, intracellular Ca2+ and ATP levels were simultaneously monitored during chondrogenesis [67]. The results showed that both Ca2+ and ATP levels oscillated and Ca2+ oscillations were nearly antiphase to ATP oscillations ([67]; Figure 4C). It was known that Ca2+ stimulates Ca2+ pumps and other intracellular reactions such as exocytosis, which leads to ATP consumption. Moreover, Ca2+ can suppress ATP synthesis by inhibiting glycolytic enzymes and collapsing mitochondrial membrane potential [68,69]. Likewise, the decrease in Ca2+ level can reduce ATP consumption and increase ATP production [70]. This positive Ca2+ effect on ATP consumption and the negative Ca2+ effect on ATP production can explain the antiphase relationship between Ca2+ and ATP oscillations.

5. Real-Time Monitoring of Exocytotic Activity

5.1. Principles

Molecular imaging of exocytotic activities in cells has used total internal reflection fluorescence and two-photon laser scanning microscopy [71,72]. However, these fluorescence methods have limitations in monitoring a limited section of the cells and require continuous light excitation to cause cellular toxicity and photobleaching. Bioluminescence imaging can provide distinct advantages over fluorescence imaging in monitoring protein secretion and other secretory processes in cells because bioluminescence imaging does not require light excitation and thus has no phototoxicity. The visualization of secretion of Cypridina luciferase (Cluc) and Gaussia luciferase (GLuc) was realized in mammalian cells, showing that the secreted luciferases are secreted via the constitutive exocytotic pathways [73,74]. Cluc was thus utilized for imaging neurotransmitter release [75].

5.2. Application to Cartilage Research

Since the secreted molecules including ECM and adhesion molecules must be strictly controlled to determine the skeletal patterns during chondrogenesis, it was examined how secretion activity is regulated during chondrogenesis. Secretory activity was monitored by using a reporter based on the Cluc gene fused to a constitutive promoter. The bioluminescence monitoring system combined with the perfusion culture system was used for simultaneous monitoring of both intracellular ATP level and secreted Cluc levels during chondrogenesis. The result revealed that Cluc secretion oscillated during chondrogenesis ([65]; Figure 5A). The oscillation period of Cluc secretion was the nearly same period ATP oscillations. In addition, 2-deoxy glucose which eliminated ATP oscillations suppressed the Cluc oscillations ([65]; Figure 5B), indicating that the oscillatory secretion is driven by ATP oscillations in chondrogenesis. Furthermore, it was shown that secretion levels of Bone morphogenetic protein 2 (BMP2) and transforming growth factor-β1 (TGF-β1) oscillated during chondrogenesis and that each peak of the oscillatory secretion of BMP2 and TGF-β1 appeared at the peak of ATP oscillations ([76]; Figure 5C,D). However, the oscillatory secretion of the growth factors showed one peak per two or three peaks of ATP oscillations and thus the frequency of their oscillatory secretion was lower than that of ATP oscillations ([76]; Figure 4C,D). This result indicates that the secretion patterns of the growth factors depend on not only secretory activity but also other processes. The oscillatory secretion of growth factors would play a crucial role in prechondrogenic condensation and subsequent skeletal patterning.

6. In Vivo Imaging for Transplanted Cells

6.1. Principles

Cell therapies hold great promise for tissue regeneration. However, before clinical application of the cell therapies, transplanted cells must be monitored in vivo for understanding the mechanism underlying tissue regeneration. In vivo bioluminescence imaging enables quantitative and repetitive measurements of transplanted cells in animal models without a light source to excite fluorophores and thus provides useful information on cell survival, migration, and proliferation and differentiation over time in the same animal models [77]. For example, after transplantation into a murine myocardial infarction model, bone marrow mononuclear cells, mesenchymal stem cells, adipose stromal cells, and skeletal myoblasts which were labelled with bioluminescence reporters were monitored in vivo. It was demonstrated that mononuclear cells revealed higher survival rate and induced better heart function than other cell types [78,79]. However, bioluminenscence imaging has limitaions in its application to in vivo studies due to the differences in bioluminescent output kinetics among subcutaneous injection, tail vein injection and intraperitoneal injection, and the stress and wounding effects associated with repeated luciferin injection. To overcome this limitation, bioluminescence techniques based on the bacterial lux system were developed to produce fully autonomous bioluminescence in a human cell line without the injection of any exogenous substrate [18].

6.2. Application to Cartilage Research

Bioluminescence imaging was used for in vivo cell tracking after the cell sheets made of firefly luciferase-expressing chondrocytes obtained from transgenic rats were transplanted into the knee joint of rats for cartilage regeneration [80]. Bioluminescence imaging showed that the transplanted cells remained in the knee joint and did not migrate to other parts of the body, which confirms the safety of the chondrocyte sheets ([80]; Figure 6). In vivo bioluminescence imaging also examined the potential effect of gene delivery on cartilage treatment. The in vivo imaging showed that the adeno-associated virus-mediated intra-articular transgene can be stably expressed through a single intra-articular injection and can be regulated by using a tetracycline-inducible system in a rat model [81], which indicates that the adeno-associated virus-mediated system has a clinical potential for inflammatory and degenerative arthritis.

7. Potential Applications of Bioluminescence Assays for Cartilage Regeneration

Understanding how proteins interact during cartilage formation is crucial for biological and medical research on cartilage regeneration. Bioluminescence resonance energy transfer (BRET) which is based on energy transfer between a donor and an acceptor is useful for protein–protein interaction [82]. BRET allows the detection of interactions between fusion proteins without external fluorescence excitation [83], and thus could identify protein–protein interaction, which play crucial roles for chondrogenesis. In addition, bioluminescence imaging can monitor successfully the post-transcriptional events such as RNA processing and splicing, which are known to regulate cartilage formation. For example, mRNA stability can be monitored by fusing a luciferase reporter to the 3’ untranslated region of an interested gene [84]. Furthermore, the continuous improvement of the lux system to produce a bioluminescent signal without exogenous substrate for functions in eukaryotic cells will be useful in basic and applied scientific research for cartilage regeneration. Further study using these bioluminescence systems will provide the useful information for understanding the mechanism underlying chondrogenic differentiation and cartilage regeneration.

8. Conclusions

Bioluminescence assays can be applied readily into most cell and tissue types because luciferases can be expressed and luciferin easily permeates into most cells and tissue types, which makes it a versatile technology for a variety of biomedical research [8]. Furthermore, in vivo bioluminescence imaging has become a powerful technique for the noninvasive monitoring of animal models, which will provide insights into molecular mechanism underlying chondrogenic differentiation to cartilage regeneration. New applications of bioluminescence will continue to deepen our understanding of cartilage regeneration and consequently lead to therapeutic developments in the future.

Acknowledgments

This work was supported by Basic Science Research Program (2016R1D1A1B03935005) through the National Research Foundation of Korea (NRF) funded by the Ministry of Science, ICT and Future Planning.

Conflicts of Interest

The authors declare no conflict of interest.

Abbreviations

OAosteoarthritis
CCCDcooled charged coupled device
FlucPhotinus pyralis (firefly) luciferase
Rlucthe sea pansy Renilla reniformis luciferase
Glucthe marine copepod Gaussia princeps luciferase
PxRePhrixothrix hirtus red luciferase
ClucCypridina luciferase
luxthe bacterial luciferase gene cassette
AAVadeno-associated virus
FRETfluorescence resonance energy transfer
BRETbioluminescence resonance energy transfer

References

  1. O’Driscoll, S.W. Current concepts review—The healing and regeneration of articular cartilage. JBJS 1998, 80, 1795–1812. [Google Scholar] [CrossRef]
  2. Mandelbaum, B.R.; Browne, J.E.; Fu, F.; Micheli, L.; Mosely, J.B.; Erggelet, C.; Minas, T.; Peterson, L. Articular cartilage lesions of the knee. Am. J. Sports Med. 1998, 26, 853–861. [Google Scholar] [PubMed]
  3. Zhang, J.; Dong, S.; Sivak, W.; Sun, H.B.; Tao, K. Stem cells in cartilage regeneration. Stem Cells Int. 2017, 7034726. [Google Scholar] [CrossRef] [PubMed]
  4. Massoud, T.F.; Gambhir, S.S. Molecular imaging in living subjects: Seeing fundamental biological processes in a new light. Genes Dev. 2003, 17, 545–580. [Google Scholar] [CrossRef] [PubMed]
  5. Stephens, D.J.; Allan, V.J. Light microscopy techniques for live cell imaging. Science 2003, 300, 82–86. [Google Scholar] [CrossRef] [PubMed]
  6. Badr, C.E.; Tannous, B.A. Bioluminescence imaging: Progress and applications. Trends Biotechnol. 2011, 29, 624–633. [Google Scholar] [CrossRef] [PubMed]
  7. Marques, S.M.; Esteves da Silva, J.C. Firefly bioluminescence: A mechanistic approach of luciferase catalyzed reactions. IUBMB Life 2009, 61, 6–17. [Google Scholar] [CrossRef] [PubMed]
  8. Greer, L.F.; Szalay, A.A. Imaging of light emission from the expression of luciferases in living cells and organisms: A review. Luminescence 2002, 17, 43–74. [Google Scholar] [CrossRef] [PubMed]
  9. Prescher, J.A.; Contag, C.H. Guided by the light: Visualizing biomolecular processes in living animals with bioluminescence. Curr. Opin. Chem. Biol. 2010, 14, 80–89. [Google Scholar] [CrossRef] [PubMed]
  10. LI, J.; Chen, L.; Du, L.; Li, M. Cage the firefly luciferin!—A strategy for developing bioluminescent probes. Chem. Soc. Rev. 2013, 42, 662–676. [Google Scholar] [CrossRef] [PubMed]
  11. Shimomura, O.; Teranishi, K. Light-emitters involved in the luminescence of coelenterazine. Luminescence 2000, 15, 51–58. [Google Scholar] [CrossRef]
  12. Badr, C.E.; Hewett, J.W.; Breakefield, X.O.; Tannous, B.A. A highly sensitive assay for monitoring the secretory pathway and ER stress. PLoS ONE 2007, 2, e571. [Google Scholar] [CrossRef] [PubMed]
  13. Wurdinger, T.; Badr, C.; Pike, L.; De Kleine, R.; Weissleder, R.; Breakefield, X.O.; Tannous, B.A. A secreted luciferase for ex vivo monitoring of in vivo processes. Nat. Methods 2008, 5, 171–173. [Google Scholar] [CrossRef] [PubMed]
  14. Villalobos, V.; Naik, S.; Bruinsma, M.; Dothager, R.S.; Pan, M.H.; Samrakandi, M.; Moss, B.; Elhammali, A.; Piwnica-Worms, D. Dual-color click beetle luciferase heteroprotein fragment complementation assays. Chem. Biol. 2010, 17, 1018–1029. [Google Scholar] [CrossRef] [PubMed]
  15. Caysa, H.; Jacob, R.; Müther, N.; Branchini, B.; Messerle, M.; Söling, A. A redshifted codon-optimized firefly luciferase is a sensitive reporter for bioluminescence imaging. Photochem. Photobiol. Sci. 2009, 8, 52–56. [Google Scholar] [CrossRef] [PubMed]
  16. Branchini, B.R.; Southworth, T.L.; DeAngelis, J.P.; Roda, A.; Michelini, E. Luciferase from the Italian firefly Luciola italica: Molecular cloning and expression. Comp. Biochem. Physiol. Biochem. Mol. Biol. 2006, 145, 159–167. [Google Scholar] [CrossRef] [PubMed]
  17. Nakajima, Y.; Kimura, T.; Sugata, K.; Enomoto, T.; Asakawa, A.; Kubota, H.; Ikeda, M.; Ohmiya, Y. Multicolor luciferase assay system: One-step monitoring of multiple gene expressions with a single substrate. Biotechniques 2005, 38, 891–894. [Google Scholar] [CrossRef] [PubMed]
  18. Close, D.M.; Patterson, S.S.; Ripp, S.; Baek, S.J.; Sanseverino, J.; Sayler, G.S. Autonomous bioluminescent expression of the bacterial luciferase gene cassette (lux) in a mammalian cell line. PLoS ONE 2010, 5, e12441. [Google Scholar] [CrossRef] [PubMed]
  19. Nakajima, Y.; Ohmiya, Y. Bioluminescence assays: Multicolor luciferase assay, secreted luciferase assay and imaging luciferase assay. Expert Opin. Drug Discov. 2010, 5, 835–849. [Google Scholar] [CrossRef] [PubMed]
  20. Robertson, J.B.; Johnson, C.H. Luminescence as a continuous real-time reporter of promoter activity in yeast undergoing respiratory oscillations or cell division rhythms. Yeast Genet. Netw. Methods Protoc. 2011, 734, 63–79. [Google Scholar]
  21. Bronstein, I.; Fortin, J.; Stanley, P.E.; Stewart, G.S.; Kricka, L.J. Chemiluminescent and bioluminescent reporter gene assays. Anal. Biochem. 1994, 219, 169–181. [Google Scholar] [CrossRef] [PubMed]
  22. Hoshino, H.; Nakajima, Y.; Ohmiya, Y. Luciferase-YFP fusion tag with enhanced emission for single-cell luminescence imaging. Nat. Methods 2007, 4, 637–639. [Google Scholar] [CrossRef] [PubMed]
  23. Yasunaga, M.; Nakajima, Y.; Ohmiya, Y. Dual-color bioluminescence imaging assay using green- and red-emitting beetle luciferases at subcellular resolution. Anal. Bioanal. Chem. 2014, 406, 5735–5742. [Google Scholar] [CrossRef] [PubMed]
  24. Welsh, D.K; Kay, S.A. Bioluminescence imaging in living organisms. Curr. Opin. Biotechnol. 2005, 16, 73–78. [Google Scholar] [CrossRef] [PubMed]
  25. Kwon, H.; Enomoto, T.; Shimogawara, M.; Yasuda, K.; Nakajima, Y.; Ohmiya, Y. Bioluminescence imaging of dual gene expression at the single-cell level. BioTechniques 2010, 48, 460–462. [Google Scholar] [CrossRef] [PubMed]
  26. Yoo, SH.; Yamazaki, S.; Lowrey, P.L.; Shimomura, K.; Ko, C.H.; Buhr, E.D.; Siepka, S.M.; Hong, H.K.; Oh, W.J.; Yoo, O.J.; et al. PERIOD2: LUCIFERASE real-time reporting of circadian dynamics reveals persistent circadian oscillations in mouse peripheral tissues. Proc. Natl. Acad. Sci. USA 2004, 101, 5339–5346. [Google Scholar] [CrossRef] [PubMed]
  27. Gossan, N.; Zeef, L.; Hensman, J.; Hughes, A.; Bateman, J.F.; Rowley, L.; Little, C.B.; Piggins, H.D.; Rattray, M.; Boot-Handford, R.P. The circadian clock in murine chondrocytes regulates genes controlling key aspects of cartilage homeostasis. Arthritis Rheum. 2013, 65, 2334–2345. [Google Scholar] [CrossRef] [PubMed]
  28. Nakajima, Y.; Yamazaki, T.; Nishii, S.; Noguchi, T.; Hoshino, H.; Niwa, K.; Viviani, V.R.; Ohmiya, Y. Enhanced beetle luciferase for high-resolution bioluminescence imaging. PLoS ONE 2010, 5, e10011. [Google Scholar] [CrossRef] [PubMed]
  29. Hosokawa, T.; Tsuchiya, Y.; Okubo, N.; Kunimoto, T.; Minami, Y.; Fujiwara, H.; Umemura, Y.; Koike, N.; Kubo, T; Yagita, K. Robust Circadian Rhythm and Parathyroid Hormone-Induced Resetting during Hypertrophic Differentiation in ATDC5 Chondroprogenitor Cells. Acta Histochem. Cytochem. 2015, 48, 165–171. [Google Scholar] [CrossRef] [PubMed]
  30. Okubo, N.; Minami, Y.; Fujiwara, H.; Umemura, Y.; Tsuchiya, Y.; Shirai, T.; Oda, R.; Inokawa, H.; Kubo, T.; Yagita, K. Prolonged bioluminescence monitoring in mouse ex vivo bone culture revealed persistent circadian rhythms in articular cartilages and growth plates. PLoS ONE 2013, 8, e78306. [Google Scholar] [CrossRef] [PubMed]
  31. Okazaki, K.; Sandell, L.J. Extracellular matrix gene regulation. Clin. Orthop. Relat. Res. 2004, 427, S123–S128. [Google Scholar] [CrossRef]
  32. Lefebvre, V.; Huang, W.; Harley, V.R.; Goodfellow, P.N.; De Crombrugghe, B. SOX9 is a potent activator of the chondrocyte-specific enhancer of the pro alpha1 (II) collagen gene. Mol. Cell. Biol. 1997, 17, 2336–2346. [Google Scholar] [CrossRef] [PubMed]
  33. Vilalta, M.; Jorgensen, C.; Dégano, I.R.; Chernajovsky, Y.; Gould, D.; Noël, D.; Andrades, J.A.; Becerra, J.; Rubio, N.; Blanco, J. Dual luciferase labelling for non-invasive bioluminescence imaging of mesenchymal stromal cell chondrogenic differentiation in demineralized bone matrix scaffolds. Biomaterials 2009, 30, 4986–4995. [Google Scholar] [CrossRef] [PubMed]
  34. Mailhiot, S.E.; Zignego, D.L.; Prigge, J.R.; Wardwell, E.R.; Schmidt, E.E.; June, R.K. Non-invasive quantification of cartilage using a novel in vivo bioluminescent reporter mouse. PLoS ONE 2015, 10, e0130564. [Google Scholar] [CrossRef] [PubMed]
  35. Bridger, W.A.; Henderson, J.F. Cell ATP; John Wiley & Sons: Hoboken, NJ, USA, 1983. [Google Scholar]
  36. Gordon, J.L. Extracellular ATP: Effects, sources and fate. Biochem. J. 1986, 233, 309–319. [Google Scholar] [CrossRef] [PubMed]
  37. Del Puerto, A.; Wandosell, F.G.; Garrido, J.J. Neuronal and glial purinergic receptors functions in neuron development and brain disease. Front. Cell. Neurosci. 2013, 7, 197. [Google Scholar] [CrossRef] [PubMed]
  38. Coddou, C.; Yan, Z.; Obsil, T.; Huidobro-Toro, J.P.; Stojilkovic, S.S. Activation and regulation of purinergic P2X receptor channels. Pharmacol. Rev. 2011, 63, 641–683. [Google Scholar] [CrossRef] [PubMed]
  39. Lundin, A. Use of firefly luciferase in ATP-related assays of biomass, enzymes, and metabolites. Methods Enzymol. 2000, 305, 346–370. [Google Scholar] [PubMed]
  40. Crouch, S.P.M.; Kozlowski, R.; Slater, K.J.; Fletcher, J. The use of ATP bioluminescence as a measure of cell proliferation and cytotoxicity. J. Immunol. Methods 1993, 160, 81–88. [Google Scholar] [CrossRef]
  41. Dexter, S.J.; Cámara, M.; Davies, M.; Shakesheff, K.M. Development of a bioluminescent ATP assay to quantify mammalian and bacterial cell number from a mixed population. Biomaterials 2003, 24, 27–34. [Google Scholar] [CrossRef]
  42. Ainscow, E.K.; Rutter, G.A. Glucose-stimulated oscillations in free cytosolic ATP concentration imaged in single islet β-cells. Diabetes 2002, 51, S162–S170. [Google Scholar] [CrossRef]
  43. Koop, A.; Cobbold, P.H. Continuous bioluminescent monitoring of cytoplasmic ATP in single isolated rat hepatocytes during metabolic poisoning. Biochem. J. 1993, 295, 165–170. [Google Scholar] [CrossRef] [PubMed]
  44. Turner, D.E.; Daugherity, E.K.; Altier, C.; Maurer, K.J. Efficacy and limitations of an ATP-based monitoring system. J. Am. Assoc. Lab. Anim. Sci. 2010, 49, 190–195. [Google Scholar] [PubMed]
  45. Clapham, D.E. Calcium signaling. Cell 2007, 131, 1047–1058. [Google Scholar] [CrossRef] [PubMed]
  46. Rizzuto, R.; Pozzan, T. Microdomains of intracellular Ca2+: Molecular determinants and functional consequences. Physiol. Rev. 2006, 86, 369–408. [Google Scholar] [CrossRef] [PubMed]
  47. Llinás, R.; Blinks, JR.; Nicholson, C. Calcium transient in presynaptic terminal of squid giant synapse: Detection with aequorin. Science 1972, 176, 1127–1129. [Google Scholar] [CrossRef] [PubMed]
  48. Shimomura, O. Bioluminescence in the sea: Photoprotein systems. Symp. Soc. Exp. Biol. 1985, 39, 351–372. [Google Scholar] [PubMed]
  49. Tsuji, F.I.; Ohmiya, Y.; Fagan, T.F.; Toh, H.; Inouye, S. Molecular evolution of the Ca2+ binding photoproteins of the hydrozoa. Photochem. Photobiol. 1995, 62, 657–661. [Google Scholar] [CrossRef] [PubMed]
  50. Hofer, A.M.; Machen, T.E. Technique for in situ measurement of calcium in intracellular inositol 1,4,5-trisphosphate-sensitive stores using the fluorescent indicator mag-fura-2. Proc. Natl. Acad. Sci. USA 1993, 90, 2598–2602. [Google Scholar] [CrossRef] [PubMed]
  51. Inouye, S.; Aoyama, S.; Miyata, T.; Tsuji, F.I.; Sakaki, Y. Overexpression and purification of the recombinant Ca2+-binding protein, apoaequorin. J. Biochem. 1989, 105, 473–477. [Google Scholar] [CrossRef] [PubMed]
  52. Allen, D.G.; Prendergast, F.G. Aequorin luminescence: Relation of light emission to calcium concentration—A calcium-independent component. Science 1977, 195, 996–998. [Google Scholar] [CrossRef] [PubMed]
  53. Rizzuto, R.; Simpson, A.W.; Brini, M.; Pozzan, T. Rapid changes of mitochondrial Ca2+ revealed by specifically targeted recombinant aequorin. Nature 1992, 358, 325–327. [Google Scholar] [CrossRef] [PubMed]
  54. Montero, M.; Brini, M.; Marsault, R.; Alvarez, J.; Sitia, R.; Pozzan, T.; Rizzuto, R. Monitoring dynamic changes in free Ca2+ concentration in the endoplasmic reticulum of intact cells. EMBO J. 1995, 14, 5467–5475. [Google Scholar] [PubMed]
  55. Brini, M.; Murgia, M.; Pasti, L.; Picard, D.; Pozzan, T.; Rizzuto, R. Nuclear Ca2+ concentration measured with specifically targeted recombinant aequorin. EMBO J. 1993, 12, 4813–4819. [Google Scholar] [PubMed]
  56. Rodriguez-Garcia, A.; Rojo-Ruiz, J.; Navas-Navarro, P.; Aulestia, F.J.; Gallego-Sandin, S.; Garcia-Sancho, J.; Alonso, M.T. GAP, an aequorin-based fluorescent indicator for imaging Ca2+ in organelles. Proc. Natl. Acad. Sci. USA 2014, 111, 2584–2589. [Google Scholar] [CrossRef] [PubMed]
  57. McKnight, G.S. Cyclic AMP second messenger systems. Curr. Opin. Cell Biol. 1991, 3, 213–217. [Google Scholar] [CrossRef]
  58. Takeuchi, M.; Nagaoka, Y.; Yamada, T.; Takakura, H.; Ozawa, T. Ratiometric bioluminescence indicators for monitoring cyclic adenosine 3′,5′-monophosphate in live cells based on luciferase-fragment complementation. Anal. Chem. 2010, 82, 9306–9313. [Google Scholar] [CrossRef] [PubMed]
  59. Fan, F.; Binkowski, B.F.; Butler, B.L.; Stecha, P.F.; Lewis, M.K.; Wood, K.V. Novel genetically encoded biosensors using firefly luciferase. ACS Chem. Biol. 2008, 3, 346–351. [Google Scholar] [CrossRef] [PubMed]
  60. Binkowski, B.F.; Butler, B.L.; Stecha, P.F.; Eggers, C.T.; Otto, P.; Zimmerman, K.; Vidugiris, G.; Wood, M.G.; Encell, L.P.; Fan, F.; et al. A luminescent biosensor with increased dynamic range for intracellular cAMP. ACS Chem. Biol. 2011, 6, 1193–1197. [Google Scholar] [CrossRef] [PubMed]
  61. Olsen, B.R.; Reginato, A.M.; Wang, W. Bone development. Annu. Rev. Cell Dev. Biol. 2000, 16, 191–220. [Google Scholar] [CrossRef] [PubMed]
  62. Mariani, F.V.; Martin, G.R. Deciphering skeletal patterning: Clues from the limb. Nature 2003, 423, 319–325. [Google Scholar] [CrossRef] [PubMed]
  63. Martin, T.F. Stages of regulated exocytosis. Trends Cell Biol. 1997, 7, 271–276. [Google Scholar] [CrossRef]
  64. Jones, P.M.; Persaud, S.J. Protein Kinases, protein Phosphorylation, and the regulation of insulin secretion from pancreatic β-Cells. Endocr. Rev 1998, 19, 429–461. [Google Scholar] [PubMed]
  65. Kwon, H.J.; Ohmiya, Y.; Honma, K.I.; Honma, S.; Nagai, T.; Saito, K.; Yasuda, K. Synchronized ATP oscillations have a critical role in prechondrogenic condensation during chondrogenesis. Cell Death Dis. 2012, 3, e278. [Google Scholar] [CrossRef] [PubMed]
  66. Kwon, H.J.; Ohmiya, Y.; Yasuda, K. Simultaneous monitoring of intracellular ATP and oxygen levels in chondrogenic differentiation using a dual-color bioluminescence reporter. Luminescence 2014, 29, 1194–1198. [Google Scholar] [CrossRef] [PubMed]
  67. Herst, P.M.; Tan, A.S.; Scarlett, D.J.G.; Berridge, M.V. Cell surface oxygen consumption by mitochondrial gene knockout cells. BBA Bioenerg. 2004, 1656, 79–87. [Google Scholar] [CrossRef] [PubMed]
  68. Kwon, H.J.; Ohmiya, Y.; Yasuda, K. Dual-color system for simultaneously monitoring intracellular Ca2+ and ATP dynamics. Anal. Biochem. 2012, 430, 45–47. [Google Scholar] [CrossRef] [PubMed]
  69. Jung, S.K.; Kauri, L.M.; Qian, W.J.; Kennedy, R.T. Correlated oscillations in glucose consumption, oxygen consumption, and intracellular free Ca2+ in single islets of Langerhans. J. Biol. Chem. 2000, 275, 6642–6650. [Google Scholar] [CrossRef] [PubMed]
  70. Magnus, G.; Keizer, J. Model of β-cell mitochondrial calcium handling and electrical activity. II. Mitochondrial variables. Am. J. Physiol. Cell Physiol. 1998, 274, C1174–C1184. [Google Scholar]
  71. Detimary, P.; Gilon, P.; Henquin, J.C. Interplay between cytoplasmic Ca2+ and the ATP/ADP ratio: A feedback control mechanism in mouse pancreatic islets. Biochem. J. 1998, 333, 269–274. [Google Scholar] [CrossRef] [PubMed]
  72. Burchfield, J.G.; Lopez, J.A.; Mele, K.; Vallotton, P.; Hughes, W.E. Exocytotic vesicle behaviour assessed by total internal reflection fluorescence microscopy. Traffic 2010, 11, 429–439. [Google Scholar] [CrossRef] [PubMed]
  73. Takahashi, N.; Kasai, H. Exocytic process analyzed with two-photon excitation imaging in endocrine pancreas. Endocr. J. 2007, 54, 337–346. [Google Scholar] [CrossRef] [PubMed]
  74. Inouye, S.; Ohmiya, Y.; Toya, Y.; Tsuji, F.I. Imaging of luciferase secretion from transformed Chinese hamster ovary cells. Proc. Natl. Acad. Sci. USA 1992, 89, 9584–9587. [Google Scholar] [CrossRef] [PubMed]
  75. Suzuki, T.; Usuda, S.; Ichinose, H.; Inouye, S. Real-time bioluminescence imaging of a protein secretory pathway in living mammalian cells using Gaussia luciferase. FEBS Lett. 2007, 581, 4551–4556. [Google Scholar] [CrossRef]
  76. Miesenböck, G.; Rothman, J.E. Patterns of synaptic activity in neural networks recorded by light emission from synaptolucins. Proc. Natl. Acad. Sci. USA 1997, 94, 3402–3407. [Google Scholar] [CrossRef] [PubMed]
  77. Kwon, H.J.; Han, Y. Dual monitoring of secretion and ATP levels during chondrogenesis using perfusion culture-combined bioluminescence monitoring system. BioMed Res. Int. 2015, 2015, 6. [Google Scholar] [CrossRef] [PubMed]
  78. Cao, Y.A.; Wagers, A.J.; Beilhack, A.; Dusich, J.; Bachmann, M.H.; Negrin, R.S.; Weissman, I.L.; Contag, C.H. Shifting foci of hematopoiesis during reconstitution from single stem cells. Proc. Natl. Acad. Sci. USA 2004, 101, 221–226. [Google Scholar] [CrossRef]
  79. Van der Bogt, K.E.; Sheikh, A.Y.; Schrepfer, S.; Hoyt, G.; Cao, F.; Ransohoff, K.J.; Swijnenburg, R.J.; Pearl, J.; Lee, A.; Fischbein, M.; et al. Comparison of different adult stem cell types for treatment of myocardial ischemia. Circulation 2008, 118, S121–S129. [Google Scholar] [CrossRef] [PubMed]
  80. Van der Bogt, K.E.; Schrepfer, S.; Yu, J.; Sheikh, A.Y.; Hoyt, G.; Govaert, J.A.; Velotta, J.B.; Contag, C.H.; Robbins, R.C.; Wu, J.C. Comparison of transplantation of adipose tissue-and bone marrow-derived mesenchymal stem cells in the infarcted heart. Transplantation 2009, 87, 642. [Google Scholar] [CrossRef] [PubMed]
  81. Takaku, Y.; Murai, K.; Ukai, T.; Ito, S.; Kokubo, M.; Satoh, M.; Kobayashi, E.; Yamato, M.; Okano, T.; Takeuchi, M.; et al. In vivo cell tracking by bioluminescence imaging after transplantation of bioengineered cell sheets to the knee joint. Biomaterials 2014, 35, 2199–2206. [Google Scholar] [CrossRef] [PubMed]
  82. Payne, K.A.; Lee, H.H.; Haleem, A.M.; Martins, C.; Yuan, Z.; Qiao, C.; Xiao, X.; Chu, C.R. Single intra-articular injection of adeno-associated virus results in stable and controllable in vivo transgene expression in normal rat knees. Osteoarthr. Cartil. 2011, 19, 1058–1065. [Google Scholar] [CrossRef] [PubMed]
  83. Mendelsohn, A.R.; Brent, R. Protein interaction methods--toward an endgame. Science 1999, 284, 1948. [Google Scholar] [CrossRef] [PubMed]
  84. Pfleger, K.D.; Eidne, K.A. Illuminating insights into protein-protein interactions using bioluminescence resonance energy transfer (BRET). Nat. Methods 2006, 3, 165–174. [Google Scholar] [CrossRef] [PubMed]
Figure 1. Bioluminescence imaging of dual gene expression at the single-cell level. (A) The dual-color bioluminescence imaging of NIH3T3 cells cotransfected with the Bmal1-red luciferase plasmid (red) and the Per2-green luciferase plasmid (green), showing circadian rhythms of green and red luminescence, respectively. Each spot is on a separate cell. Scale bar, 20 μm; (B) Representative circadian bioluminescence rhythms from individual NIH3T3 cells cotransfected with Bmal1-pSLR plasmid (red) and Per2-pEluc plasmid (green) for 3–4 days. Each graph represents real-time analysis data of quantitative bioluminescence intensity for the respective spot shown in Figure 1A. Reproduced with permission from [25].
Sensors 17 01306 g001
Figure 2. Bioluminescence imaging of circadian rhythms in chondrogenic cells. (A) The bioluminescence monitoring of ATDC5 cells transfected with the Bmal1-pEluc plasmid or the Per2-pEluc plasmid, shows circadian rhythms. (B) The single-cell imaging of ATDC5 cells transfected with the Bmal1-pEluc plasmid shows circadian rhythms in individual cells.
Sensors 17 01306 g002
Figure 3. Bioluminescence imaging of circadian rhythms in Per2-Luc mouse femur. (A) The overview of the distal half of the femur. The dotted line indicates epiphyseal cartilage. The mirror-reversed image was used for comparison to the bioluminescence image. A sample was obtained from a 16.5-week old mouse and cultured for 6 days before observation. (B) The bioluminescence image obtained by a microscope-based high sensitivity CCCD camera system. (C) A time series analysis of the epiphyseal cartilage (ROI-1) and femoral trochlea (ROI-2). The right panel shows set ROIs. (D–F) Effects of forskolin and dexamethasone (DEX) on circadian clocks. Representative data showing the phase advancement (upper panels) or phase delay of the bone circadian clock (lower panels). The arrowhead indicates chemical administration. From left to right, the vehicle (ethanol; EtOH) (D), DEX (E), or forskolin (F). Reproduced with permission from [30].
Sensors 17 01306 g003
Figure 4. Bioluminescence imaging of ATP, Ca2+ and oxygen during chondrogenesis. (A) Right panel: Bioluminescence imaging at the single-cell level shows that bioluminescent intensities of Actin-Phrixothrix hirtus red luciferase (PxRe) to report intracellular ATP levels in individual cells oscillate collectively by intercellular synchronization during chondrogenesis. Left panel: Time course data of PACTIN-PxRe intensities of individual cells indicated by red squares after chondrogenic induction. Reproduced with permission from [65]. (B) Simultaneous monitoring of intracellular oxygen (blue line) and ATP (red line) levels during chondrogenesis in the micromass culture of mesenchymal stem cells (MSCs) by using an oxygen reporter (PACTIN-Rluc) and ATP reporter (PACTIN-PxRe). Reproduced with permission from [65]. (C) Simultaneous monitoring of intracellular Ca2+ (blue line) and ATP (red line) levels during chondrogenesis in micromass culture of ATDC5 cells using a calcium reporter (aequorin) and ATP reporter (PACTIN-PxRe). Reproduced with permission from [67].
Sensors 17 01306 g004
Figure 5. Simultaneous monitoring of secretory activity and intracellular ATP levels during chondrogenesis. (A) Time course data taken with simultaneous monitoring of PxRe intensity (red line) and secreted Cypridina luciferase (CLuc) intensity (blue line) during perfusion with insulin-implemented medium. Reproduced with permission from [65]. (B) Effect of 2-deoxy glucose (2-DG) treatment on the oscillatory secretion of CLuc during perfusion with insulin-implemented medium. Reproduced with permission from [65]. (C) Simultaneous monitoring of PxRe intensity (red line) and secreted BMP2 levels (blue line) during perfusion with the chondrogenic medium. Reproduced with permission from [76]. (D) Simultaneous monitoring of PxRe intensity (red line) and secreted TGF-β1 levels (blue line) during perfusion with chondrogenic medium. Reproduced with permission from [67]. Reproduced with permission from [76].
Sensors 17 01306 g005
Figure 6. CCD images from the long-term observation of luciferase activity from the right knee joint. This representative image shows the CCD image of one rat from the AC-SY group (transplanted with chondrocyte and synovial cell sheets) at the following time points (from left to right): after transplantation on day 0 and day 4, and at 3, 6, 12, 18, and 21 months. The color bar indicates the bioluminescence intensity in photons per seconds cm2 per steradian. Reproduced with permission from [80].
Sensors 17 01306 g006
Table 1. Comparison of bioluminescence and fluorescence.
AdvantageDisadvantage
FluorescenceSuperior brightnessRequirement of excitation light
Shorter imaging time (miliseconds)High phototoxicity
High photobleaching
High background
Autofluorescence
Autofluorescence
BioluminescenceLow phototoxicity Low brightness
Low background Longer imaging time (minute)
High sensitivity Requirement of substrates
Broad linear range

