Multi-Robot Interfaces and Operator Situational Awareness: Study of the Impact of Immersion and Prediction

 , and
, and
Abstract
:1. Introduction
- The operator is watching a simulation of a multi-robot mission.
- At a certain time of the mission, the simulation is stopped and the interface is blanked.
- The operator is asked a series of questions about the situation.
- After the end of the mission, the real and perceived situations are compared.
- A score is determined in three zones (immediate, intermediate and long-range).
2. State of Art
2.1. Multimodal Interfaces
2.2. Immersive Interfaces
2.3. Adaptive Interfaces
2.4. Design Guidelines
3. Multi-Robot Missions
- Begin: The robot switches on and takes-off.
- Surveillance: The robot flies over an area at high altitude with a back and forth pattern to find potential fires.
- Reconnaissance: The robot flies over a list of points at low altitude to check the previously detected fires.
- Capture: The robot flies to the reservoir, descends and loads water.
- Release: The robot flies to the fire, ascends and discharges water over it.
- Go to WP: The robot flies to a waypoint with other purposes: e.g., to leave free the way of the other robot.
- Tracking: The robot follows the suspect across the scenario at low altitude.
- Finish: The robot lands and switches off.
4. Resources
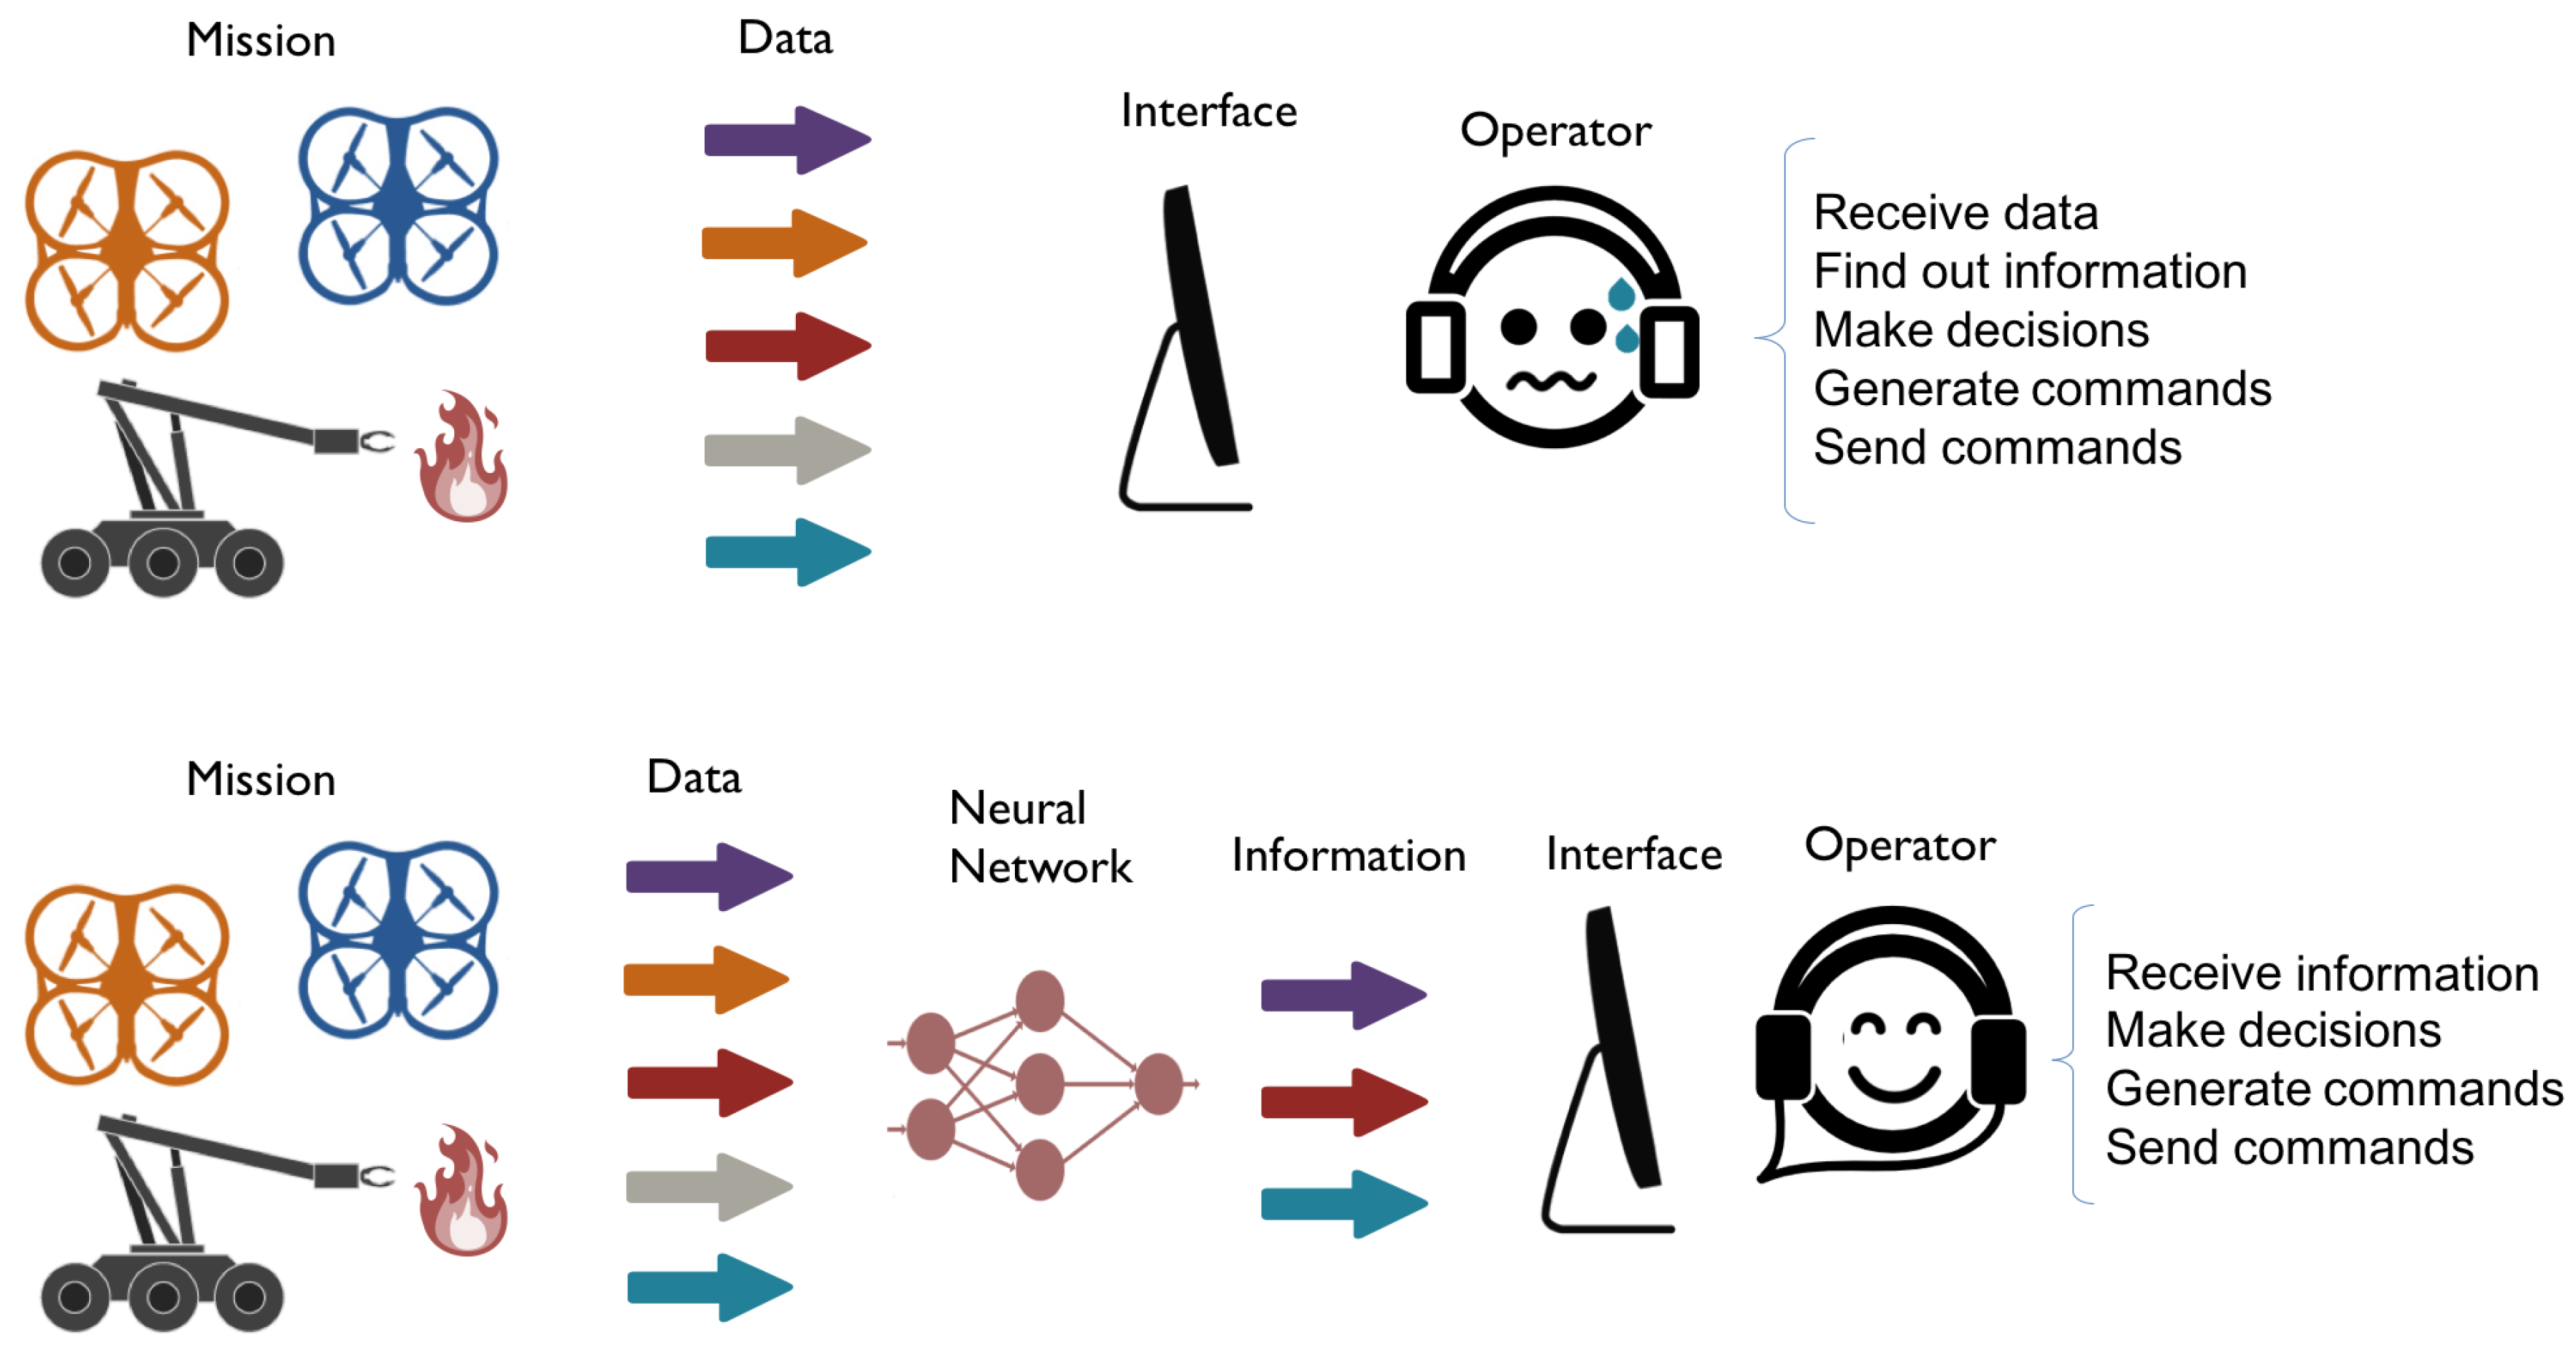
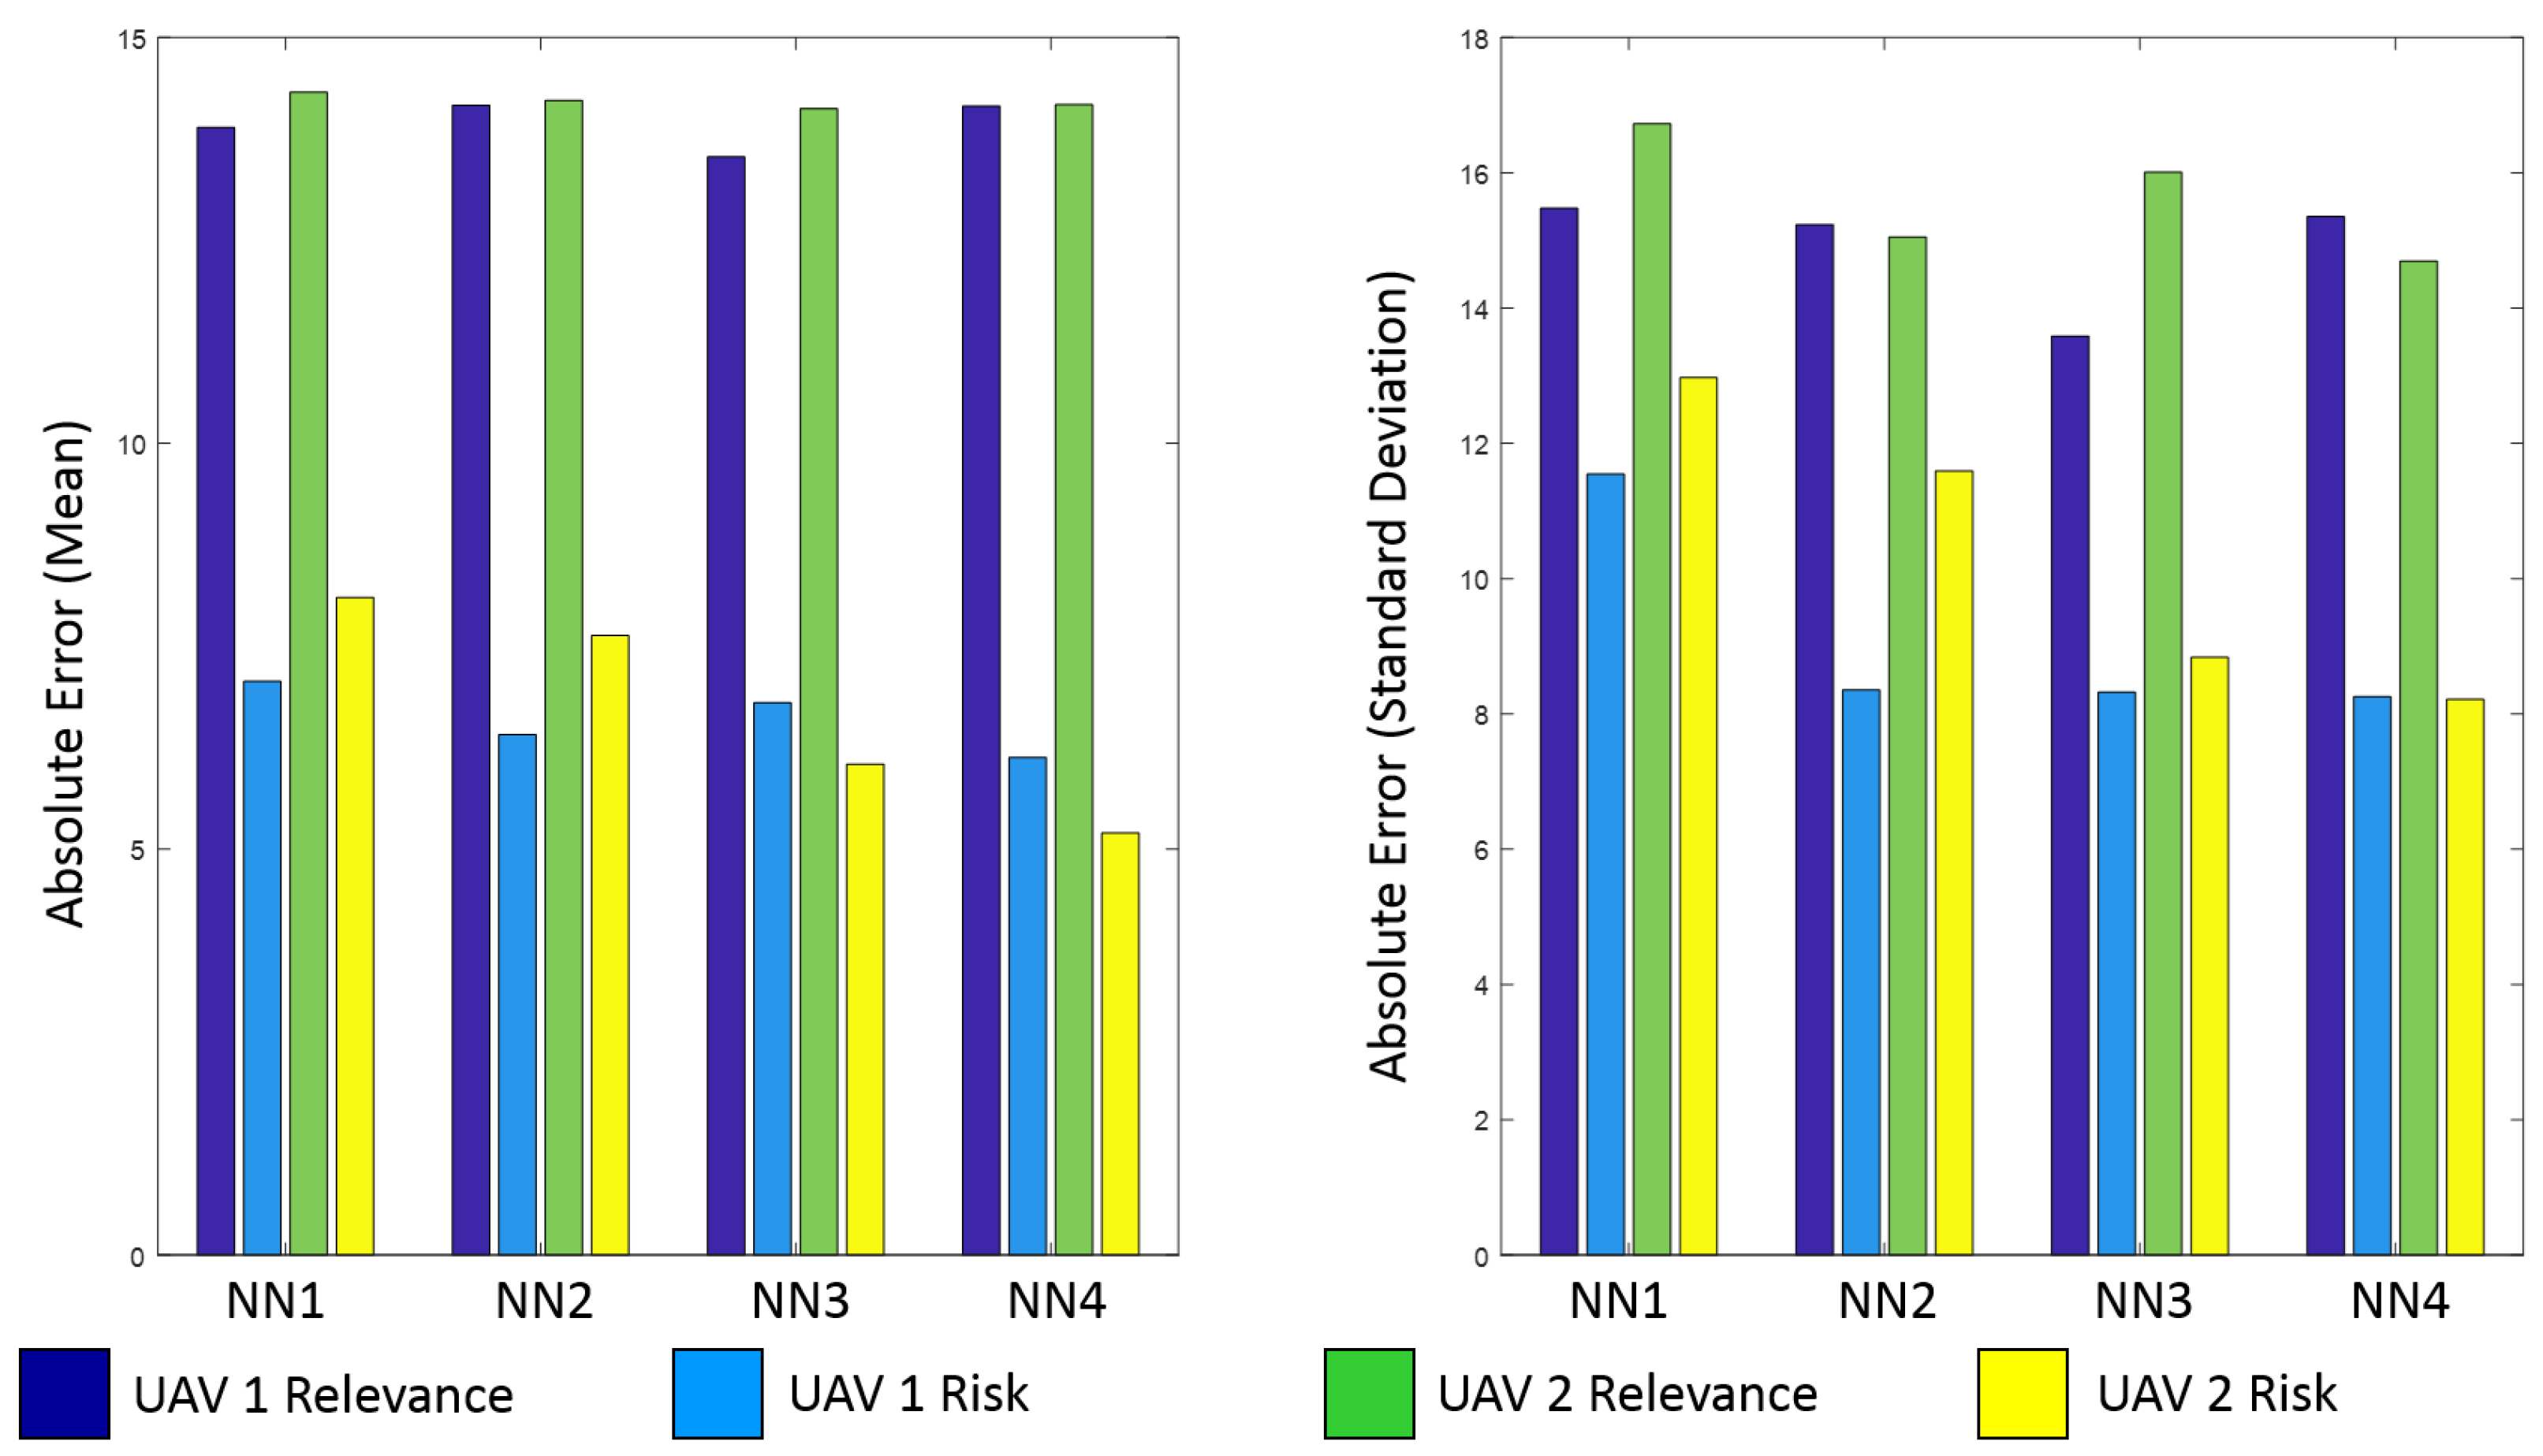
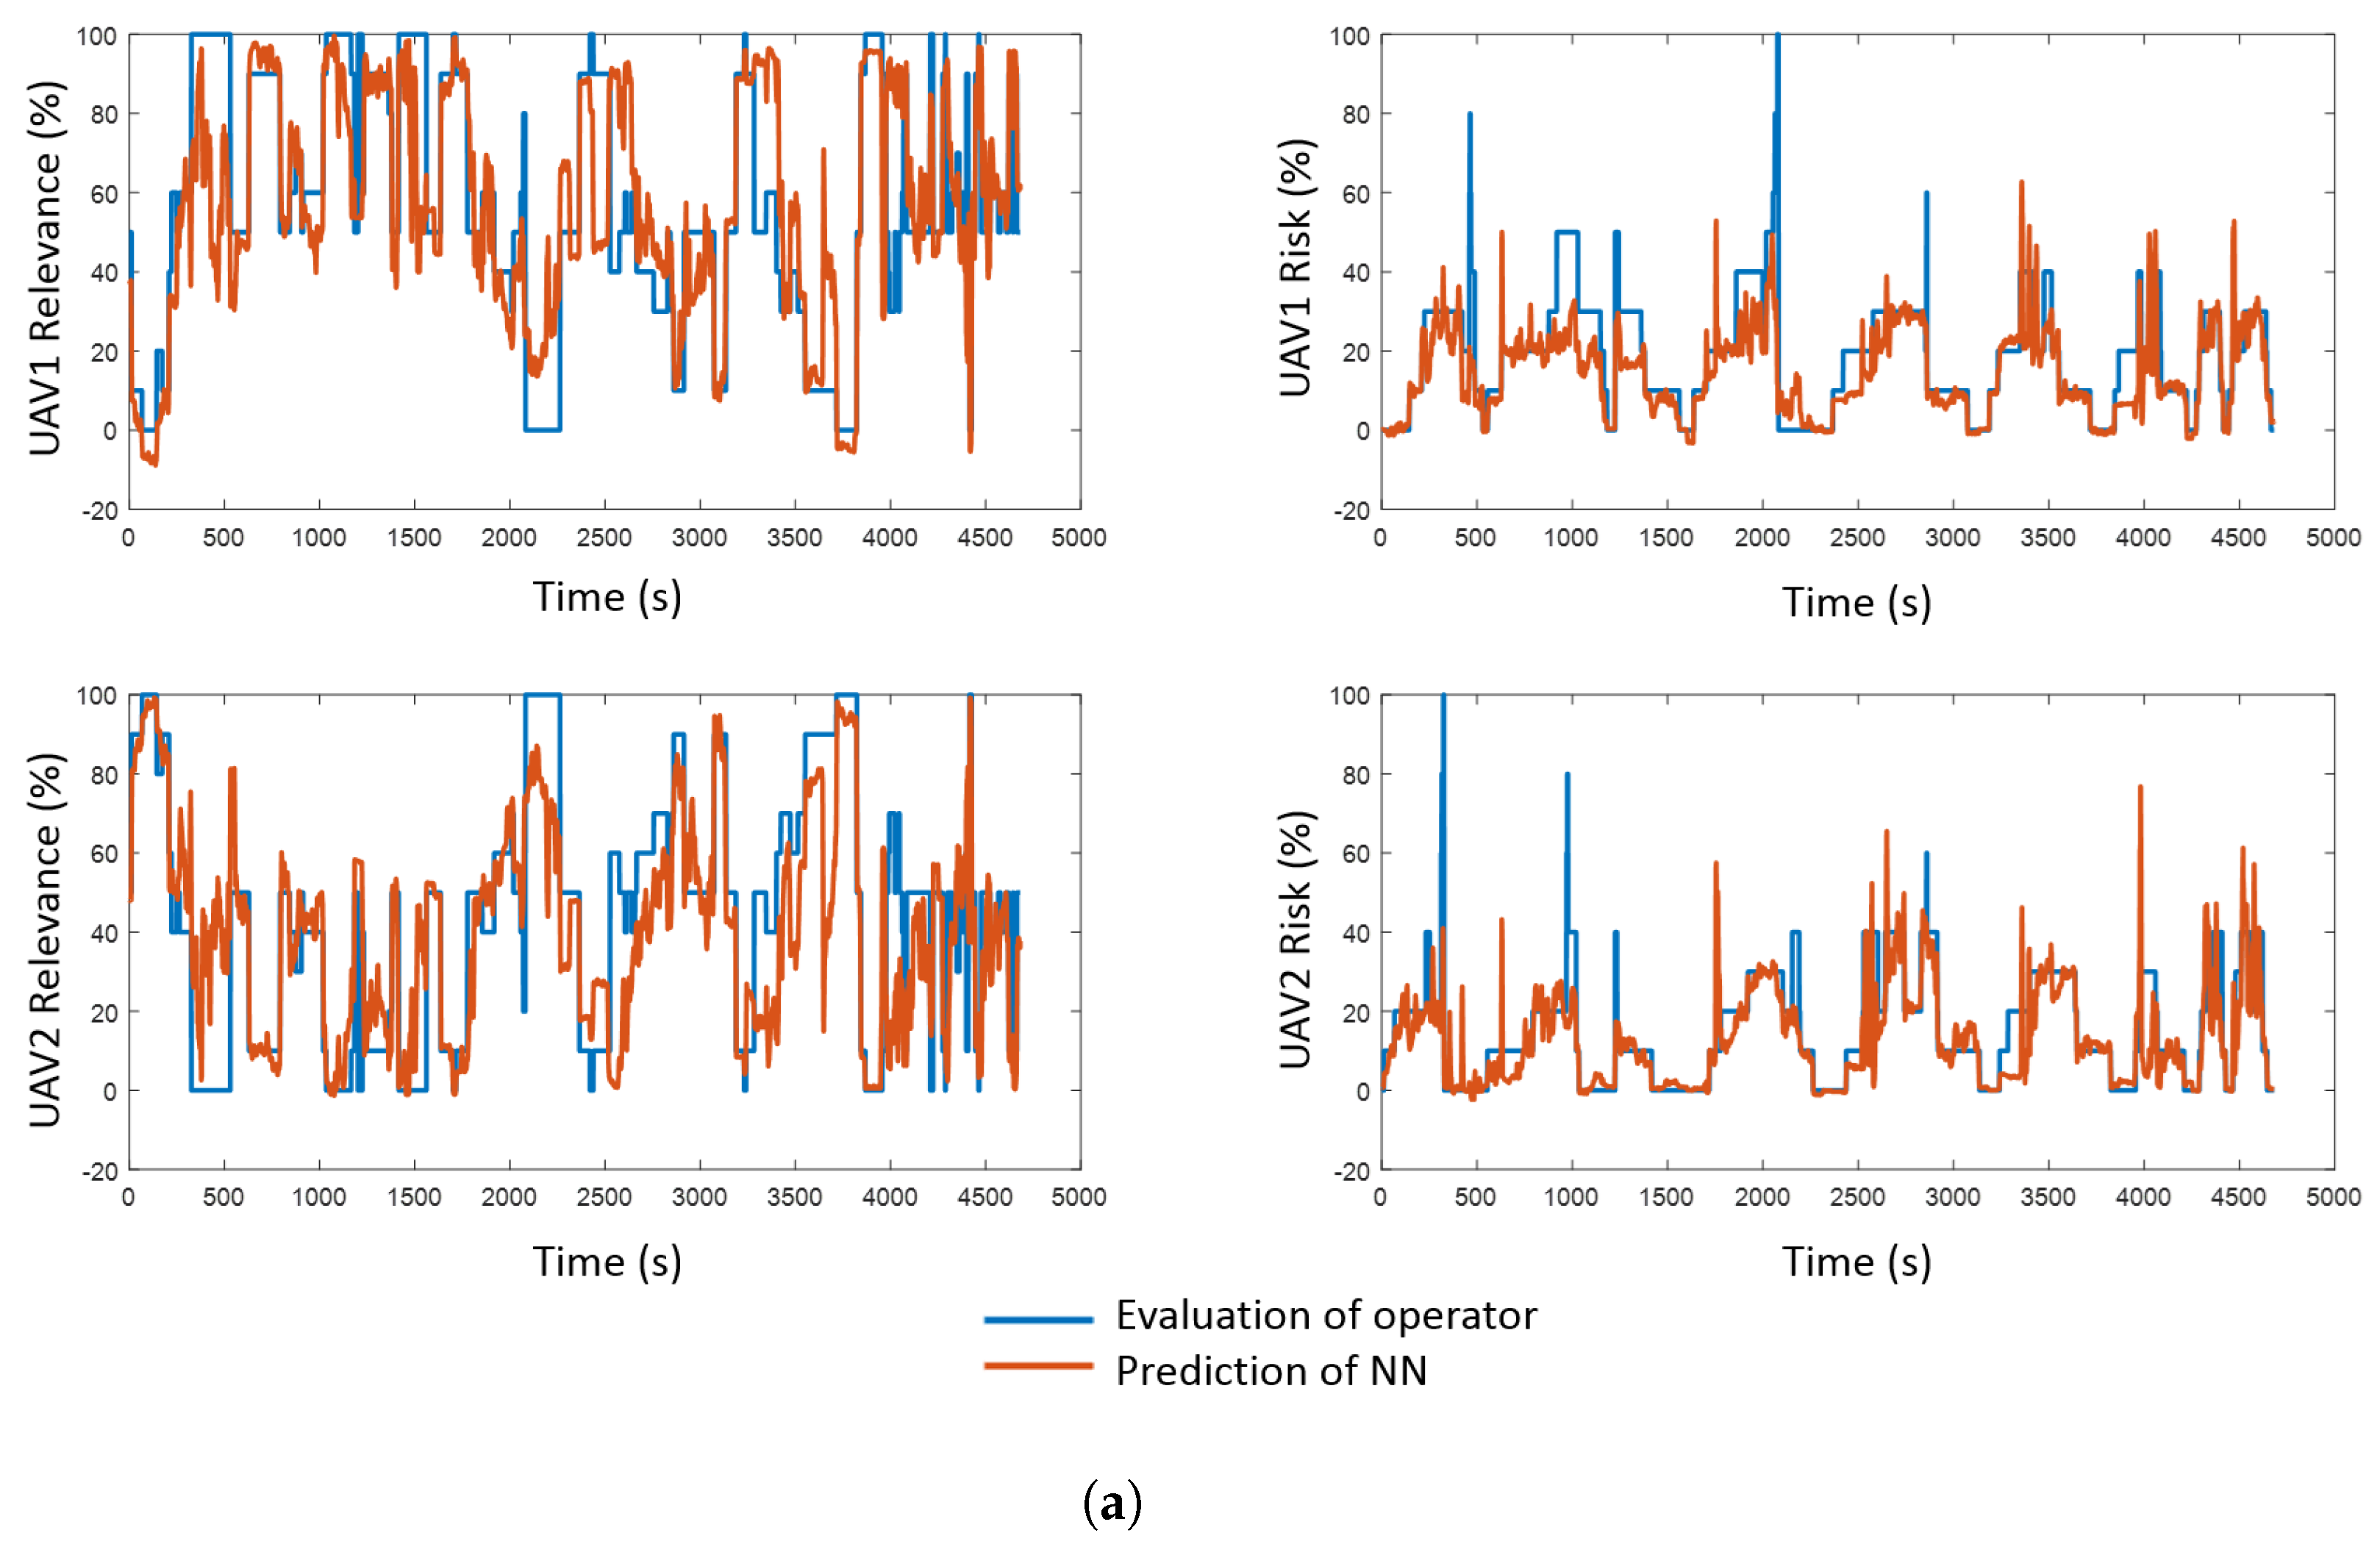
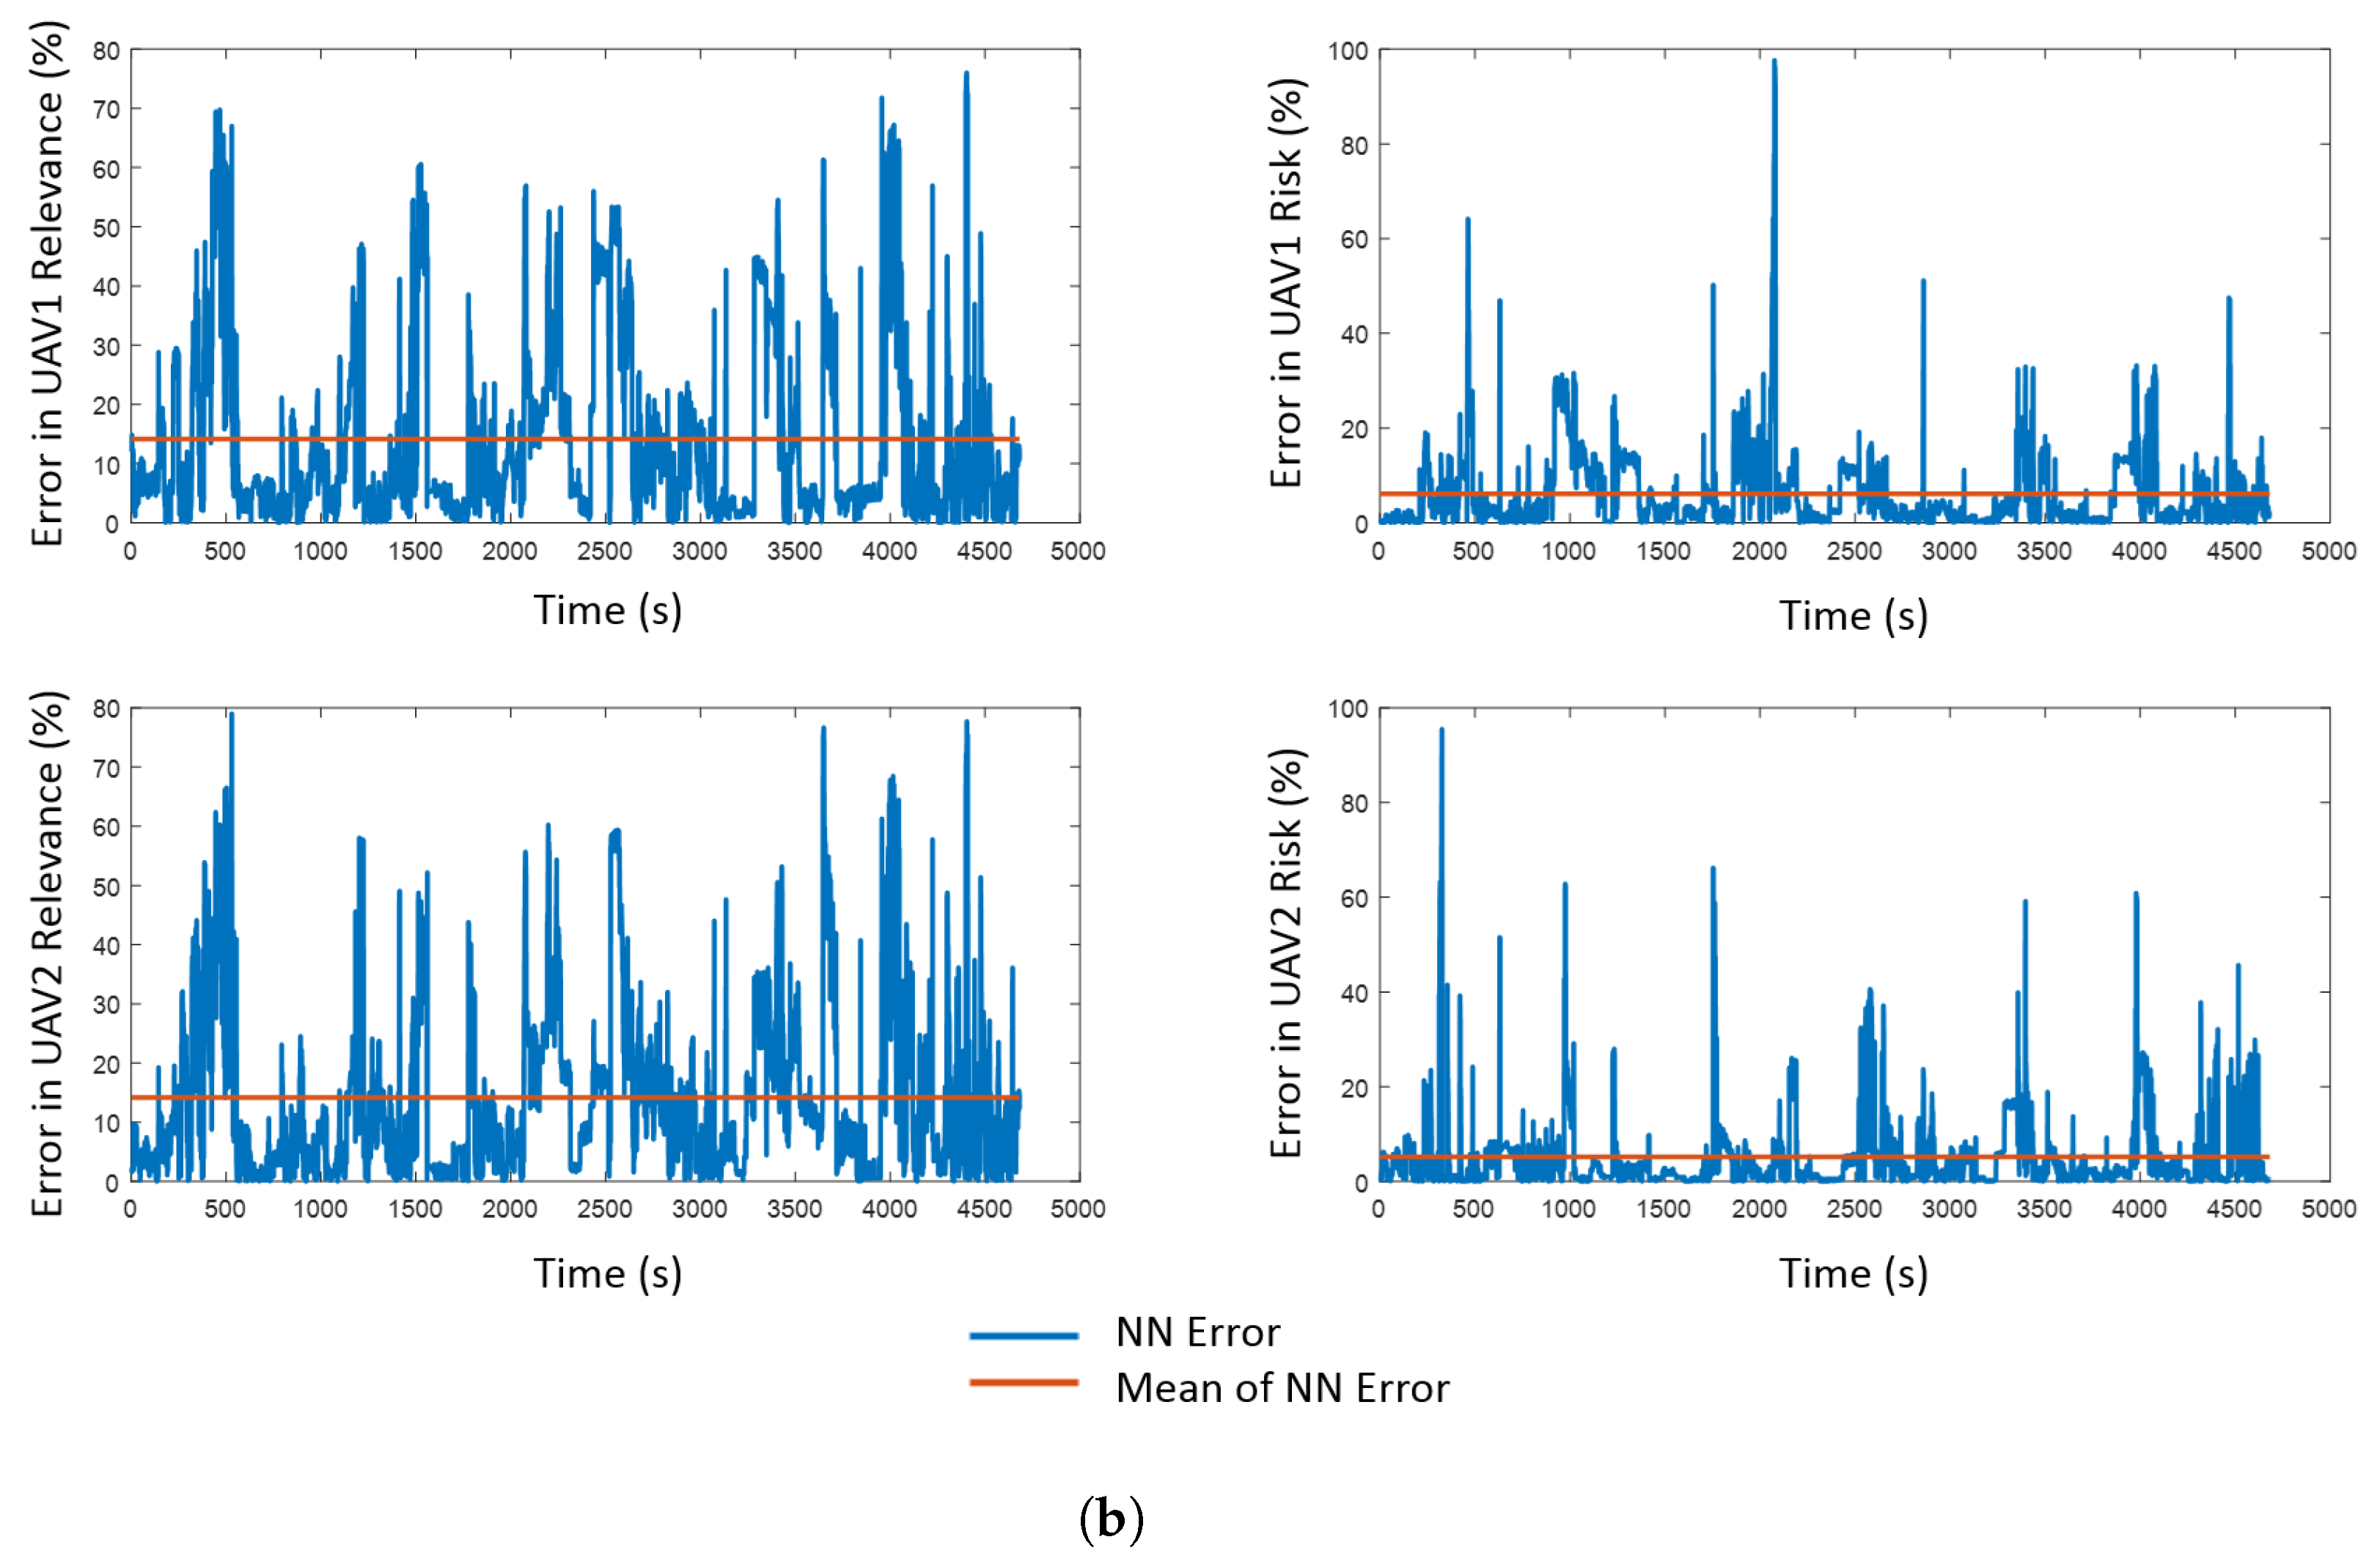
4.1. Predictive Component
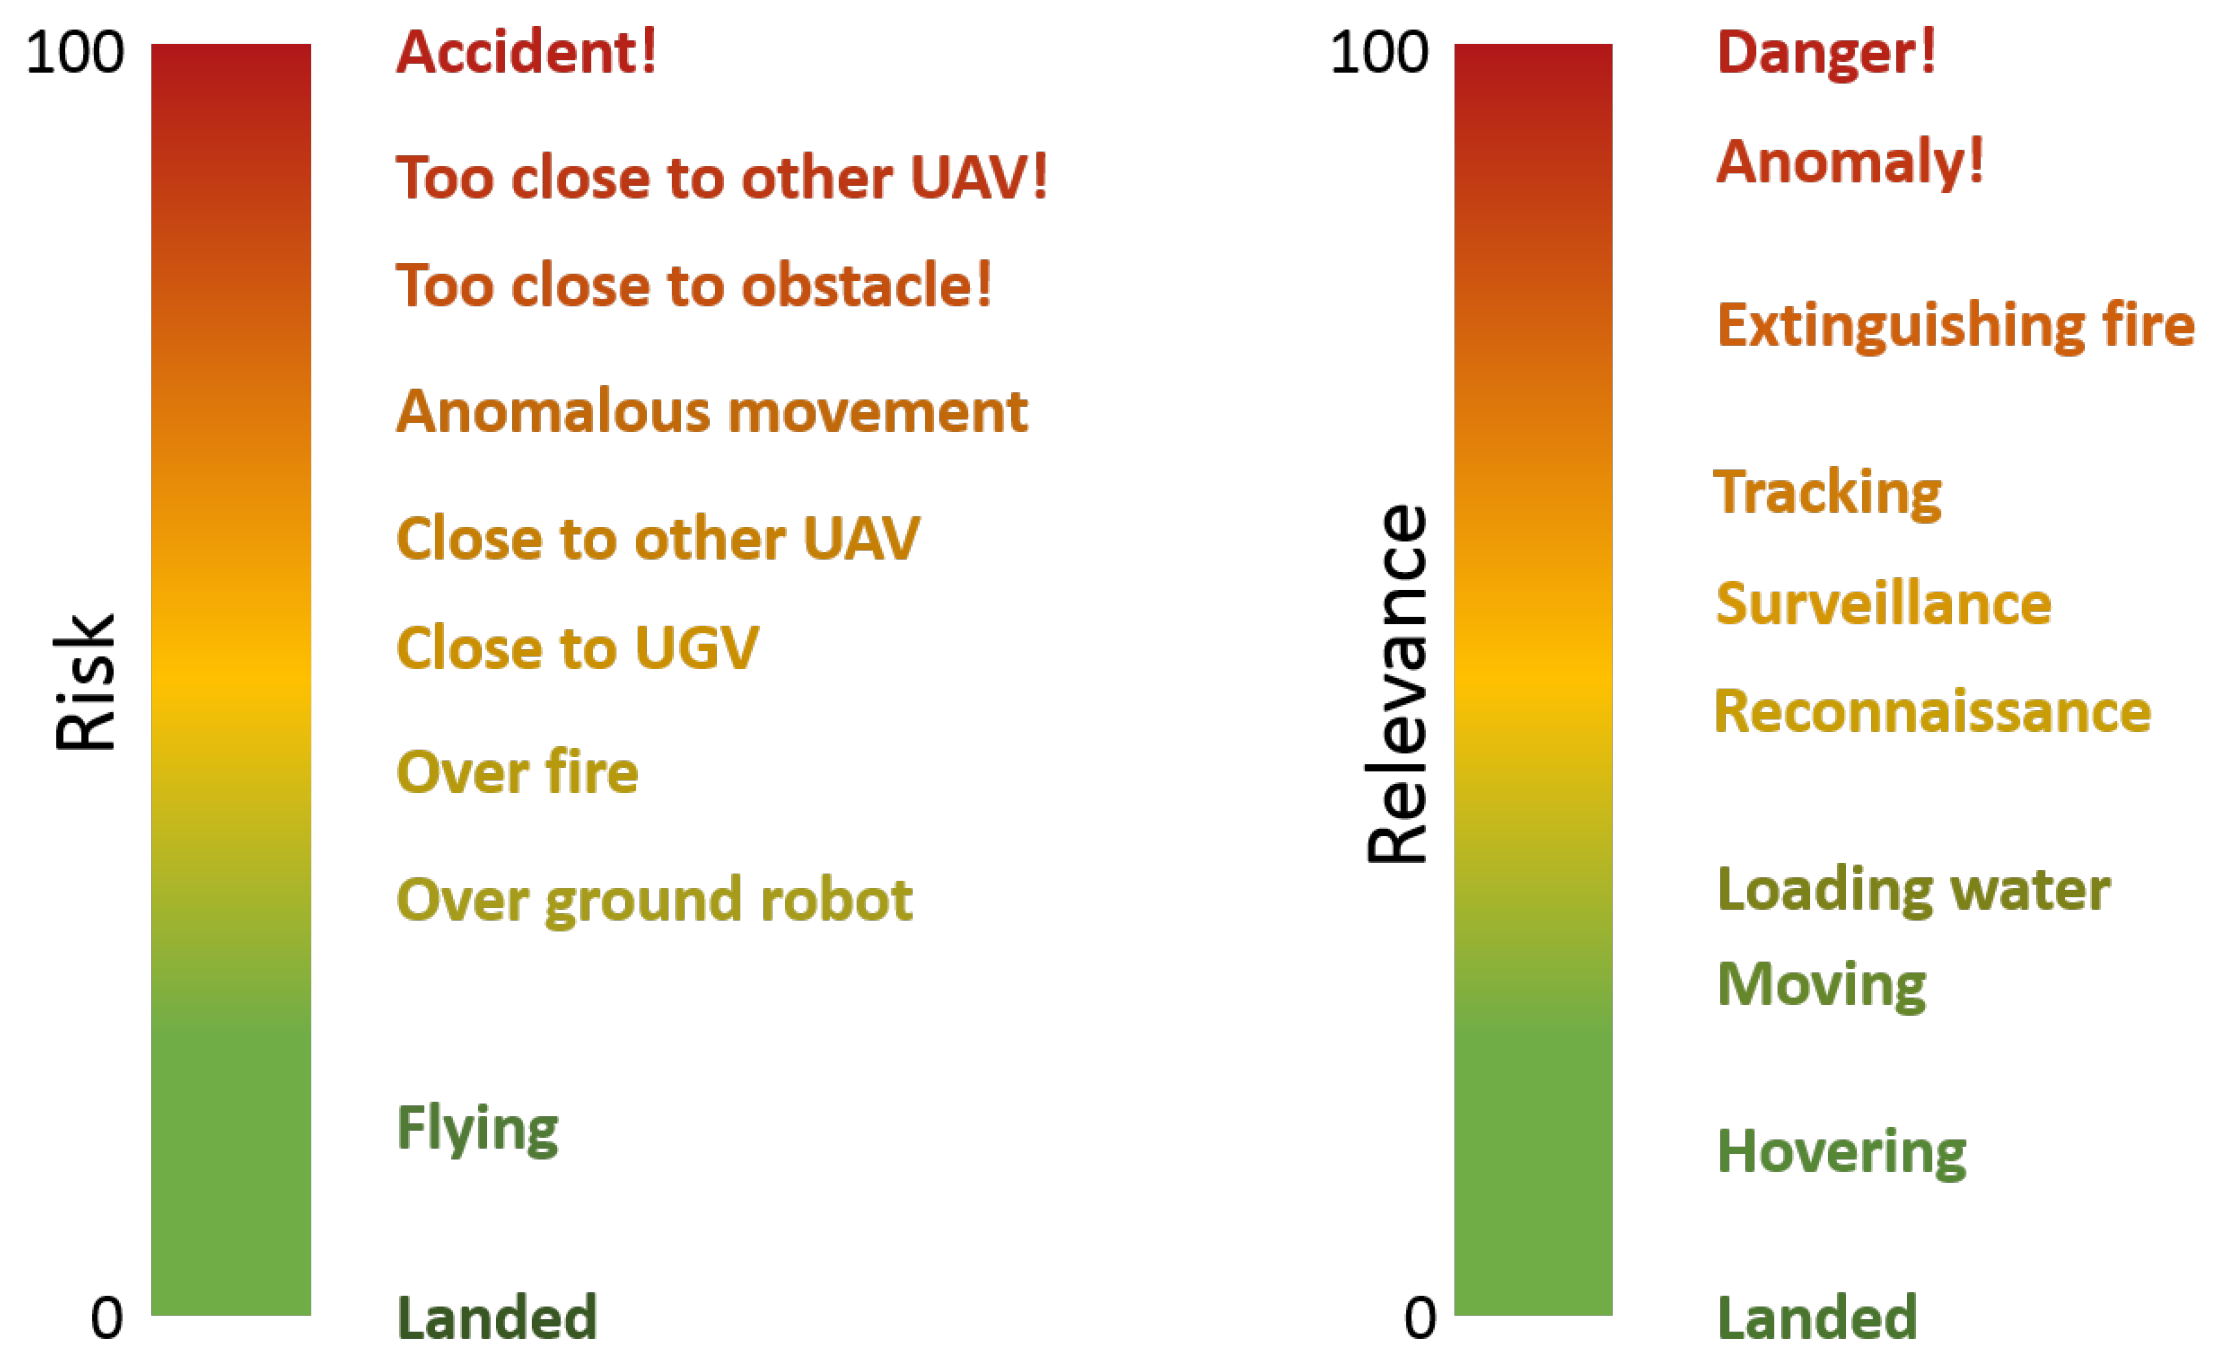
- Relevance. This variable measures the importance of the robot in a certain situation of the mission. In this work, it is considered as a percentage, which varies from 0% (i.e., the robot is not involved in the mission) to 100% (i.e., it is the unique one that is taking part in the mission). The sum of the relevances of all the robots that take part in the mission must be 100%.
- Risk. This variable measures the potential danger that the robot can suffer in a certain situation of the mission. In this work, it is considered as a percentage, which varies from 0% (i.e., the robot is completely safe) to 100% (i.e., it has suffered an accident). In this case, the risk of one robot is independent of the risks of the rest of the fleet.
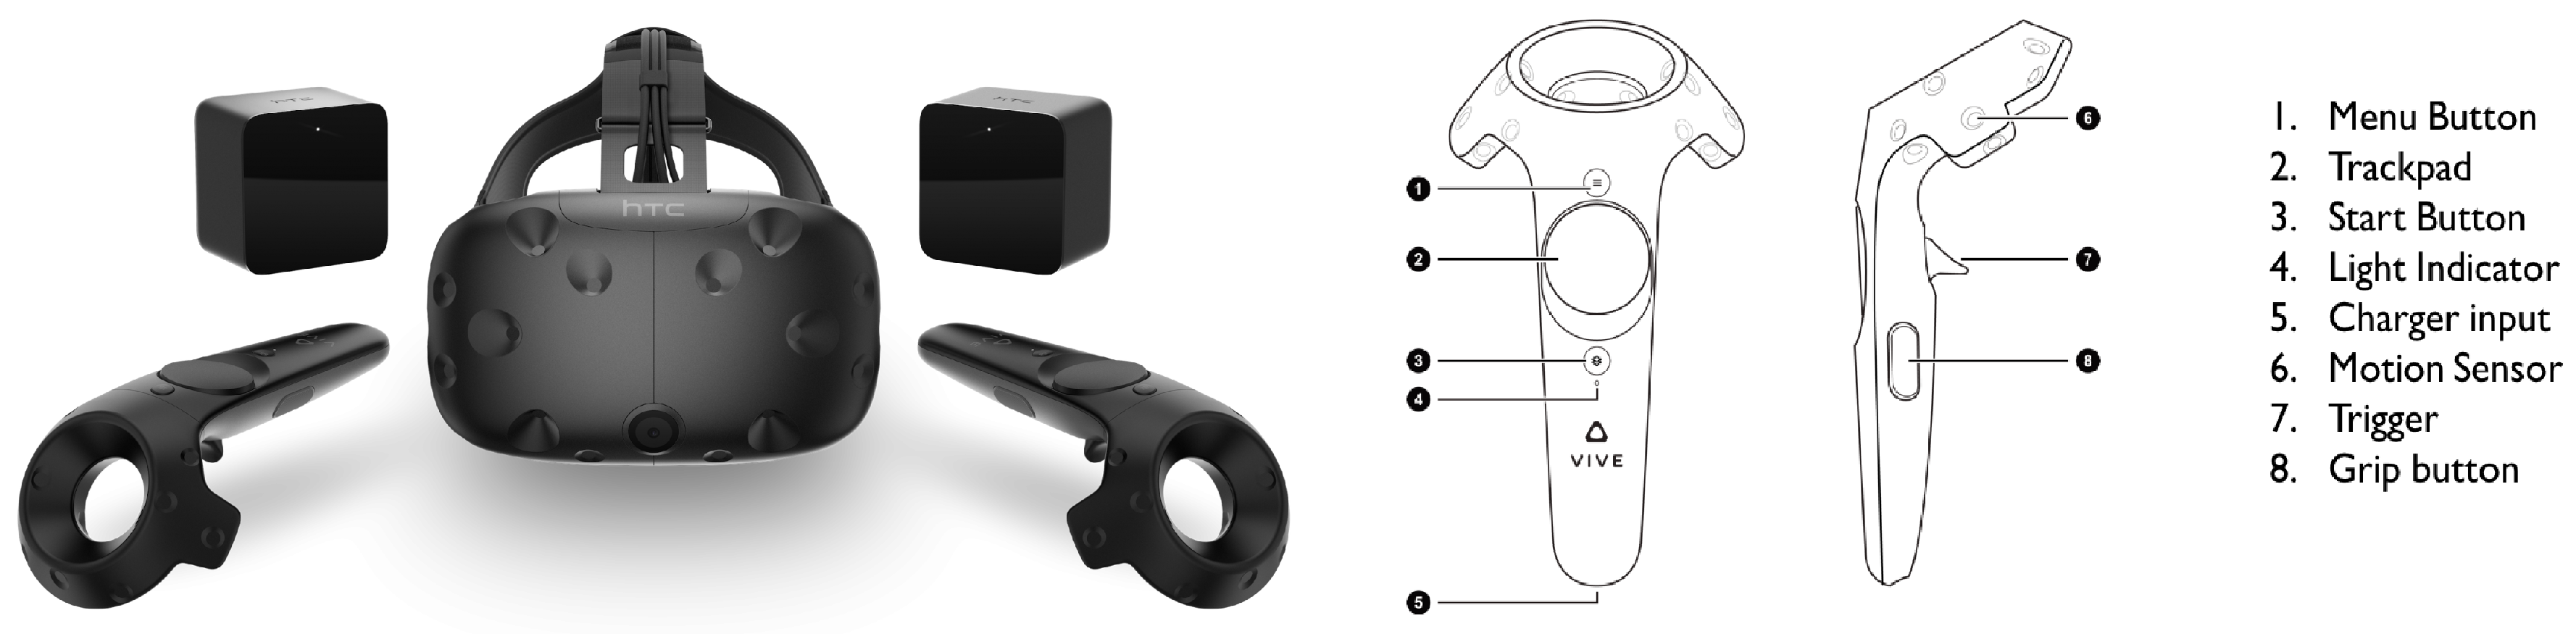
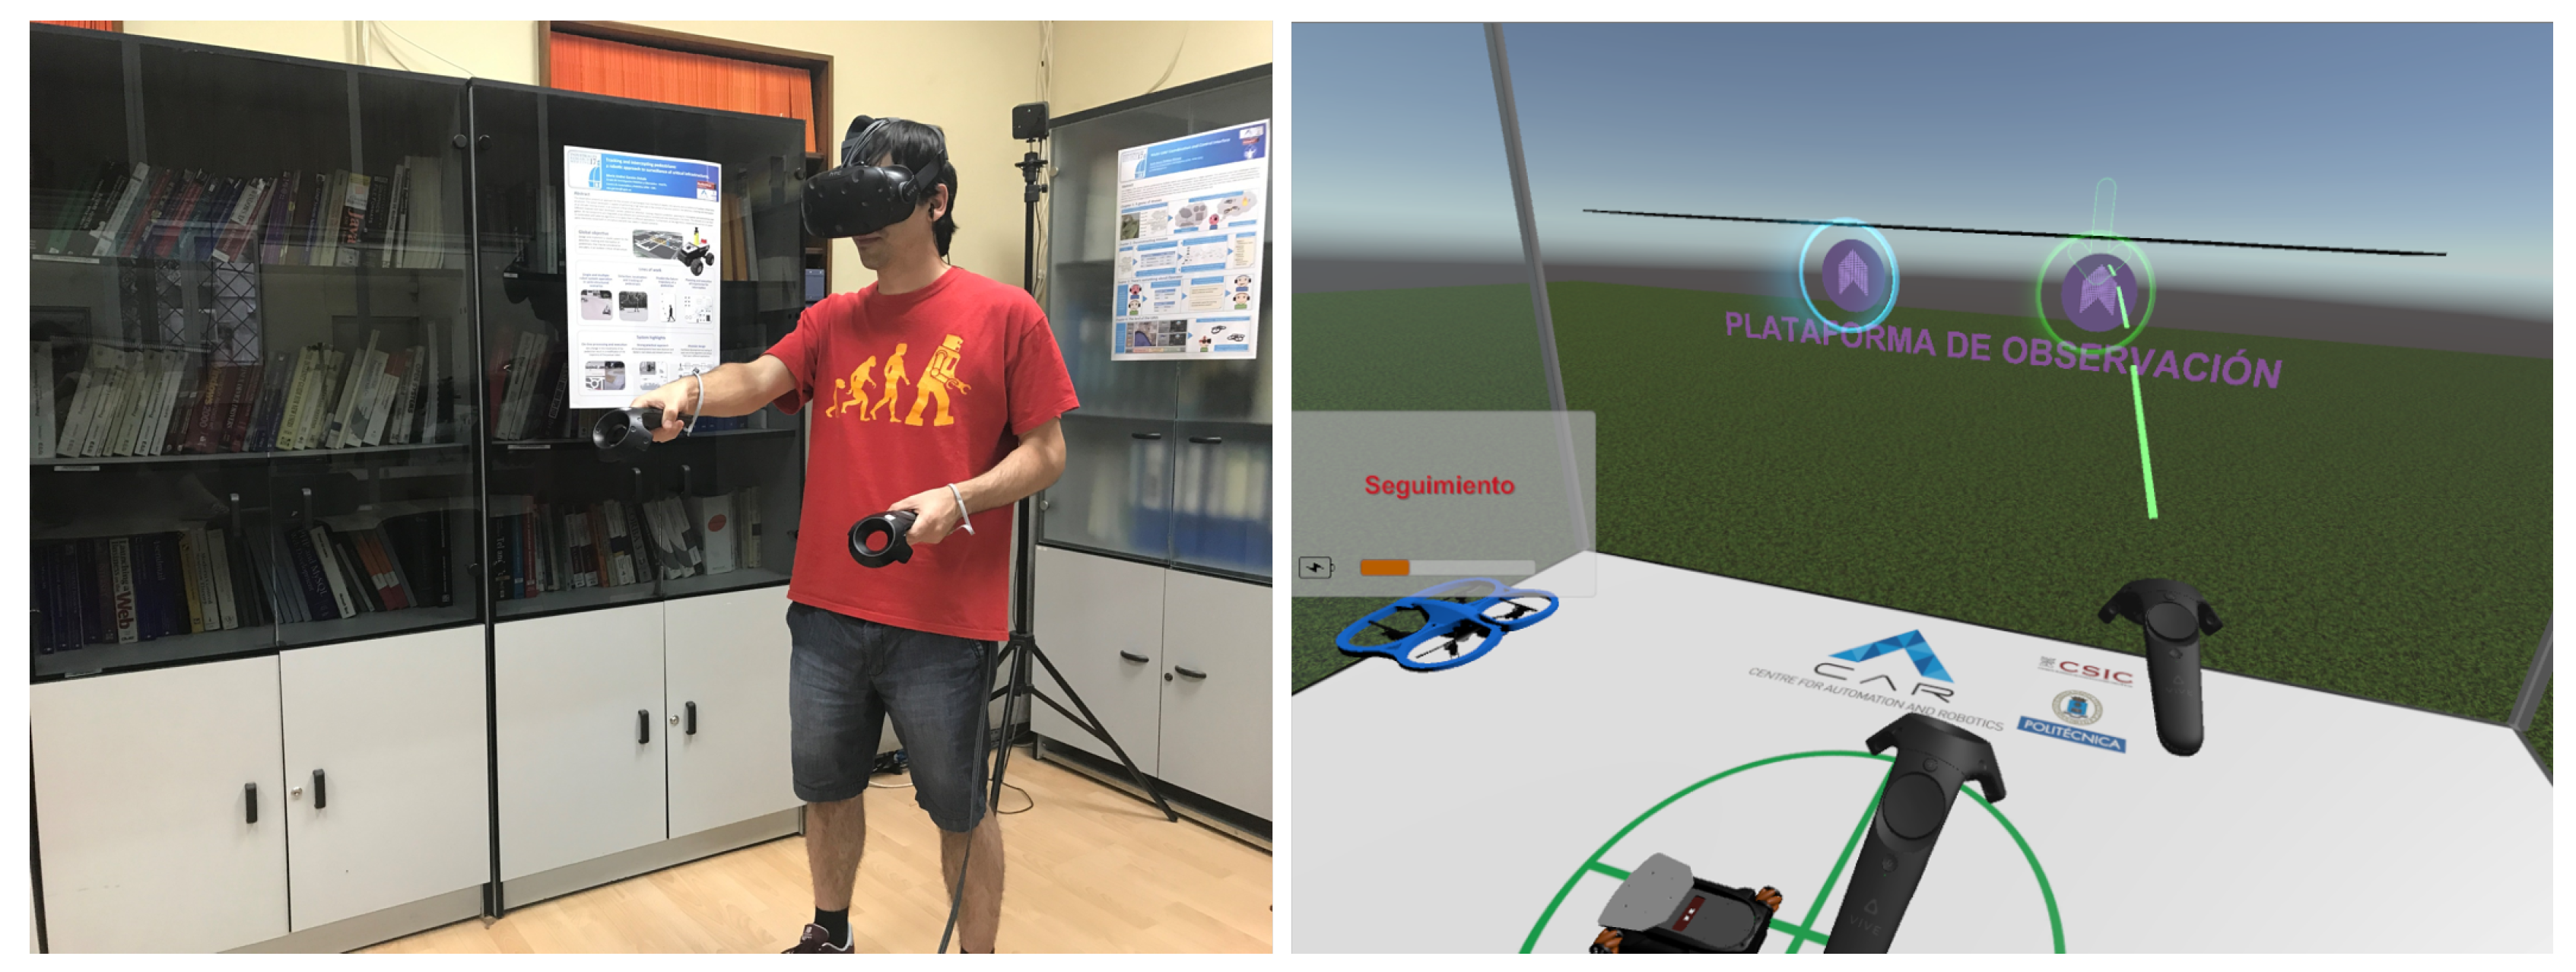
4.2. Virtual Reality
5. Design of Interfaces
5.1. Non-Predictive Conventional Interface
5.2. Predictive Conventional Interface
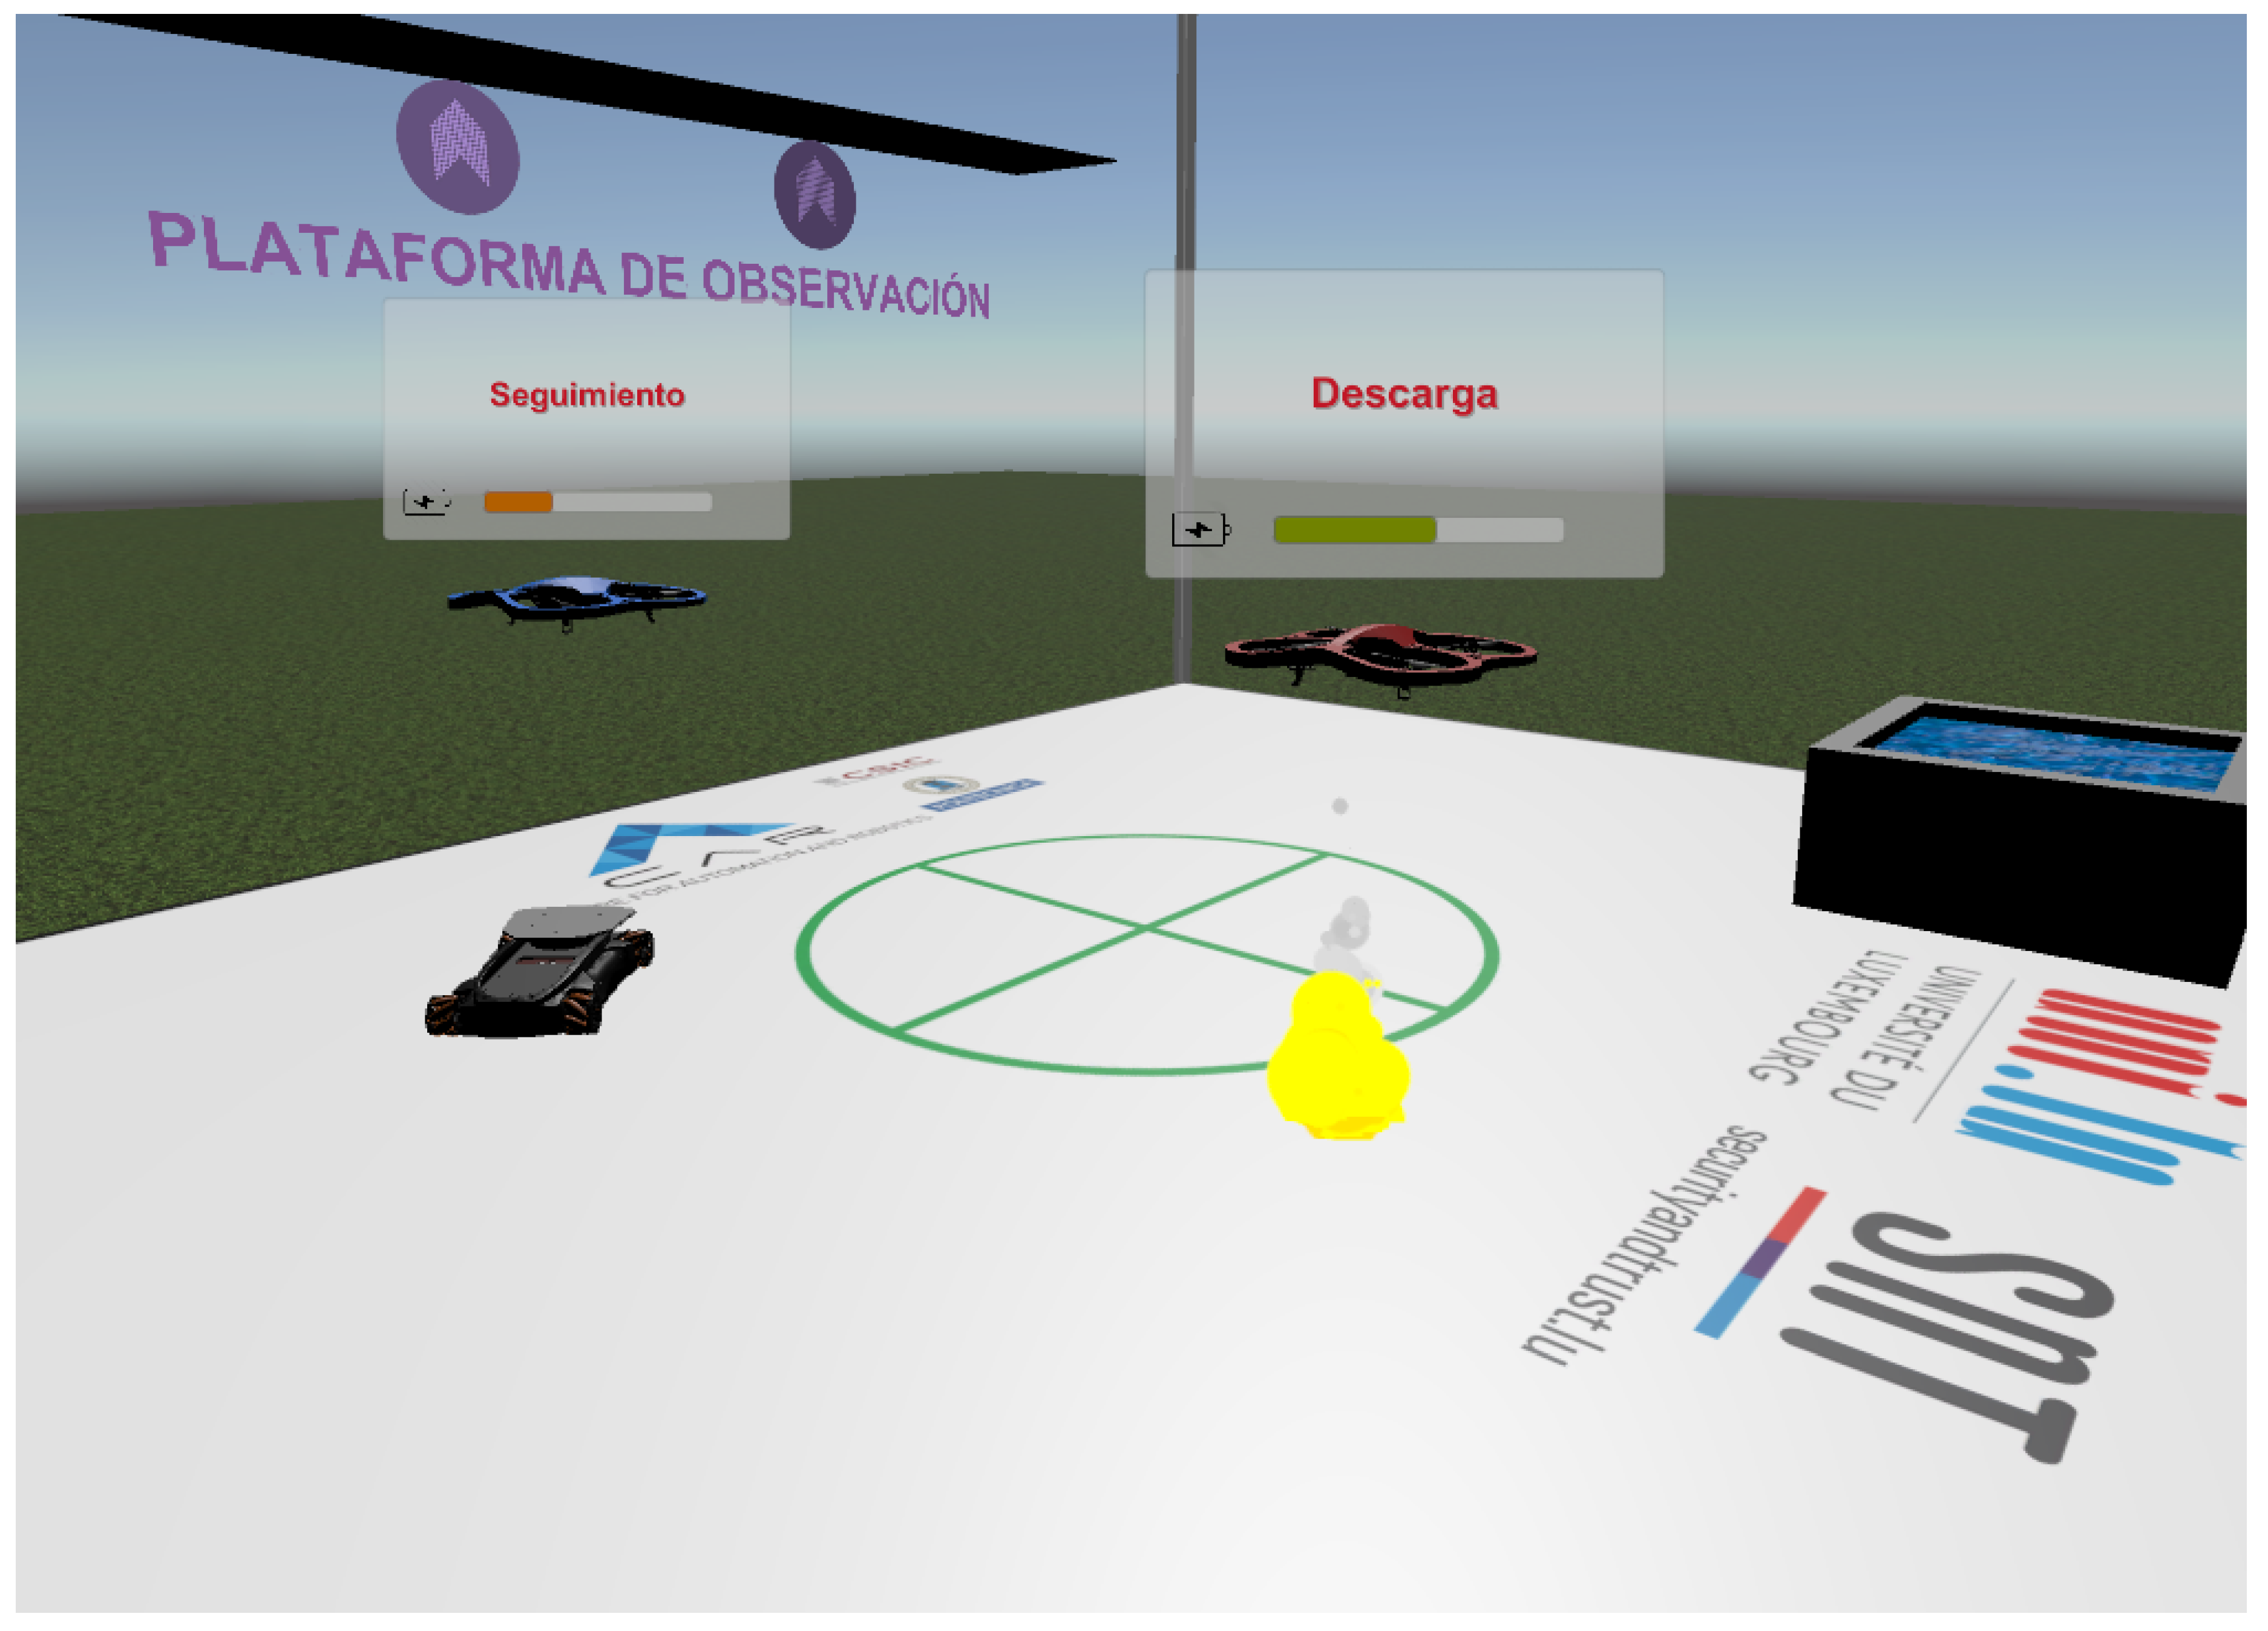
5.3. Non-Predictive Virtual Reality Interface
5.4. Predictive Virtual Reality Interface
6. Experiments
- Explanation of missions:
- The objective of the experiment is to watch multi-robot missions, collect information and answer a series of questions.
- The goals of the missions are to detect and extinguish fires, and to find and track potential intruders.
- The mission elements are two drones (one red and another blue), a ground robot, a fire and a water well.
- The drones perform the following tasks: begin (take-off), surveillance (cover the area to detect fire or intruder), reconnaissance (visit the points to check detections), tracking (follow an intruder), capture (load the water), release (download on fire) and finish (land).
- It is important to know where the drones are, what tasks they are performing, their battery level, etc.
- Explanation of interfaces:
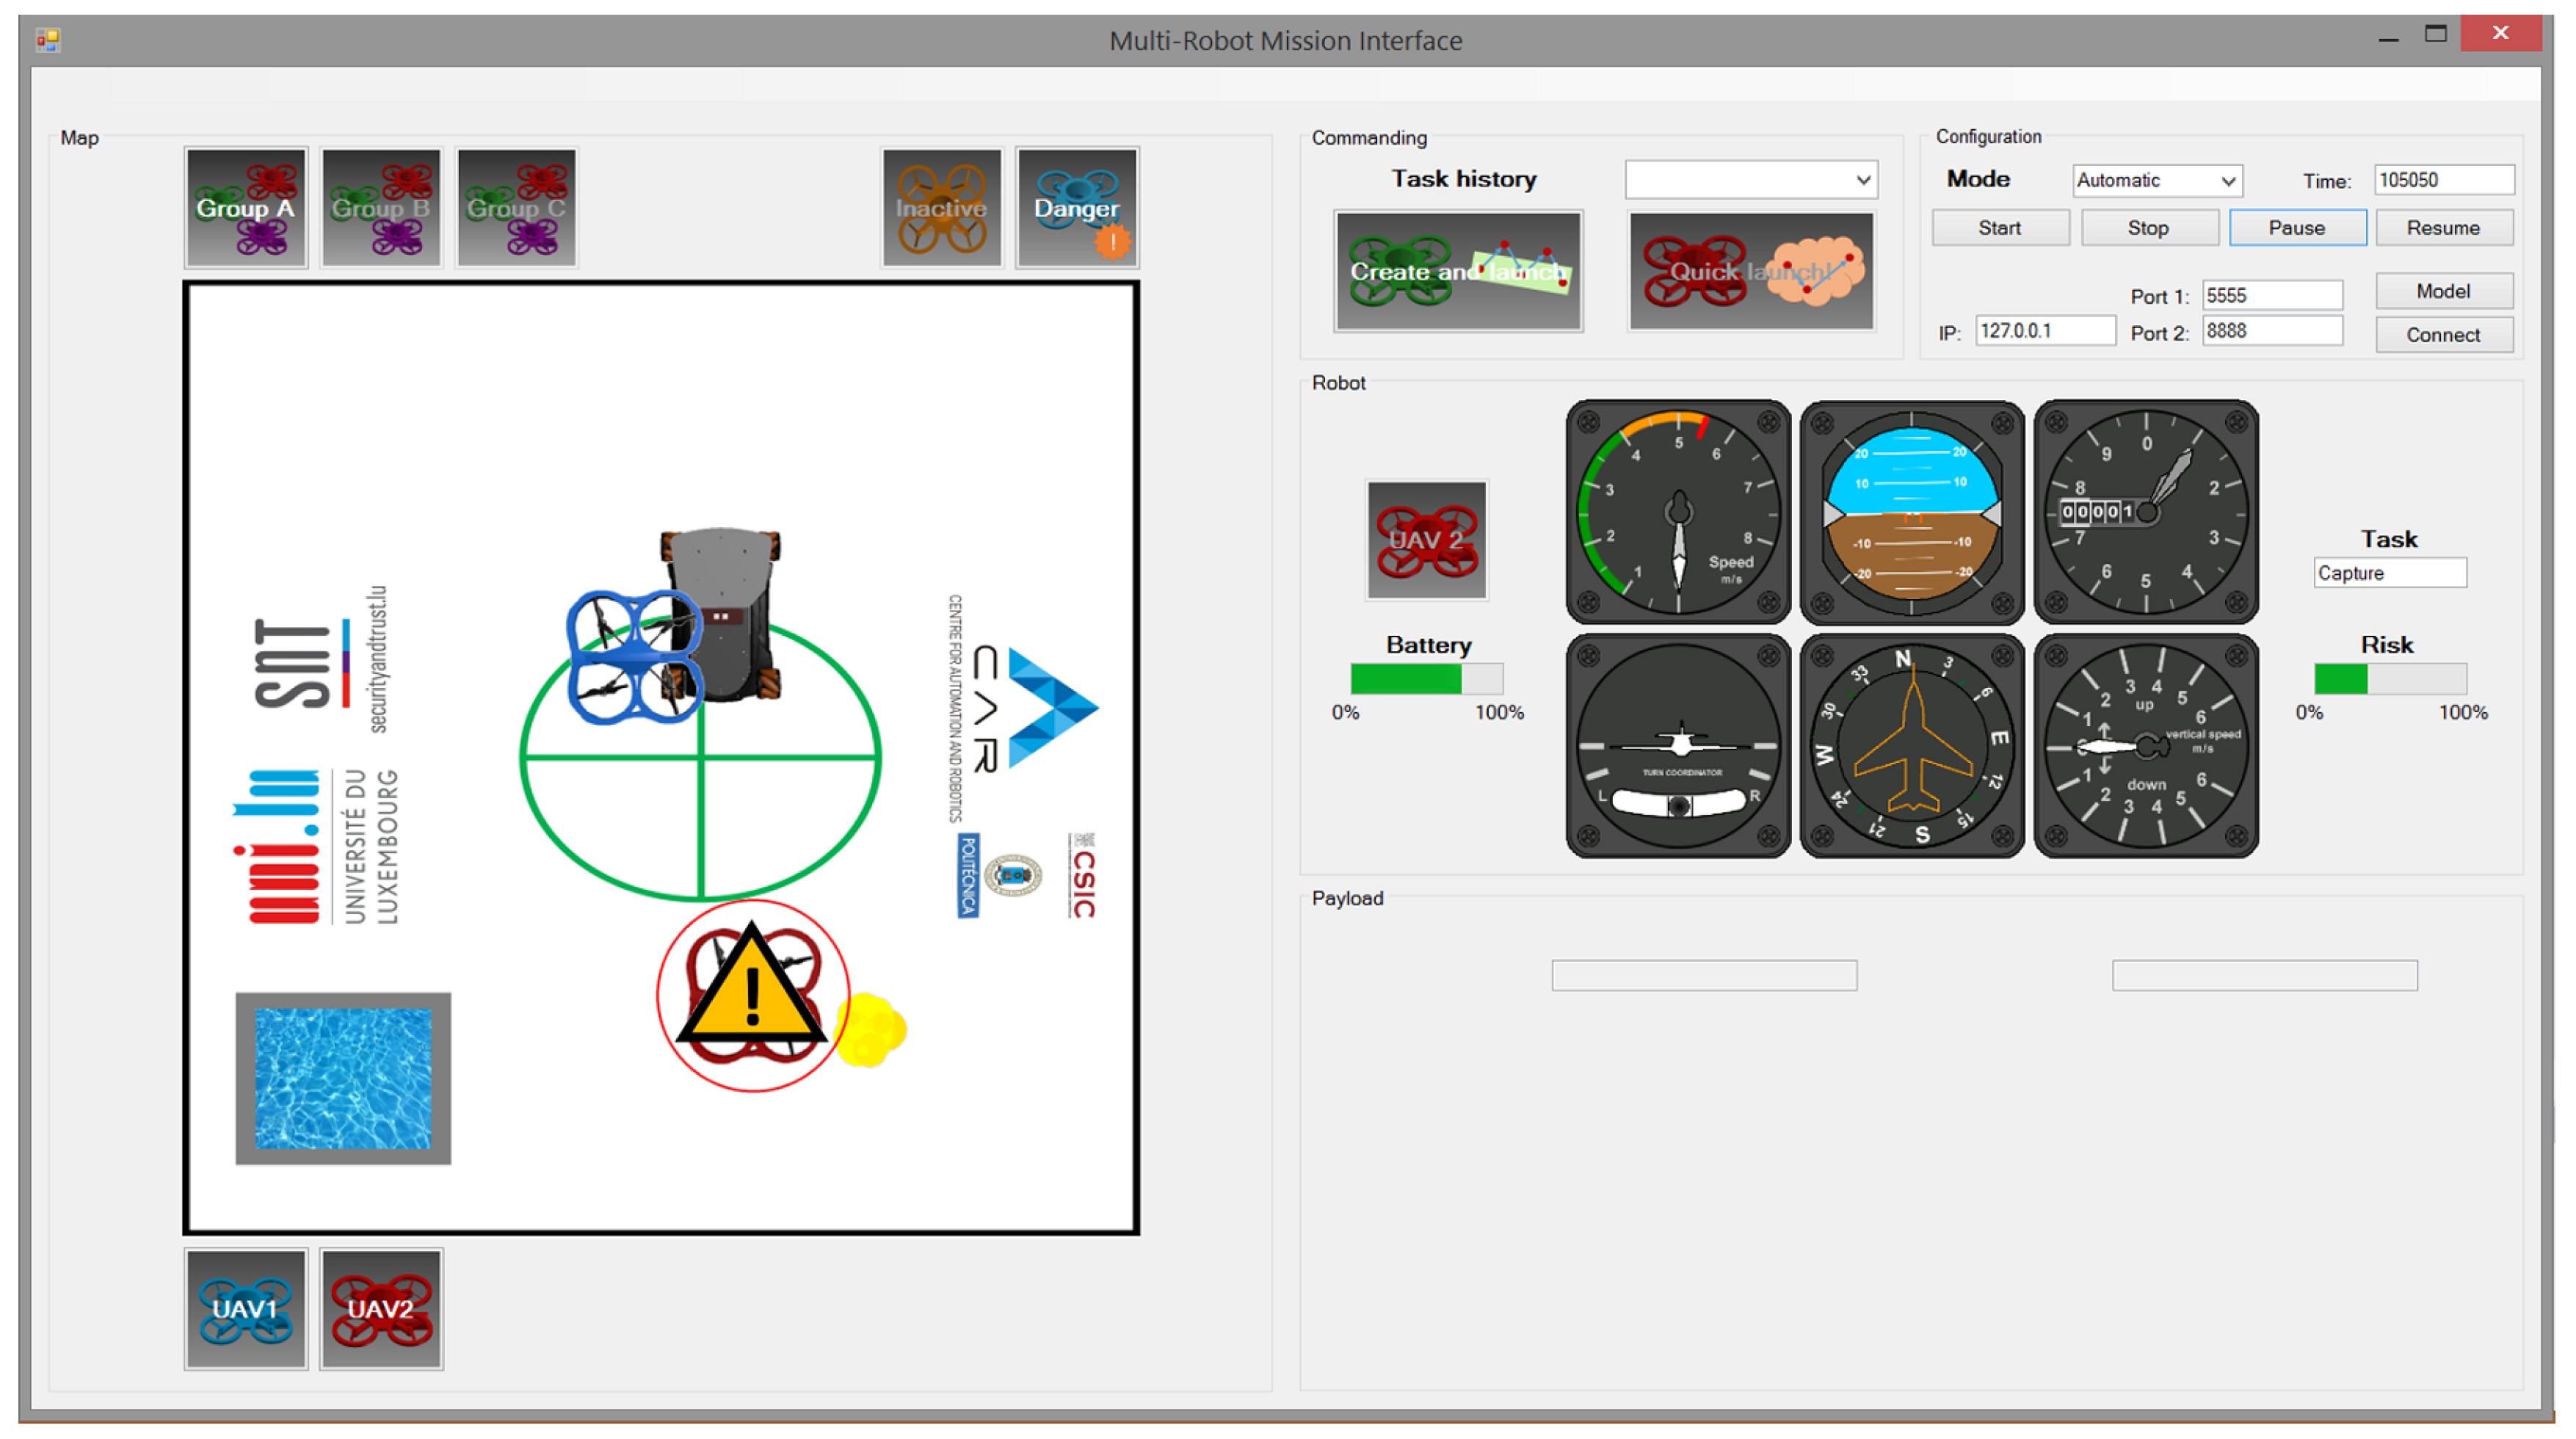
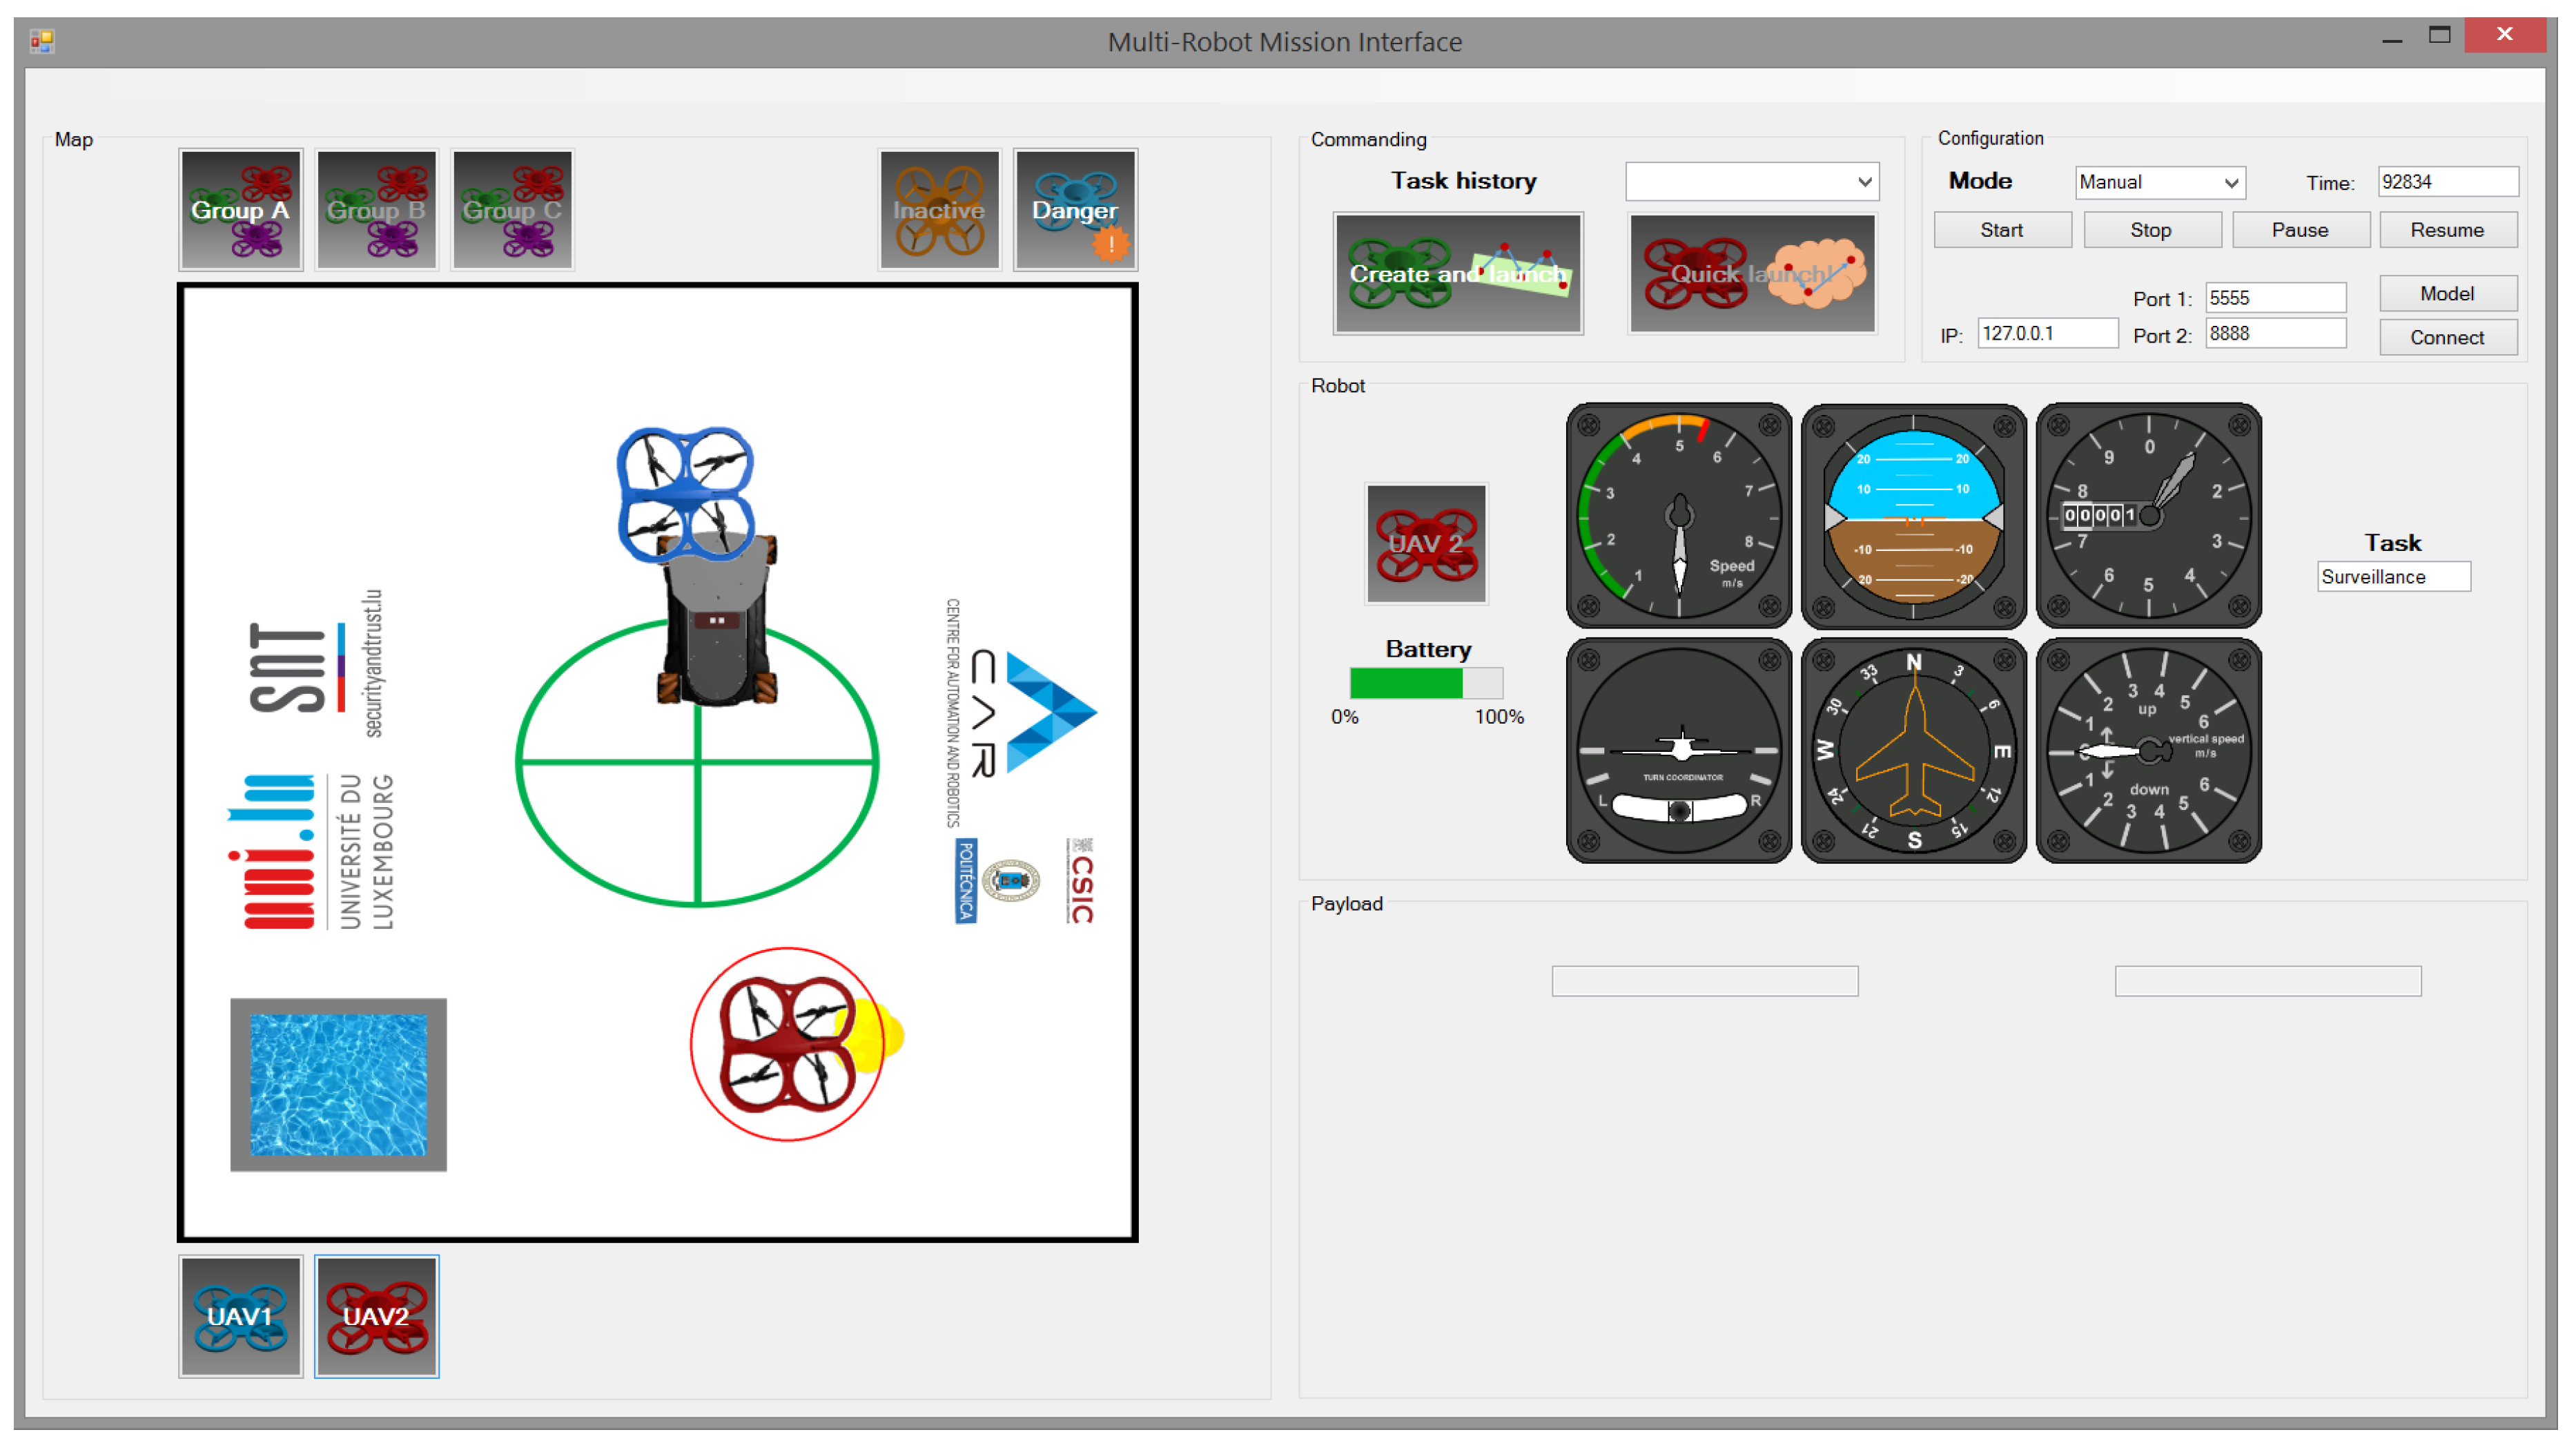
- Conventional interface (CI): The map, the elements (UAVs, fire and UGV), the manual selection of UAV and the information (battery and task).
- Predictive conventional interface (PCI): The map, the elements (UAVs, fire and UGV), the predictive components (spotlight and alert), the autonomous selection of UAV and the information (battery and task).
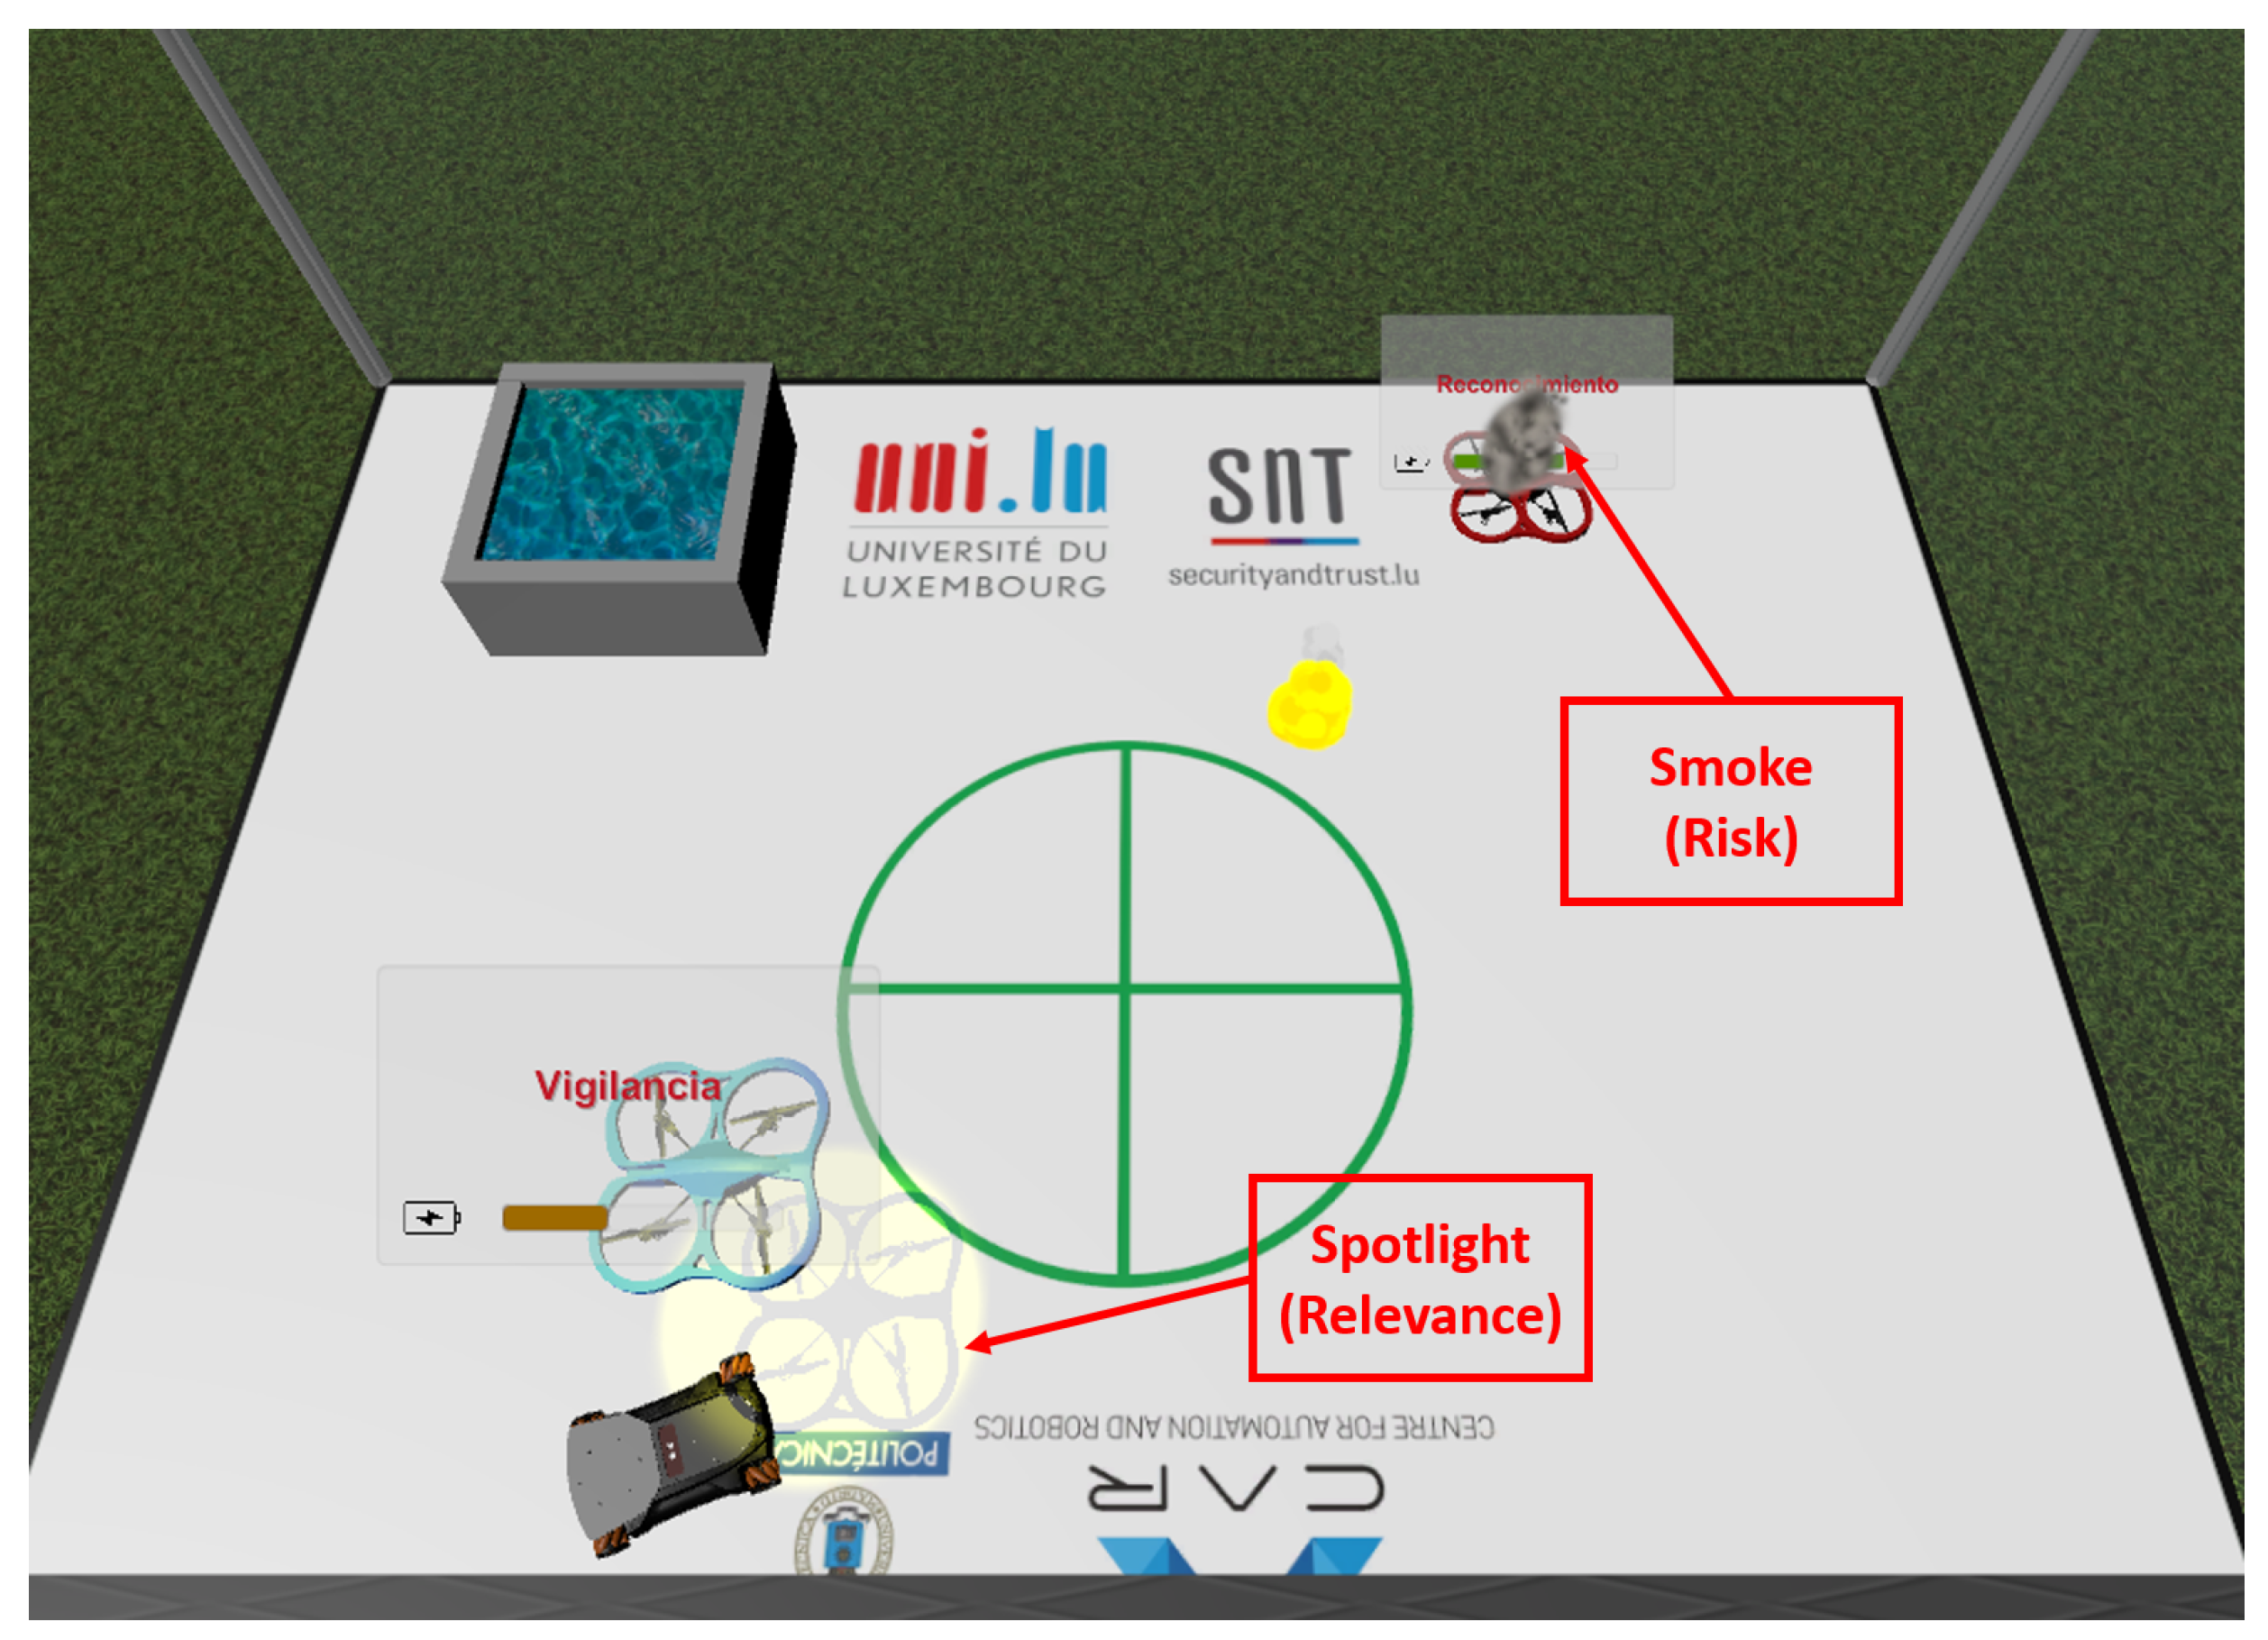
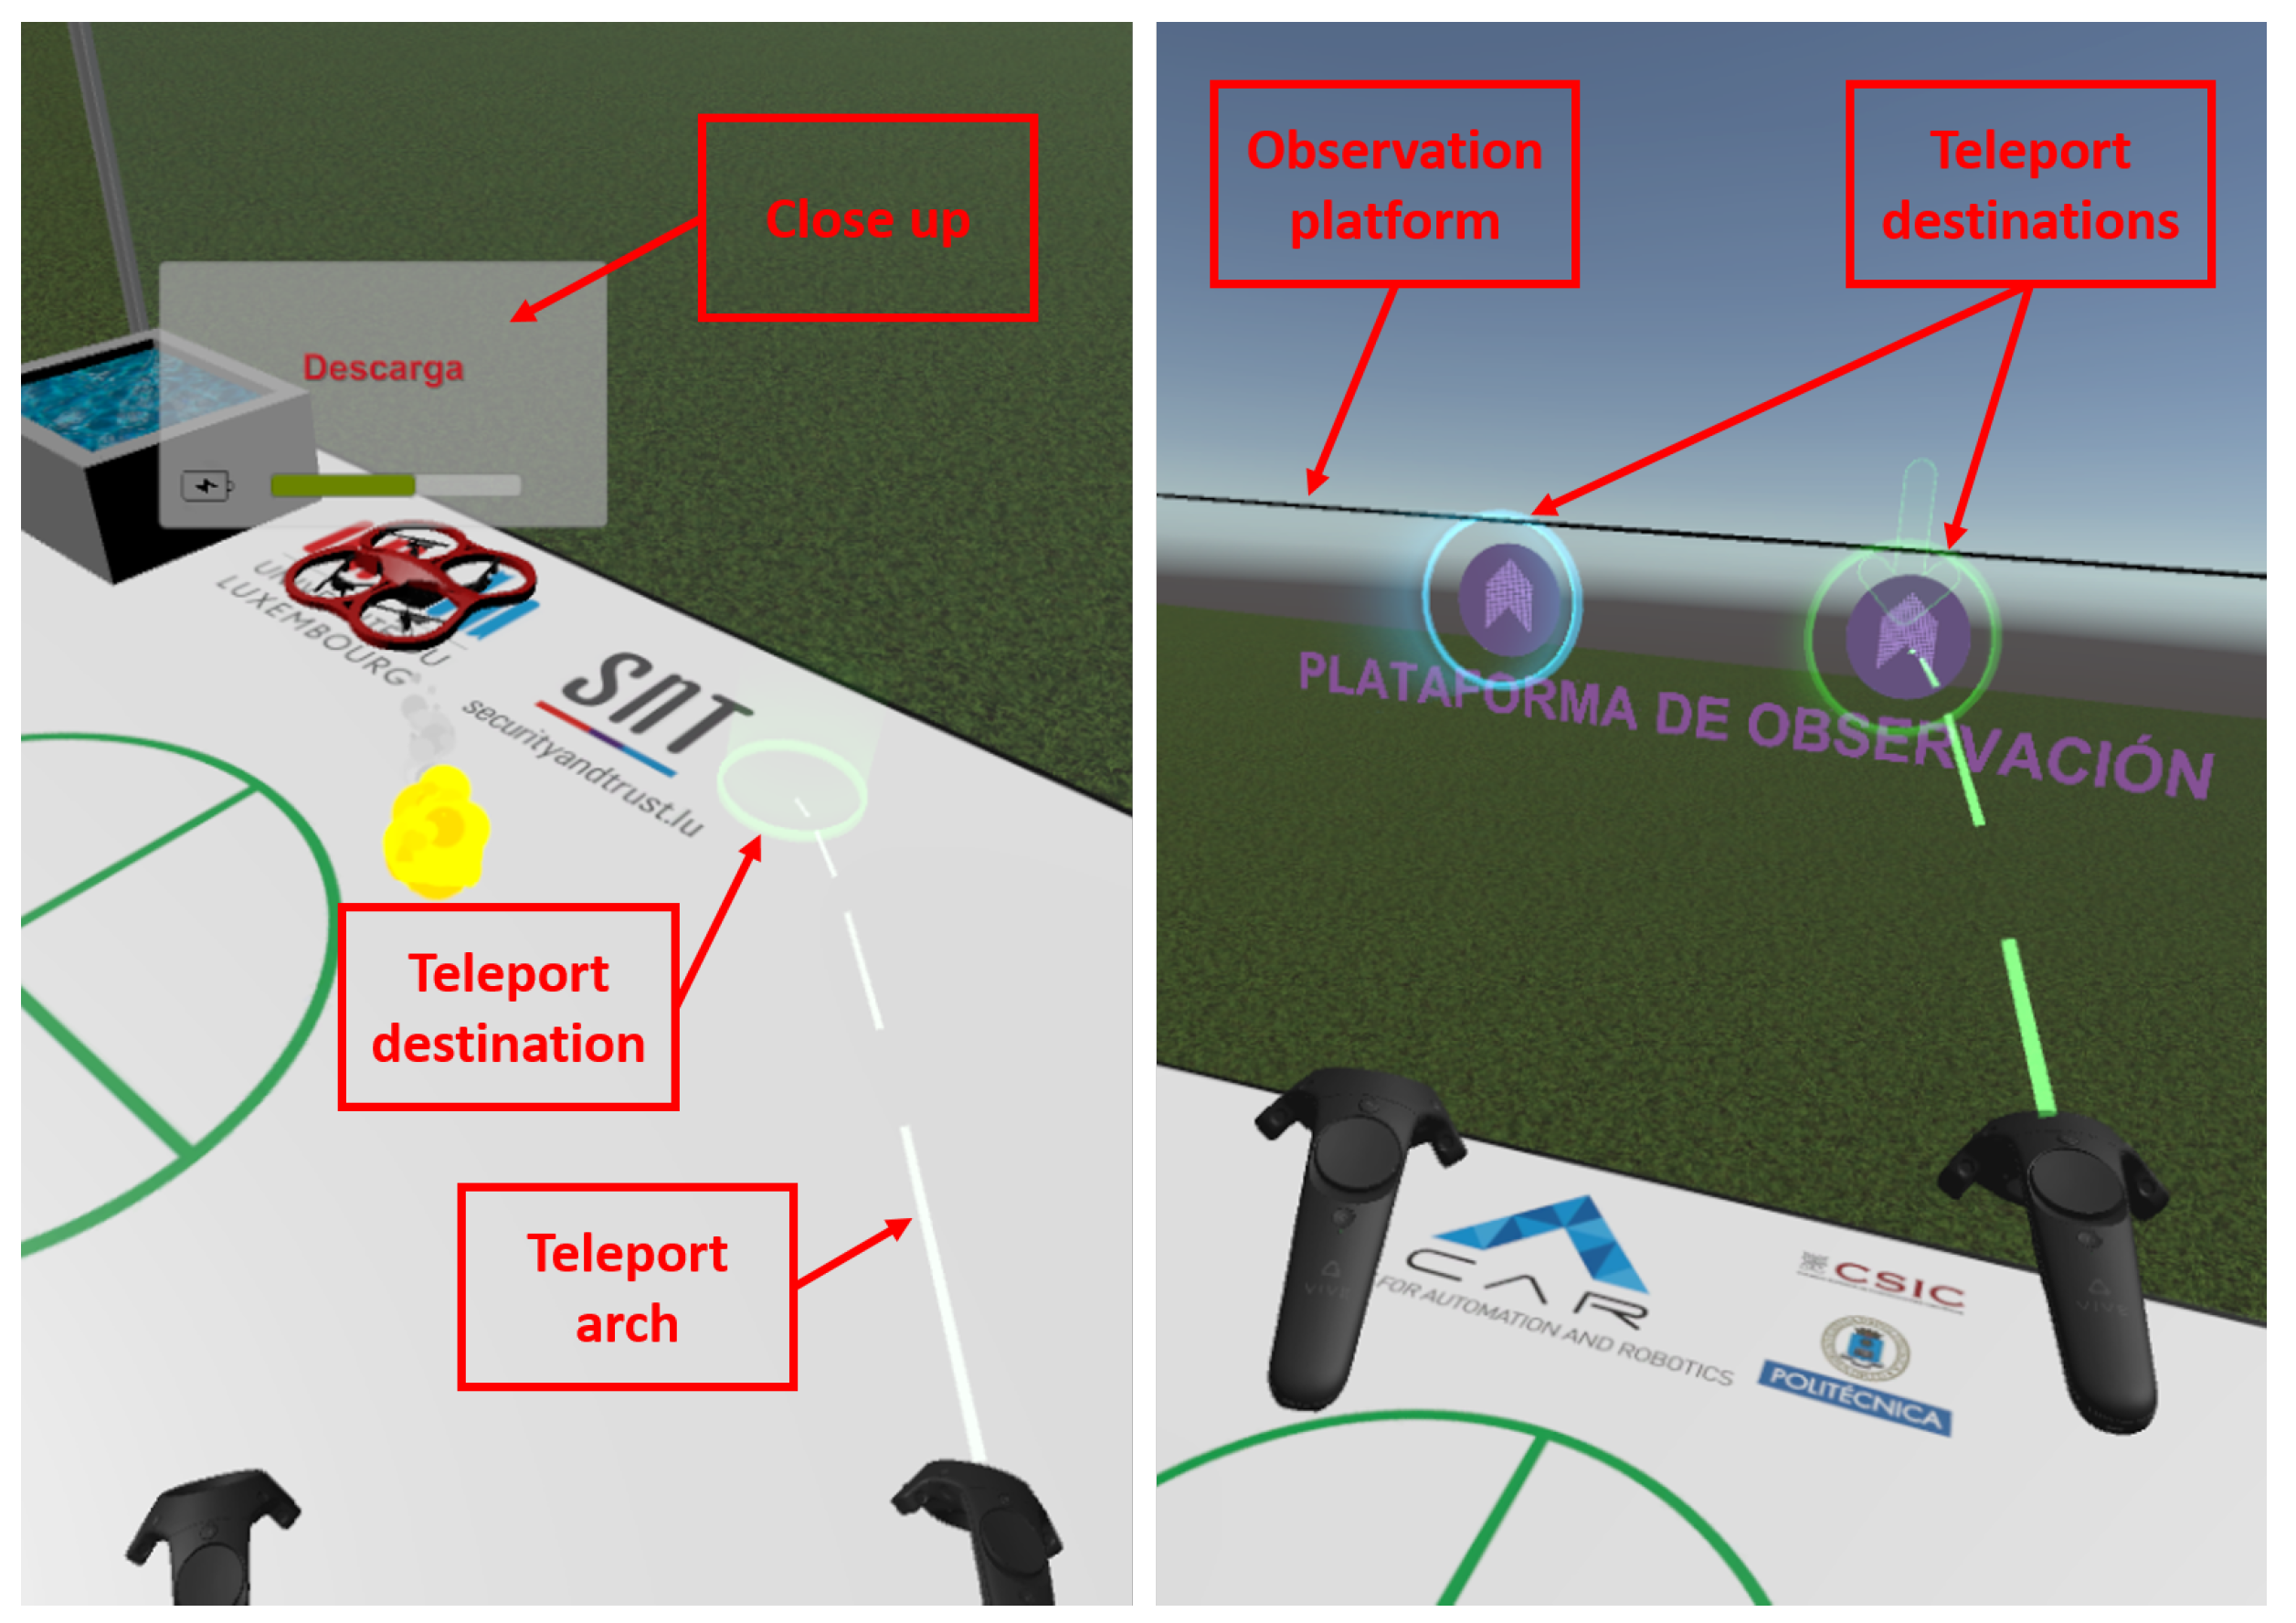
- Virtual reality interface (VRI): The environment (scenario and platform), the teleport mechanism, the elements (UAVs, fire and UGV) and the information (battery and task).
- Predictive virtual reality interface (PVRI): The environment (scenario and platform), the teleport mechanism, the elements (UAVs, fire and UGV), the predictive components (spotlight and smoke) and the information (battery and task).
- Annotation of user information: Age, genre and expertise.
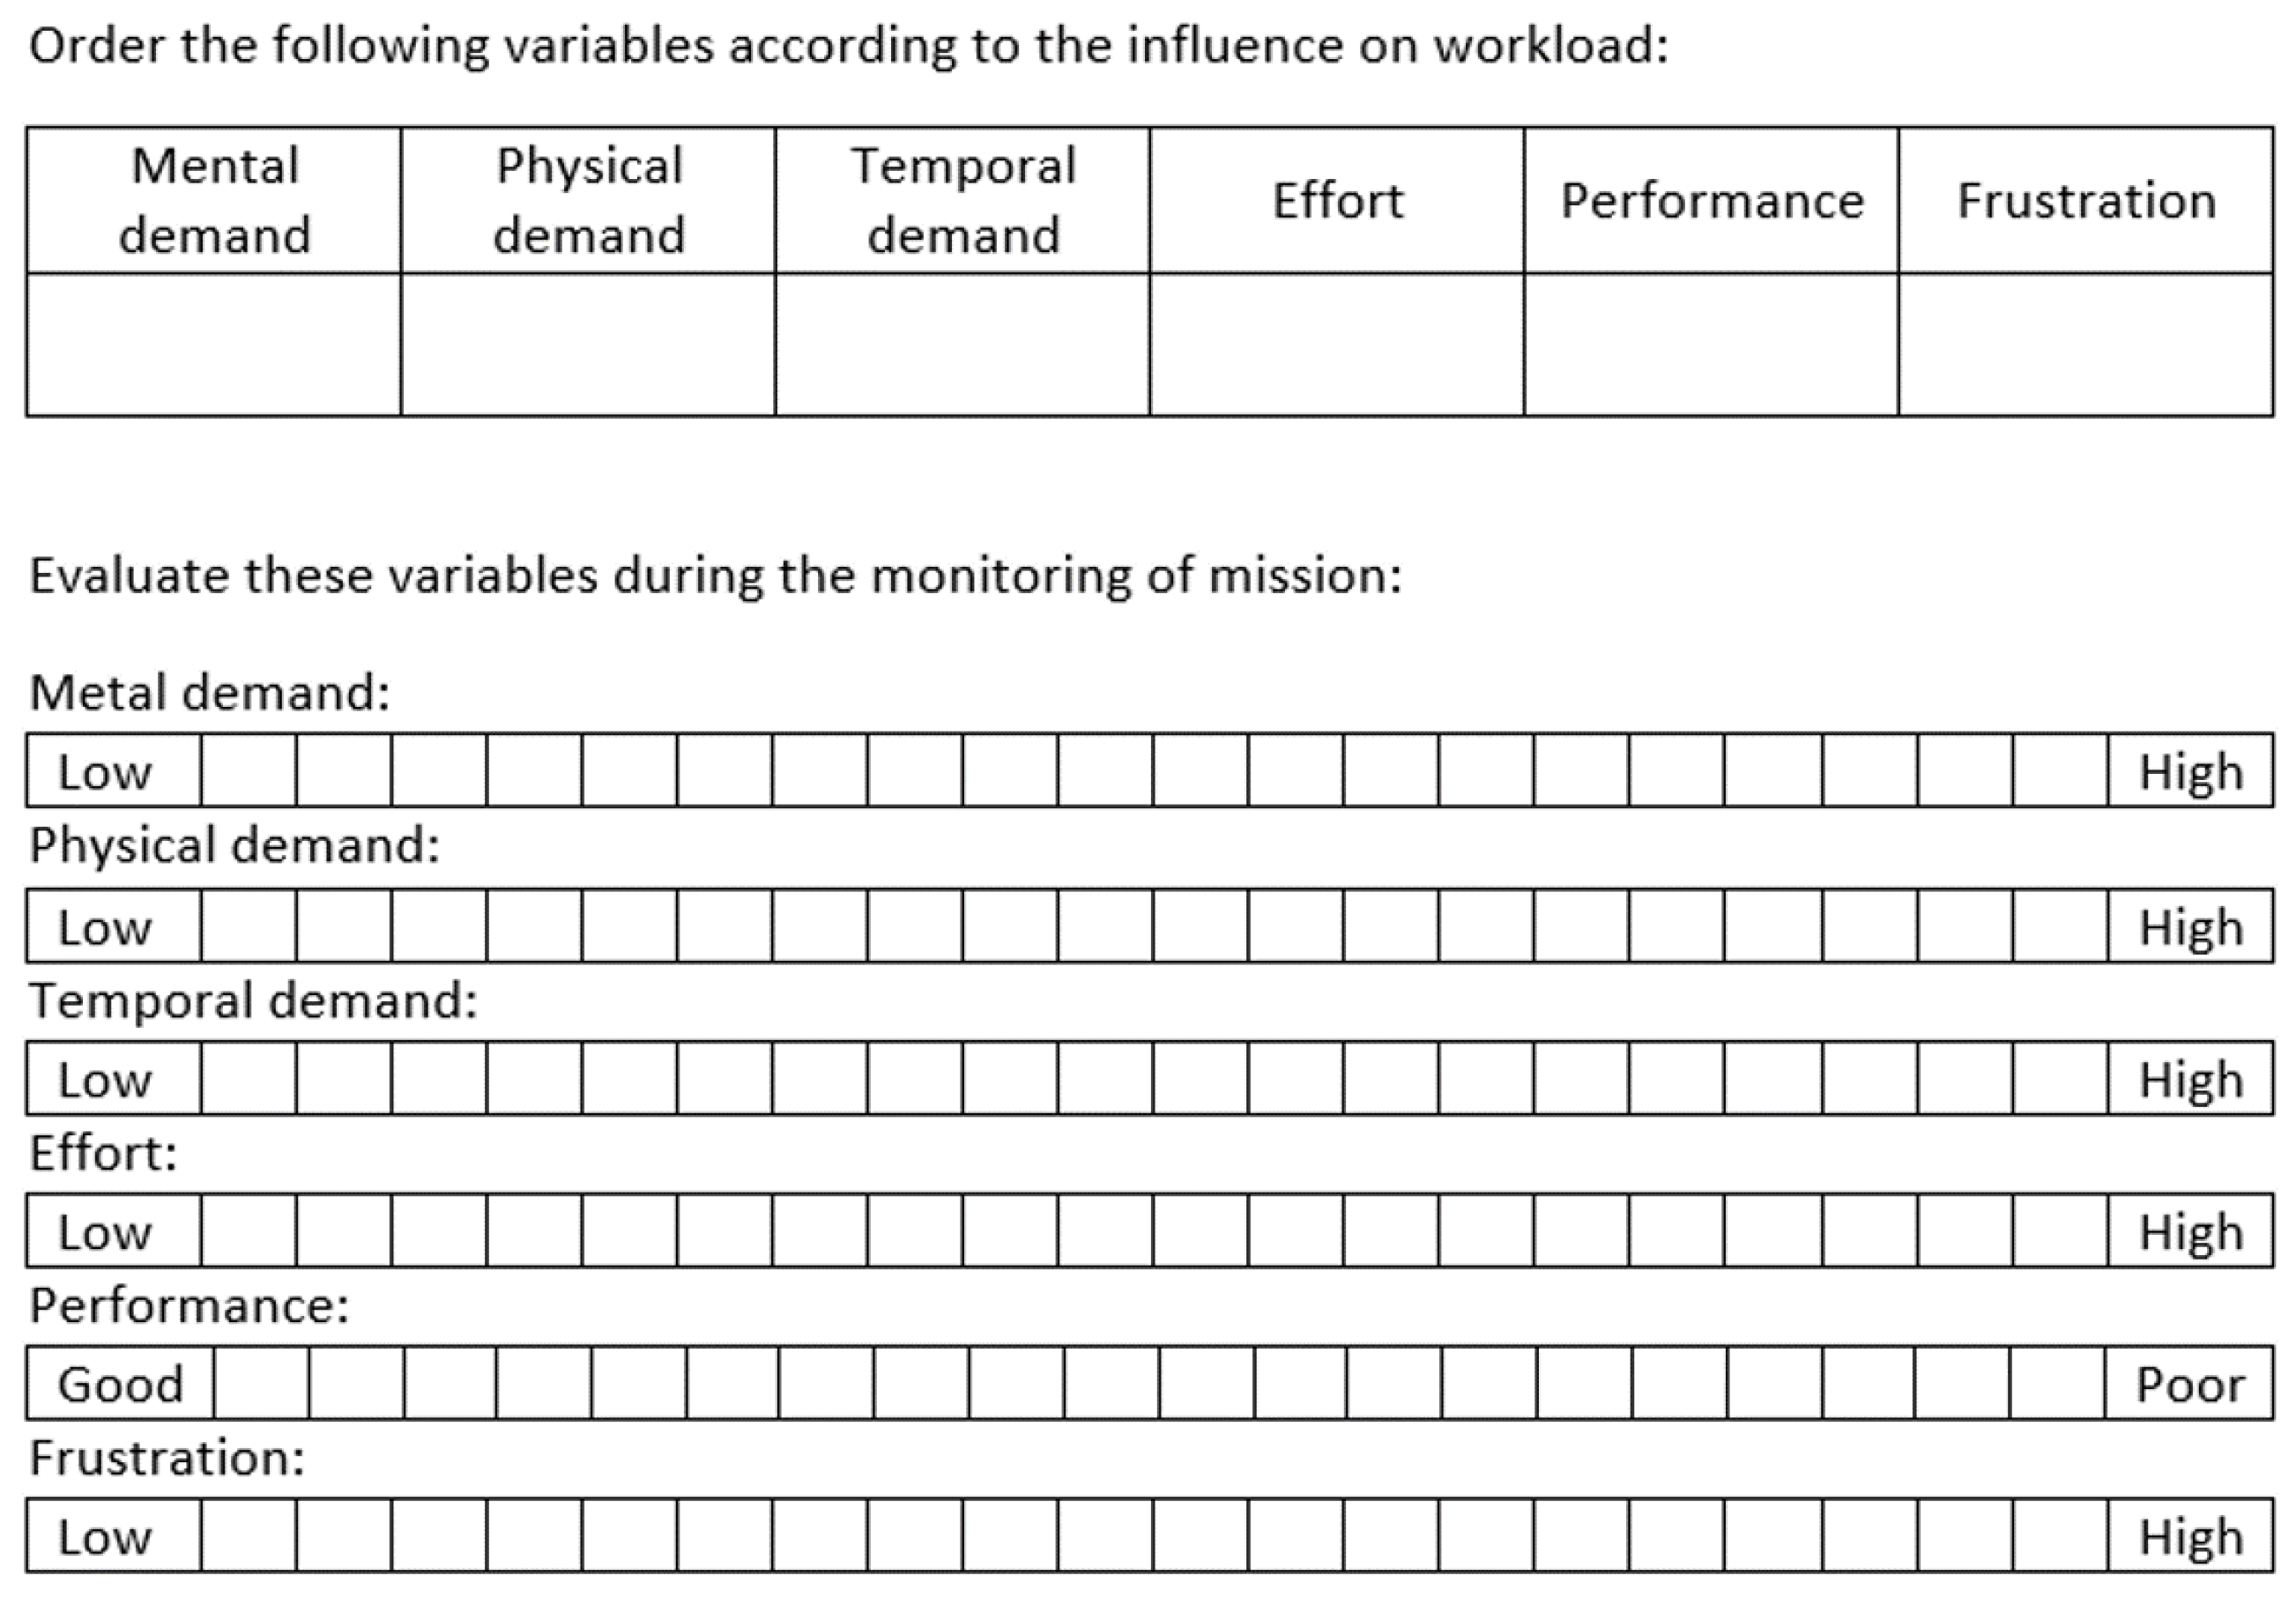
- NASA-TLX (weighing): The user puts into order six variables (mental, physical and temporal demands, effort, performance and frustration) according to their estimated influence on workload (as seen in Figure 13).
- Test of interface #1:
- Start: The user starts to monitor the multi-robot mission.
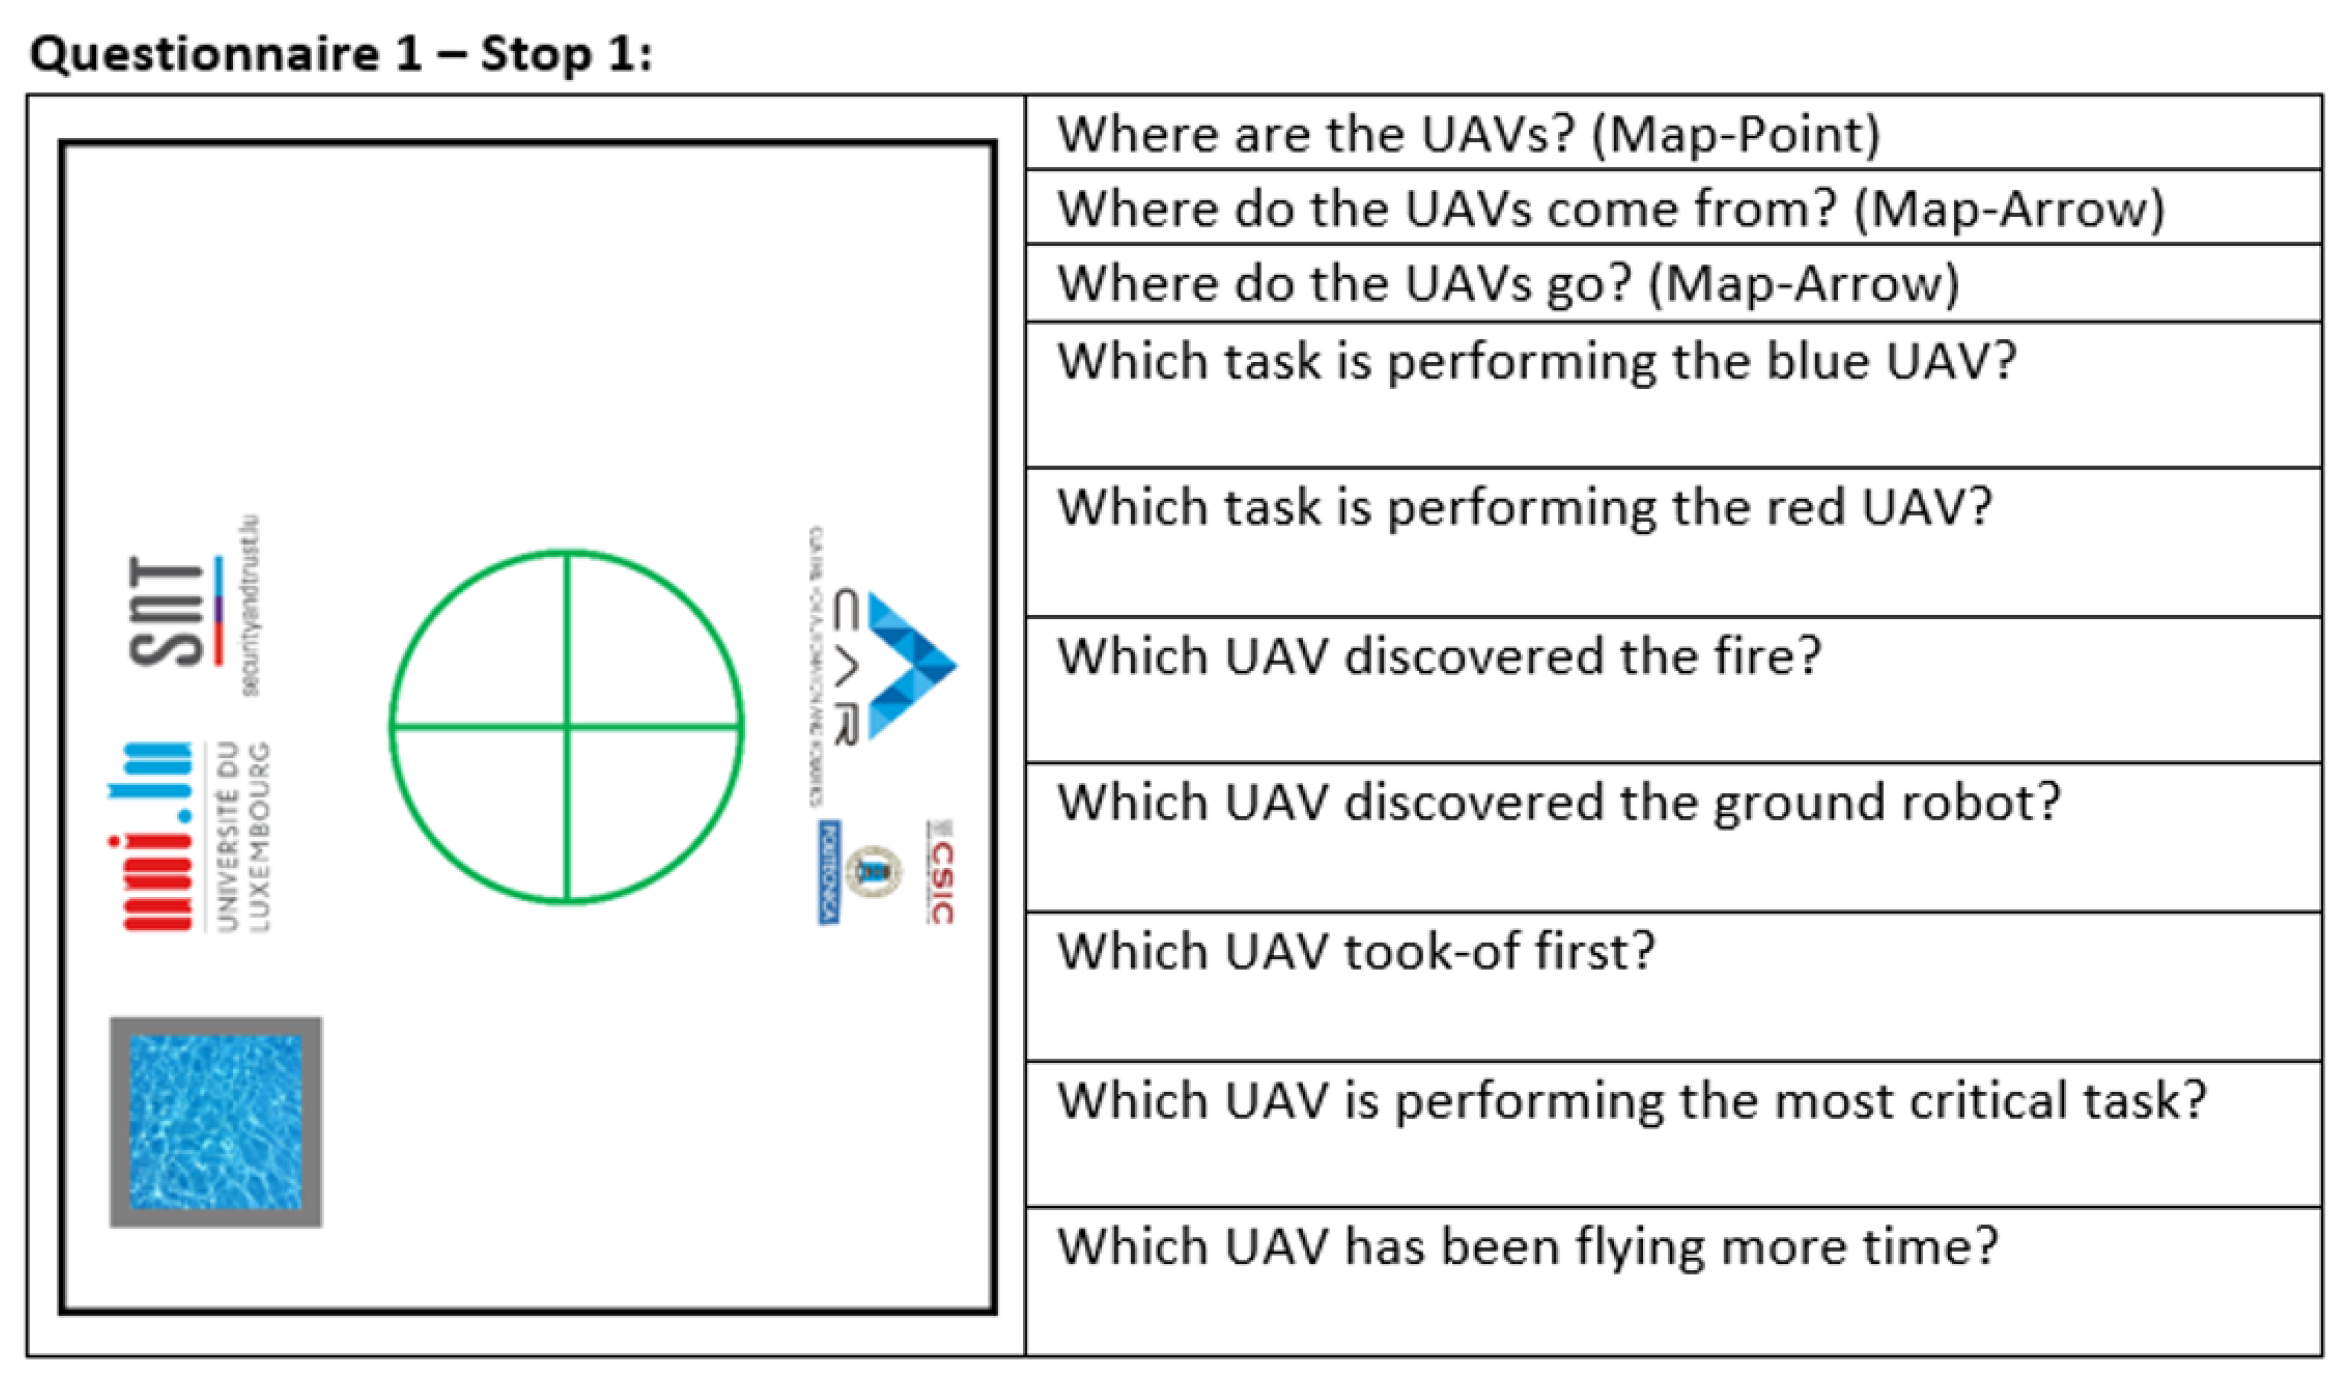
- Stop #1: We notify the user and, after ten seconds, stop the interface.
- SAGAT (first part): The user answers some questions about the past, current and future locations and states of UAVs. The questionnaire is explained in further detail below.
- Resume: The user starts again to monitor the multi-robot mission.
- SAGAT (second part):The user answers some questions about the past, current and future locations and states of UAVs. The questionnaire is explained in further detail below.
- Test of interface #2: The same procedure applied in interface #1.
- NASA-TLX (scoring): The user evaluates both interfaces according to six variables (mental, physical and temporal demands, effort, performance and frustration) and marks values from 0 to 20 (as shown in Figure 13).
- Annotation of user observations.
7. Results
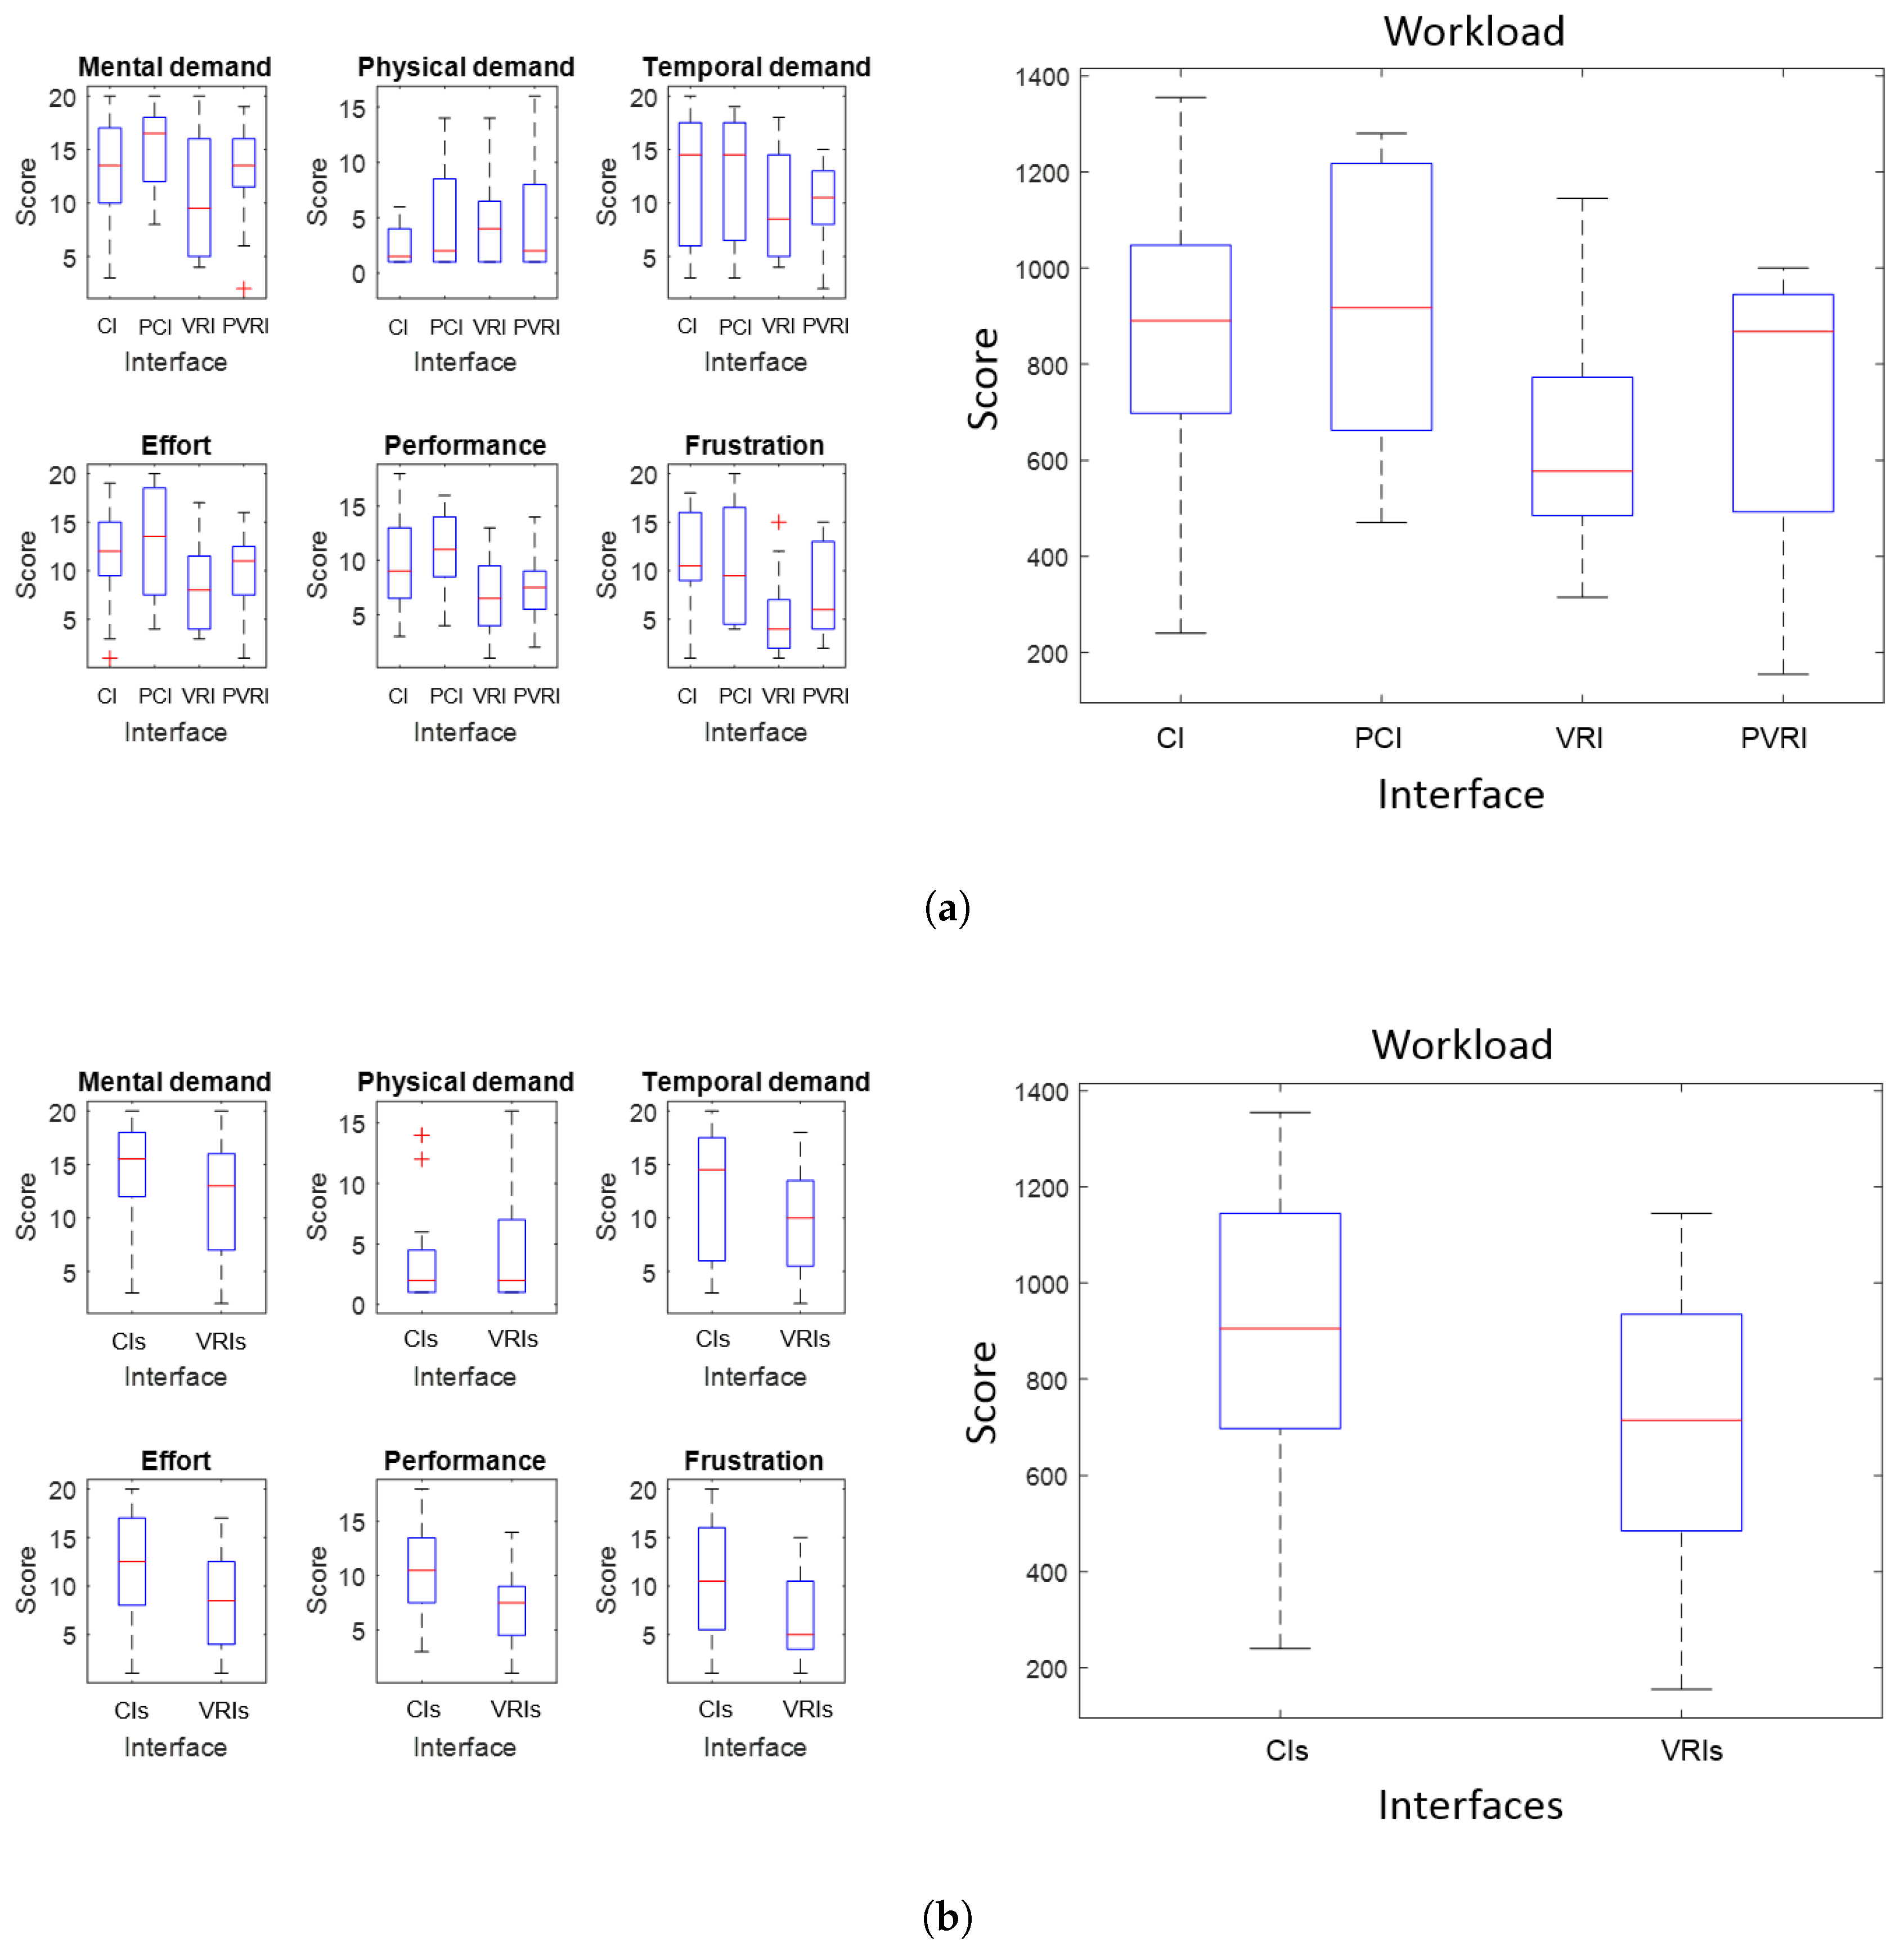
7.1. Workload
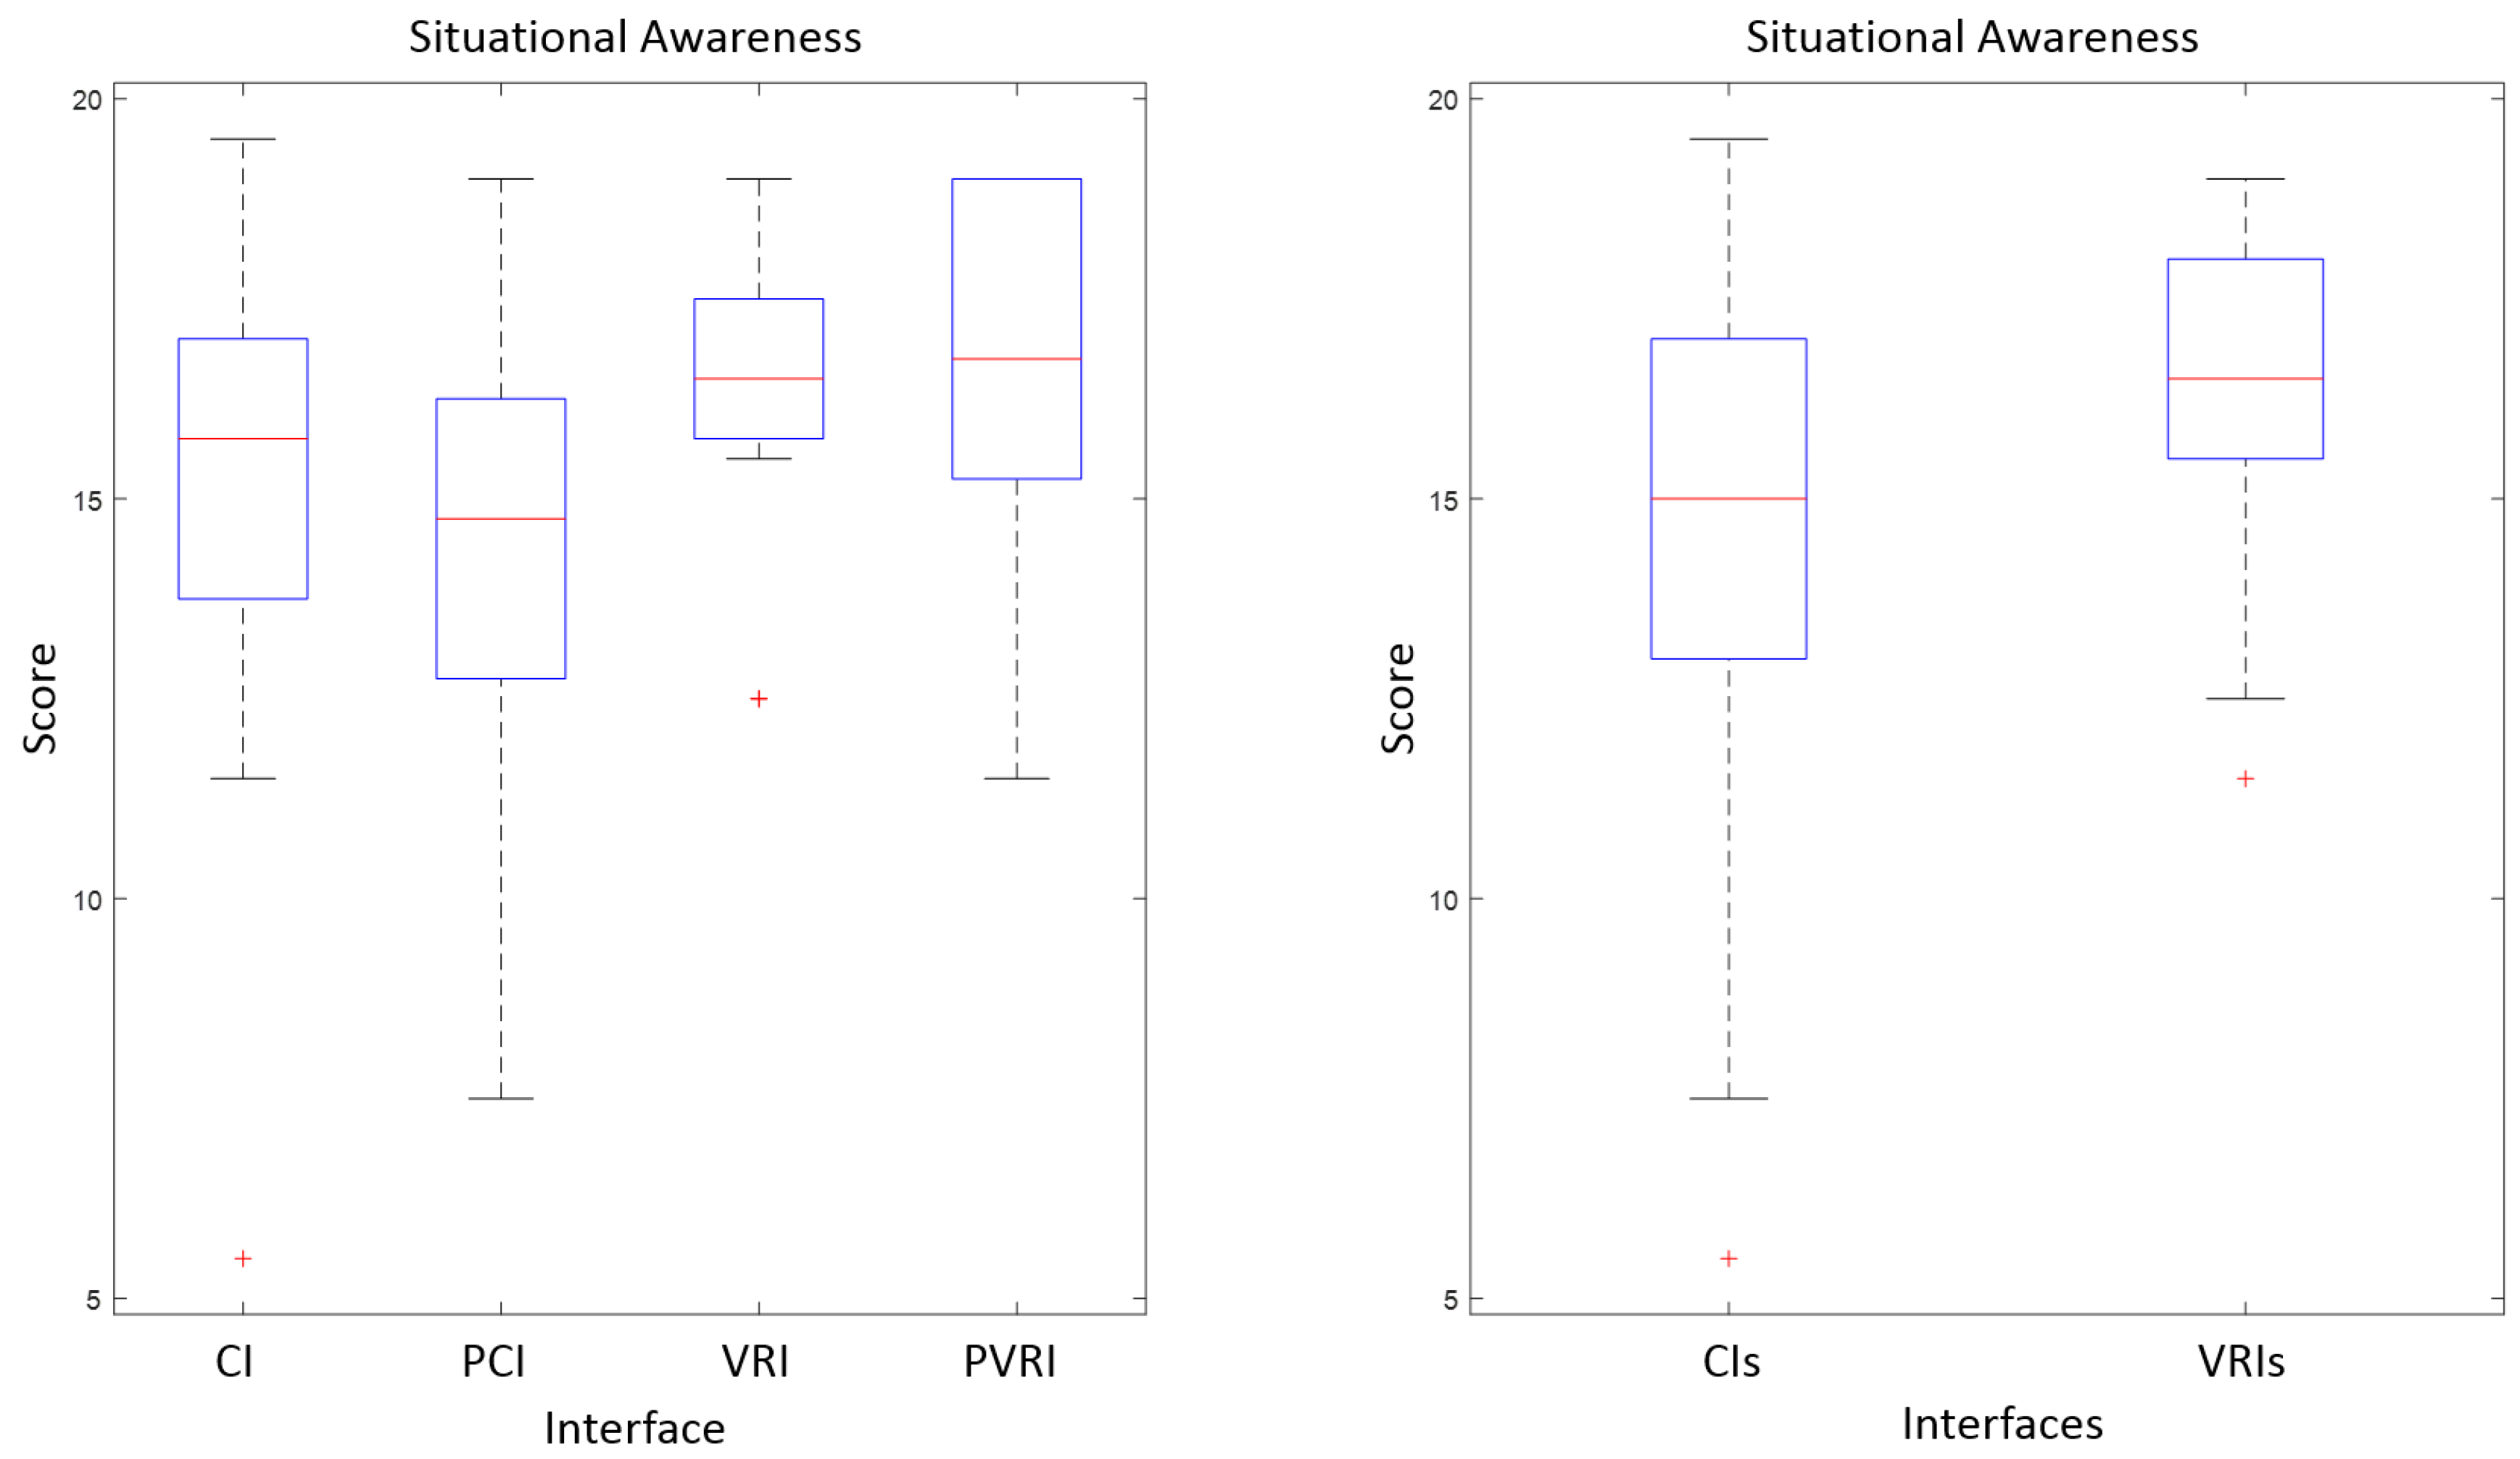
7.2. Situational Awareness
7.3. User Evaluation
8. Conclusions
Supplementary Materials
Acknowledgments
Author Contributions
Conflicts of Interest
Abbreviations
| ANOVA | Analysis of Variance |
| AR | Augmented Reality |
| IAI | Intelligent Adaptive Interface |
| NN | Neural Network |
| UAV | Unmanned Aerial Vehicle |
| UGV | Unmanned Ground Vehicle |
| VR | Virtual Reality |
| CI | Conventional Interface (developed by the authors) |
| PCI | Predictive Conventional Interface (developed by the authors) |
| PVRI | Predictive Virtual Reality Interface (developed by the authors) |
| VRI | Virtual Reality Interface (developed by the authors) |
References
- Cummings, M.L.; Bruni, S.; Mercier, S.; Mitchell, P.J. Automation Architecture for Single Operator, Multiple UAV Command and Control; Massachusetts Institute of Technology: Cambridge, MA, USA, 2007. [Google Scholar]
- Murphy, R.R.; Burke, J.L. Up from the rubble: Lessons learned about HRI from search and rescue. In Proceedings of the Human Factors and Ergonomics Society Annual Meeting, Orlando, FL, USA, 26–30 September 2005; SAGE Publications: Los Angeles, CA, USA, 2005; Volume 49, pp. 437–441. [Google Scholar]
- Lysaght, R.J.; Hill, S.G.; Dick, A.O.; Plamondon, B.D.; Linton, P.M. Operator Workload: Comprehensive Review and Evaluation of Operator Workload Methodologies (No. TR-2075-3); Analytics Inc.: Willow Grove, PA, USA, 1989. [Google Scholar]
- Moray, N. Mental Workload: Its Theory and Measurement; Moray, N., Ed.; Springer: New York, NY, USA, 2013; Volume 8. [Google Scholar]
- Hart, S.G.; Staveland, L.E. Development of NASA-TLX (Task Load Index): Results of Empirical and Theoretical Research. Adv. Psychol. 1988, 52, 139–183. [Google Scholar]
- Donmez, B.; Nehme, C.; Cummings, M.L. Modeling workload impact in multiple unmanned vehicle supervisory control. IEEE Trans. Syst. Man Cybern. Part A Syst. Humans 2010, 40, 1180–1190. [Google Scholar] [CrossRef]
- Hart, S.G. NASA-task load index (NASA-TLX); 20 years later. In Proceedings of the Human Factors and Ergonomics Society Annual Meeting, San Francisco, CA, USA, 16–20 October 2006; Sage Publications: Los Angeles, CA, USA, 2006; Volume 50, pp. 904–908. [Google Scholar]
- Endsley, M.R. Design and evaluation for situation awareness enhancement. In Proceedings of the Human Factors and Ergonomics Society Annual Meeting, Anaheim, CA, USA, 24–28 October 1988; SAGE Publications: Los Angeles, CA, USA, 1988; Volume 32, pp. 97–101. [Google Scholar]
- Endsley, M.R. Situation awareness global assessment technique (SAGAT). In Proceedings of the IEEE 1988 National Aerospace and Electronics Conference, Dayton, OH, USA, 23–27 May 1988; pp. 789–795. [Google Scholar]
- Menda, J.; Hing, J.T.; Ayaz, H.; Shewokis, P.A.; Izzetoglu, K.; Onaral, B.; Oh, P. Optical brain imaging to enhance UAV operator training, evaluation, and interface development. J. Intell. Robot. Syst. 2011, 61, 423–443. [Google Scholar] [CrossRef]
- Haas, E.C.; Pillalamarri, K.; Stachowiak, C.C.; Fields, M. Multimodal controls for soldier/swarm interaction. In Proceedings of the 2011 RO-MAN, Atlanta, GA, USA, 31 July–3 August 2011; pp. 223–228. [Google Scholar]
- Kolling, A.; Nunnally, S.; Lewis, M. Towards human control of robot swarms. In Proceedings of the Seventh Annual ACM/IEEE International Conference on Human-Robot Interaction, Boston, MA, USA, 5–8 March 2012; pp. 89–96. [Google Scholar]
- Cummings, M.L.; Mastracchio, C.; Thornburg, K.M.; Mkrtchyan, A. Boredom and distraction in multiple unmanned vehicle supervisory control. Interact. Comput. 2013, 25, 34–47. [Google Scholar] [CrossRef]
- Frische, F.; Lüdtke, A. SA–tracer: A tool for assessment of UAV swarm operator SA during mission execution. In Proceedings of the 2013 IEEE International Multi-Disciplinary Conference on Cognitive Methods in Situation Awareness and Decision Support (CogSIMA), San Diego, CA, USA, 25–28 Feburary 2013; pp. 203–211. [Google Scholar]
- Fuchs, C.; Borst, C.; de Croon, G.C.; Van Paassen, M.M.; Mulder, M. An ecological approach to the supervisory control of UAV swarms. Int. J. Micro Air Veh. 2014, 6, 211–229. [Google Scholar] [CrossRef]
- Ruiz, J.J.; Viguria, A.; Martinez-de-Dios, J.R.; Ollero, A. Immersive displays for building spatial knowledge in multi-UAV operations. In Proceedings of the IEEE 2015 International Conference on Unmanned Aircraft Systems (ICUAS), Denver, CO, USA, 9–12 June 2015; pp. 1043–1048. [Google Scholar]
- Recchiuto, C.T.; Sgorbissa, A.; Zaccaria, R. Visual feedback with multiple cameras in a UAVs Human–Swarm Interface. Robot. Auton. Syst. 2016, 80, 43–54. [Google Scholar] [CrossRef]
- Ruano, S.; Cuevas, C.; Gallego, G.; García, N. Augmented Reality Tool for the Situational Awareness Improvement of UAV Operators. Sensors 2017, 17, 297. [Google Scholar] [CrossRef] [PubMed]
- Mortimer, M.; Horan, B.; Seyedmahmoudian, M. Building a Relationship between Robot Characteristics and Teleoperation User Interfaces. Sensors 2017, 17, 587. [Google Scholar] [CrossRef] [PubMed]
- Chen, J.Y.; Haas, E.C.; Barnes, M.J. Human performance issues and user interface design for teleoperated robots. IEEE Trans. Syst. Man Cybern. Part C Appl. Rev. 2007, 37, 1231–1245. [Google Scholar] [CrossRef]
- Simpson, B.D.; Bolia, R.S.; Draper, M.H. Spatial Audio Display Concepts Supporting Situation Awareness for Operators of Unmanned Aerial Vehicles. In Human Performance, Situation Awareness, and Automation: Current Research and Trends HPSAA II; Taylor & Francis Group, Psychology Press: London, UK, 2013; Volumes I and II, p. 61. [Google Scholar]
- Scheggi, S.; Aggravi, M.; Morbidi, F.; Prattichizzo, D. Cooperative human-robot haptic navigation. In Proceedings of the 2014 IEEE International Conference on Robotics and Automation (ICRA), Hong Kong, China, 31 May–7 June 2014; pp. 2693–2698. [Google Scholar]
- Lathan, C.E.; Tracey, M. The effects of operator spatial perception and sensory feedback on human–robot teleoperation performance. Presence Teleoper. Virtual Environ. 2002, 11, 368–377. [Google Scholar] [CrossRef]
- Monajjemi, V.M.; Pourmehr, S.; Sadat, S.A.; Zhan, F.; Wawerla, J.; Mori, G.; Vaughan, R. Integrating multi-modal interfaces to command UAVs. In Proceedings of the Proceedings of the 2014 ACM/IEEE International Conference on Human–Robot Interaction, Bielefeld, Germany, 3–6 March 2014; p. 106. [Google Scholar]
- Kavitha, S.; Veena, S.; Kumaraswamy, R. Development of automatic speech recognition system for voice activated Ground Control system. In Proceedings of the 2015 International Conference on Trends in Automation, Communications and Computing Technology (I-TACT-15), Bangalore, India, 21–22 December 2015; Volume 1, pp. 1–5. [Google Scholar]
- Mantecón del Valle, T.; Adán, B.; Jaureguizar Núñez, F.; García Santos, N. New generation of human machine interfaces for controlling UAV through depth based gesture recognition. In Proceedings of the SPIE Defense, Security and Sensing Conference 2014, Baltimore, MD, USA, 5–9 May 2014. [Google Scholar]
- Nagi, J.; Giusti, A.; Di Caro, G.A.; Gambardella, L.M. Human control of UAVs using face pose estimates and hand gestures. In Proceedings of the 2014 ACM/IEEE International Conference on Human–Robot Interaction, Bielefeld, Germany, 3–6 March 2014; pp. 252–253. [Google Scholar]
- Chen, J.Y.; Barnes, M.J.; Harper-Sciarini, M. Supervisory control of multiple robots: Human-performance issues and user-interface design. IEEE Trans. Syst. Man Cybern. Part C Appl. Rev. 2011, 41, 435–454. [Google Scholar] [CrossRef]
- Drury, J.L.; Richer, J.; Rackliffe, N.; Goodrich, M.A. Comparing Situation Awareness for Two Unmanned Aerial Vehicle Human Interface Approaches; Mitre Corp.: Bedford, MA, USA, 2006. [Google Scholar]
- Li, N.; Cartwright, S.; Shekhar Nittala, A.; Sharlin, E.; Costa Sousa, M. Flying Frustum: A Spatial Interface for Enhancing Human–UAV Awareness. In Proceedings of the 3rd International Conference on Human–Agent Interaction, Kyungpook, Korea, 21–24 October 2015; pp. 27–31. [Google Scholar]
- Hansberger, J.T. Development of the Next Generation of Adaptive Interfaces (No. ARL-TR-7251); Aberdeen Proving Ground Md Human Research and Engineering Directorate, Army Research Laboratory: Washington, DC, USA, 2015. [Google Scholar]
- Hou, M.; Zhu, H.; Zhou, M.; Arrabito, G.R. Optimizing operator-agent interaction in intelligent adaptive interface design: A conceptual framework. IEEE Trans. Syst. Man Cybern. Part C Appl. Rev. 2011, 41, 161–178. [Google Scholar] [CrossRef]
- Larochelle, B.; Kruijff, G.J.M.; Smets, N.; Mioch, T.; Groenewegen, P. Establishing human situation awareness using a multi-modal operator control unit in an urban search & rescue human–robot team. Proceedigns of the 2011 RO-MAN, Atlanta, GA, USA, 31 July–3 August 2011; pp. 229–234. [Google Scholar]
- Nam, C.S.; Johnson, S.; Li, Y.; Seong, Y. Evaluation of human-agent user interfaces in multi-agent systems. Int. J. Ind. Ergon. 2009, 39, 192–201. [Google Scholar] [CrossRef]
- Hocraffer, A.; Nam, C.S. A meta-analysis of human-system interfaces in unmanned aerial vehicle (UAV) swarm management. Appl. Ergon. 2017, 58, 66–80. [Google Scholar] [CrossRef] [PubMed]
- Olson, W.A.; Wuennenberg, M.G. Autonomy based human-vehicle interface standards for remotely operated aircraft. In Proceedings of the 20th Digital Avionics Systems Conference (DASC) (Cat. No.01CH37219), Daytona Beach, FL, USA, 14–18 October 2001; Volume 2. [Google Scholar] [CrossRef]
- Scholtz, J.; Young, J.; Drury, J.L.; Yanco, H.A. Evaluation of human-robot interaction awareness in search and rescue. In Proceedings of the 2004 IEEE International Conference on Robotics and Automation (ICRA’04), New Orleans, LA, USA, 26 April–1 May 2004; Volume 3, pp. 2327–2332. [Google Scholar]
- Adams, B.; Suykens, F. Astute: Increased Situational Awareness through proactive decision support and adaptive map-centric user interfaces. In Proceedings of the 2013 European Intelligence and Security Informatics Conference, Uppsala, Sweden, 12–14 August 2013; pp. 289–293. [Google Scholar]
- Roldán, J.J.; Olivares, M.; Miguel, A.; del Cerro, J.; Barrientos, A. Analyzing and Improving Multi-Robot Missions by using Process Mining. Auton. Robots 2017. under review. [Google Scholar]
- Krajnik, T.; Vonásek, V.; Fiser, D.; Faigl, J. AR-drone as a platform for robotic research and education. In Proceedings of the International Conference on Research and Education in Robotics, Prague, Czech Republic, 15–17 June 2011; Springer: Heidelberg/Berlin, Germany, 2011; pp. 172–186. [Google Scholar]
- Bischoff, R.; Huggenberger, U.; Prassler, E. KUKA youBot—A mobile manipulator for research and education. In Proceedings of the 2011 IEEE International Conference on Robotics and Automation, Shanghai, China, 9–13 May 2011; pp. 1–4. [Google Scholar]
- Dentler, J.; Kannan, S.Mendez, M.A.O.; Voos, H. A real-time model predictive position control with collision avoidance for commercial low-cost quadrotors. In Proceedings of the 2016 IEEE Conference on Control Applications (CCA), Buenos Aires, Argentina, 19–22 September 2016; pp. 519–525. [Google Scholar]
- Quigley, M.; Conley, K.; Gerkey, B.; Faust, J.; Foote, T.; Leibs, J.; Ng, A.Y. ROS: An Open-Source Robot Operating System. ICRA Workshop Open Sour. Softw. 2009, 3, 5. [Google Scholar]
- Sanz Muñoz, D. Cognitive Risk Perception System for Obstacle Avoidance in Outdoor mUAV Missions. Ph.D. Thesis, Technical University of Madrid, Madrid, Spain, 2015. [Google Scholar]
- Roldán, J.J.; del Cerro, J.; Barrientos, A. Using Process Mining to Model Multi-UAV Missions through the Experience. IEEE Intell. Syst. 2017. [Google Scholar] [CrossRef]
- Roldán, J.J.; Garcia-Aunon, P.; del Cerro, J.; Barrientos, A. Determining mission evolution through UAV telemetry by using decision trees. In Proceedings of the 2016 IEEE International Conference on Systems, Man, and Cybernetics (SMC), Budapest, Hungary, 9–12 October 2016; pp. 000188–000193. [Google Scholar]
- Ripton, J.; Prasuethsut, L. The VR Race: What You Need to Know about Oculus Rift, HTC Vive and More. Available online: http://www.techradar.com/news/world-of-tech/future-tech/the-vr-race-who-s-closest-to-making-vr-a-reality-1266538 (accessed on 25 July 2017).
- Niehorster, D.C.; Li, L.; Lappe, M. The Accuracy and Precision of Position and Orientation Tracking in the HTC Vive Virtual Reality System for Scientific Research. i-Percept. SAGE J. 2017, 8. [Google Scholar] [CrossRef] [PubMed]
- Seo, M.W.; Choi, S.W.; Lee, S.L.; Oh, E.Y.; Baek, J.S.; Kang, S.J. Photosensor-Based Latency Measurement System for Head-Mounted Displays. Sensors 2017, 17, 1112. [Google Scholar] [CrossRef] [PubMed]
- Ohyama, S.; Nishiike, S.; Watanabe, H.; Matsuoka, K.; Akizuki, H.; Takeda, N.; Harada, T. Autonomic responses during motion sickness induced by virtual reality. Auris Nasus Larynx 2007, 34, 303–306. [Google Scholar] [CrossRef] [PubMed]
- Fagerholt, E.; Lorentzon, M. Beyond the HUD-User Interfaces for Increased Player Immersion in FPS Games. Master’s Thesis, Department of Computer Science and Engineering, Chalmers University of Technology, Gothenburg, Sweden, 2009. [Google Scholar]


| Issue | Problems | Detection | Solution |
|---|---|---|---|
| Workload | Excessive: Inefficiency | Physiological signals | Adjust autonomy |
| and errors | Test (NASA-TLX) | Transfer functions | |
| Situational | Lack: Inefficiency | Actions and performance | Immersive interface |
| awareness | and errors | Test (SAGAT) | Filter information |
| Stress | Boredom: Human errors | Physiological signals | Adjust autonomy |
| Anxiety: Human errors | Test (NASA-TLX) | Filter information | |
| Trust | Mistrust: Human errors | Reactions | Adjust autonomy |
| Overtrust: Machine errors | Survey | Train operators |
| Reference | Robots | Operators | Multimodal | Immersive | VR | AR | Adaptive |
|---|---|---|---|---|---|---|---|
| [10] | 1 | 1 | Yes | No | No | No | No |
| [11] | 40 | 1 | Yes | No | No | No | No |
| [12] | 50–200 | 1 | No | No | No | No | No |
| [13] | 4 | 1 | No | No | No | No | No |
| [14] | 3 | 1 | No | No | No | No | No |
| [15] | 4 | 1 | No | No | No | No | No |
| [16] | 3 | 1 | No | Yes | Yes | No | No |
| [17] | 10 | 1 | No | Yes | No | No | No |
| [18] | 1 | 1 | No | Yes | No | Yes | No |
| [19] | N | 1 | No | No | No | No | Yes |
| CI | 2 | 1 | No | No | No | No | No |
| PCI | 2 | 1 | No | No | No | No | Yes |
| VRI | 2 | 1 | Yes | Yes | Yes | No | No |
| PVRI | 2 | 1 | Yes | Yes | Yes | No | Yes |
| Reference | Requirement |
|---|---|
| [33] | Resistance to weather, environment and harsh conditions. |
| [34] | Reduction of the amount of information. |
| [35] | Adaptation to the preferences of operator. |
| [36] | Guidance of operator attention to relevant information. |
| [37] | Integration of robot position, health, status and measurements in the same displays. |
| [38] | Use of maps to show information about robots and mission. |
| Name | Type | Hardware Required |
|---|---|---|
| Sony PlayStation VR | Tethered | PlayStation 4 |
| HTC Vive | Tethered | PC |
| Oculus Rift | Tethered | PC |
| Google Daydream View | Mobile | Daydream compatible phone |
| Samsung Gear VR | Mobile | Latest Samsung Galaxy models |
| Homido VR | Mobile | Android and iOS phones |
| FreeFly VR | Mobile | Android and iOS phones |
| Google Cardboard | Mobile | Android and iOS phones |
| Subject | Interface | Mission |
|---|---|---|
| O1 | VRI and CI | M1 and M2 |
| O2 | VRI and PCI | M3 and M4 |
| O3 | PVRI and CI | M5 and M6 |
| O4 | PVRI and PCI | M7 and M8 |
| O5 | CI and VRI | M8 and M7 |
| O6 | CI and PVRI | M6 and M5 |
| O7 | PCI and VRI | M4 and M3 |
| O8 | PCI and PVRI | M2 and M1 |
| O9 | VRI and CI | M8 and M7 |
| O10 | VRI and PCI | M6 and M5 |
| O11 | PVRI and CI | M4 and M3 |
| O12 | PVRI and PCI | M2 and M1 |
| O13 | CI and VRI | M1 and M2 |
| O14 | CI and PVRI | M3 and M4 |
| O15 | PCI and VRI | M5 and M6 |
| O16 | PCI and PVRI | M7 and M8 |
| O17 | VRI and CI | M5 and M6 |
| O18 | VRI and PCI | M7 and M8 |
| O19 | PVRI and CI | M8 and M7 |
| O20 | PVRI and PCI | M6 and M5 |
| O21 | CI and VRI | M4 and M3 |
| O22 | CI and PVRI | M2 and M1 |
| O23 | PCI and VRI | M1 and M2 |
| O24 | PCI and PVRI | M3 and M4 |
| Interface | Workload (NASA-TLX) | Situational Awareness (SAGAT) | Evaluation (+/−) |
|---|---|---|---|
| CI | 853 | 14.91 | 0/7 |
| PCI | 915 | 14.33 | 0/7 |
| VRI | 638 | 16.25 | 5/5 |
| PVRI | 740 | 16.46 | 10/5 |
| VRI | PVRI | |
|---|---|---|
| CI | CI > VRI | CI > PVRI |
| Significant (p = 0.0180) | Non-significant (p = 0.3716) | |
| PCI | PCI > VRI | PCI > PVRI |
| Significant (p = 0.0237) | Non-significant (p = 0.1008) |
| VRI | PVRI | |
|---|---|---|
| CI | CI < VRI | CI < PVRI |
| Non-significant (p = 0.2584) | Non-significant (p = 0.3461) | |
| PCI | PCI < VRI | PCI < PVRI |
| Non-significant (p = 0.1011) | Non-significant (p = 0.0978) |
© 2017 by the authors. Licensee MDPI, Basel, Switzerland. This article is an open access article distributed under the terms and conditions of the Creative Commons Attribution (CC BY) license (http://creativecommons.org/licenses/by/4.0/).
Share and Cite
Roldán, J.J.; Peña-Tapia, E.; Martín-Barrio, A.; Olivares-Méndez, M.A.; Del Cerro, J.; Barrientos, A. Multi-Robot Interfaces and Operator Situational Awareness: Study of the Impact of Immersion and Prediction. Sensors 2017, 17, 1720. https://doi.org/10.3390/s17081720
Roldán JJ, Peña-Tapia E, Martín-Barrio A, Olivares-Méndez MA, Del Cerro J, Barrientos A. Multi-Robot Interfaces and Operator Situational Awareness: Study of the Impact of Immersion and Prediction. Sensors. 2017; 17(8):1720. https://doi.org/10.3390/s17081720
Chicago/Turabian StyleRoldán, Juan Jesús, Elena Peña-Tapia, Andrés Martín-Barrio, Miguel A. Olivares-Méndez, Jaime Del Cerro, and Antonio Barrientos. 2017. "Multi-Robot Interfaces and Operator Situational Awareness: Study of the Impact of Immersion and Prediction" Sensors 17, no. 8: 1720. https://doi.org/10.3390/s17081720