Real-Time Monitoring and Analysis of Zebrafish Electrocardiogram with Anomaly Detection

 ,
, 
Abstract
:1. Introduction
2. Designs, Methods and Implementation
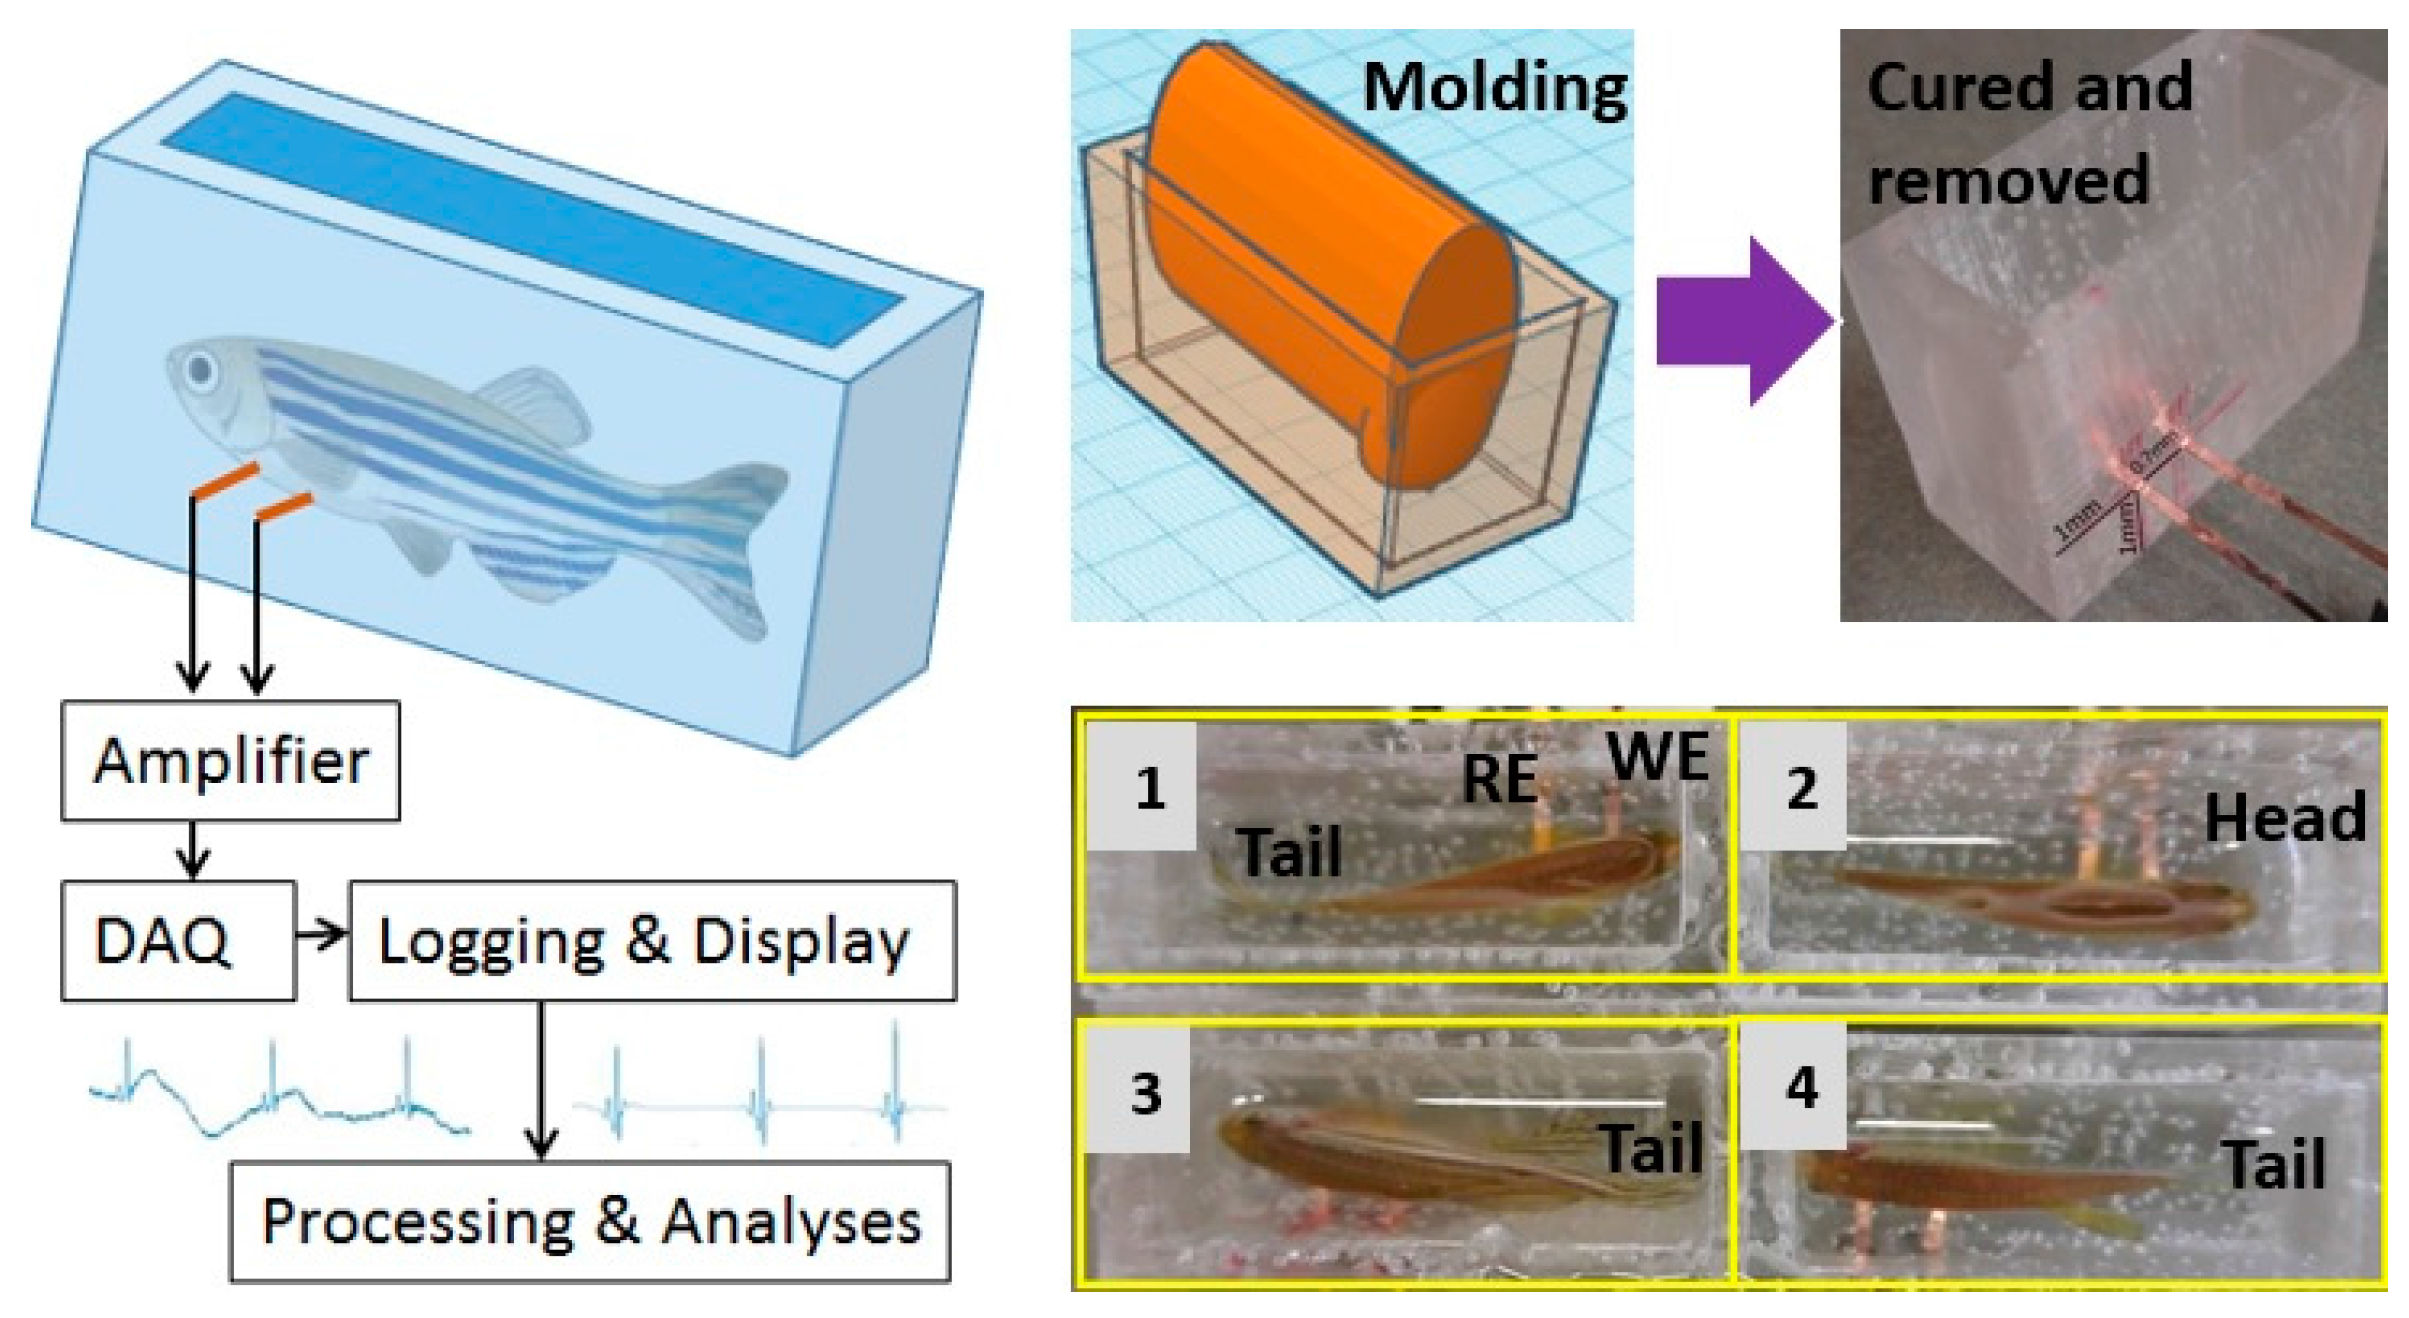
2.1. ECG Acquisition Devices
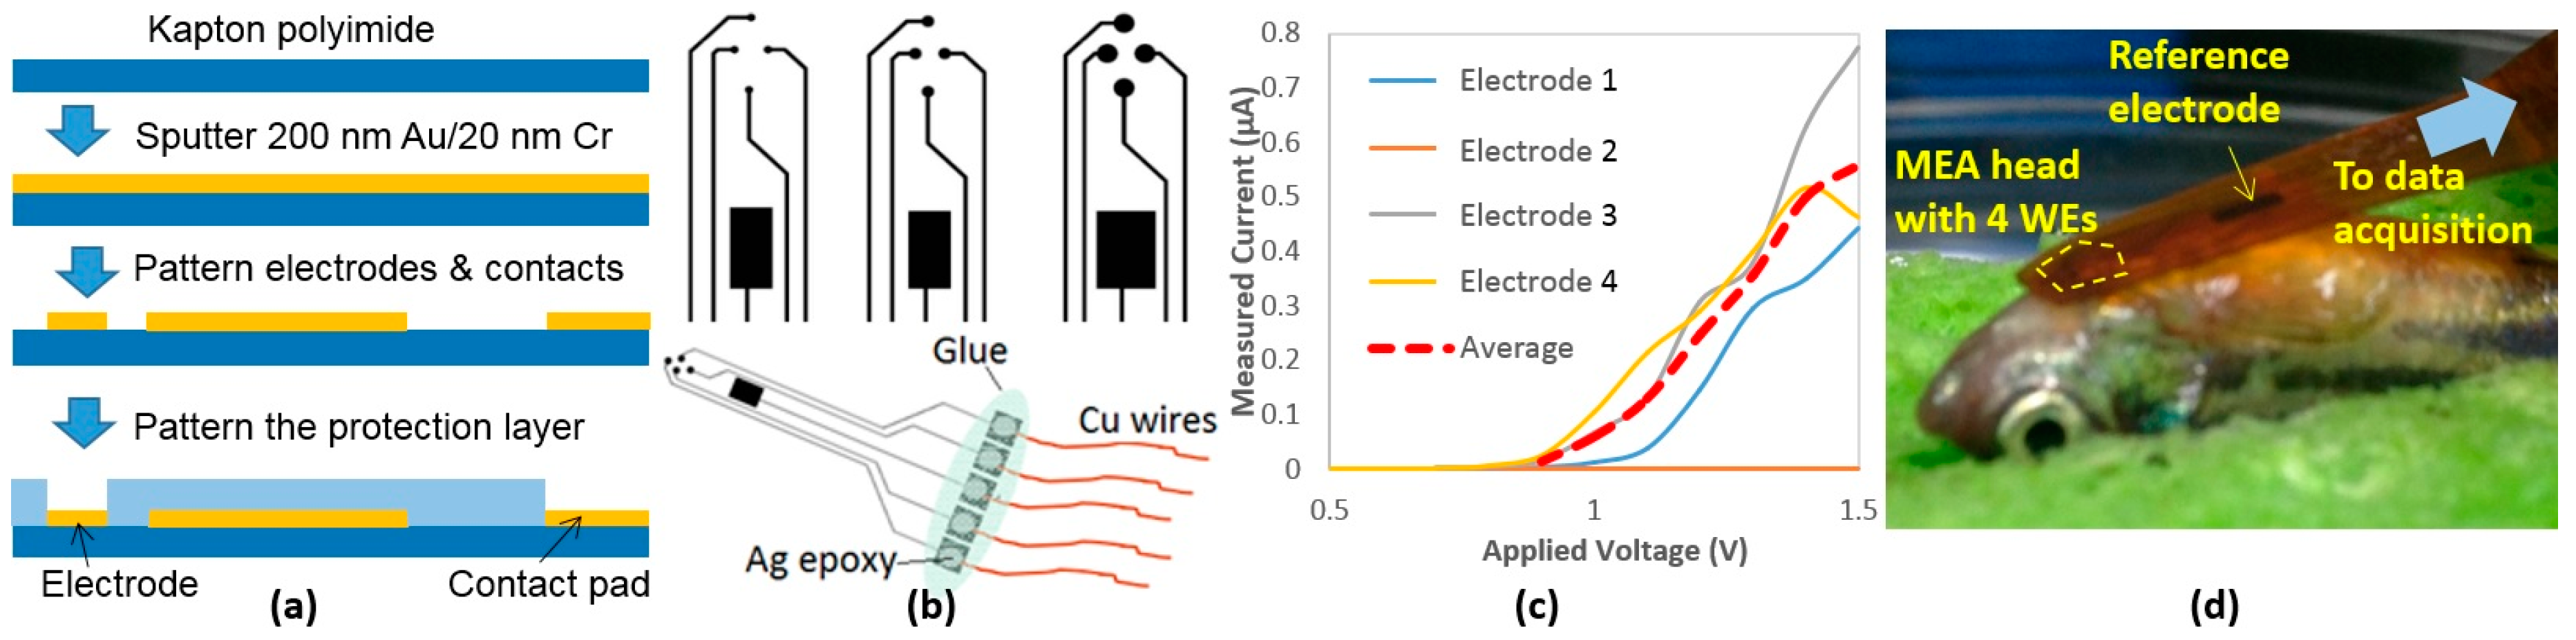
2.1.1. Polymer-Based MEA Membranes
2.1.2. PDMS Housing
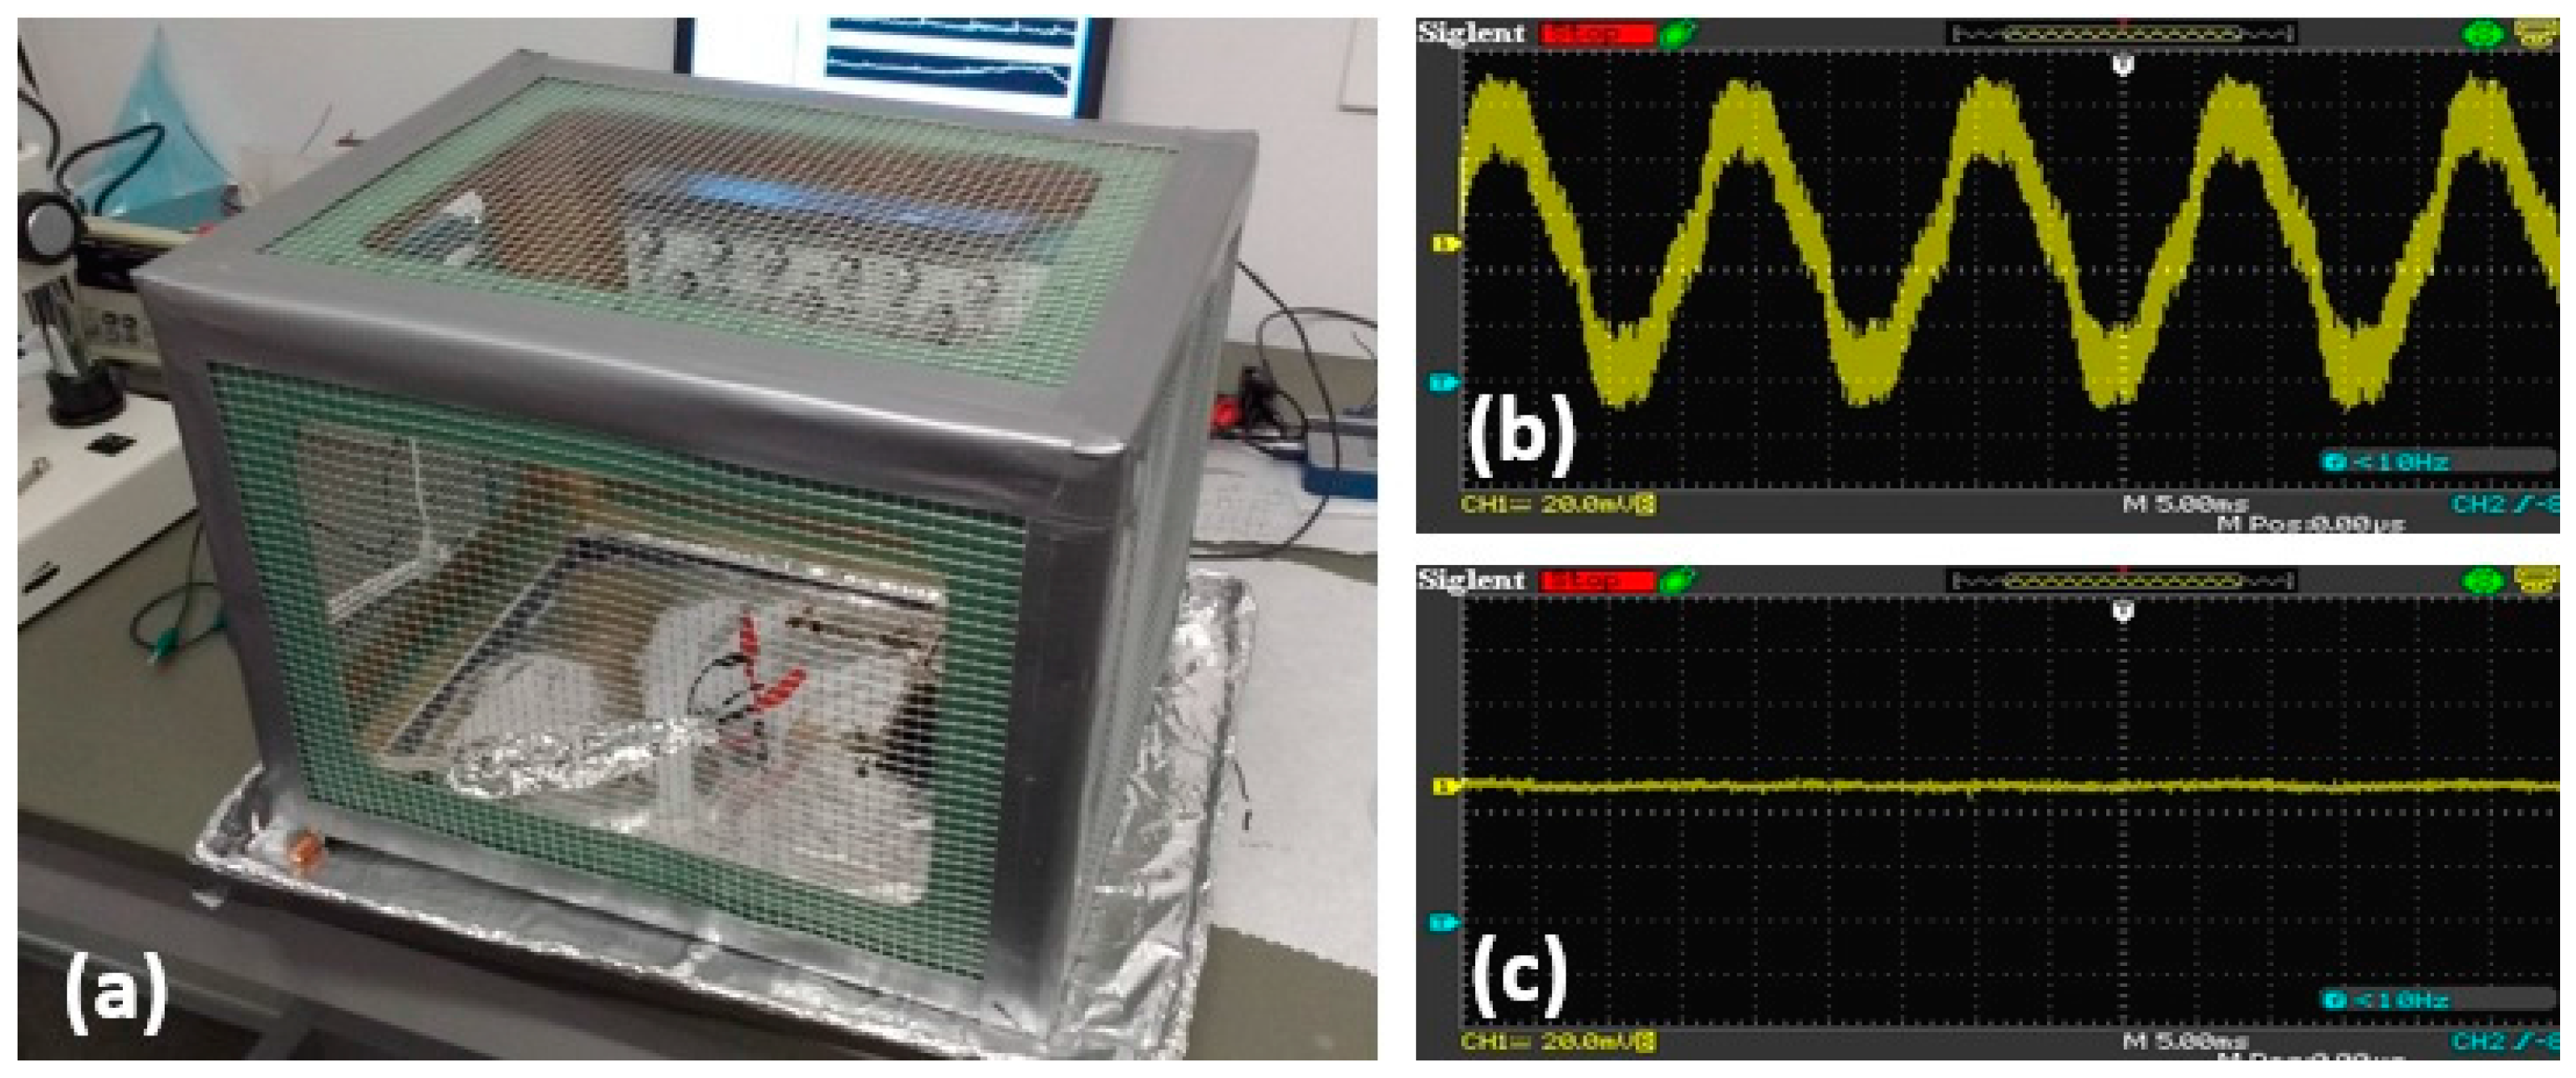
2.2. Noise Attenuation
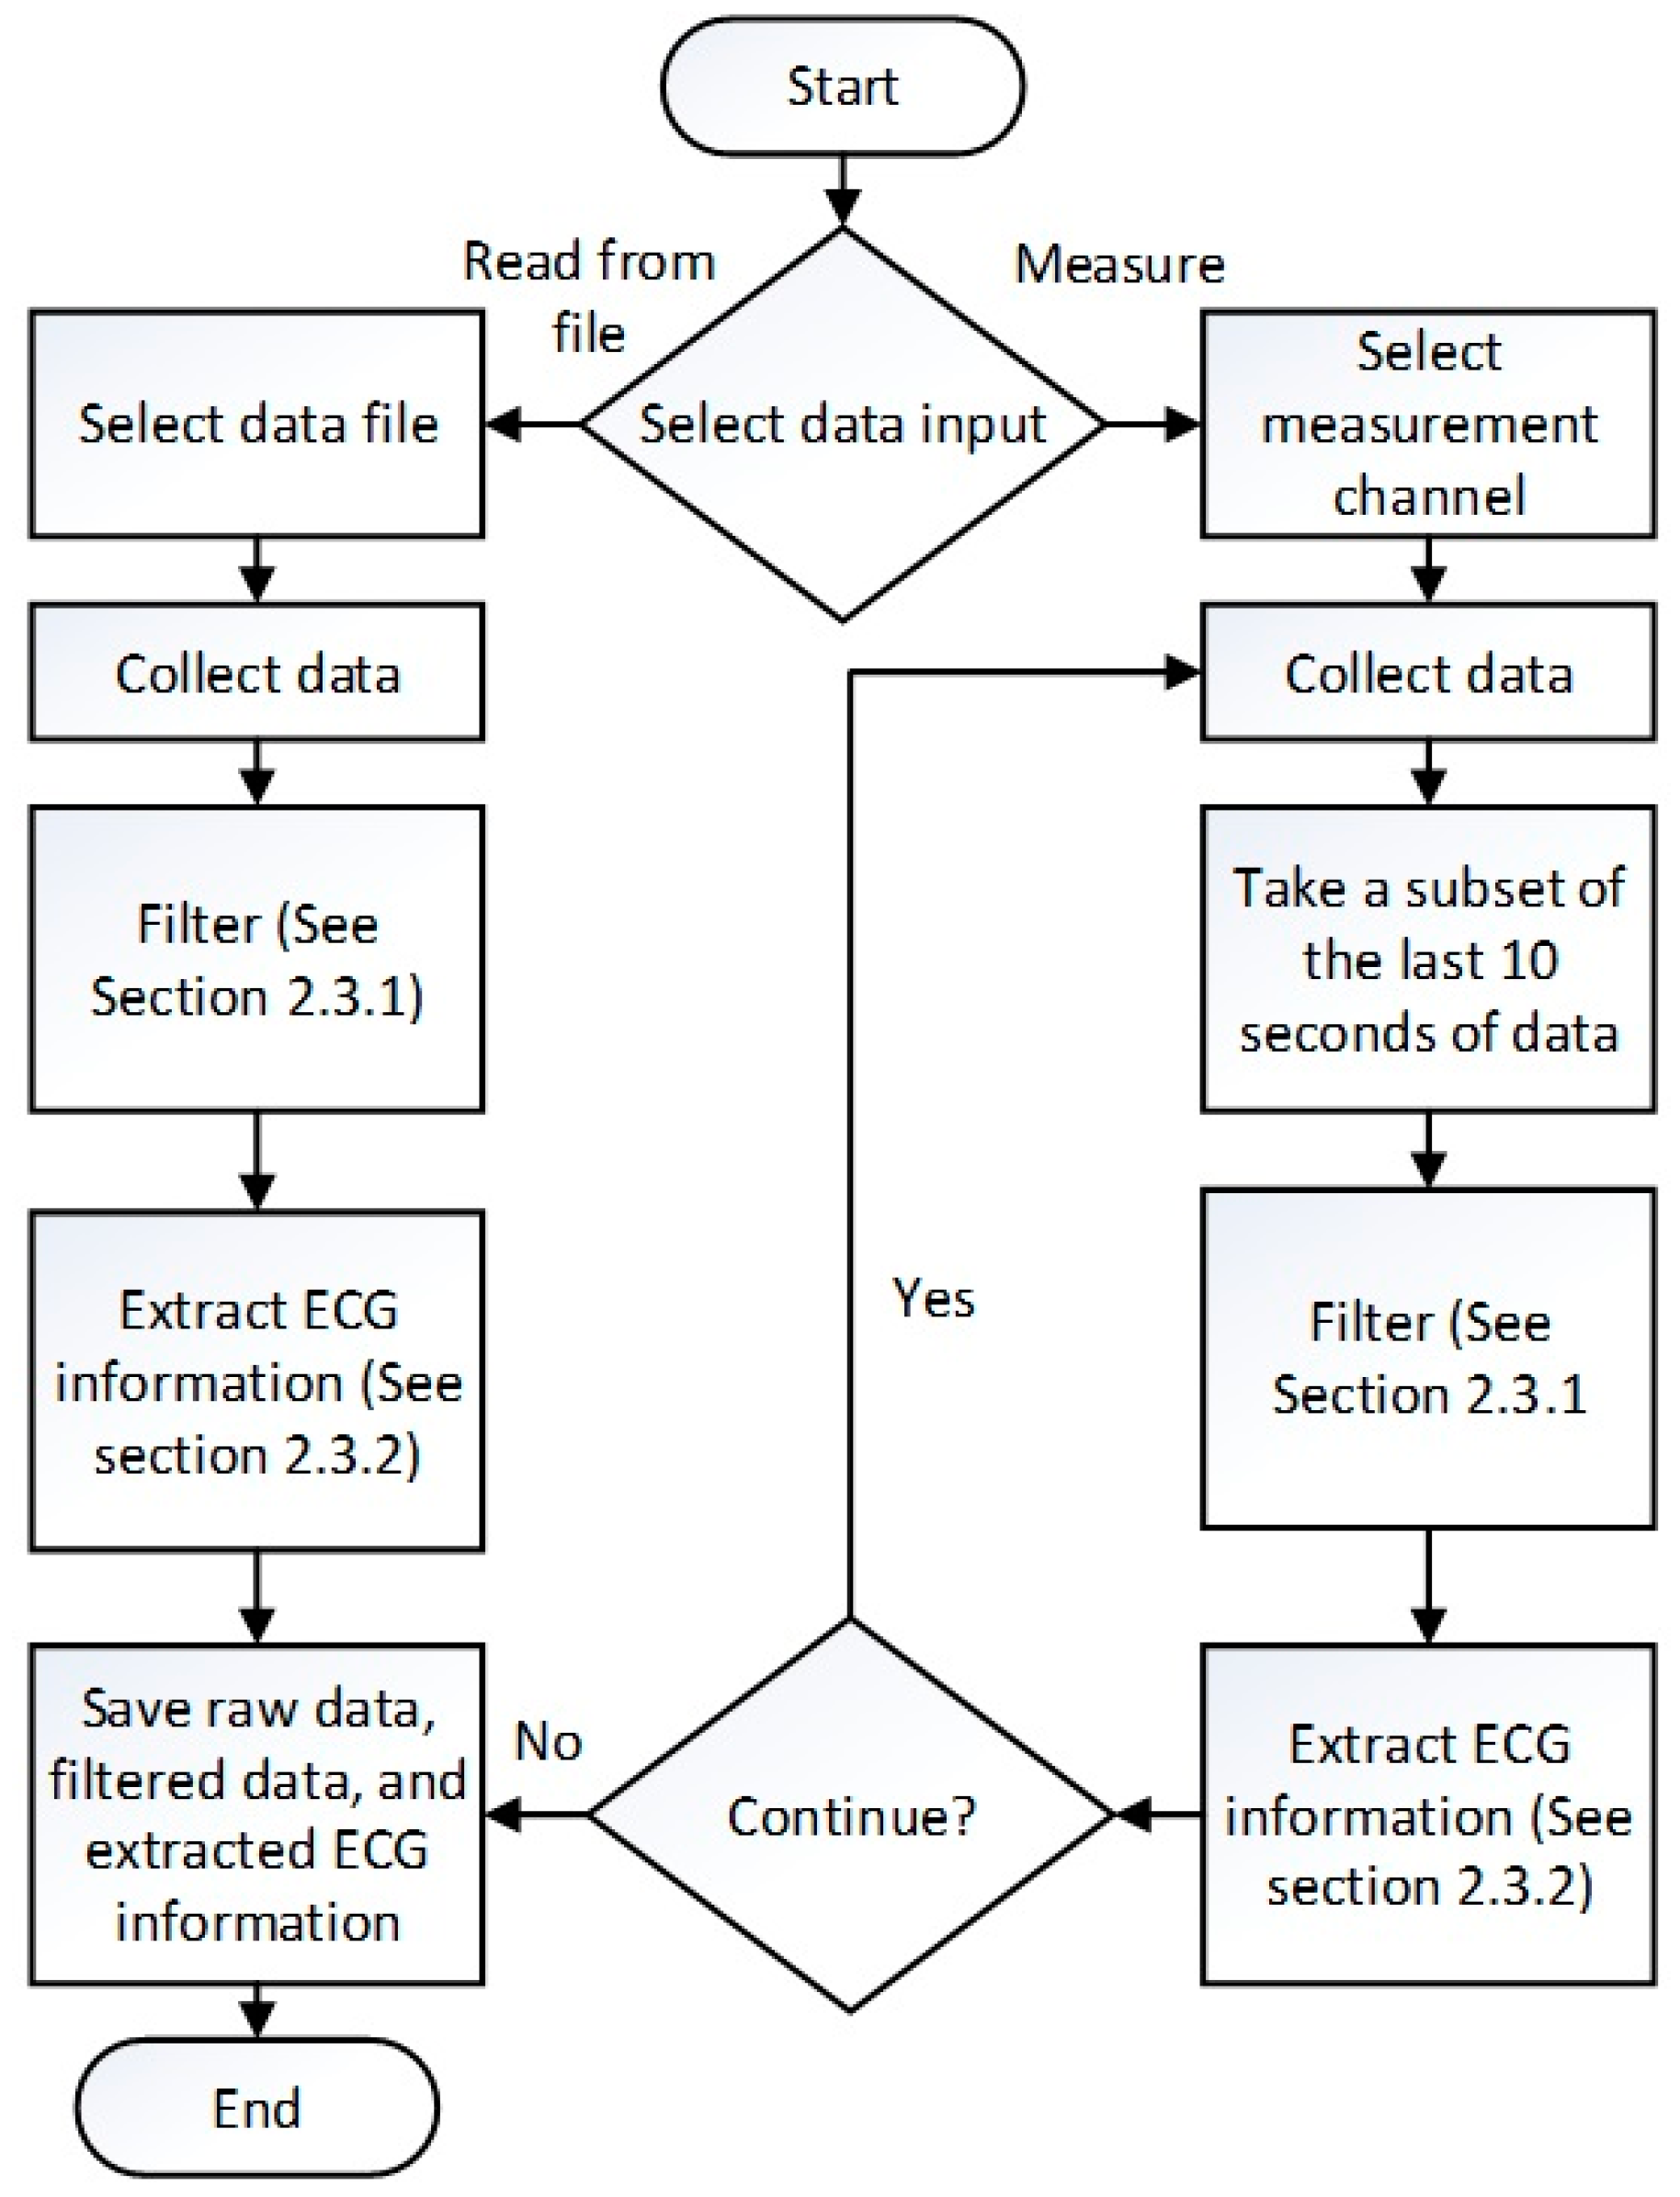
2.3. Labview Graphical User Interface (GUI) for Signal Acquistion and Processing
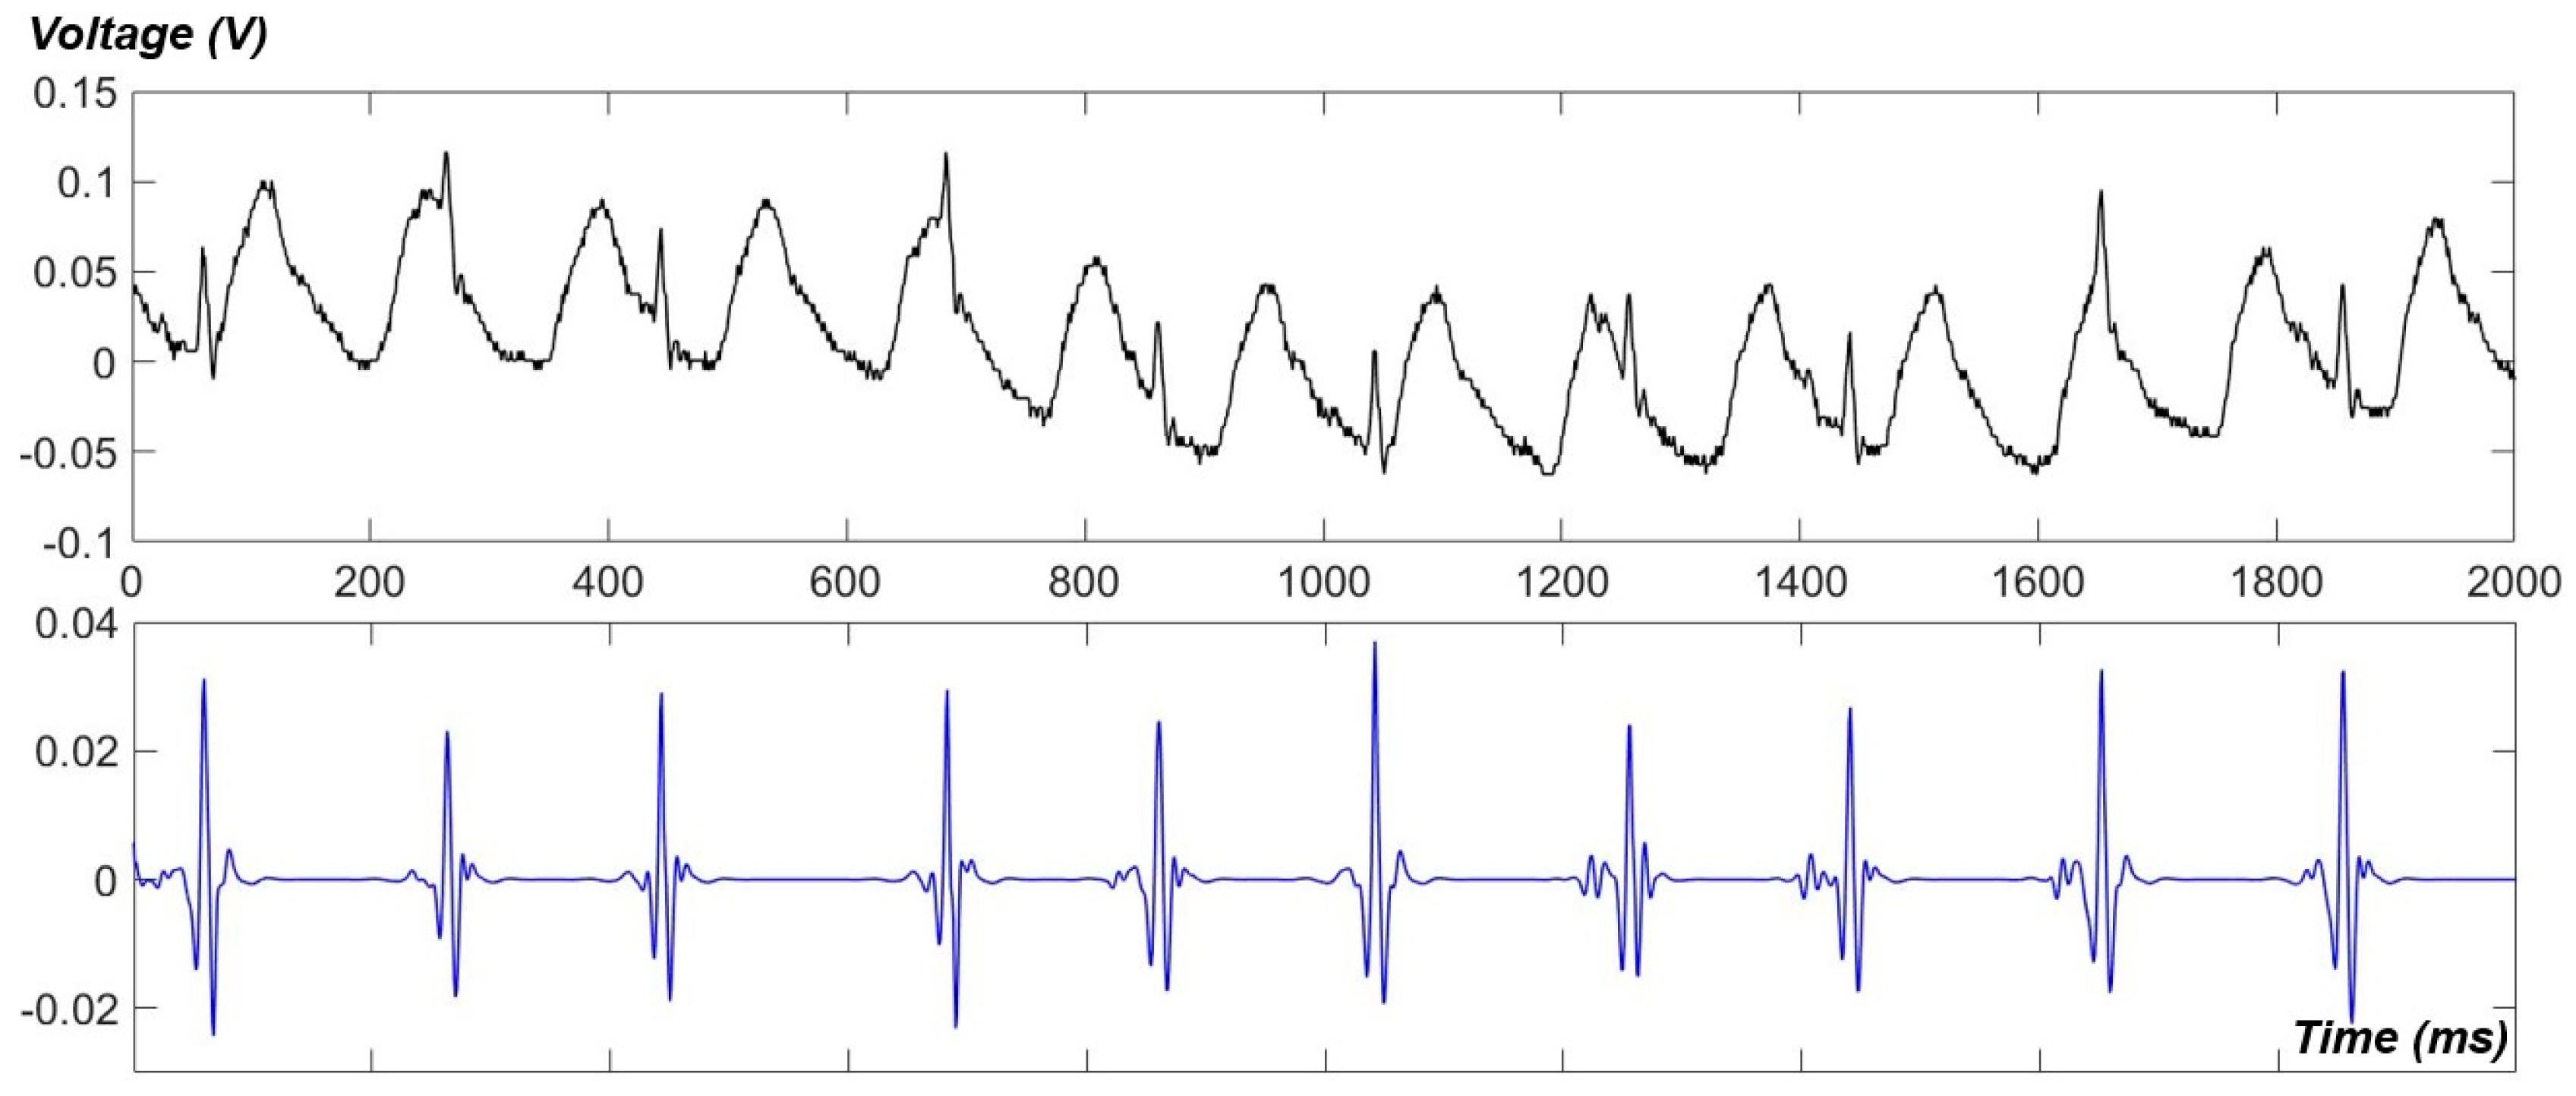
2.3.1. Filtering the Acquired ECG Data
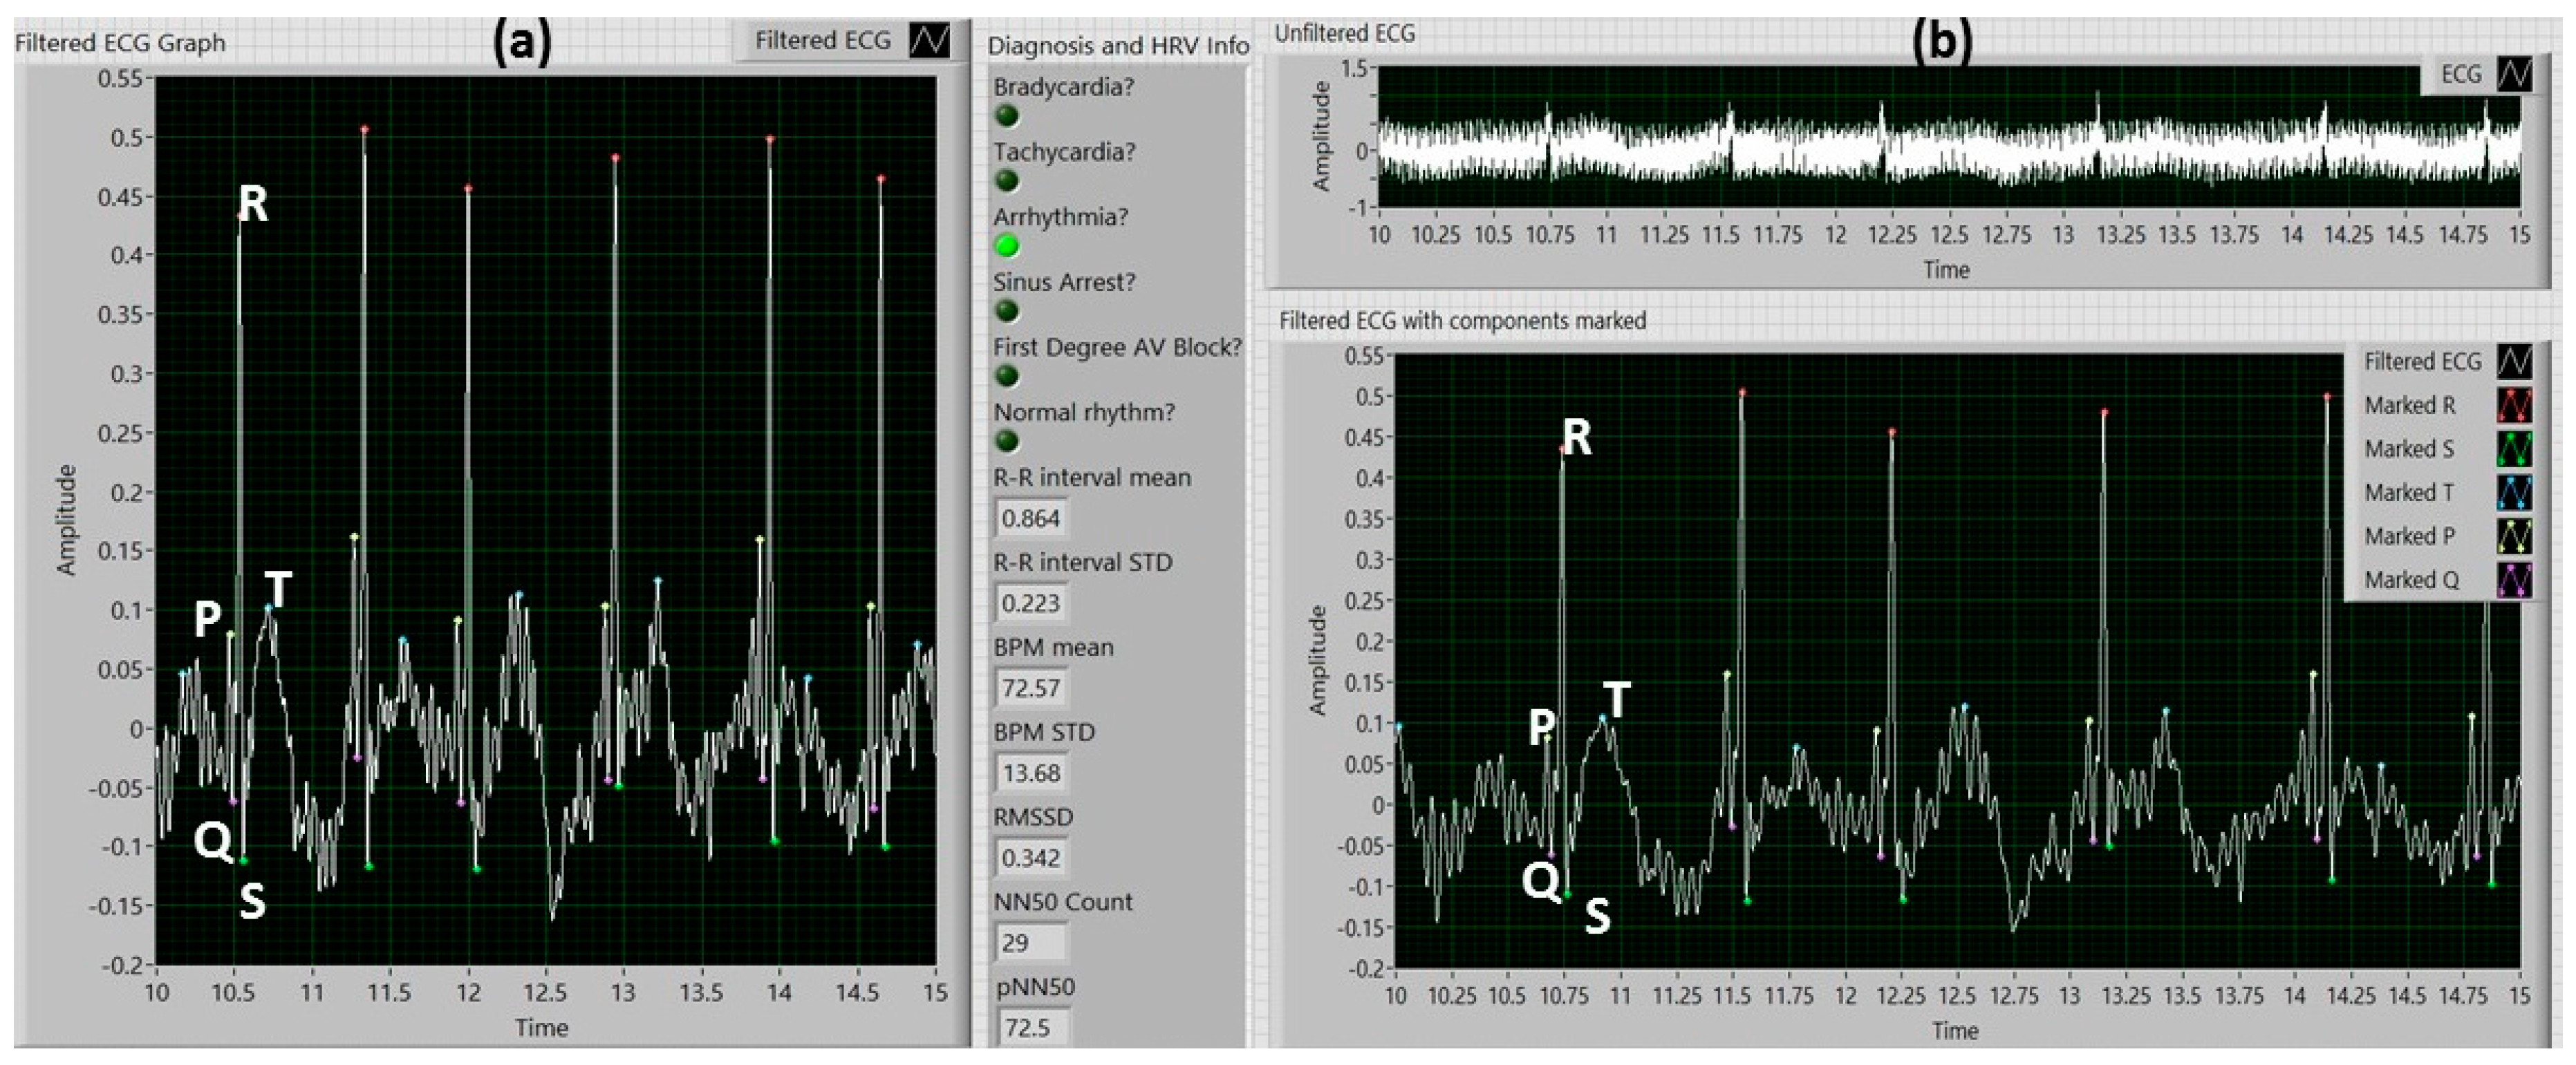
2.3.2. Extracting ECG Information
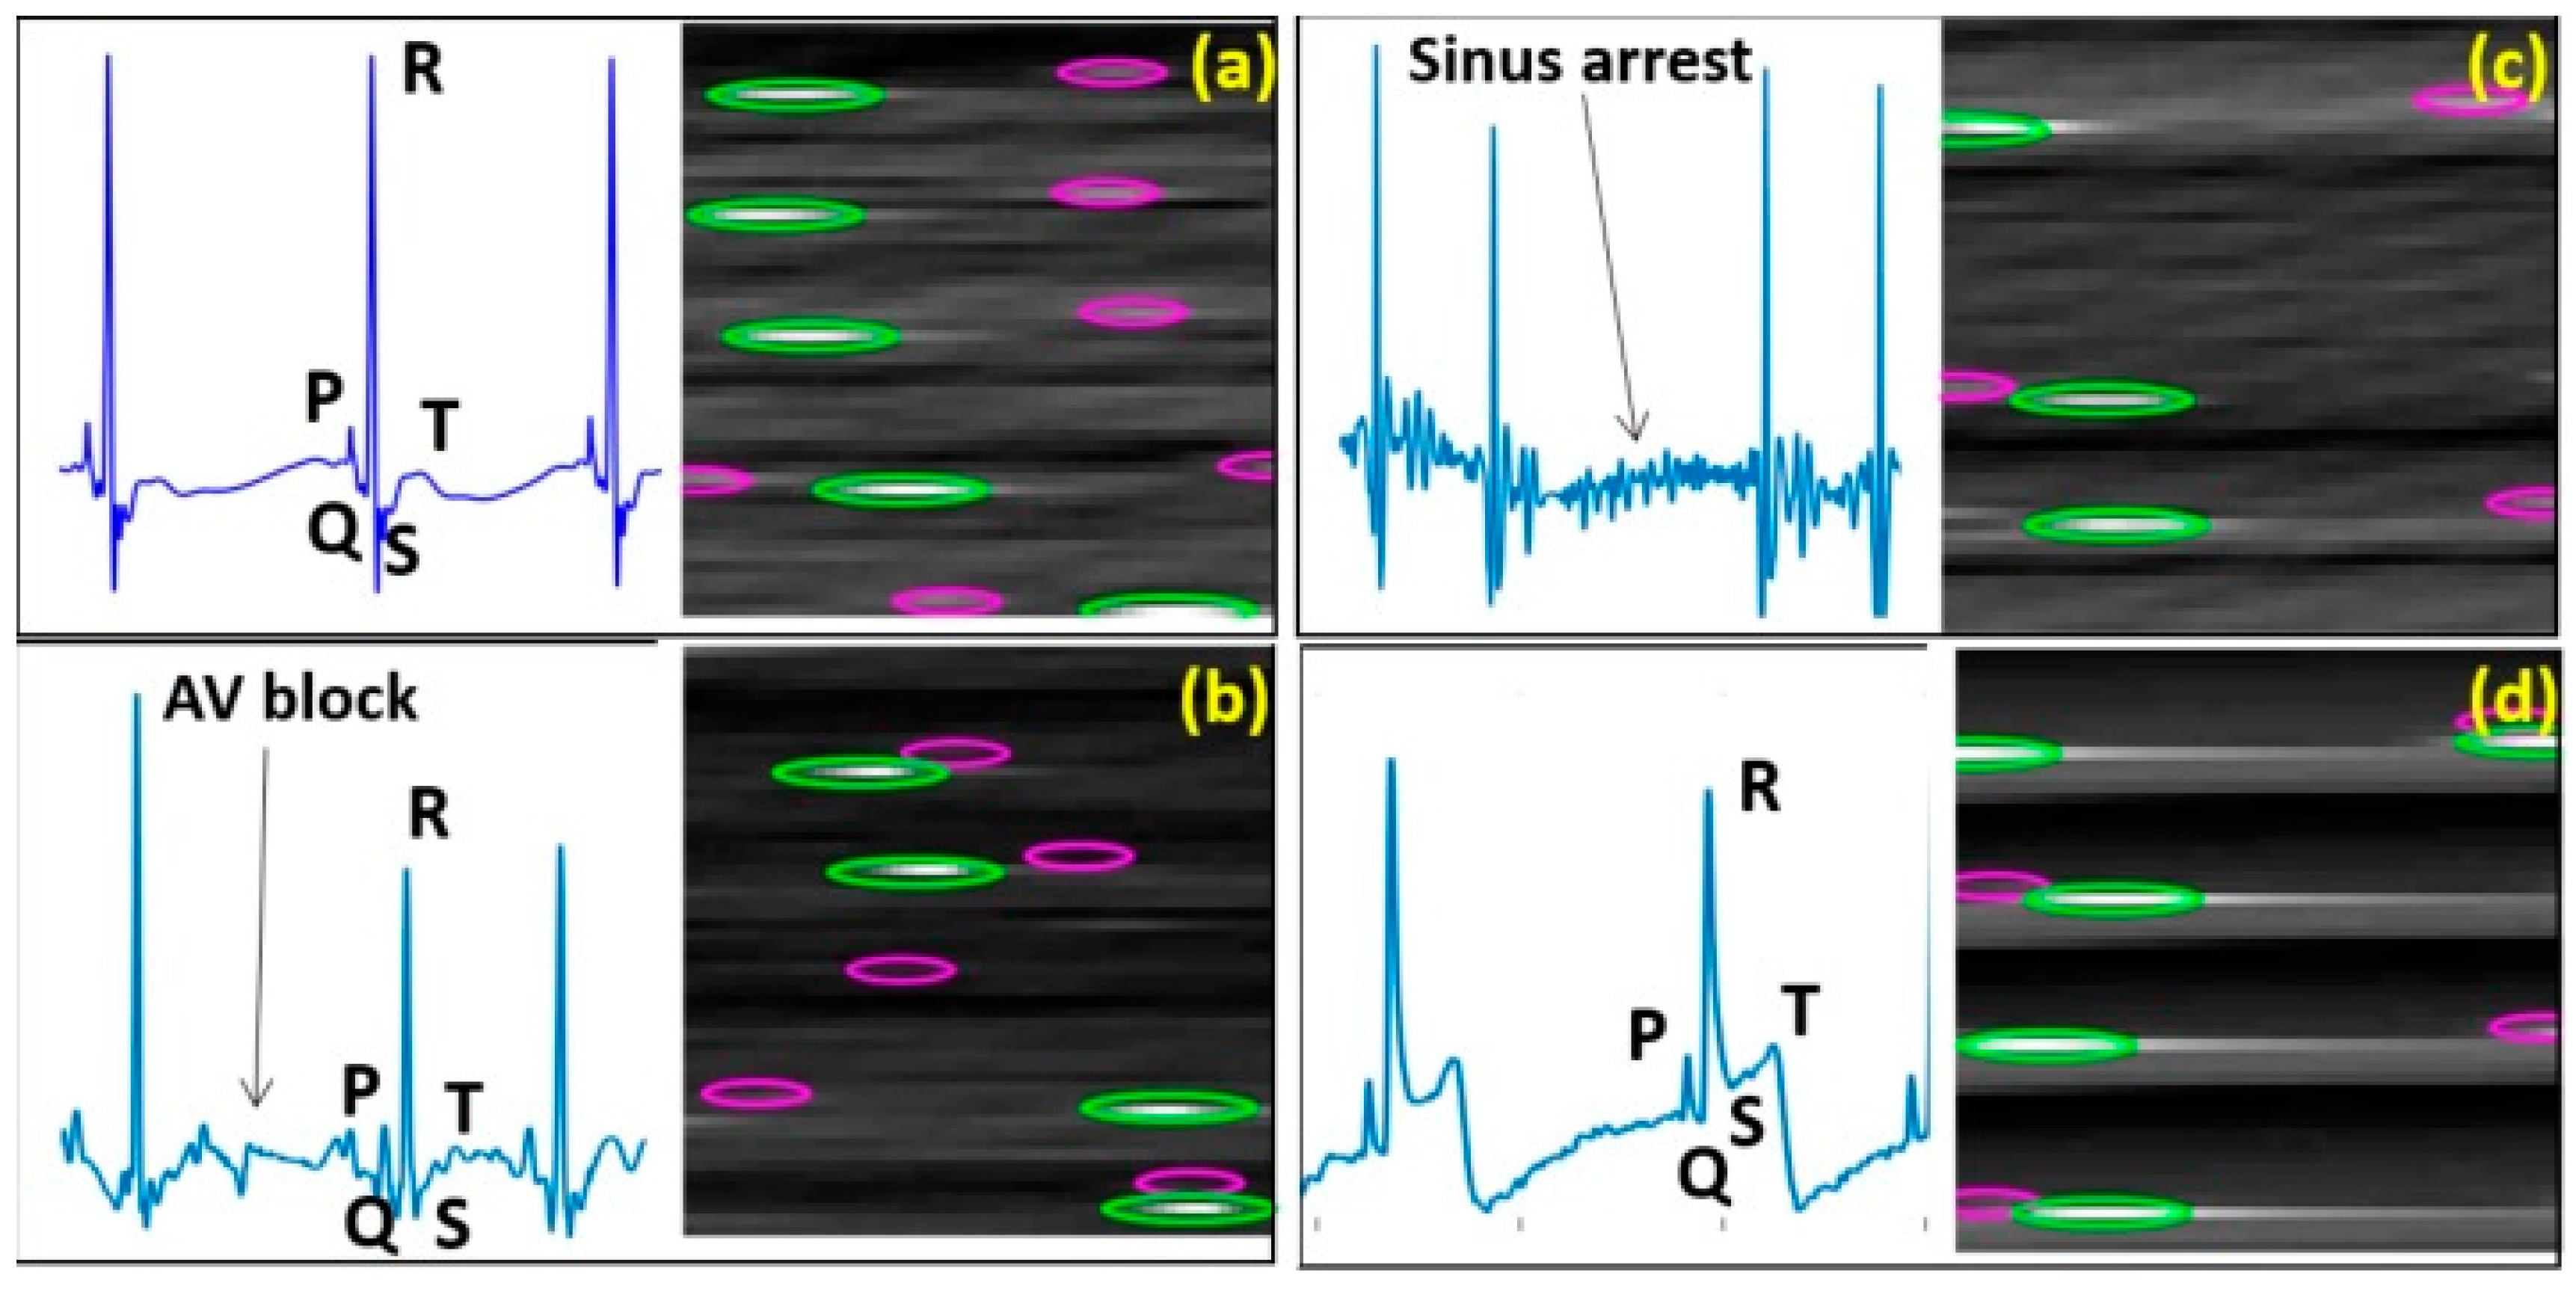
2.3.3. Detection of ECG Anomalies
2.4. Machine Learning Approaches
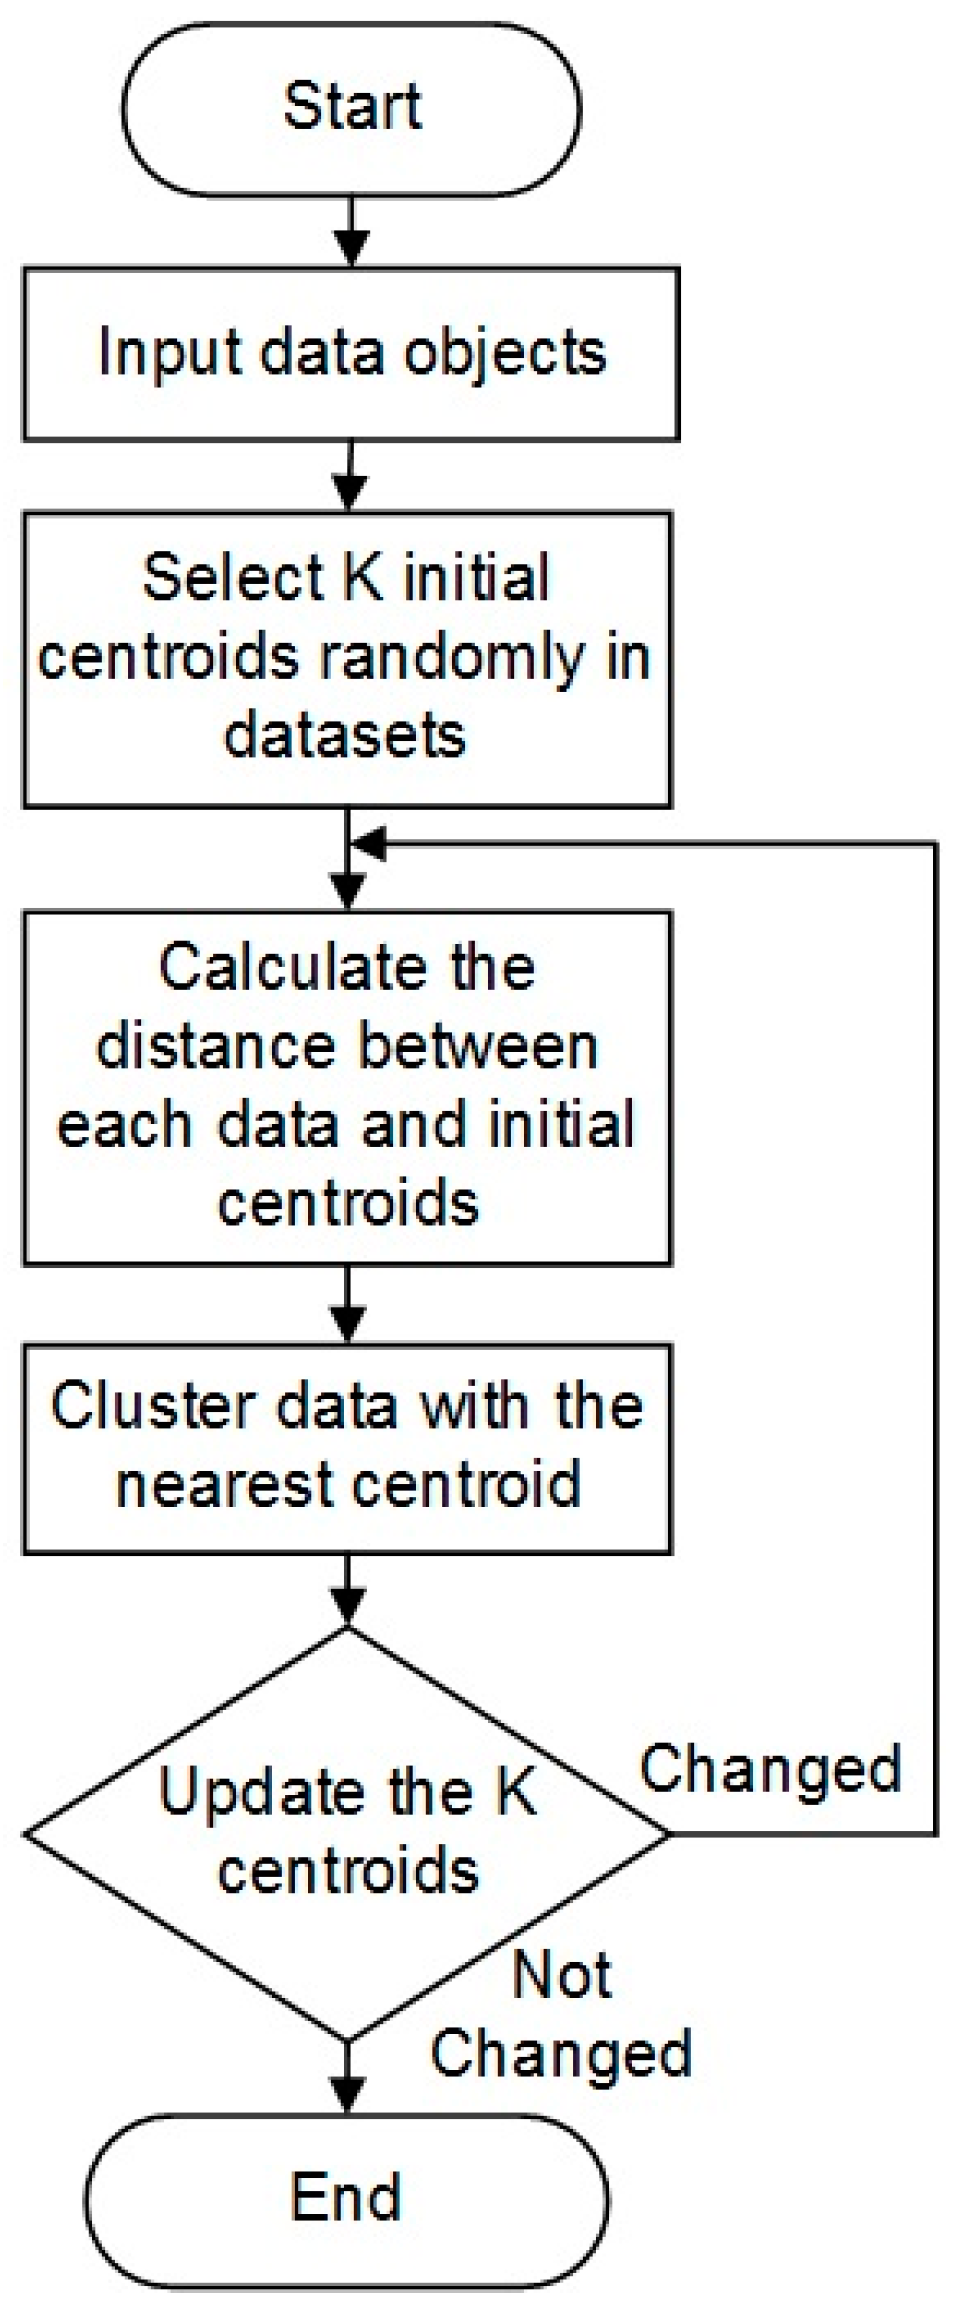
2.4.1. K-Means Clustering
2.4.2. Artificial Neural Networks
2.4.3. Algorithm Evaluation
3. Results
4. Discussion
5. Future Work and Conclusions
Acknowledgments
Author Contributions
Conflicts of Interest
References
- Guo, S. Linking genes to brain, behavior and neurological diseases: What can we learn from zebrafish? Genes Brain Behav. 2004, 3, 63–74. [Google Scholar] [CrossRef] [PubMed]
- Bakkers, J. Zebrafish as a model to study cardiac development and human cardiac disease. Cardiovasc. Res. 2011, 91, 279–288. [Google Scholar] [CrossRef] [PubMed]
- Major, R.J.; Poss, K.D. Zebrafish heart regeneration as a model for cardiac tissue repair. Drug Discov. Today Dis. Models 2007, 4, 219–225. [Google Scholar] [CrossRef] [PubMed]
- Bournele, D.; Beis, D. Zebrafish models of cardiovascular disease. Heart Fail. Rev. 2016, 21, 803–813. [Google Scholar] [CrossRef] [PubMed]
- Poss, K.D.; Wilson, L.G.; Keating, M.T. Heart regeneration in zebrafish. Science 2002, 298, 2188–2190. [Google Scholar] [CrossRef] [PubMed]
- Raya, A.; Consiglio, A.; Kawakami, Y.; Rodriguez-Esteban, C.; Izpisua-Belmonte, J.C. The zebrafish as a model of heart regeneration. Cloning Stem Cells 2004, 6, 345–351. [Google Scholar] [CrossRef] [PubMed]
- Haïssaguerre, M.; Derval, N.; Sacher, F.; Jesel, L.; Deisenhofer, I.; de Roy, L.; Pasquié, J.L.; Nogami, A.; Babuty, D.; Yli-Mayry, S.; et al. Sudden cardiac arrest associated with early repolarization. N. Engl. J. Med. 2008, 358, 2016–2023. [Google Scholar] [CrossRef] [PubMed]
- Lubitz, S.A.; Ellinor, P.T. Next-generation sequencing for the diagnosis of cardiac arrhythmia syndromes. Heart Rhythm 2015, 12, 1062–1070. [Google Scholar] [CrossRef] [PubMed]
- Heideman, W.; Antkiewicz, D.S.; Carney, S.A.; Peterson, R.E. Zebrafish and cardiac toxicology. Cardiovasc. Toxicol. 2005, 5, 203–214. [Google Scholar] [CrossRef]
- Hill, A.J.; Teraoka, H.; Heideman, W.; Peterson, R.E. Zebrafish as a model vertebrate for investigating chemical toxicity. Toxicol. Sci. 2005, 86, 6–19. [Google Scholar] [CrossRef] [PubMed]
- Barros, T.; Alderton, W.; Reynolds, H.; Roach, A.; Berghmans, S. Zebrafish: An emerging technology for in vivo pharmacological assessment to identify potential safety liabilities in early drug discovery. Br. J. Pharmacol. 2008, 154, 1400–1413. [Google Scholar] [CrossRef] [PubMed]
- Zon, L.I.; Peterson, R.T. In vivo drug discovery in the zebrafish. Nat. Rev. Drug Discov. 2005, 4, 35–44. [Google Scholar] [CrossRef] [PubMed]
- Forouhar, A.; Hove, J.; Calvert, C.; Flores, J.; Jadvar, H.; Gharib, M. Electrocardiographic characterization of embryonic zebrafish. In Proceedings of the 26th Annual International Conference of the IEEE Engineering in Medicine and Biology Society (IEMBS’04), San Francisco, CA, USA, 1–5 September 2004; pp. 3615–3617. [Google Scholar]
- Milan, D.J.; MacRae, C.A. Animal models for arrhythmias. Cardiovasc. Res. 2005, 67, 426–437. [Google Scholar] [CrossRef] [PubMed]
- Milan, D.J.; Jones, I.L.; Ellinor, P.T.; MacRae, C.A. In vivo recording of adult zebrafish electrocardiogram and assessment of drug-induced QT prolongation. Am. J. Physiol.-Heart Circ. Physiol. 2006, 291, H269–H273. [Google Scholar] [CrossRef] [PubMed]
- Tsai, C.-T.; Wu, C.-K.; Chiang, F.-T.; Tseng, C.-D.; Lee, J.-K.; Yu, C.-C.; Wang, Y.-C.; Lai, L.-P.; Lin, J.L.; Hwang, J.-J. In-vitro recording of adult zebrafish heart electrocardiogram—A platform for pharmacological testing. Clin. Chim. Acta 2011, 412, 1963–1967. [Google Scholar] [CrossRef] [PubMed]
- Cao, H.; Yu, F.; Zhao, Y.; Zhang, X.; Tai, J.; Lee, J.; Darehzereshki, A.; Bersohn, M.; Lien, C.L.; Chi, N.C.; et al. Wearable multi-channel microelectrode membranes for elucidating electrophysiological phenotypes of injured myocardium. Integr. Biol. 2014, 6, 789–795. [Google Scholar] [CrossRef] [PubMed]
- Zhang, X.; Beebe, T.; Jen, N.; Lee, C.-A.; Tai, Y.; Hsiai, T.K. Flexible and waterproof micro-sensors to uncover zebrafish circadian rhythms: The next generation of cardiac monitoring for drug screening. Biosens. Bioelectron. 2015, 71, 150–157. [Google Scholar] [CrossRef] [PubMed]
- Sherpa, A.S.; Schossow, D.; Lenning, M.; Marsh, P.; Garzon, N.; Hofsteen, P.; Yang, J.; Xu, X.; Van Nguyen, T.; Nhu, C.; et al. Novel Apparatus for Simultaneous Monitoring of Electrocardiogram in Awake Zebrafish. Presented at the IEEE Sensors, Glasgow, UK, 29 October–1 November 2017. [Google Scholar]
- Gruber, S.; Schossow, D.; Lin, C.-Y.; Ho, C.H.; Jeong, C.; Lau, T.L.; Yang, J.; Xu, X.; Cao, H. Wireless Power Transfer for ECG Monitoring in Freely-Swimming Zebrafish. Presented at the IEEE Sensors, Glasgow, Scotland, 29 October–1 November 2017. [Google Scholar]
- Zhao, Y.; Cao, H.; Beebe, T.; Zhang, H.; Zhang, X.; Chang, H.; Scremin, O.; Lien, C.-L.; Tai, Y.-C.; Hsiai, T.K. Dry-contact microelectrode membranes for wireless detection of electrical phenotypes in neonatal mouse hearts. Biomed. Microdevices 2015, 17, 40. [Google Scholar] [CrossRef] [PubMed]
- Native Instruments. LabVIEW for ECG Signal Processing. Available online: http://www.ni.com/tutorial/6349/en/ (accessed on 10 August 2017).
- Lin, C.-H. Frequency-domain features for ECG beat discrimination using grey relational analysis-based classifier. Comput. Math. Appl. 2008, 55, 680–690. [Google Scholar] [CrossRef]
- Umer, M.; Bhatti, B.A.; Tariq, M.H.; Zia-Ul-Hassan, M.; Khan, M.Y.; Zaidi, T. Electrocardiogram Feature Extraction and Pattern Recognition Using a Novel Windowing Algorithm. Adv. Biosci. Biotechnol. 2014, 5, 886–894. [Google Scholar] [CrossRef]
- Malmivuo, J.; Plonsey, R. Bioelectromagnetism—Principles and Applications of Bioelectric and Biomagnetic Fields; Oxford University Press: Oxford, NY, USA, 1995. [Google Scholar]
- The University of The Toledo Medical Center. Basic Cardiac Rhythms—Identification and Response. Available online: https://uthealth.utoledo.edu/depts/nursing/pdfs/Basic%20EKG%20Refresher.pdf (acessed on 26 December 2017).
- Deo, R.C. Machine learning in medicine. Circulation 2015, 132, 1920–1930. [Google Scholar] [CrossRef] [PubMed]
- Géron, A. Hands-On Machine Learning with Scikit-Learn and Tensorflow: Concepts, Tools, and Techniques to Build Intelligent Systems, 1st ed.; Reilly Media: Sebastopol, CA, USA, 2017. [Google Scholar]
- Jun, T.J.; Park, H.J.; Minh, N.H.; Kim, D.; Kim, Y.H. Premature Ventricular Contraction Beat Detection with Deep Neural Networks. In Proceedings of the 15th IEEE International Conference on Machine Learning and Applications (ICMLA), Anaheim, CA, USA, 18–20 December 2016; pp. 859–864. [Google Scholar]
- Vijayarani, S. An Efficient Clustering Algorithm for Predicting Diseases from Hemogram Blood Test Samples. Indian J. Sci. Technol. 2015, 8. [Google Scholar] [CrossRef]
- Pandey, P.; Pandey, A.K.; Jaiswal, K.L. Classification Model for the Heart Disease Diagnosis. Glob. J. Med. Res. 2014, 14, 8–14. [Google Scholar]
- Abdul Nazeer, K.A.; Sebastian, M.P. Improving the Accuracy and Efficiency of the k-means Clustering Algorithm. In Proceedings of the World Congress on Engineering, London, UK, 1–3 July 2009; Volume 1. [Google Scholar]
- Szegedy, C.; Vanhoucke, V.; Ioffe, S.; Shlens, J.; Wojna, Z. Rethinking the Inception Architecture for Computer Vision. arXiv, 2015; arXiv:1512.00567. [Google Scholar]
- Yosinski, J.; Clune, J.; Bengio, Y.; Lipson, H. How transferable are features in deep neural networks? Adv. Neural Inf. Process. Syst. Montr. Can. 2014, 27, 3320–3328. [Google Scholar]
- Badshah, A.M.; Ahmad, J.; Rahim, N.; Baik, S.W. Speech Emotion Recognition from Spectrograms with Deep Convolutional Neural Network. In Proceedings of the International Conference on Platform Technology and Service (PlatCon), Busan, Korea, 13–15 Feburary 2017; pp. 1–5. [Google Scholar]
- Chollet, F. Keras, 2.0 ed. GitHub. 2015. Available online: https://github.com/fchollet/keras (acessed on 26 December 2017).
- Abadi, M.; Agarwal, A.; Barham, P.; Brevdo, E.; Chen, Z.; Citro, C.; Corrado, G.S.; Davis, A.; Dean, J.; Devin, M.; et al. Tensorflow: Large-scale machine learning on heterogeneous distributed systems. arXiv, 2016; arXiv:1603.04467. [Google Scholar]
- Sokolova, M.; Lapalme, G. A systematic analysis of performance measures for classification tasks. Inf. Process. Manag. 2009, 45, 427–437. [Google Scholar] [CrossRef]
- Schossow, D.; Ritchie, P.; Cao, H.; Chiao, J.-C.; Yang, J.; Xu, X. A novel design to power the micro-ECG sensor implanted in adult zebrafish. In Proceedings of the 2017 IEEE International Symposium on Antennas and Propagation & USNC/URSI National Radio Science Meeting, San Diego, CA, USA, 9–14 July 2017; pp. 1681–1682. [Google Scholar]
- Rendon-Morales, E.; Prance, R.; Prance, H.; Aviles-Espinosa, R. Non-invasive electrocardiogram detection of in vivo zebrafish embryos using electric potential sensors. Appl. Phys. Lett. 2015, 107, 193701. [Google Scholar] [CrossRef]


| R-R Interval Number | Anomaly/Anomalies |
|---|---|
| 1–2 | Bradycardia |
| 3–41 | Bradycardia, Arrhythmia |
| Abnormality | Precision | Recall | F1 | |||
|---|---|---|---|---|---|---|
| K-Means | CNN | K-Means | CNN | K-Means | CNN | |
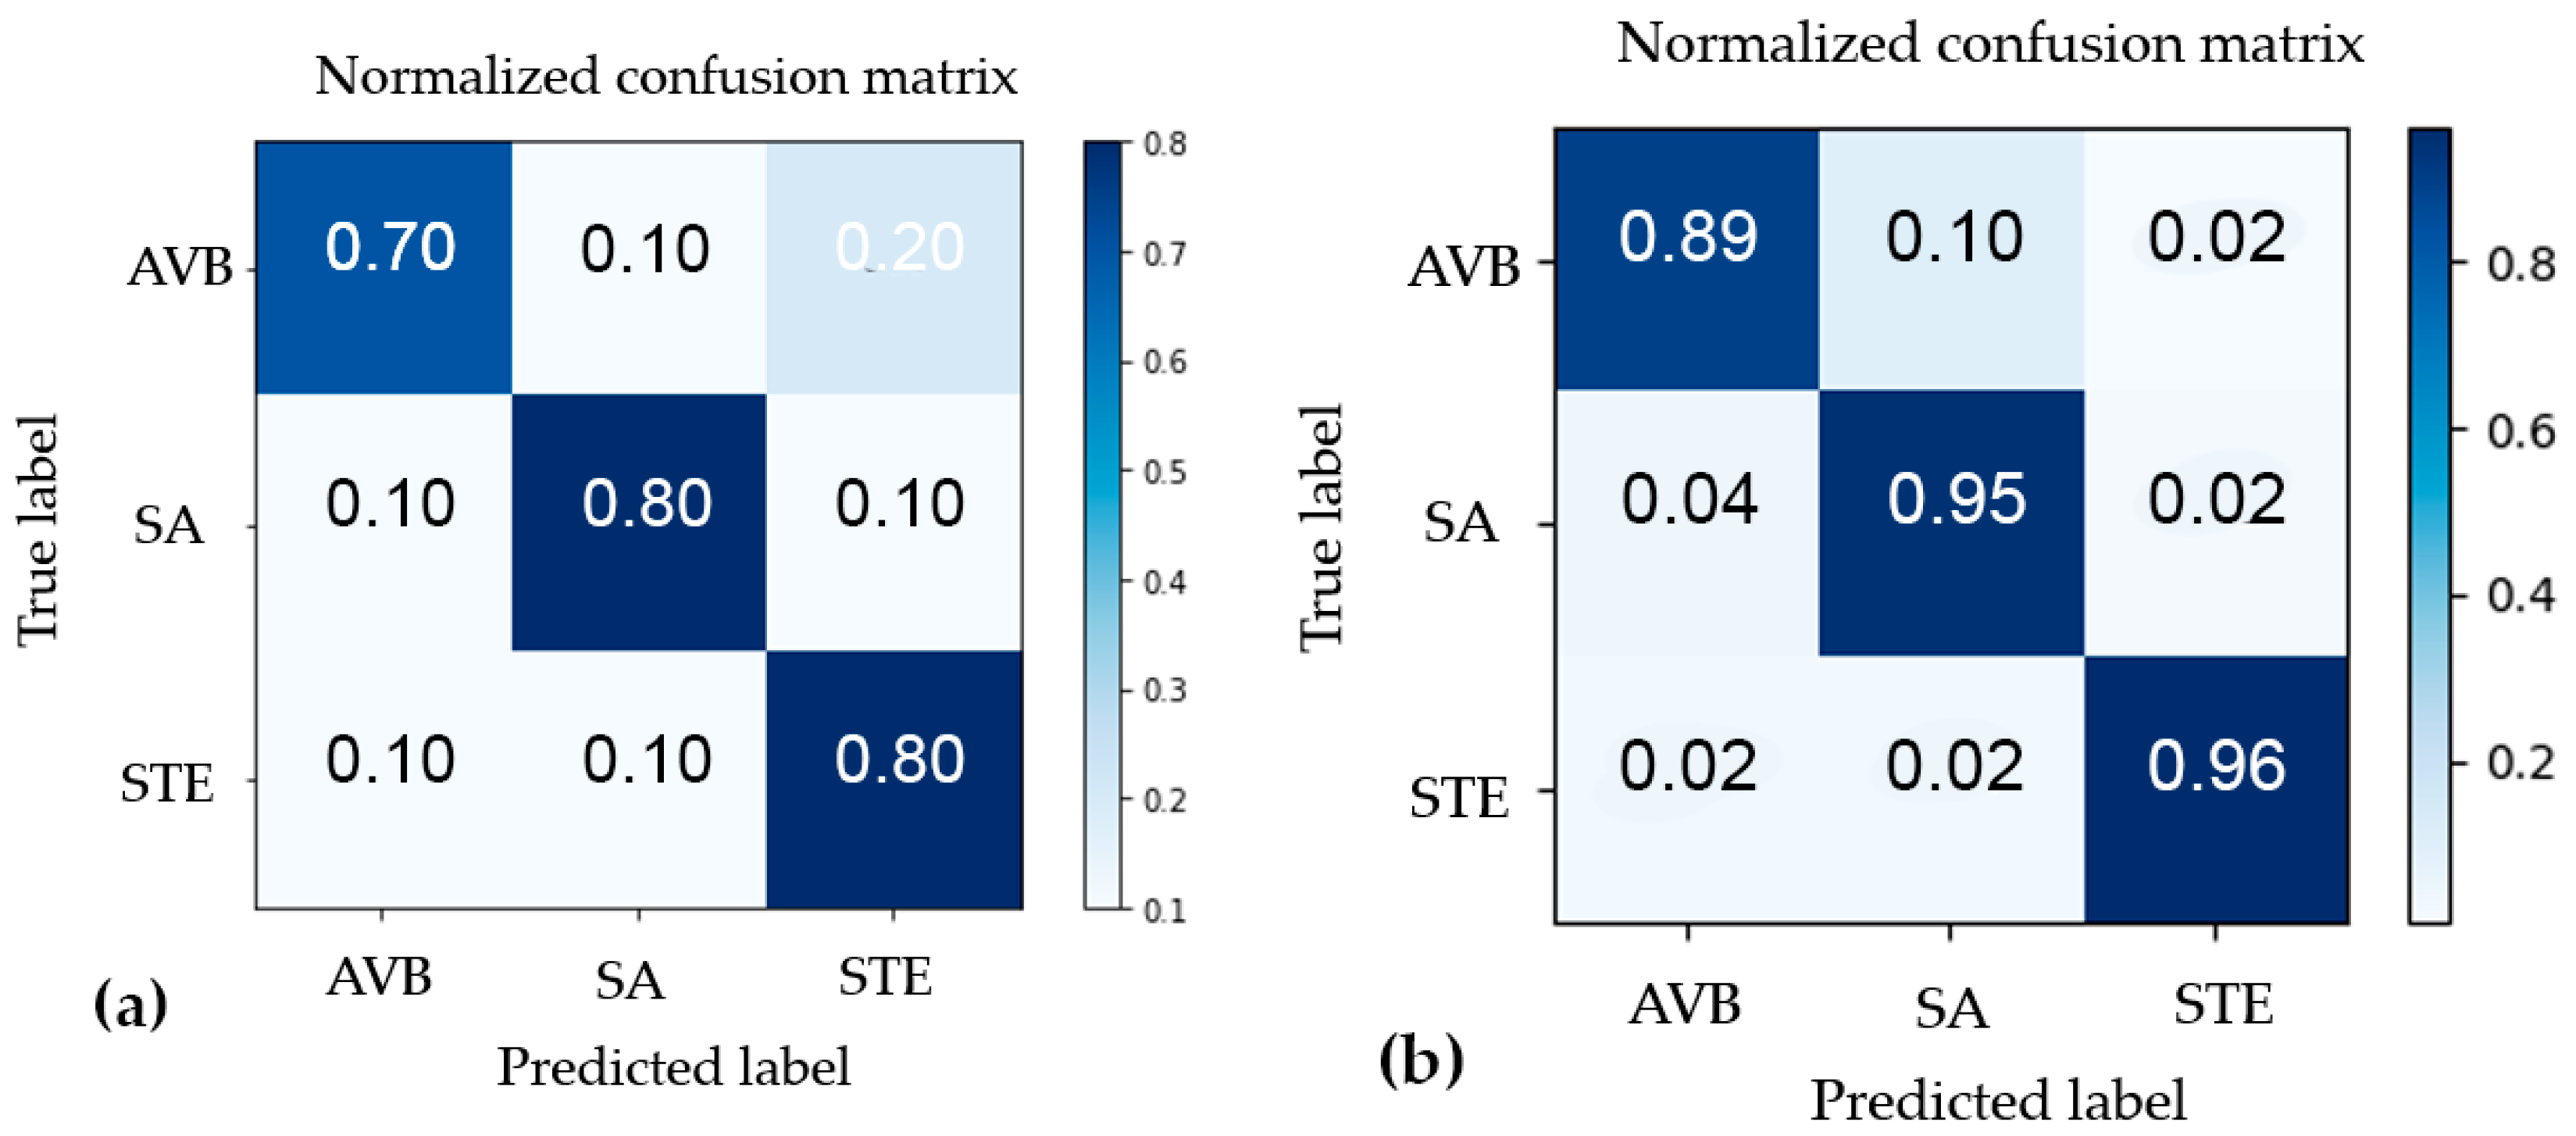
| AV Block | 0.78 | 0.95 | 0.70 | 0.89 | 0.74 | 0.92 |
| ST Elevation | 0.8 | 0.98 | 0.80 | 0.96 | 0.80 | 0.97 |
| SA | 0.73 | 0.86 | 0.80 | 0.95 | 0.76 | 0.90 |
| Average | 0.77 | 0.94 | 0.77 | 0.93 | 0.77 | 0.93 |
© 2017 by the authors. Licensee MDPI, Basel, Switzerland. This article is an open access article distributed under the terms and conditions of the Creative Commons Attribution (CC BY) license (http://creativecommons.org/licenses/by/4.0/).
Share and Cite
Lenning, M.; Fortunato, J.; Le, T.; Clark, I.; Sherpa, A.; Yi, S.; Hofsteen, P.; Thamilarasu, G.; Yang, J.; Xu, X.; et al. Real-Time Monitoring and Analysis of Zebrafish Electrocardiogram with Anomaly Detection. Sensors 2018, 18, 61. https://doi.org/10.3390/s18010061
Lenning M, Fortunato J, Le T, Clark I, Sherpa A, Yi S, Hofsteen P, Thamilarasu G, Yang J, Xu X, et al. Real-Time Monitoring and Analysis of Zebrafish Electrocardiogram with Anomaly Detection. Sensors. 2018; 18(1):61. https://doi.org/10.3390/s18010061
Chicago/Turabian StyleLenning, Michael, Joseph Fortunato, Tai Le, Isaac Clark, Ang Sherpa, Soyeon Yi, Peter Hofsteen, Geethapriya Thamilarasu, Jingchun Yang, Xiaolei Xu, and et al. 2018. "Real-Time Monitoring and Analysis of Zebrafish Electrocardiogram with Anomaly Detection" Sensors 18, no. 1: 61. https://doi.org/10.3390/s18010061