A Gas Sensor Based on a Single SnO Micro-Disk


Department of Physical-Chemistry, São Paulo State University, Araraquara, SP 14800-900, Brazil
*
Author to whom correspondence should be addressed.
Sensors 2018, 18(10), 3229; https://doi.org/10.3390/s18103229
Submission received: 17 August 2018
/
Revised: 7 September 2018
/
Accepted: 14 September 2018
/
Published: 25 September 2018
(This article belongs to the Special Issue Advanced Nanomaterials based Gas Sensors)
Abstract
:In this study, individual nanofabricated SnO micro-disks, previously shown to exhibit exceptional sensitivity to NOx, are investigated to further our understanding of gas sensing mechanisms. The SnO disks presenting different areas and thickness were isolated and electrically connected to metallic electrodes aided by a Dual Beam Microscope (SEM/FIB). While single micro-disk devices were found to exhibit short response and recovery times and low power consumption, large interconnected arrays of micro-disks exhibit much higher sensitivity and selectivity. The source of these differences is discussed based on the gas/solid interaction and transport mechanisms, which showed that thickness plays a major role during the gas sensing of single-devices. The calculated Debye length of the SnO disk in presence of NO2 is reported for the first time.

1. Introduction
Large-scale combustion of fossil fuels, while well known to contribute to global warming and air pollution, is likely to continue for many decades to satisfy the continued growth in worldwide demands for electrical power, heating and cooling, and high energy density fuels for vehicles. The key byproducts of fossil fuel combustion include gases such as CO and hydrocarbons due to incomplete combustion, NO2 that arises from the reaction of atmospheric N2 and O2 gases at the high temperatures and pressures experienced under combustion, as well as CO2 and water vapor. Lean burn vehicles, while more efficient in the consumption of fuel, nevertheless emit much larger quantities of NO2 and carbon soot [1]. Considerable progress has been made over the past decades in minimizing such emissions by the introduction of various emission sensors (e.g., zirconia-based electrochemical oxygen sensors) [2,3], catalysts (e.g., three-way catalysts) [4] and traps (e.g., lean NOx traps) [5]. Recent reports have emphasized the continued challenges associated with the cost-effective detection and minimization of NOx emissions from diesel engines [6].
Semiconducting metal oxide (SMO) nanowire-based structures are some of the most studied chemoresistive devices, in which gases adsorbed/chemisorbed on the surface of such materials modulate their conductivity. In terms of SMOs applied for chemoresistive devices, by far the greatest attention has been focused on tin dioxide (SnO2), given its robust character and proven sensitivity to many types of gases [7,8]. Recently, other stoichiometries in the Sn-O system have been identified as having exceptional sensor characteristics, including the Sn3O4 [9,10,11] and SnO [12] systems. In particular, it was demonstrated that a device composed of numerous SnO micro-disks exhibits “Giant Chemo-Resistive” response to NO2, as well as high selectivity against other gases [12]. Under exposure to 100 ppm of NO2, the SnO micro-disks exhibited a 1000-fold increase in resistance, remarkably high for a material without surface functionalization.
Chemoresistive devices composed of a single SnO2 [13,14], ZnO [15] or other 1D structures [16] have received a great deal of recent attention given their miniaturization possibilities, leading to low power consumption. Such devices are considerably more difficult to fabricate than nanowires carpet ones, but they have the advantage of providing simpler interpretation, given well defined current pathways and surface geometries [17].
Lupan et al. [18] reported the dual beam use to produce single-ZnO devices containing nanowires of different diameters, and a sensor signal of 0.020 (equivalent to 1.018 considering Rair/Rgas) was obtained when a nanowire with diameter equals to 100 nm was exposed to 10 ppm of H2 and simultaneously stimulated by UV-light. Paulowicz et al. [19] showed a dependence between the sensor signal and the morphology for ZnO structures, i.e., the number and geometry of the grain boundaries play a main role in the detection of toxic and explosive gases. Regarding single-SnO2 devices, Kuang et al. [20] reported a sensor signal of 32 for 85% of relative humidity in dry air, and Hernandez-Ramirez et al. [21] used a FIB to fabricate a sensor based on SnO2 nanowire with less than 40 nm, reporting sensor signals of 24% (corresponding to 1.24) and 13% (alike 1.13) for 1 ppm of NO2 and 100 ppm of CO, respectively. Lastly, Tonezzer et al. [22] showed a sensor signal around 10 to 500 ppm of NO2 when dealing with a single-SnO2 nanowire with 78 nm of diameter.
Moreover, some researchers have emphasized the use of low power devices based on individual nanowire as gas sensors. Hernandez-Ramirez et al. [23] reported the potential use of SnO2 nanowire as a CO sensor at 60 °C using 17 mW to reach this temperature in a micro-heater. Prades et al. [24] showed a sensor signal of 22% (equivalent to 1.22) when a single-SnO2 was exposed to 0.5 ppm de NO2 at about 250 °C reached spending less than 27 µW, in which they called ultralow power consumption gas sensor. Finally, Prades at al. [25] also reported a sensor signal of 1.6 to 5 ppm of NO2 and 1.15 to 100 ppm of CO when individual SnO2 nanowires worked consuming about 2 mW.
Here we report on the further development of NOx sensors based on the novel use of SnO micro-disks. The main goals of this work were to fabricate sensor devices based on individual SnO micro-disks as the active element and to test their response as gas sensors. By eliminating the potential barriers present at the contacts between the multiple SnO micro-disks we could more directly investigate the intrinsic response of the disks. Moreover, given the small dimensions of the individual disks, the single-element sensors offer a unique potential for the development of low power consumption devices.
2. Materials and Methods
The SnO disks were obtained by application of the carbothermal reduction method using SnO2 powder (Sigma-Aldrich, São Paulo, Brazil, 99.9% purity) mixed with carbon black (Union Carbide, São Paulo, Brazil, >99% purity). The procedure involved preparing a 1 g mixture of SnO2:C in the molar ratio of 1.5:1 that was inserted in a tube furnace maintained at 1135 °C for 75 min under a constant flux of nitrogen (150 cm3 min−1). Following synthesis, material retrieved from the alumina tube walls was found to contain both SnO disk-like and nanobelt structures that were subsequently separated by sedimentation. Further details were reported previously [12].
Figure 1 shows the general procedure followed to obtain single-element sensor devices, whose nanofabrication was performed inside a dual beam microscope (model Helios NanoLab 600i, FEI, Eindhoven, The Netherlands). First, a suspension containing SnO disks was prepared in isopropyl alcohol, dispersed in an ultrasonic bath, and one drop was deposited onto Si/SiO2 substrates with interdigitated platinum electrodes (IDE). Then, an isolated SnO disk was identified and connected to the platinum contacts using chemical vapor deposition methods. Finally, the unused Pt electrode fingers of the interdigitated array were electrically isolated from the device using the focused ion beam (black crosses in Figure 1a).
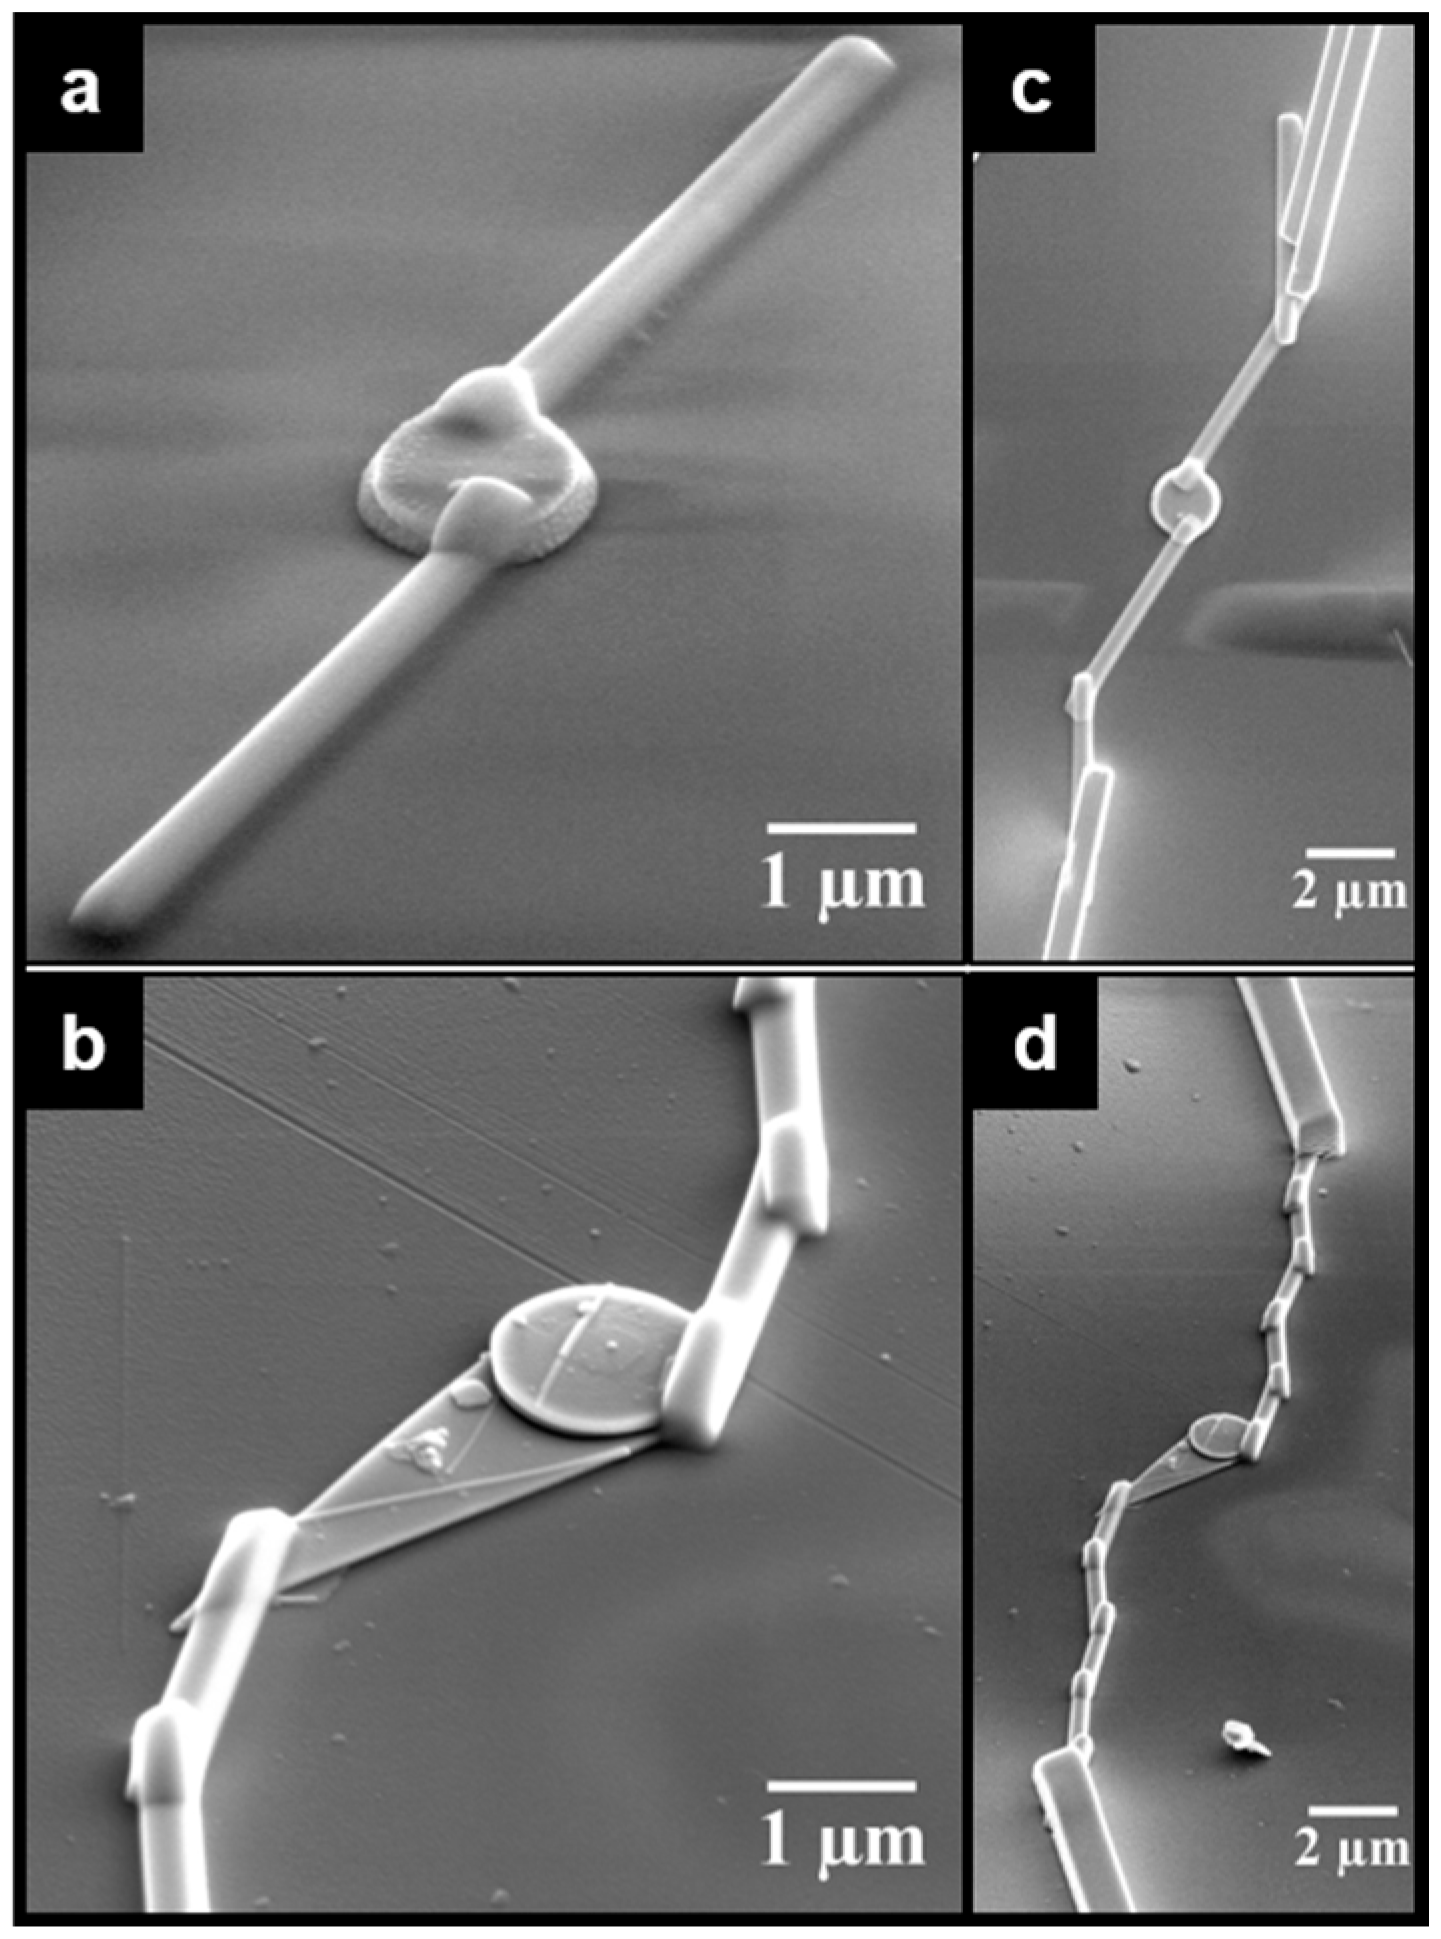
The contacts between the micro-disk and the interdigitated electrodes were prepared with aid of the gas injection system (GIS), by first depositing Pt electrodes at the disk edge by electron beam induced deposition (10 µm long and cross section of 0.25 µm2 Pt-EBID, leading to a contact with 800 Ω), and then connecting the disk to the interdigitated fingers using ion beam induced deposition (80 µm long and a cross-section of 1 µm2 Pt-IBID, resulting in a contact with somewhat lower resistance [740 Ω]). Two micro-disk devices were prepared, distinguished by their areas: a smaller area disk designated as Device 1 and a larger area disk designated as Device 2, with areas of 1.8 µm2 and 2.5 µm2, respectively. Finally, the interdigitated fingers contacted by the SEM/FIB Pt-contacts were milled as close as possible to the contacted region (Figure 1b), in order to introduce the minimum electrode interference in sensor response. Details of the SnO micro-disks together with their Pt-EBID and Pt-IBID contacts are shown below.
Gas sensing measurements were carried out by monitoring changes in resistance using a stabilized voltage source (Keithley 6487, Cleveland, OH, USA) applying 0.5 V during cyclic pulse exposures to different concentrations of NO2 and CO (20 to 100 ppm) diluted in dry air (baseline gas). Each pulse of analyte gas lasted 10 min followed by 30 min of recovery time, maintaining a constant flux of 100 cm3 min−1. The measurements were performed at 100 and 200 °C using an external heating chamber with an internal volume of 100 cm3. The gas sensor response was evaluated by considering the ratio (RNO2/Rbaseline) for the oxidizing gas and the ratio (Rbaseline/RCO) for the reducing gas.
For the small area device, the gas sensor measurements were performed in both oxidizing (NO2) and reducing (CO) atmospheres at 100 °C, while for the large area device, gas sensor measurements were carried out for oxidizing gas at 100 and 200 °C, maintaining the same time intervals and flow.
3. Results
Figure 2 presents the XRD of the obtained SnO micro-disks after synthesis and sedimentation process. One can see that the experimental data was indexed using the romarchite phase of the SnO (Space group P4/nmm, litharge-type tetragonal structure, similar to α-PbO), the metallic tin (Sn0), and the cassiterite phase of the SnO2 (rutile-type tetragonal structure). The predominance of the SnO phase and its high crystallinity matches with the HRTEM and SAED pattern (not shown here), and both Sn0 and SnO2 phases are related to the well-known disproportionation reaction that SnO undergoes especially in high temperatures and low oxygen pressures, as in inert atmosphere synthesis [26,27].
Thus, considering that a SnO micro-disk was carefully selected inside the Dual Beam microscope, and disk-shaped structures only present the SnO phase [12], one should bear in mind that the reduced Sn2+ termination will be the one interacting with the analysis gases.
Figure 3 shows details of the Pt-EBID and Pt-IBID steps taken to contact the selected SnO micro-disks to the IDEs. Figure 3a,b show high magnification images of the small and large area disks following Pt-EBID, respectively. After contacting the disks by Pt-EBID, they were connected to the platinum IDE using Pt-IBID, as observed in Figure 3c,d. It is possible to observe a clear difference in size of the chosen disks and their different morphologies; the smaller disk (Device 1) presents the most common morphological characteristic of the disks, and the larger area disk (Device 2) exhibiting an extra flat and thinner triangular region, which is related to the growth process of disks.
Results presented in Figure 4 for Device 1 clearly reflect n-type semiconductor response, in which the material resistance increases when exposed to the oxidizing gas and the opposite behavior occurs when exposed to the reducing gas, in agreement with previously observed responses obtained with multi-disks SnO sensor [12]. Results also showed that sensor response of the disk increases with increasing NO2 concentration, but remains nearly insensitive to variations in CO concentration, as shown in Figure 4 and Figure 5. While single-SnO micro-disk device has lower sensitivity upon exposure to CO at 100 degrees, they work in a more reversible manner based on faster response and quicker baseline recovery.
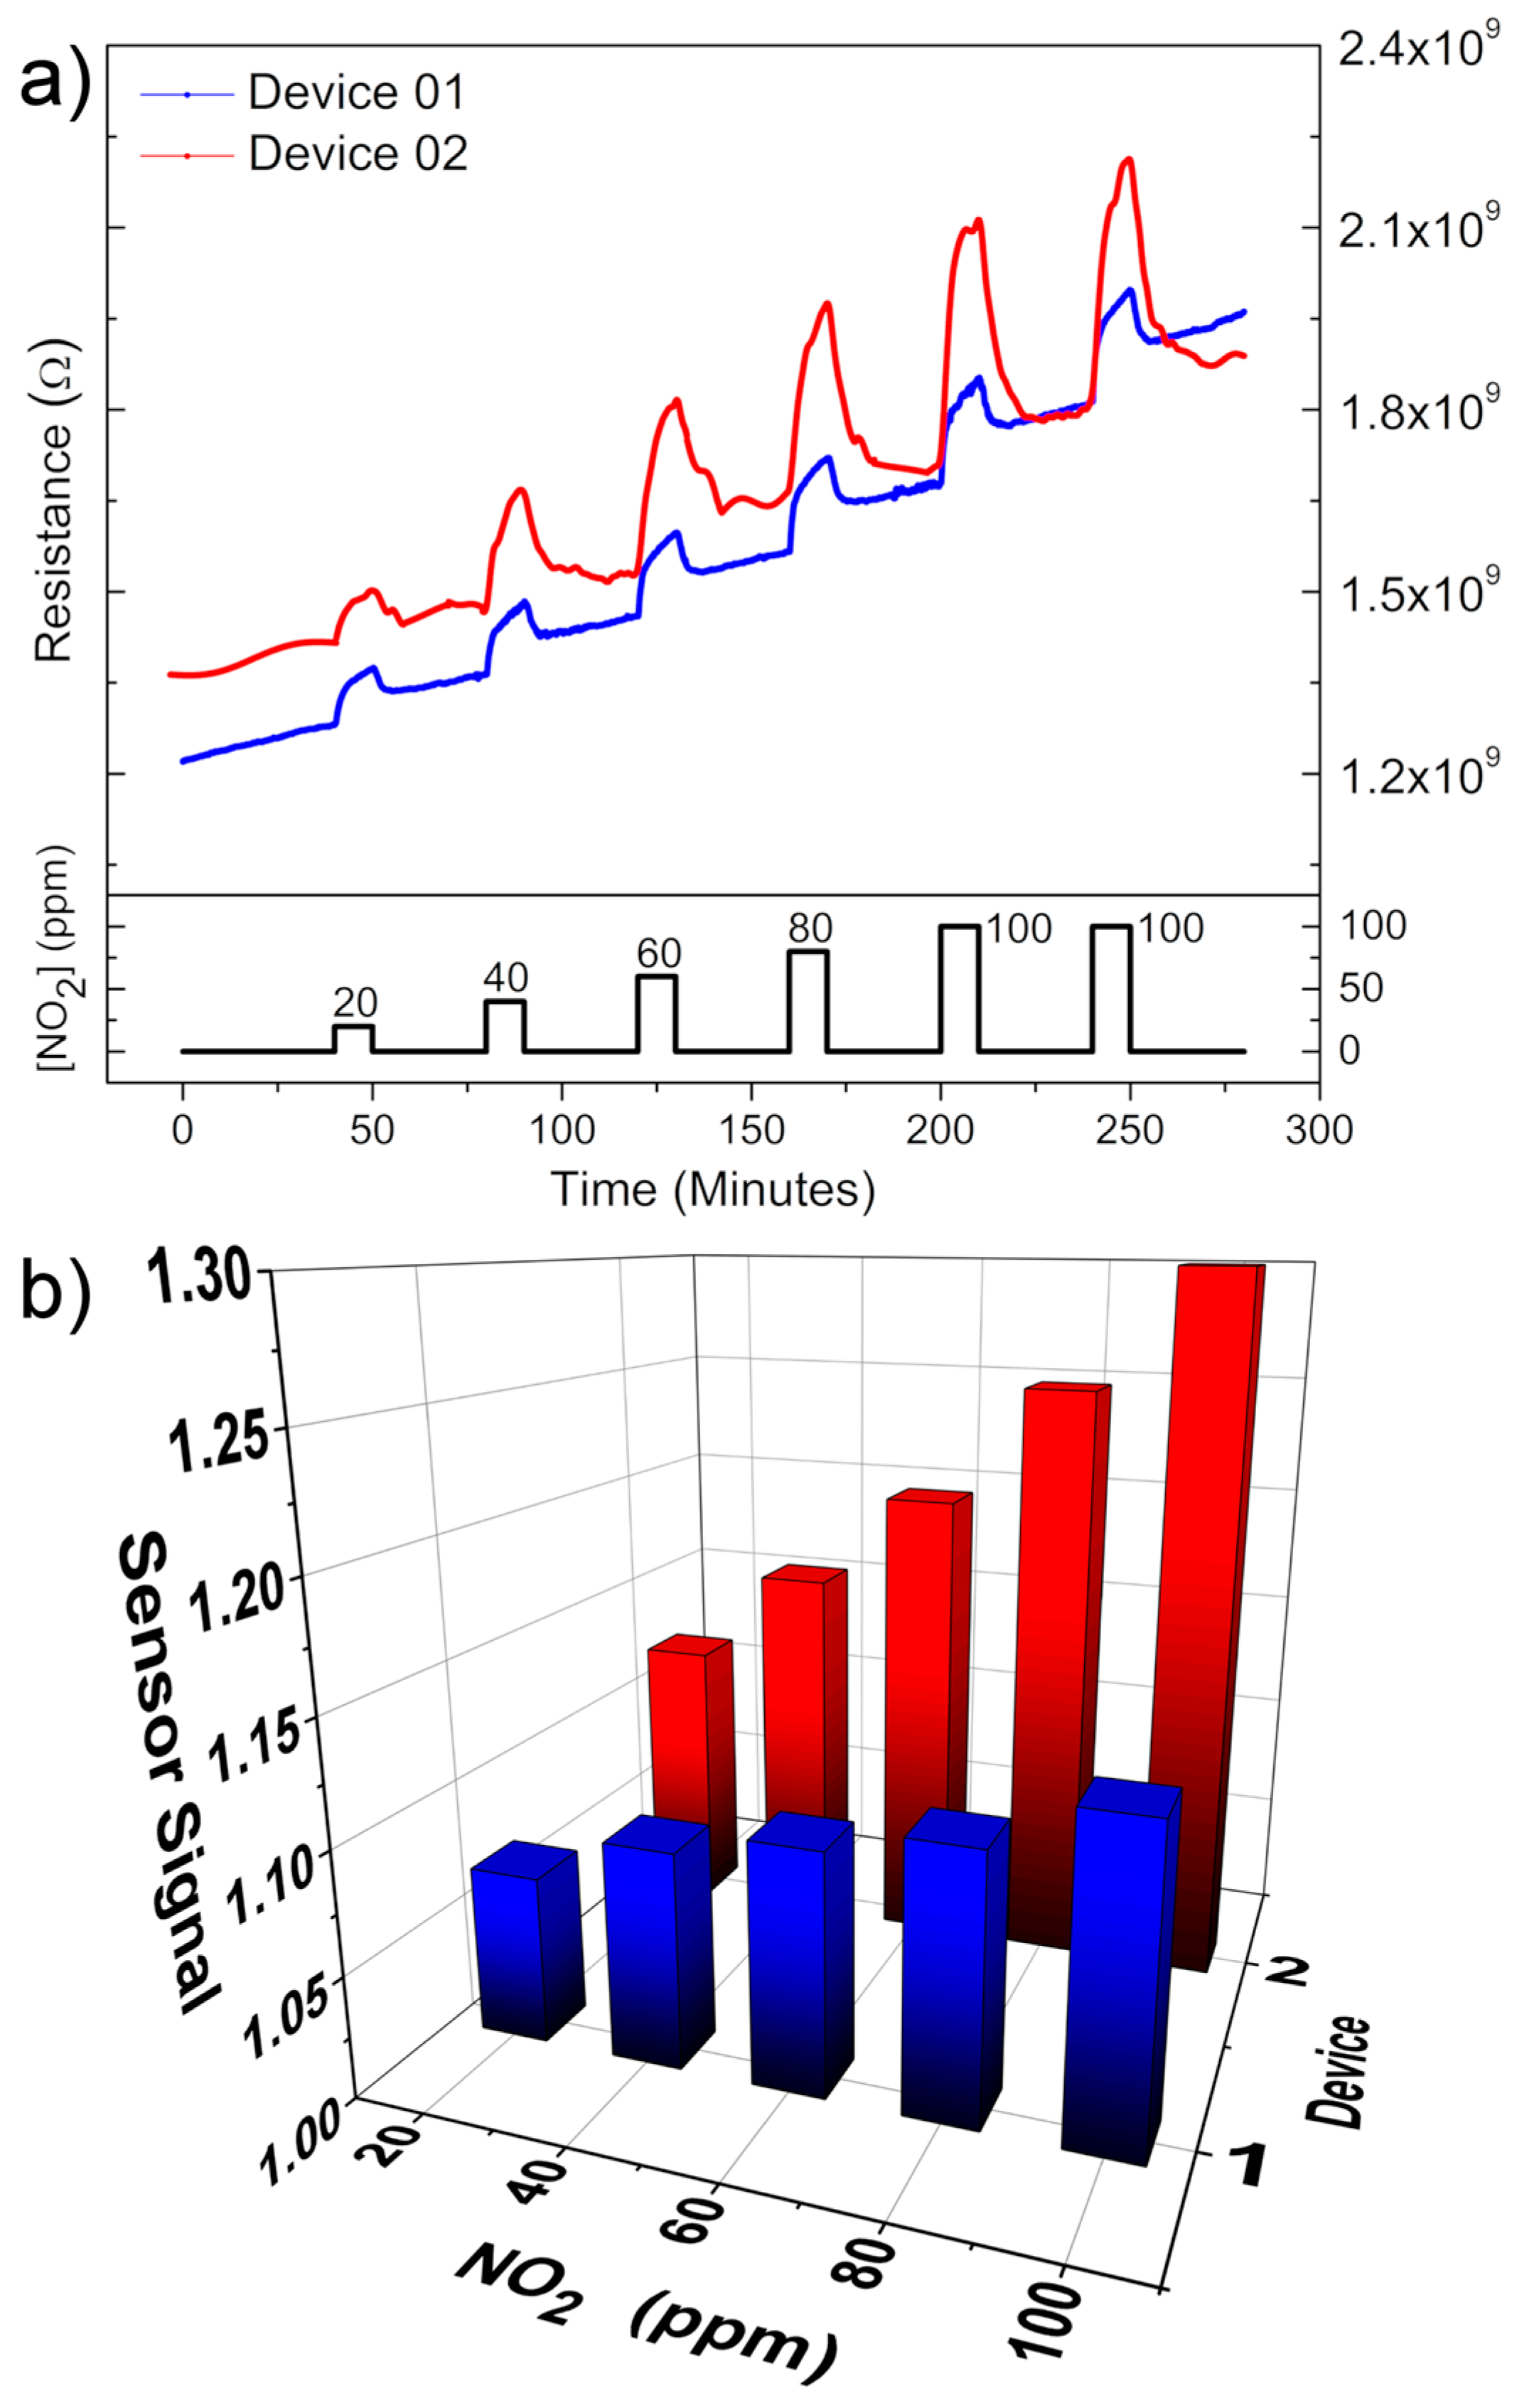
Figure 6 shows the gas sensor response for device 1 (blue curve) and device 2 (red curve) taken at 100 °C for periodic pulses of NO2. Although baseline resistance is not constant for the devices, one can observe an increasing sensor response with increasing NO2 concentration in both cases (Figure 6a), with the greater sensor response associated, at first, with the larger exposed area device, as observed in Figure 6a,b.
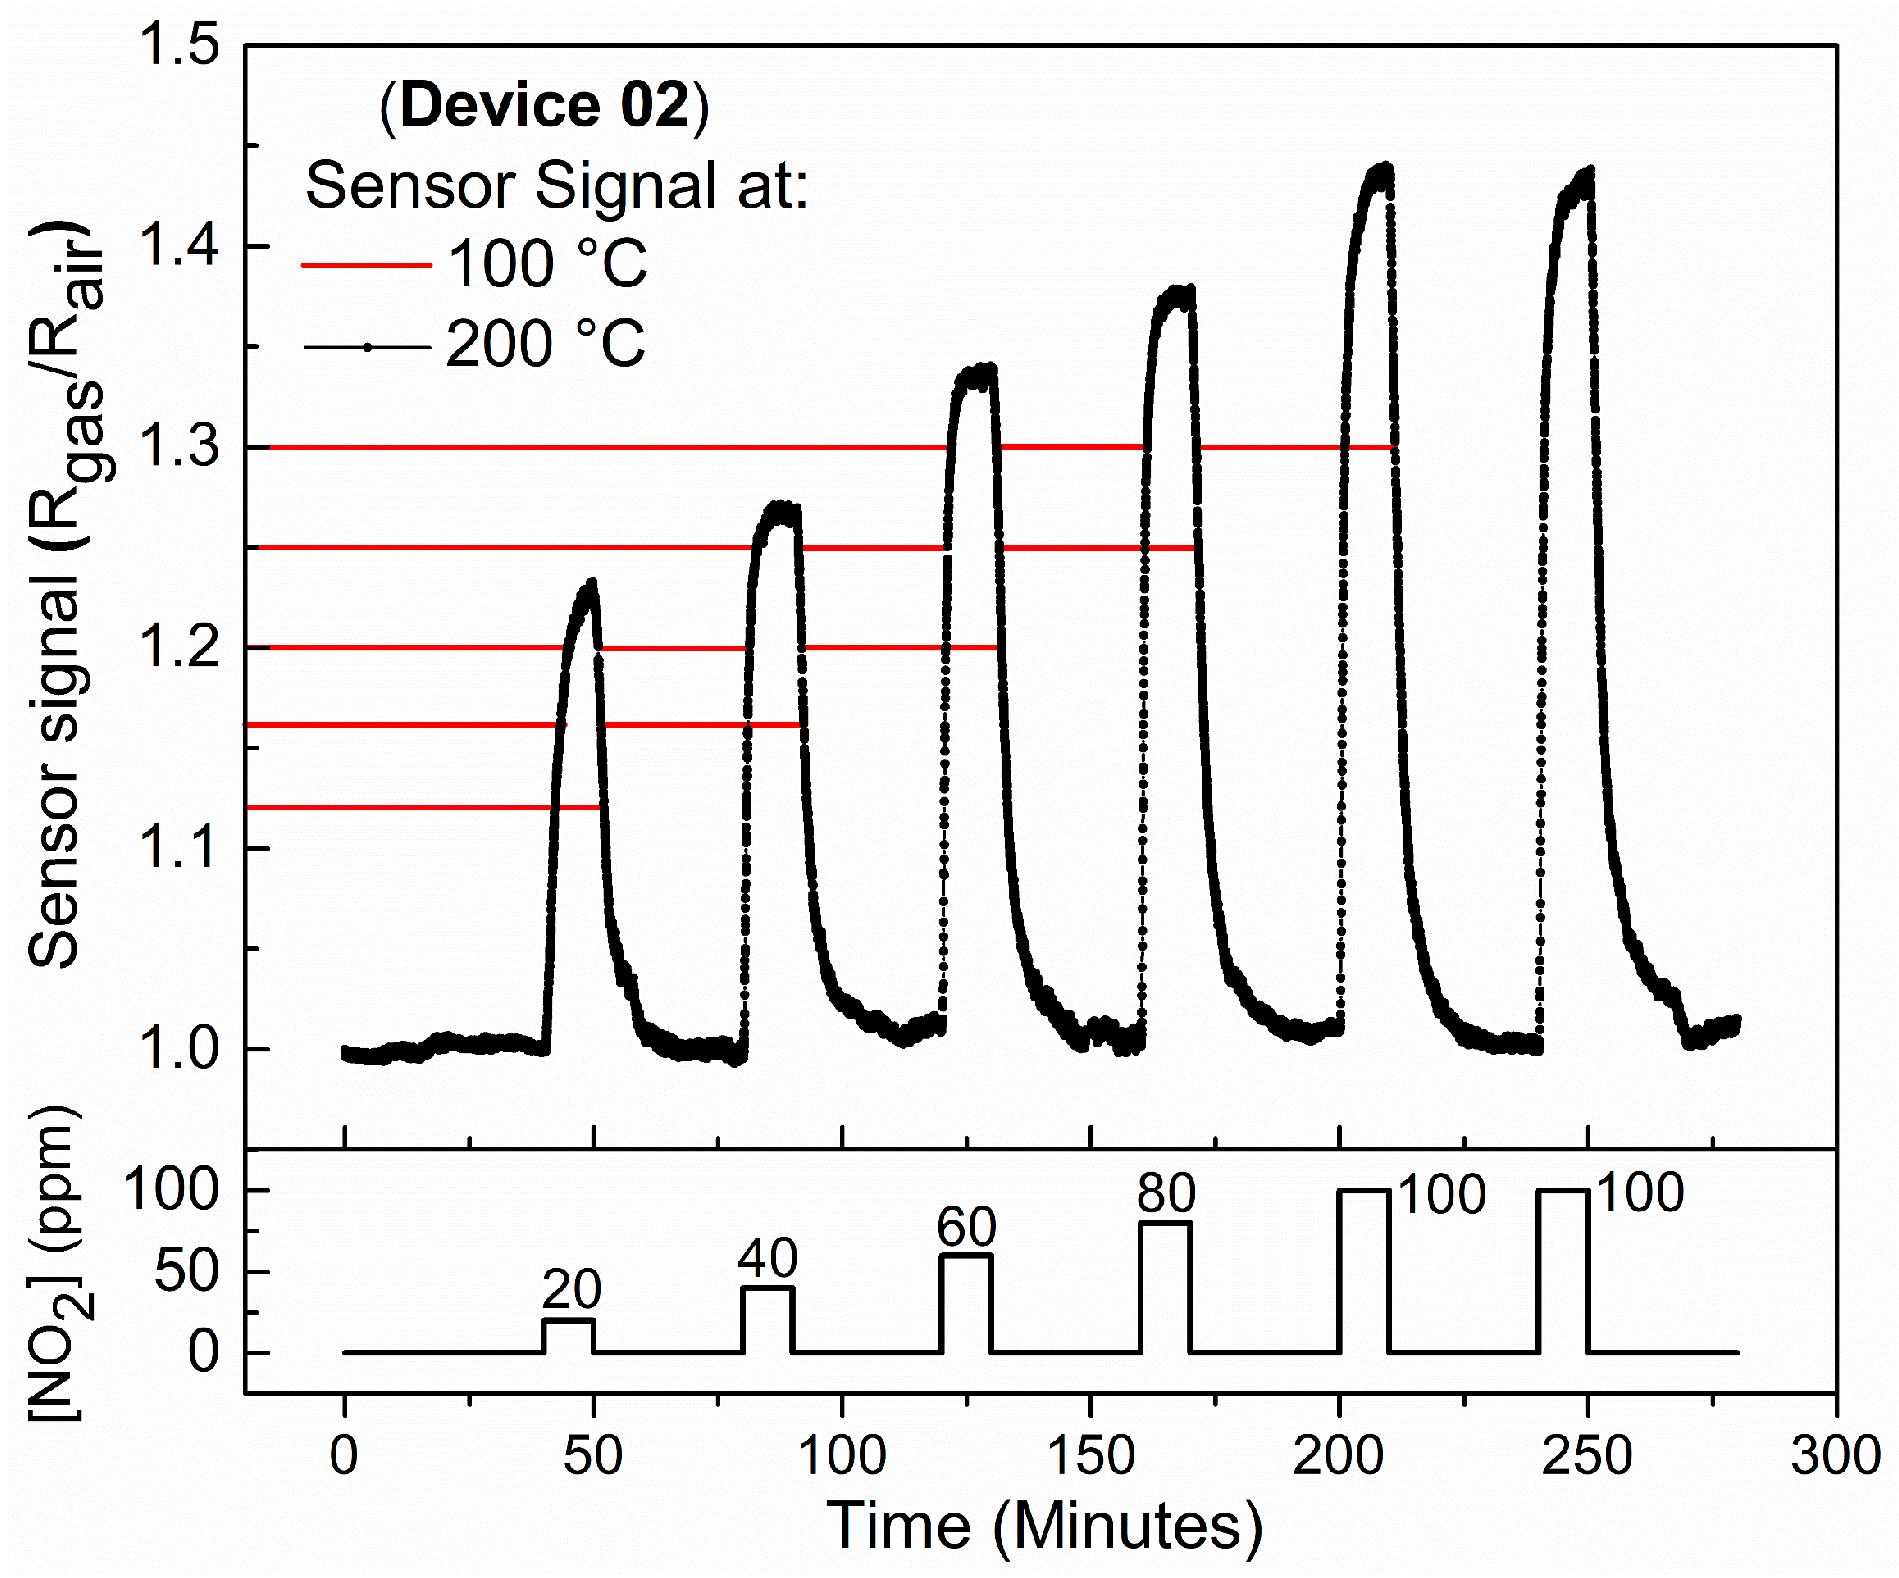
Figure 7 shows the gas sensor response of Device 2 taken at 200 °C during exposure to NO2. It is observed that at this temperature the baseline resistance remains nearly constant throughout the measurement. Moreover, Figure 7 shows that Device 2 presents higher sensor response when exposed to NO2 at 200 °C, which is the same temperature that SnO micro-disks carpet devices exhibited the best sensor response [12].
Hence, considering the 0.5 V used to carry on the measurements, and in view of the devices resistance, a power of about 150 pW were dissipated by devices 1 and 2 at 100 °C, and 950 nW was dissipated by Device 2 at 200 °C, when they were exposed to NO2. Thus, one can assume that the power lost will be mainly from the heat source, but still should remain only a few dozens of µW due to the small dimension of the structures. Better yet, can be even less power consuming if integrated into hot bodies usually associated with NO2 generation.
4. Discussion
4.1. Temporal Differences in the Sensor Response Curves of Device 1
In order to better understand the obtained sensor response curves in Figure 4, some gas-solid reactions will be elucidated. The first step in the reaction of NO2 with SnO is the adsorption of the gas on unoccupied tin surface sites. So, charge transfer can occur via the overlap of the SnO lone pairs (generated by the interaction of the projected anti-bonding molecular orbital (Sn 5s – O 2pz)* with the Sn 5p orbital [28,29]), and the NO2 molecular orbital (empty πu orbital). After discontinuing the flow of the analyte gas (NO2), NO molecules desorb from the surface of the material leaving an adsorbed oxygen ion [30,31]. The charge transfer (CT) and desorption (DES) reactions are summarized by:
The reactions described in Equation (1) are associated with the differences in temporal response to oxidizing and reducing gases clearly observed when comparing Figure 4a,b. While the baseline resistance drifts continuously higher during the NO2 measurements (Figure 4a) it remains nearly constant for the CO measurements (Figure 4b). This behavior is also observed for other single-element sensor devices [32,33] and is related to the known sluggishness associated with the desorption of NO2 from semiconducting metal oxide surfaces [34,35], once there is a high binding energy associated with the single and double bonded Sn2+-NO2 species [36]. This can also be correlated with the difference between recovery times of Device 1 when exposed to NO2 and CO, being 3 min and 1 min, respectively.
The reversibility of the gas sensor response to CO can be understood by considering that the prevalent species during adsorption at 100 °C are O2− molecules [37,38,39]. Therefore, given a synthetic air baseline, oxygen is naturally adsorbed on the material surface and follows the sequence:
O2 (gas) → O2 (ads)
O2 (ads) + e− → O2− (ads)
Upon exposure to CO, the following reaction takes place:
2 CO (gas) + O2− (ads) → 2 CO2 (gas) + 1 e−
One can surmise that the charge transfer reactions described above occur faster than reaction (1), once there is no need for the charge carriers to cross an electric field and reach the surface of the material, i.e., only adsorbed molecules are included in the reactions. This means that the material baseline resistance is easier recovered when the device is exposed to CO pulses than to NO2 pulses. This can be associated with the response time values, being approximately 1 min for CO and 7 min for NO2.
To explain why the resistance reaches about the same value independently of CO concentration (Figure 4b), giving a rather constant sensor signal (Figure 5), it is essential to understand how single-element sensor devices work. Initially, the crystals are partially depleted due to the adsorption of oxygen species (Equations (2) and (3)), causing the resistance of the material to be an equivalent resistance of the depleted part and the bulk, in which the depleted and non-depleted ratio can be modulated by the presence of analyte gases. Thus, results indicate that only a few ppm of CO is enough to decrease the thickness of the depleted layer in a way that only the bulk resistance plays the role on the SnO micro-disk resistance, causing an almost constant sensor response to CO gas.
4.2. Comparison of the Sensor Response for Devices 1 and 2 When Exposed to NO2
We previously proposed that the lone pairs present at the (001) plane of SnO are likely the source of the strong observed sensor response to NO2. So, it is expected that having higher exposed area will lead to a better sensor response, as observed for device 2 in Figure 6, but it may not be the decisive factor for achieving the 1000-fold change in the resistance, as obtained for the same material in the carpet multi-disks configuration utilized in the previous study [12]. This suggests that the existence of back-to-back potential barriers between the disks may also be an important factor in their large response to NO2, similar to recently proposed for single-ZnO structures [19].
Still, the difference in the sensor response shown in Figure 6b (15%) is not close to the difference in the devices exposed area (28%), wherein each side of device 1 has an exposed area of about 1.8 µm2 while for device 2 the exposed areas are 2.5 µm2.
This divergence can be attributed to the sensing mechanism of individual structures, which should be understood by examining the ratio between the material thickness and the Debye length, which is directly related to the amount of exchanged charges [40]. So, even considering that the total of adsorbed analyte species is larger for Device 2 due to the greater number of free tin ions with exposed lone pairs available to overlap with the NO2 molecules, both devices are only partially depleted due to the so-called Weisz limitation where the band bending is limited to about 1 eV as a way to prevent the double-layer potential (number of charged species limited to 10−5 to 10−3 monolayers) [41,42], causing thickness to play a major role. Equation (5), proposed by Tonezzer et al. [22], shows this dependence mathematically:
where C is a constant depending on the material, R is the radius of the conduction path in the absence of the depleted zone and LD is the Debye Length.
Sensor Signal = C x [R/(R − LD)]2,
Besides showing the thickness influence on the gas sensor response, Equation (5) can be used to calculate the Debye length of the material. Thus, considering that C and LD values are the same for devices 1 and 2, and thicknesses of 215 nm and 170 nm for devices 1 and 2, respectively, a LD value of approximately 25 nm is calculated for the SnO disks in the presence of 100 ppm of NO2 diluted in dry air at 373.15 K, which is similar to values calculated using the semiconducting parameters [12], corresponding to a charge carrier concentration of about 2.8x10²¹ m−3.
These results indicate the importance of using small size materials to improve the sensor response, as done by Wang et al. [43] using the reported LD value for SnO2 nanowires carpet to affirm that the diameter/Debye length ratio has a greater influence on the sensing response than the material exposed area.
However, the area difference can be correlated to the faster response time of Device 2 (5 min) compared to 7 min for Device 1, and longer recovery time of the Device 2 [44]. The recovery times are 3 min and 9 min for devices 1 and 2, respectively. Furthermore, temperature programmed desorption analysis (TPD) showed that just small percentage of the NOx species leaves the surface of the reduced material (SnO) after 2 h [35] corroborating to the high recovery time.
4.3. Temperature Influence on the Sensor Response of Device 2 When Exposed to NO2
The stability of the baseline in Figure 6 is consistent with the fact that at 200 °C atomic O− species are dominant at material surface, and they have faster reaction kinetics than molecular O2− species [37,38,39]. Moreover, at 200 °C both response and recovery times are faster, i.e., 2 and 7 min, respectively. The role of the atomic oxygen ions can be understood based on the reactions [31]:
O2− (ads) + O2 (gas) → O2− (ads) + O− (ads)
2 O− (ads) → O2 (gas) + 2 e−
2 e− + 2 Sn3+ → 2 Sn2+
Figure 7 also presents that device sensor signal for the measurements at 200 °C is higher than the sensor response at 100 °C. We attributed this to the larger depletion layer change induced by the stronger adsorption of the reactive species at the surface of the material coupled with faster charge transfer kinetics [7,12]. Besides, first-principles density functional theory (DFT) calculations showed that adsorbed NO2 species have relatively high mobility over the Sn-O surface [36], especially at high temperatures and small area surfaces like in a single-element device, allowing two NO2 molecules to react in the material surface generating NO and NO3, in which the latter is much more effective to remove electrons from the semiconductor rather than the NO2 [36], thereby achieving overall a 1 ppm limit of detection - well below the toxic limits. Moreover, even with NO3 having a stronger bonding energy than NO2, it helps to stabilize the baseline once there is no evidence of NO3 desorbing and leaving oxygen species on the semiconductor surface.
5. Conclusions
To summarize, in this work, we have studied for the first time the sensor response of single SnO-disks to oxidizing and reducing gases. Results showed that increasing the exposed surface area to the analyte gas and decreasing the thickness of the micro-disks result in improved device response and that SnO disks exhibit a slightly stronger response to NO2 than to CO, especially at high concentrations due to fast CO saturation. Furthermore, these results point to the importance of space charge potential barriers between disks in achieving highest sensor responses and how thickness plays a major role in the sensor signal when dealing with single-element device. The single-element sensor device advantages include the opportunity for device miniaturization, lower power consumption, and low detection limit, although at the expense of reduced sensitivity compared to interconnected micro-disks found in conventionally fabricated devices.
Author Contributions
M.G.M., and M.O.O. conceived and designed the experiments; M.G.M. prepared the samples and carried out the measurements; M.O.O. did the funding acquisition and supervision; M.G.M., and M.O.O. did the data analysis and wrote the paper.
Funding
This research was funded by FAPESP [#2013/07296-2, #2015/21033-0, and #2017/26219-0] and CNPq [#447760/2014-9, #303542/2015-2, and #443138/2016-8].
Acknowledgments
LMA-IQ for providing electron microscopy facilities.
Conflicts of Interest
The authors declare no conflict of interest.
References
- Moss, R.; Sahner, K.; Fleischer, M.; Guth, U.; Barsan, N.; Weimar, U. Solid state gas sensor research in Germany–A status report. Sensors 2009, 9, 4323–4365. [Google Scholar] [CrossRef] [PubMed]
- Miura, N.; Kurosawa, H.; Hasei, M.; Lu, G.; Yamazoe, N. Stabilized zirconia-based sensor using oxide electrode for detection of NOx in high-temperature combustion-exhausts. Solid State Ion. 1996, 86–88, 1069–1073. [Google Scholar] [CrossRef]
- Zhuiykov, S.; Miura, N. Development of zirconia-based potentiometric NOx sensors for automotive and energy industries in the early 21st century: What are the prospects for sensors? Sens. Actuators B Chem. 2017, 121, 639–651. [Google Scholar] [CrossRef]
- Shelef, M.; Graham, G.W. Why rhodium in automotive three-way catalysts? Catal. Rev. 1994, 36, 433–457. [Google Scholar] [CrossRef]
- Ji, Y.; Toops, T.J.; Crocker, M. Effect of ceria on the storage and regeneration behavior of a model lean NOx trap catalyst. Catal. Lett. 2007, 119, 257–264. [Google Scholar] [CrossRef]
- Niyat, F.Y.; Sabzevar, I.; Abadi, M.H.S. The review of semiconductor gas sensor for NOx detecting. Turkish Online J. Des. Art Commun. 2016, 6, 898–937. [Google Scholar] [CrossRef]
- Batzill, M.; Diebold, U. The surface and materials science of tin oxide. Prog. Surf. Sci. 2005, 79, 47–154. [Google Scholar] [CrossRef]
- Chen, X.; Wong, C.K.Y.; Yuan, C.A.; Zhang, G. Nanowire-based gas sensors. Sens. Actuators B Chem. 2013, 177, 178–195. [Google Scholar] [CrossRef]
- Suman, P.H.; Felix, A.A.; Tuller, H.L.; Varela, J.A.; Orlandi, M.O. Comparative gas sensor response of SnO2, SnO and Sn3O4 nanobelts to NO2 and potential interferents. Sens. Actuators B Chem. 2015, 208, 122–127. [Google Scholar] [CrossRef]
- Liu, J.; Wang, C.; Yang, Q.; Gao, Y.; Zhou, X.; Liang, X.; Sun, P.; Lu, G. Hydrothermal synthesis and gas-sensing properties of flower-like Sn3O4. Sens. Actuators B Chem. 2016, 224, 128–133. [Google Scholar] [CrossRef]
- Li, X.; Wang, F.; Tu, J.; Shah, H.U.; Hu, J.; Li, Y.; Lu, Y.; Xu, M. Synthesis and ethanol sensing properties of novel hierarchical Sn3O4 nanoflowers. Nanomaterials 2015, 16. [Google Scholar] [CrossRef]
- Suman, P.H.; Felix, A.A.; Tuller, H.L.; Varela, J.A.; Orlandi, M.O. Giant chemo-resistance of SnO disk-like structures. Sens. Actuators B Chem. 2013, 186, 103–108. [Google Scholar] [CrossRef]
- Hernandez-Ramirez, F.; Prades, J.D.; Hackner, A.; Fischer, T.; Mueller, G.; Mathur, S.; Morante, J.R. Miniaturized ionization gas sensors from single metal oxide nanowires. Nanoscale 2011, 3, 630–634. [Google Scholar] [CrossRef] [PubMed]
- Kolmakov, A.; Klenov, D.O.; Lilach, Y.; Stemmer, S.; Moskovits, M. Enhanced gas sensing by individual SnO2 nanowires and nanobelts functionalized with Pd catalyst particles. Nano Lett. 2005, 5, 667–673. [Google Scholar] [CrossRef] [PubMed]
- Cardoza-Contretas, M.N.; Romo-Herrera, J.M.; Ríos, L.A.; García-Gutiérrez, R.; Zepada, T.A.; Contreras, O.E. Single ZnO nanowire-based gas sensors to detect low concentrations of hydrogen. Sensors 2015, 15, 30539–30544. [Google Scholar] [CrossRef] [PubMed]
- Hernandez-Ramirez, F.; Prades, J.D.; Jimenez-Diaz, R.; Fischer, T.; Romano-Rodriguez, A.; Mathur, S.; Morante, J.R. On the role of individual metal oxide nanowires in the scaling down of chemical sensors. Phys. Chem. Chem. Phys. 2009, 11, 7105–7110. [Google Scholar] [CrossRef] [PubMed]
- Ramgir, N.S.; Yang, Y.; Zacharias, M. Nanowire-Based Sensors. Small 2010, 6, 1705–1722. [Google Scholar] [CrossRef] [PubMed]
- Lupan, O.; Ursaki, V.V.; Chai, G.; Chow, L.; Emelchenki, G.A.; Tiginyanu, I.M.; Gruzintsev, A.N.; Redkin, A.N. Selective hydrogen gas nanosensor using individual ZnO nanowire with fast response at room temperature. Sens. Actuators B Chem. 2010, 144, 56–66. [Google Scholar] [CrossRef]
- Paulowicz, I.; Postica, V.; Lupan, O.; Wolff, N.; Shree, S.; Cojocaru, A.; Deng, M.; Mishra, Y.K.; Tiginyanu, I.; Kienle, L.; et al. Zinc oxide nanotetrapods with four different arm morphologies for versatile nanosensors. Sens. Actuators B Chem. 2018, 262, 425–435. [Google Scholar] [CrossRef]
- Kuang, Q.; Lao, C.; Wang, Z.L.; Xie, Z.; Zheng, L. High-sensitivity humidity sensor based on a single SnO2 nanowire. J. Am. Chem. Soc. 2007, 129, 6070–6071. [Google Scholar] [CrossRef] [PubMed]
- Hernandez-Ramirez, F.; Prades, J.D.; Morante, J.R. Metal oxide nanowire gas sensors. Sens. Mater. 2009, 21, 219–227. [Google Scholar]
- Tonezzer, M.; Hieu, N.V. Size-dependent response of single-nanowire gas sensors. Sens. Actuators B Chem. 2012, 163, 146–152. [Google Scholar] [CrossRef]
- Hernandez-Ramirez, F.; Prades, J.D.; Tarancon, A.; Barth, S.; Casals, O.; Jiménez-Diaz, R.; Pellicer, E.; Rodriguez, J.; Juli, M.A.; Romano-Rodriguez, A.; et al. Portable microsensor based on individual SnO2 nanowires. Nanotechnology 2007, 18, 495501. [Google Scholar] [CrossRef] [PubMed]
- Prades, J.D.; Jimenez-Diaz, R.; Hernandez-Ramirez, F.; Barth, S.; Cirera, A.; Romano-Rodriguez, A.; Mathur, S.; Morante, J.R. Ultralow power consumption gas sensors based on self-heated individual nanowires. Appl. Phys. Lett. 2008, 93, 123110. [Google Scholar] [CrossRef]
- Prades, J.D.; Jimenez-Diaz, R.; Hernandez-Ramirez, F.; Cirera, A.; Romano-Rodriguez, A.; Morante, J.R. Individual nanowire chemical sensor system self-powered with energy scavenging technologies. In Proceedings of the IEEE Solid-State Sensors, Actuators and Microsystems Conference, Denver, CO, USA, 21–25 June 2009; pp. 581–583. [Google Scholar]
- Gauzzi, F.; Verdini, B.; Maddalena, A.; Principi, G. X-ray diffraction and mössbauer analyses of SnO disproportionation products. Inorg. Chim. Acta 1985, 104, 1–7. [Google Scholar] [CrossRef]
- Gauzzi, F.; Verdini, B. Analysis of in-situ SnO disproportionation. J. Mater. Sci. Lett. 1985, 1492–1494. [Google Scholar] [CrossRef]
- Walsh, A.; Watson, G.W. Electronic structures of rocksalt, litharge, and herzenbergite SnO by density functional theory. Phys. Rev. B 2004, 70, 235114. [Google Scholar] [CrossRef]
- Walsh, A.; Payne, D.J.; Egdell, R.G.; Watson, G.W. Stereochemistry of post-transition metal oxides: Revision of the classical lone pair model. Chem. Soc. Rev. 2011, 40, 4455–4463. [Google Scholar] [CrossRef] [PubMed] [Green Version]
- Kaur, J.; Kumar, R.; Bhatnagar, M.C. Effect of indium-doped SnO2 nanoparticles on NO2 gas sensing properties. Sens. Actuators B Chem. 2007, 126, 478–484. [Google Scholar] [CrossRef]
- Sharma, A.; Tomar, M.; Gupta, V. WO3 nanoclusters-SnO2 film gas sensor heterostructure with enhanced response for NO2. Sens. Actuators B Chem. 2007, 176, 675–684. [Google Scholar] [CrossRef]
- Vila, A.; Hernandez-Ramirez, F.; Rodriguez, J.; Casal, O.; Romano-Rodriguez, A.; Morante, J.R.; Abid, M. Fabrication of metallic contacts to nanometre-sized materials using a focused ion beam (FIB). Mater. Sci. Eng. 2006, 26, 1063–1066. [Google Scholar] [CrossRef]
- Hernandez-Ramirez, F.; Rodriguez, J.; Casals, O.; Russinyol, E.; Vila, A.; Romano-Rodriguez, A.; Morante, J.R.; Abid, M. Characterization of metal-oxide nanosensors fabricated with focused ion beam (FIB). Sens. Actuators B Chem. 2006, 118, 198–203. [Google Scholar] [CrossRef]
- Liewhiran, C.; Tamaekong, N.; Wisitsiraat, A.; Phanichphant, S. Highly selective environmental sensors based on flame-spray-made SnO2 nanoparticles. Sens. Actuators B Chem. 2012, 163, 51–60. [Google Scholar] [CrossRef]
- Solymosi, F.; Kiss, J. Adsorption and reduction of NO on tin (IV) oxide catalysts. J. Catal. 1976, 41, 202–211. [Google Scholar] [CrossRef]
- Maiti, A.; Rodriguez, J.A.; Law, M.; Kung, P.; McKiney, J.R.; Yang, P. SnO2 nanoribbons as NO2 sensors: Insights from first principles calculations. Nano Lett. 2003, 3, 1025–1028. [Google Scholar] [CrossRef]
- Lenaerts, S.; Roggen, J.; Maes, G. FT-IR characterization of tin dioxide gas sensor materials under working conditions. Spectrochim. Acta Part A Mol. Biomol. Spectrosc. 1995, 51, 883–894. [Google Scholar] [CrossRef]
- Gopel, W.; Schierbaum, K.D. SnO2 sensors: Current status and future prospects. Sens. Actuators B Chem. 1995, 26, 1–12. [Google Scholar] [CrossRef]
- Barsan, N.; Weimar, U. Conduction model of metal oxide gas sensors. J. Electroceramics. 2001, 7, 143–167. [Google Scholar] [CrossRef]
- Schipani, F.; Miller, D.R.; Ponce, M.A.; Aldao, C.M.; Akbar, S.A.; Morris, P.A.; Xu, J.C. Conduction mechanisms in SnO2 single-nanowire gas sensors: An impedance spectroscopy study. Sens. Actuators B Chem. 2017, 241, 99–108. [Google Scholar] [CrossRef]
- Weisz, P.B. Effects of electronic charge transfer between adsorbate and solid on chemisorption and catalysis. J. Chem. Phy. 1953, 21, 1531–1538. [Google Scholar] [CrossRef]
- Gurlo, A. Interplay between O2 and SnO2: Oxygen ionosorption and spectroscopic evidence for adsorbed oxygen. ChemPhysChem 2006, 7, 2041–2052. [Google Scholar] [CrossRef] [PubMed]
- Wang, B.; Zhu, L.F.; Yang, Y.H.; Xu, N.S.; Yang, W. Fabrication of a SnO2 nanowire gas sensor and sensor performance for hydrogen. J. Phys. Chem. C 2008, 112, 6643–6647. [Google Scholar] [CrossRef]
- Starke, T.K.H.; Coles, G.S.V. Reduced response times using adsorption kinetics and pulsed-mode operation for the detection of oxides of nitrogen with nanocrystalline SnO2 sensors. IEEE Sens. J. 2003, 3, 447–453. [Google Scholar] [CrossRef]
Figure 1.
Procedure for device preparation, from the interdigitated electrode deposition to nanofabrication. (a) A suspension containing micro-disks deposited onto interdigitated electrodes with crosses representing locations where electrodes were severed by FIB; (b) SEM image of the device following nanofabrication process with chosen SnO micro-disk and the Pt- EBID and IBID connecting the sample to the interdigitated fingers. Ion milled region represents cuts made throughout the Pt0 on the smaller crossed regions in (a). Sensor device within the designated yellow square is shown in Figure 3b.
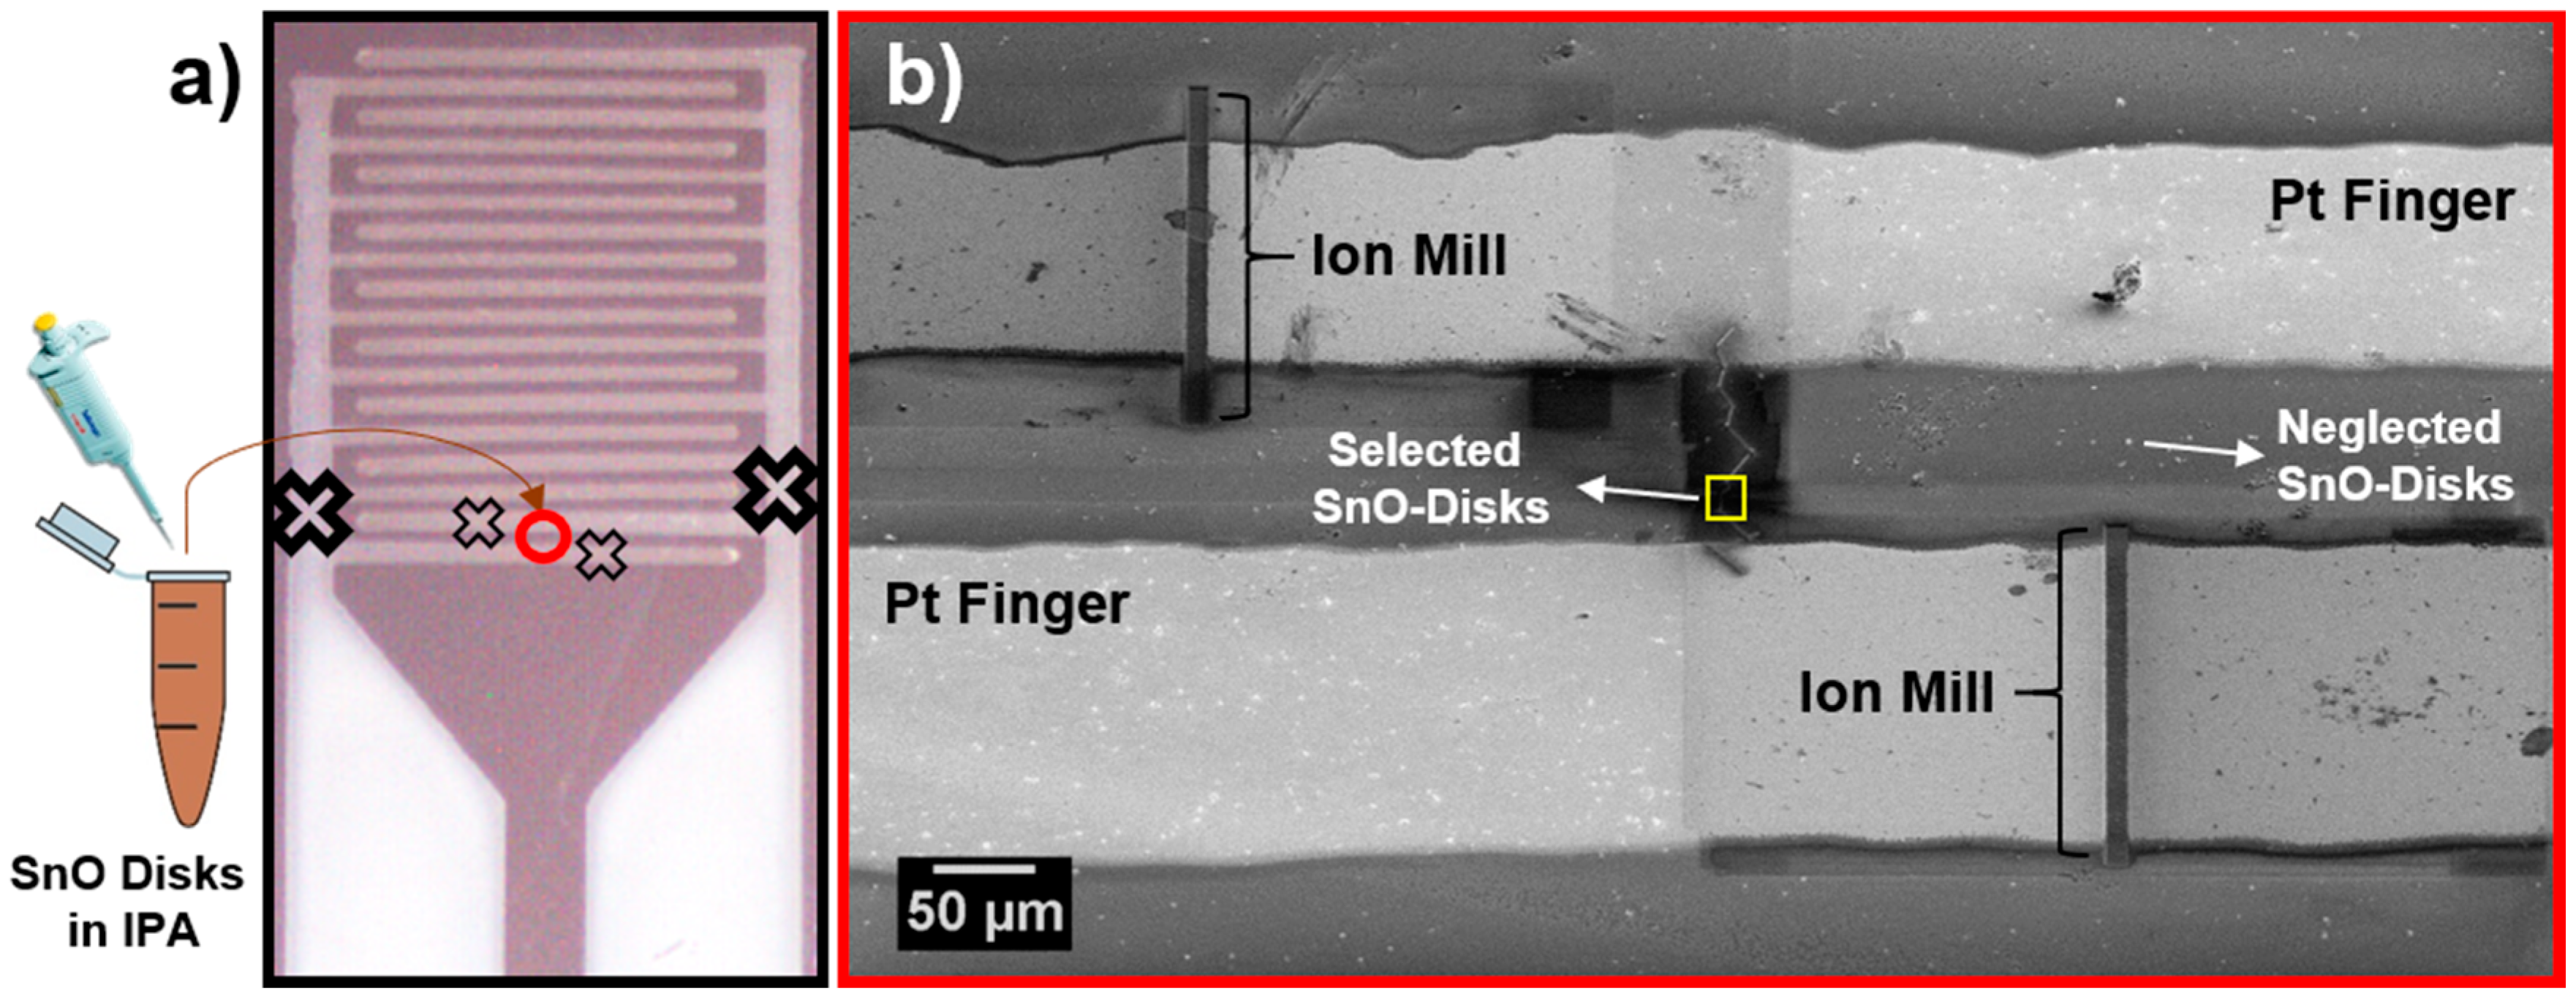
Figure 2.
XRD of the SnO micro-disks after synthesis and decantation process. JCPDS used to index the spectra are described in the inset.
Figure 2.
XRD of the SnO micro-disks after synthesis and decantation process. JCPDS used to index the spectra are described in the inset.
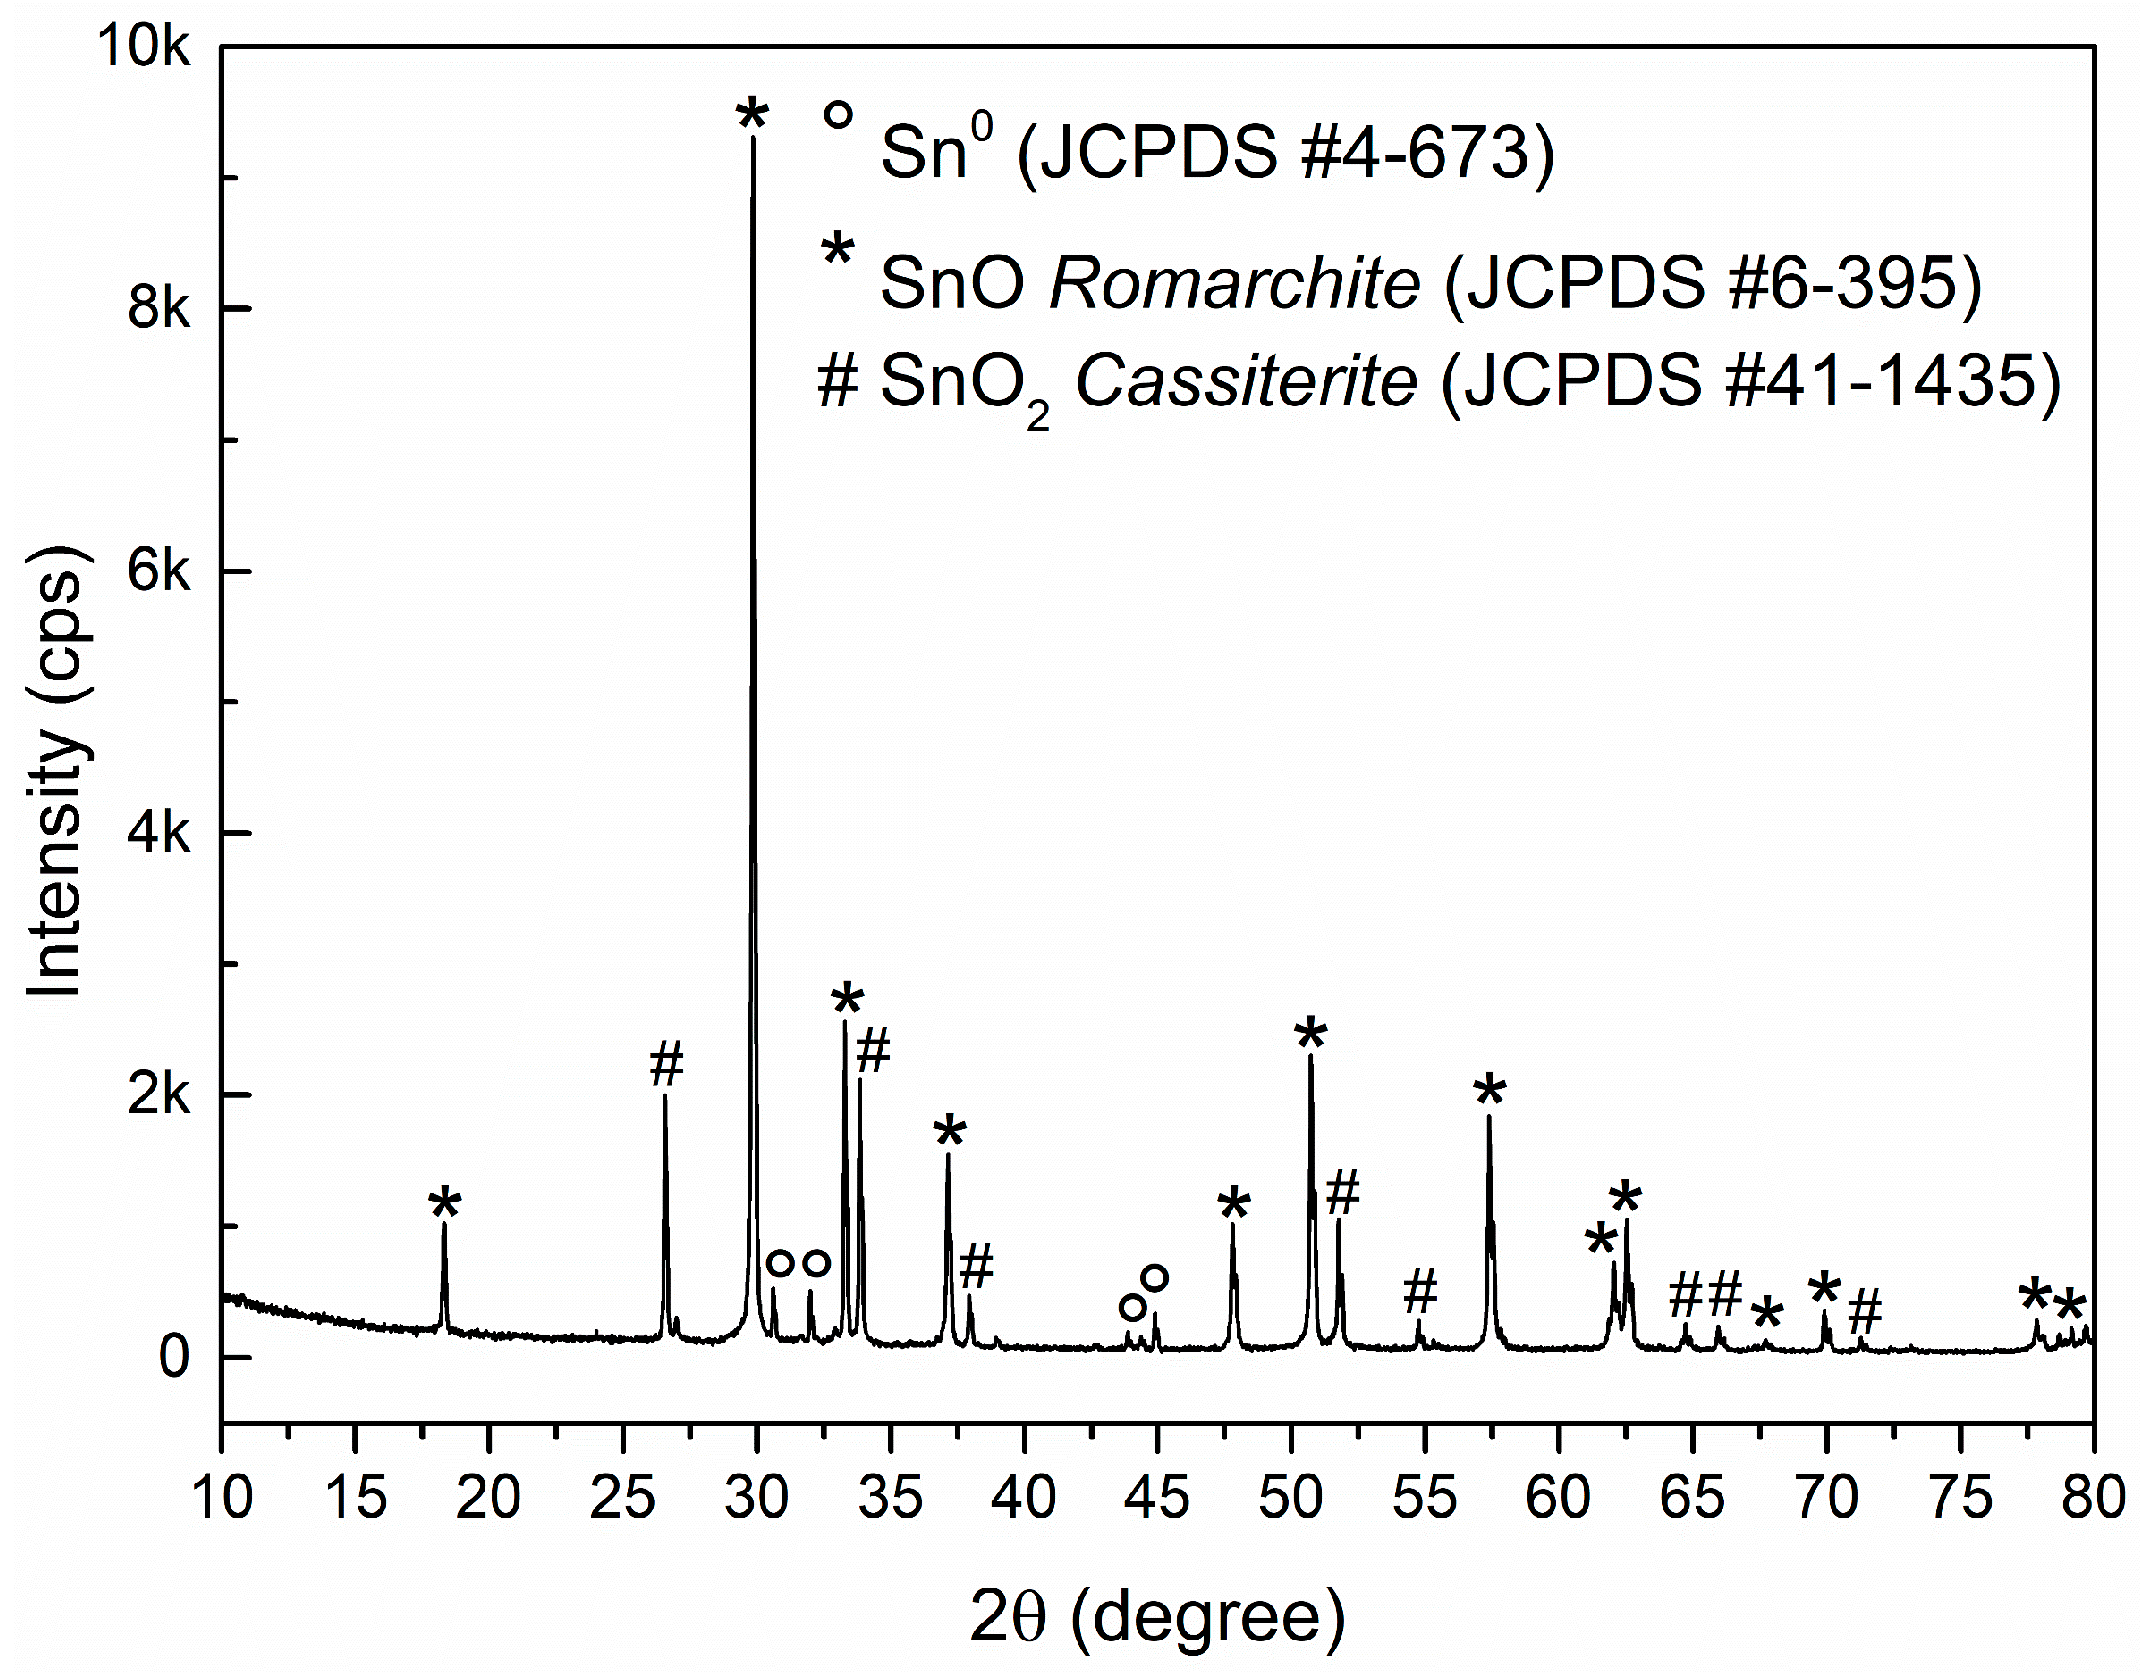
Figure 3.
Image of sensor devices made from individual micro-disk. (a,b) Disks with small and large exposed area, respectively, showing Pt-EBID contacts; (c,d) The same disks after Pt-IBID electrodes deposition.
Figure 3.
Image of sensor devices made from individual micro-disk. (a,b) Disks with small and large exposed area, respectively, showing Pt-EBID contacts; (c,d) The same disks after Pt-IBID electrodes deposition.

Figure 4.
Typical gas sensor measurements for device 1 at different gases concentrations when exposed to (a) oxidizing; and (b) reducing gas. Results were obtained at 100 °C.
Figure 4.
Typical gas sensor measurements for device 1 at different gases concentrations when exposed to (a) oxidizing; and (b) reducing gas. Results were obtained at 100 °C.

Figure 5.
Sensor signal vs gas concentration. The signals were calculated through the exponential and linear fittings of the curves shown in Figure 4.
Figure 5.
Sensor signal vs gas concentration. The signals were calculated through the exponential and linear fittings of the curves shown in Figure 4.

Figure 6.
(a) Typical gas sensor measurement for different NO2 concentration vs time; (b) The sensor signal vs gas concentration for the two studied samples. All obtained at 100 °C.
Figure 6.
(a) Typical gas sensor measurement for different NO2 concentration vs time; (b) The sensor signal vs gas concentration for the two studied samples. All obtained at 100 °C.

Figure 7.
Sensor signal vs. gas concentration obtained at 200 °C. Red lines represent the sensor signals obtained at 100 °C, for comparative purposes.
Figure 7.
Sensor signal vs. gas concentration obtained at 200 °C. Red lines represent the sensor signals obtained at 100 °C, for comparative purposes.

© 2018 by the authors. Licensee MDPI, Basel, Switzerland. This article is an open access article distributed under the terms and conditions of the Creative Commons Attribution (CC BY) license (http://creativecommons.org/licenses/by/4.0/).
Share and Cite
MDPI and ACS Style
Masteghin, M.G.; Orlandi, M.O. A Gas Sensor Based on a Single SnO Micro-Disk. Sensors 2018, 18, 3229. https://doi.org/10.3390/s18103229
AMA Style
Masteghin MG, Orlandi MO. A Gas Sensor Based on a Single SnO Micro-Disk. Sensors. 2018; 18(10):3229. https://doi.org/10.3390/s18103229
Chicago/Turabian StyleMasteghin, Mateus G., and Marcelo O. Orlandi. 2018. "A Gas Sensor Based on a Single SnO Micro-Disk" Sensors 18, no. 10: 3229. https://doi.org/10.3390/s18103229
Note that from the first issue of 2016, this journal uses article numbers instead of page numbers. See further details here.