EmoTour: Estimating Emotion and Satisfaction of Users Based on Behavioral Cues and Audiovisual Data

 , ,
, ,
Abstract
:1. Introduction
- First, we propose a new model for quantitatively estimating both the emotion and satisfaction of tourists by employing multiple modalities obtained from unconscious and natural user actions. To avoid the potential risk of biased ratings in a user review for satisfaction-level estimation, and enable emotional-state estimation at an actual sightseeing situation, we employ the combination of behavioral cues and audiovisual data collected by an eye-gaze tracker, physical-activity sensors, and a smartphone. In detail, the following high-level features were derived from each modality and fused to build a final classifier: eye movement, head tilt, and footsteps from behavioral cues; and vocal and facial expressions from audiovisual data. We argue that our scheme can build the model without dependence on any extra tasks for users.
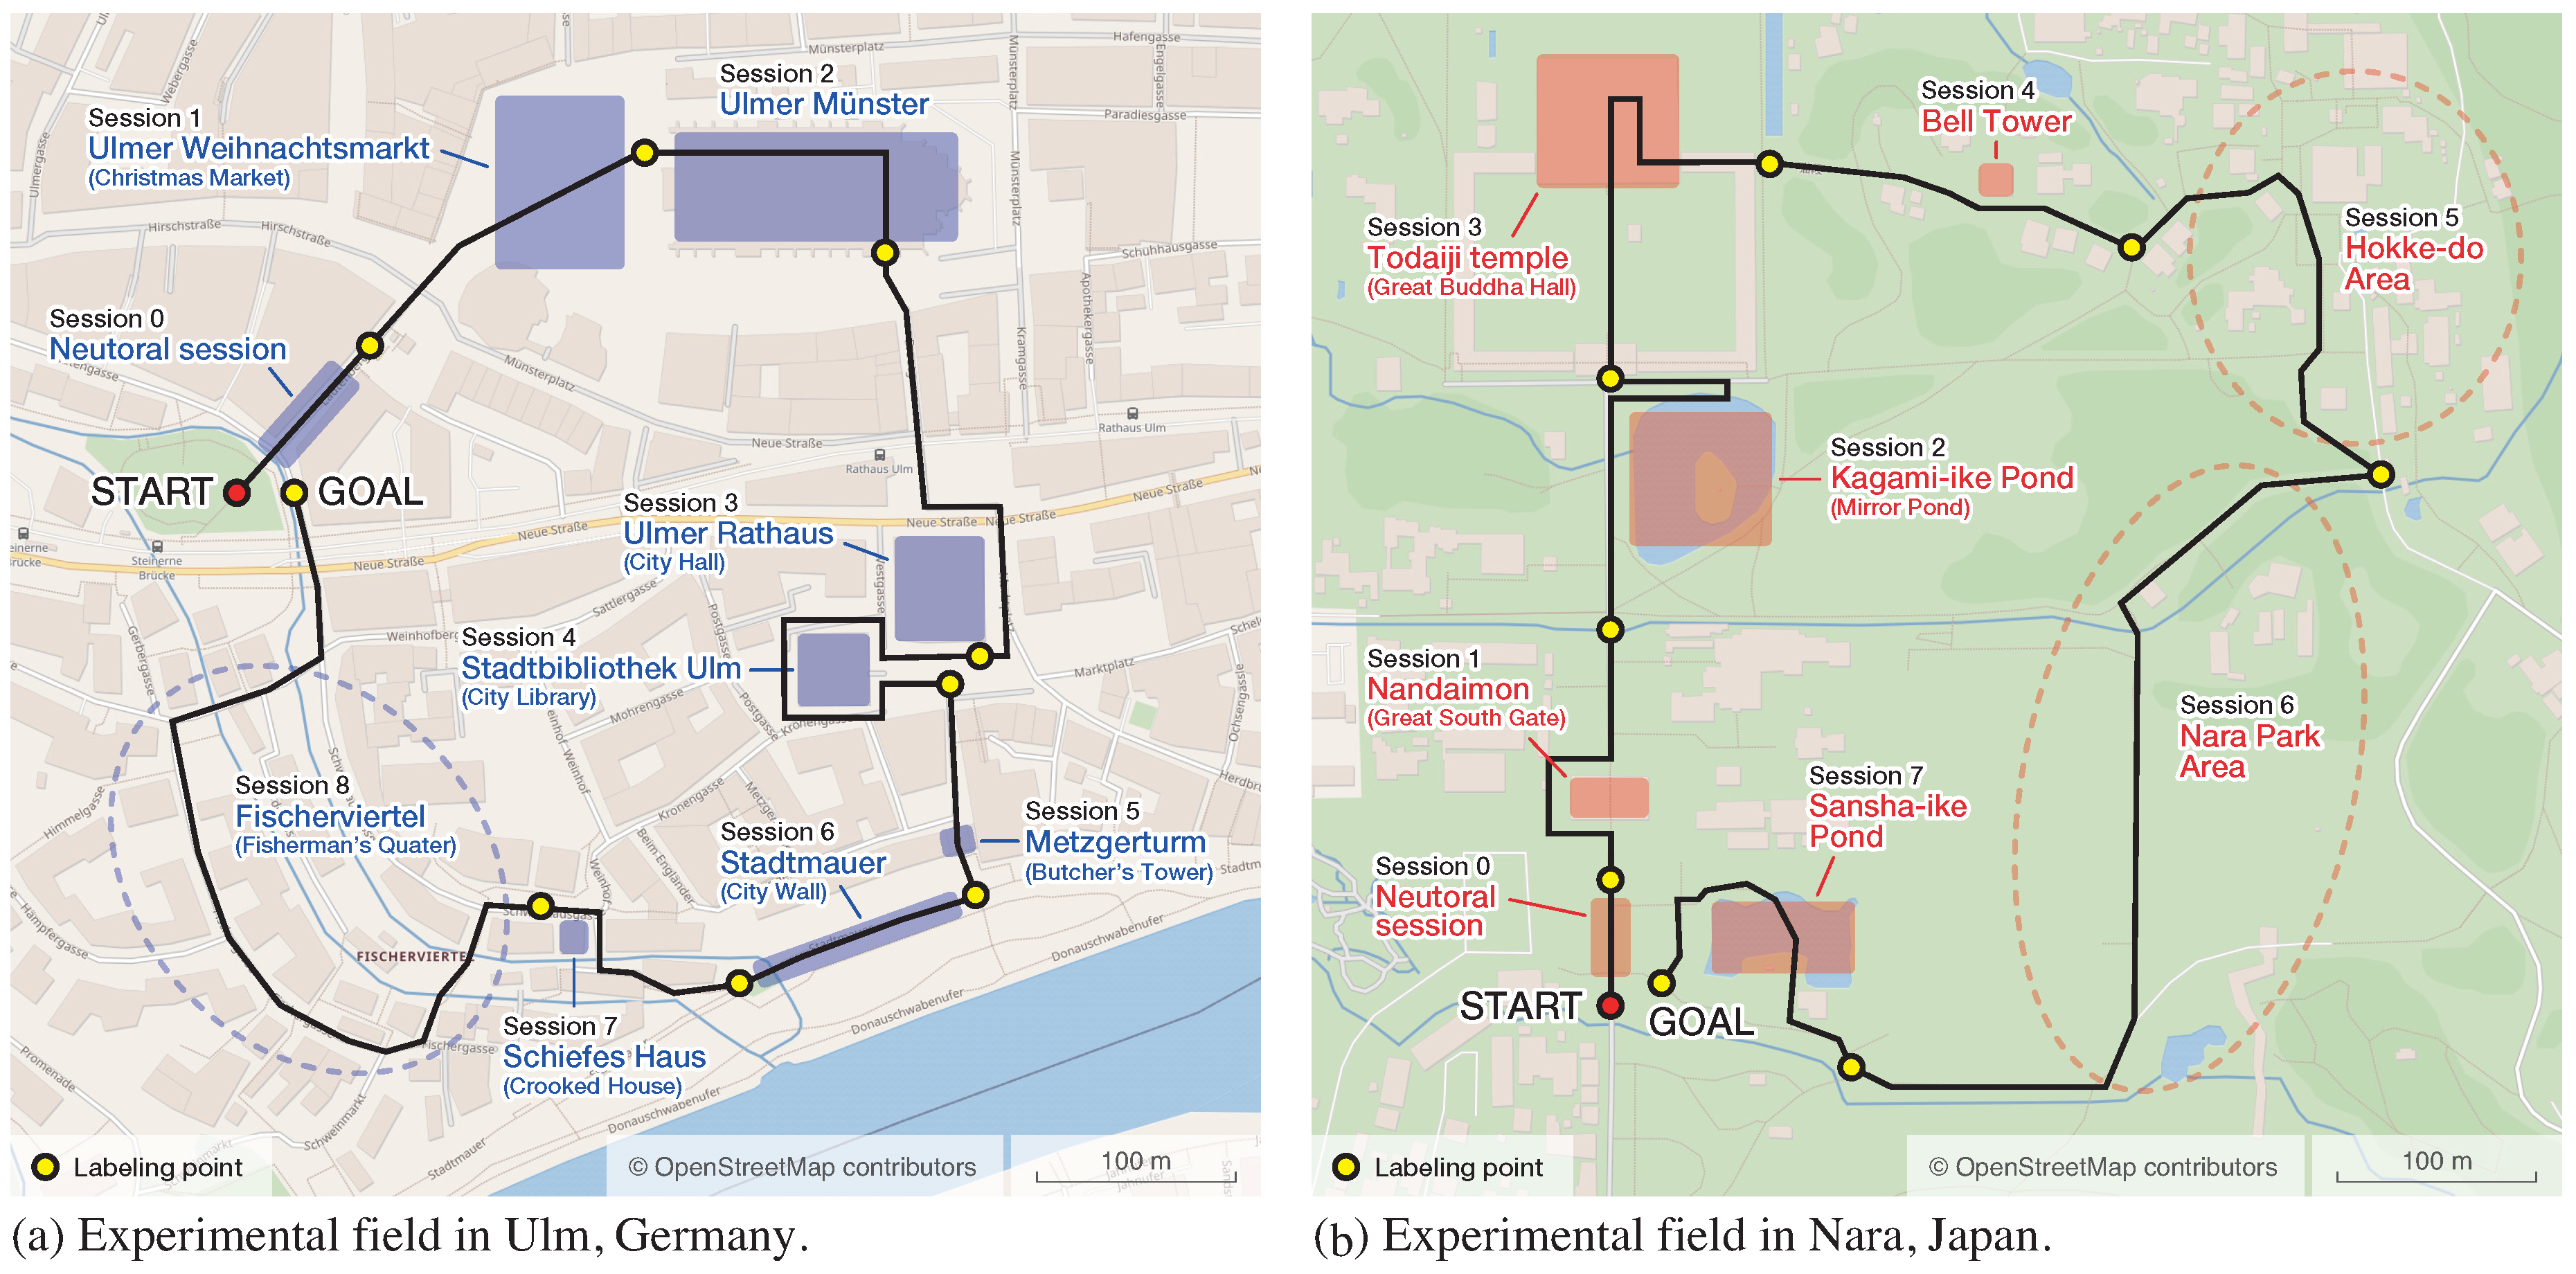
- Second, we evaluated our model through experiments with 22 users in a tourist domain (i.e., in a real-world scenario). As the experimental fields, we selected two touristic areas, located in Germany and Japan, which have completely different conditions. We evaluated the emotion estimation model through a three-class classification task (positive, neutral, negative) using unweighted average recall (UAR) score as a metric, and achieved up to 0.48 of UAR score. Then, we evaluated the satisfaction estimation model through a 7-level regression task (0: fully unsatisfied–6: fully satisfied) using mean absolute error (MAE) as a metric, and achieved up to 1.11 of MAE. In addition, we found that effective features used for emotion and satisfaction estimation are different among tourists with different cultural background.
2. Related Work and Challenges
2.1. Estimation of Emotional Status
2.2. Estimation of Satisfaction Level
2.3. Objective and Challenges
2.4. Preliminary Work
3. Proposed Approach and Workflow
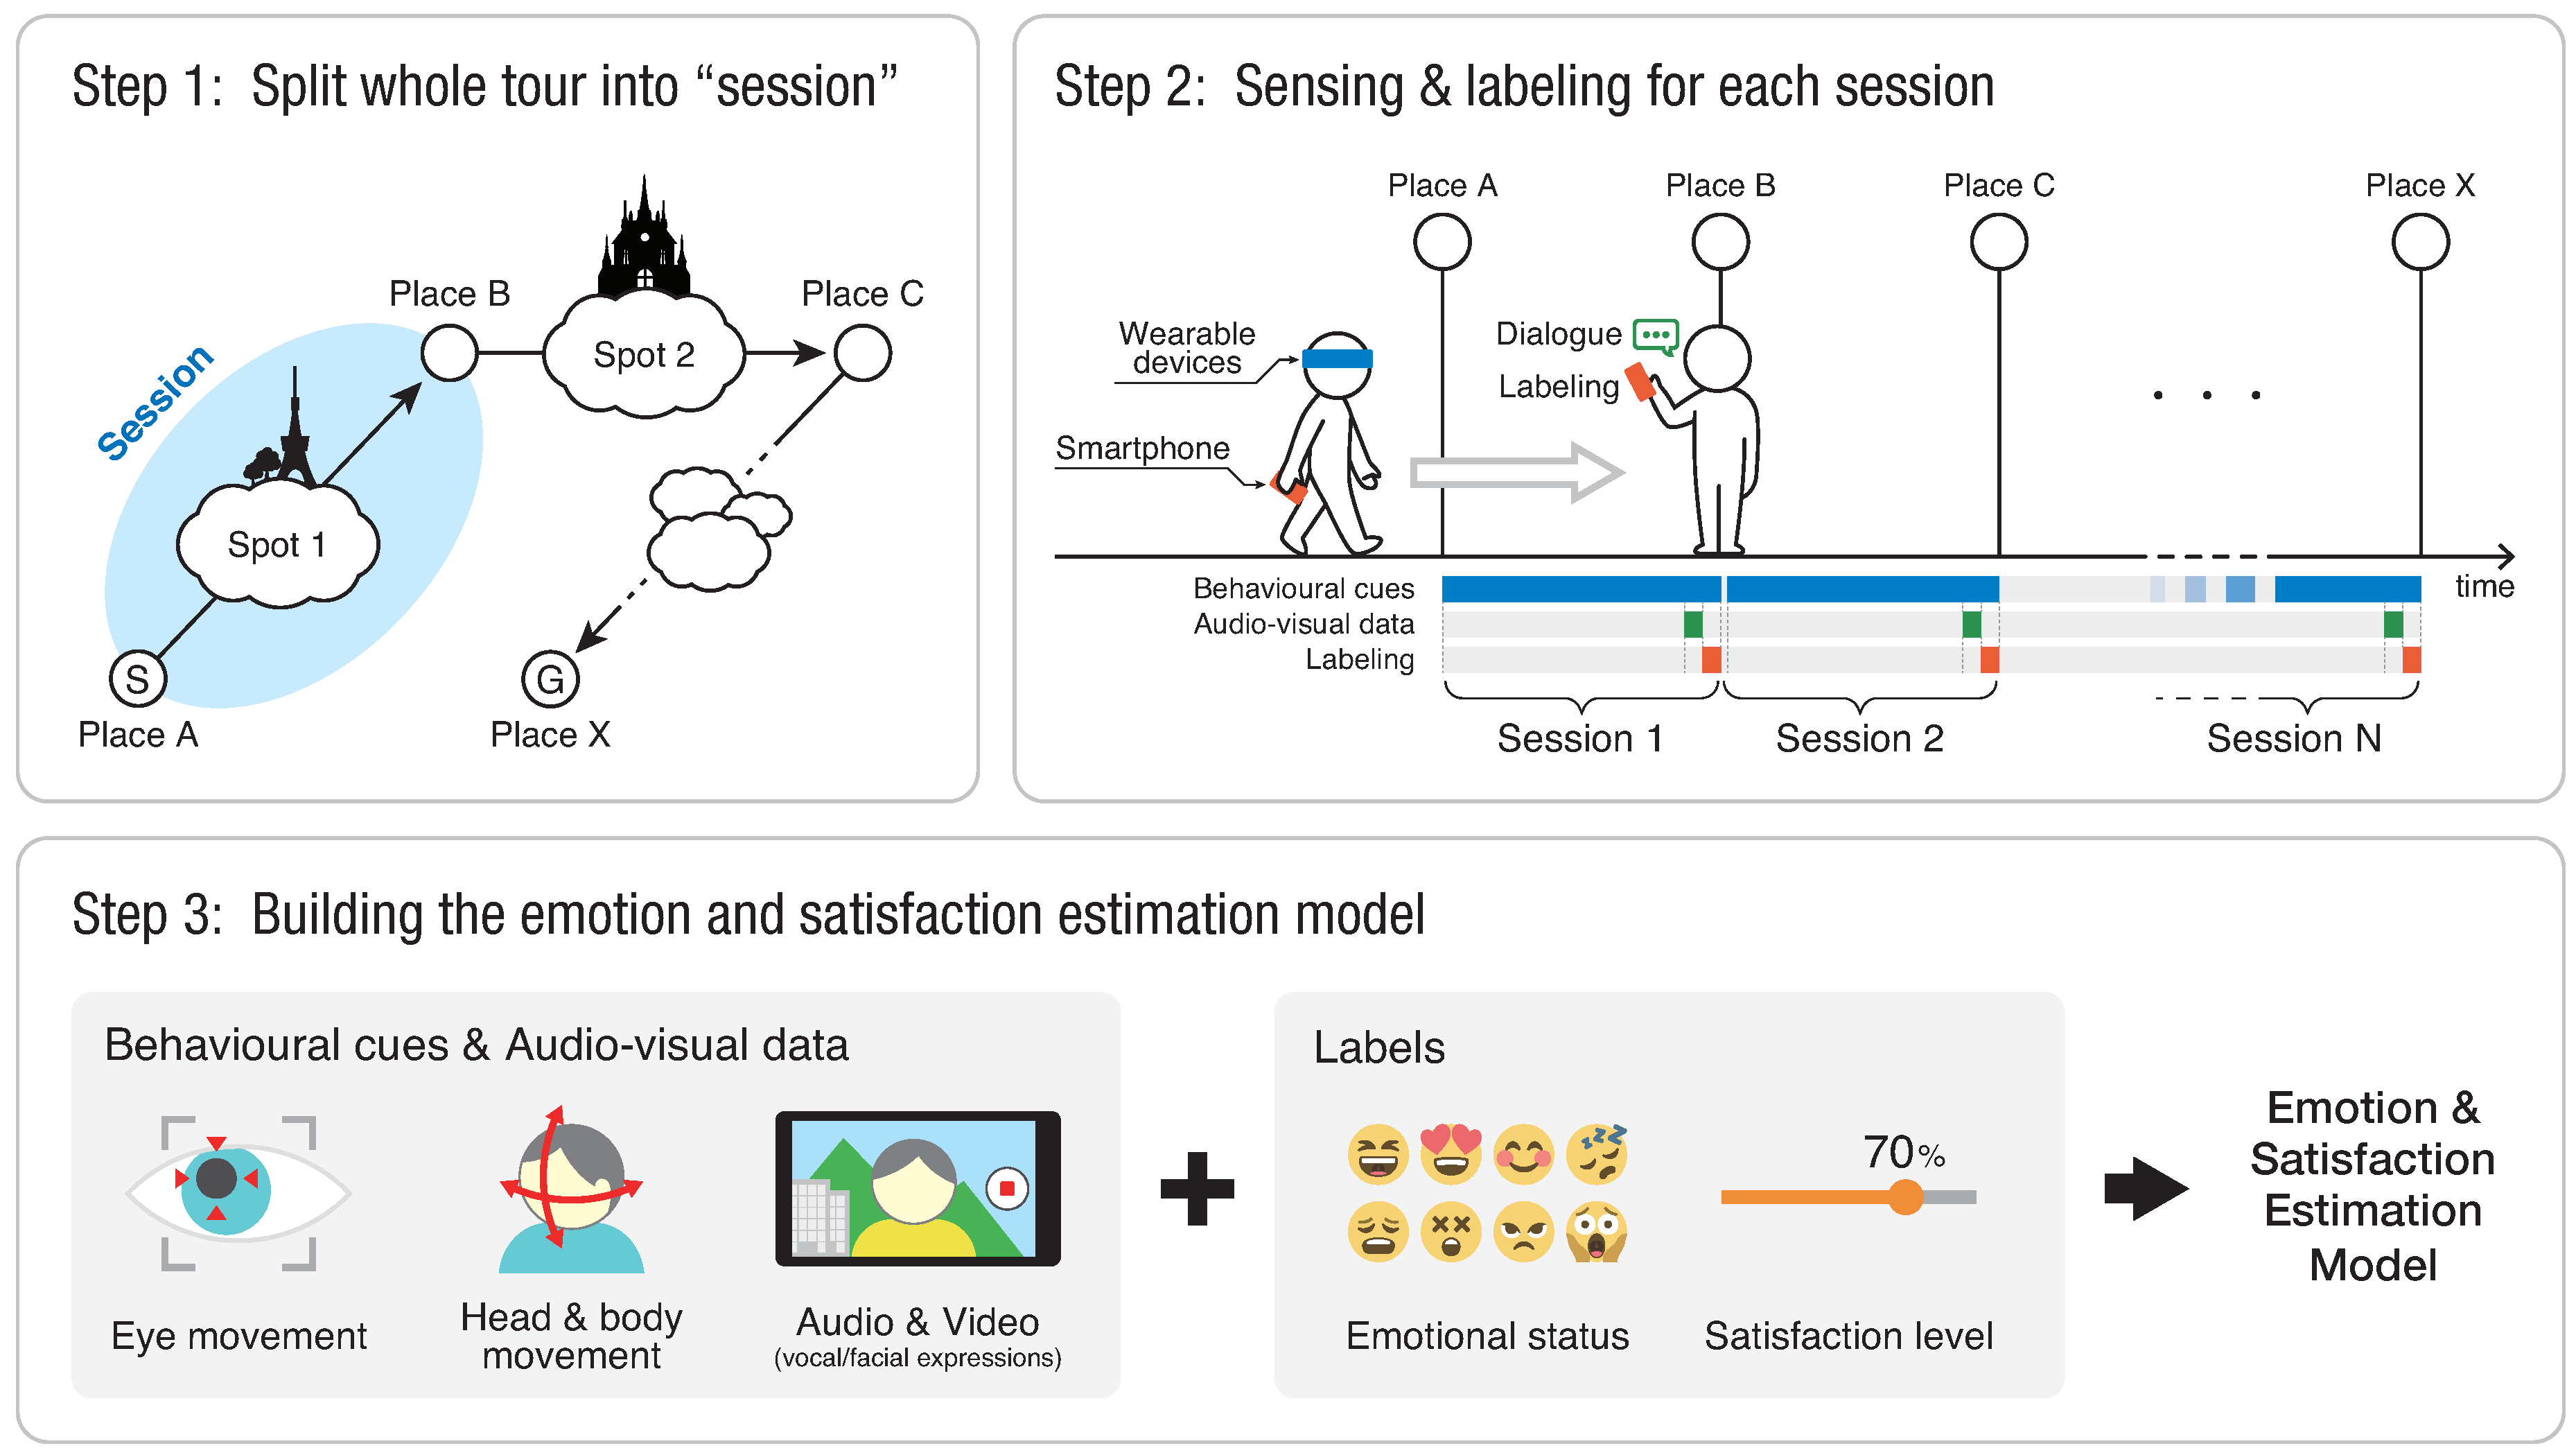
- Step 1—Split the whole tour into sessions
- Before starting sightseeing, we split the whole tour into small periods (sessions) that included at least one sight each. We assumed that a tourist typically requests guidance information for each sightseeing spot.
- Step 2—Sensing and labeling
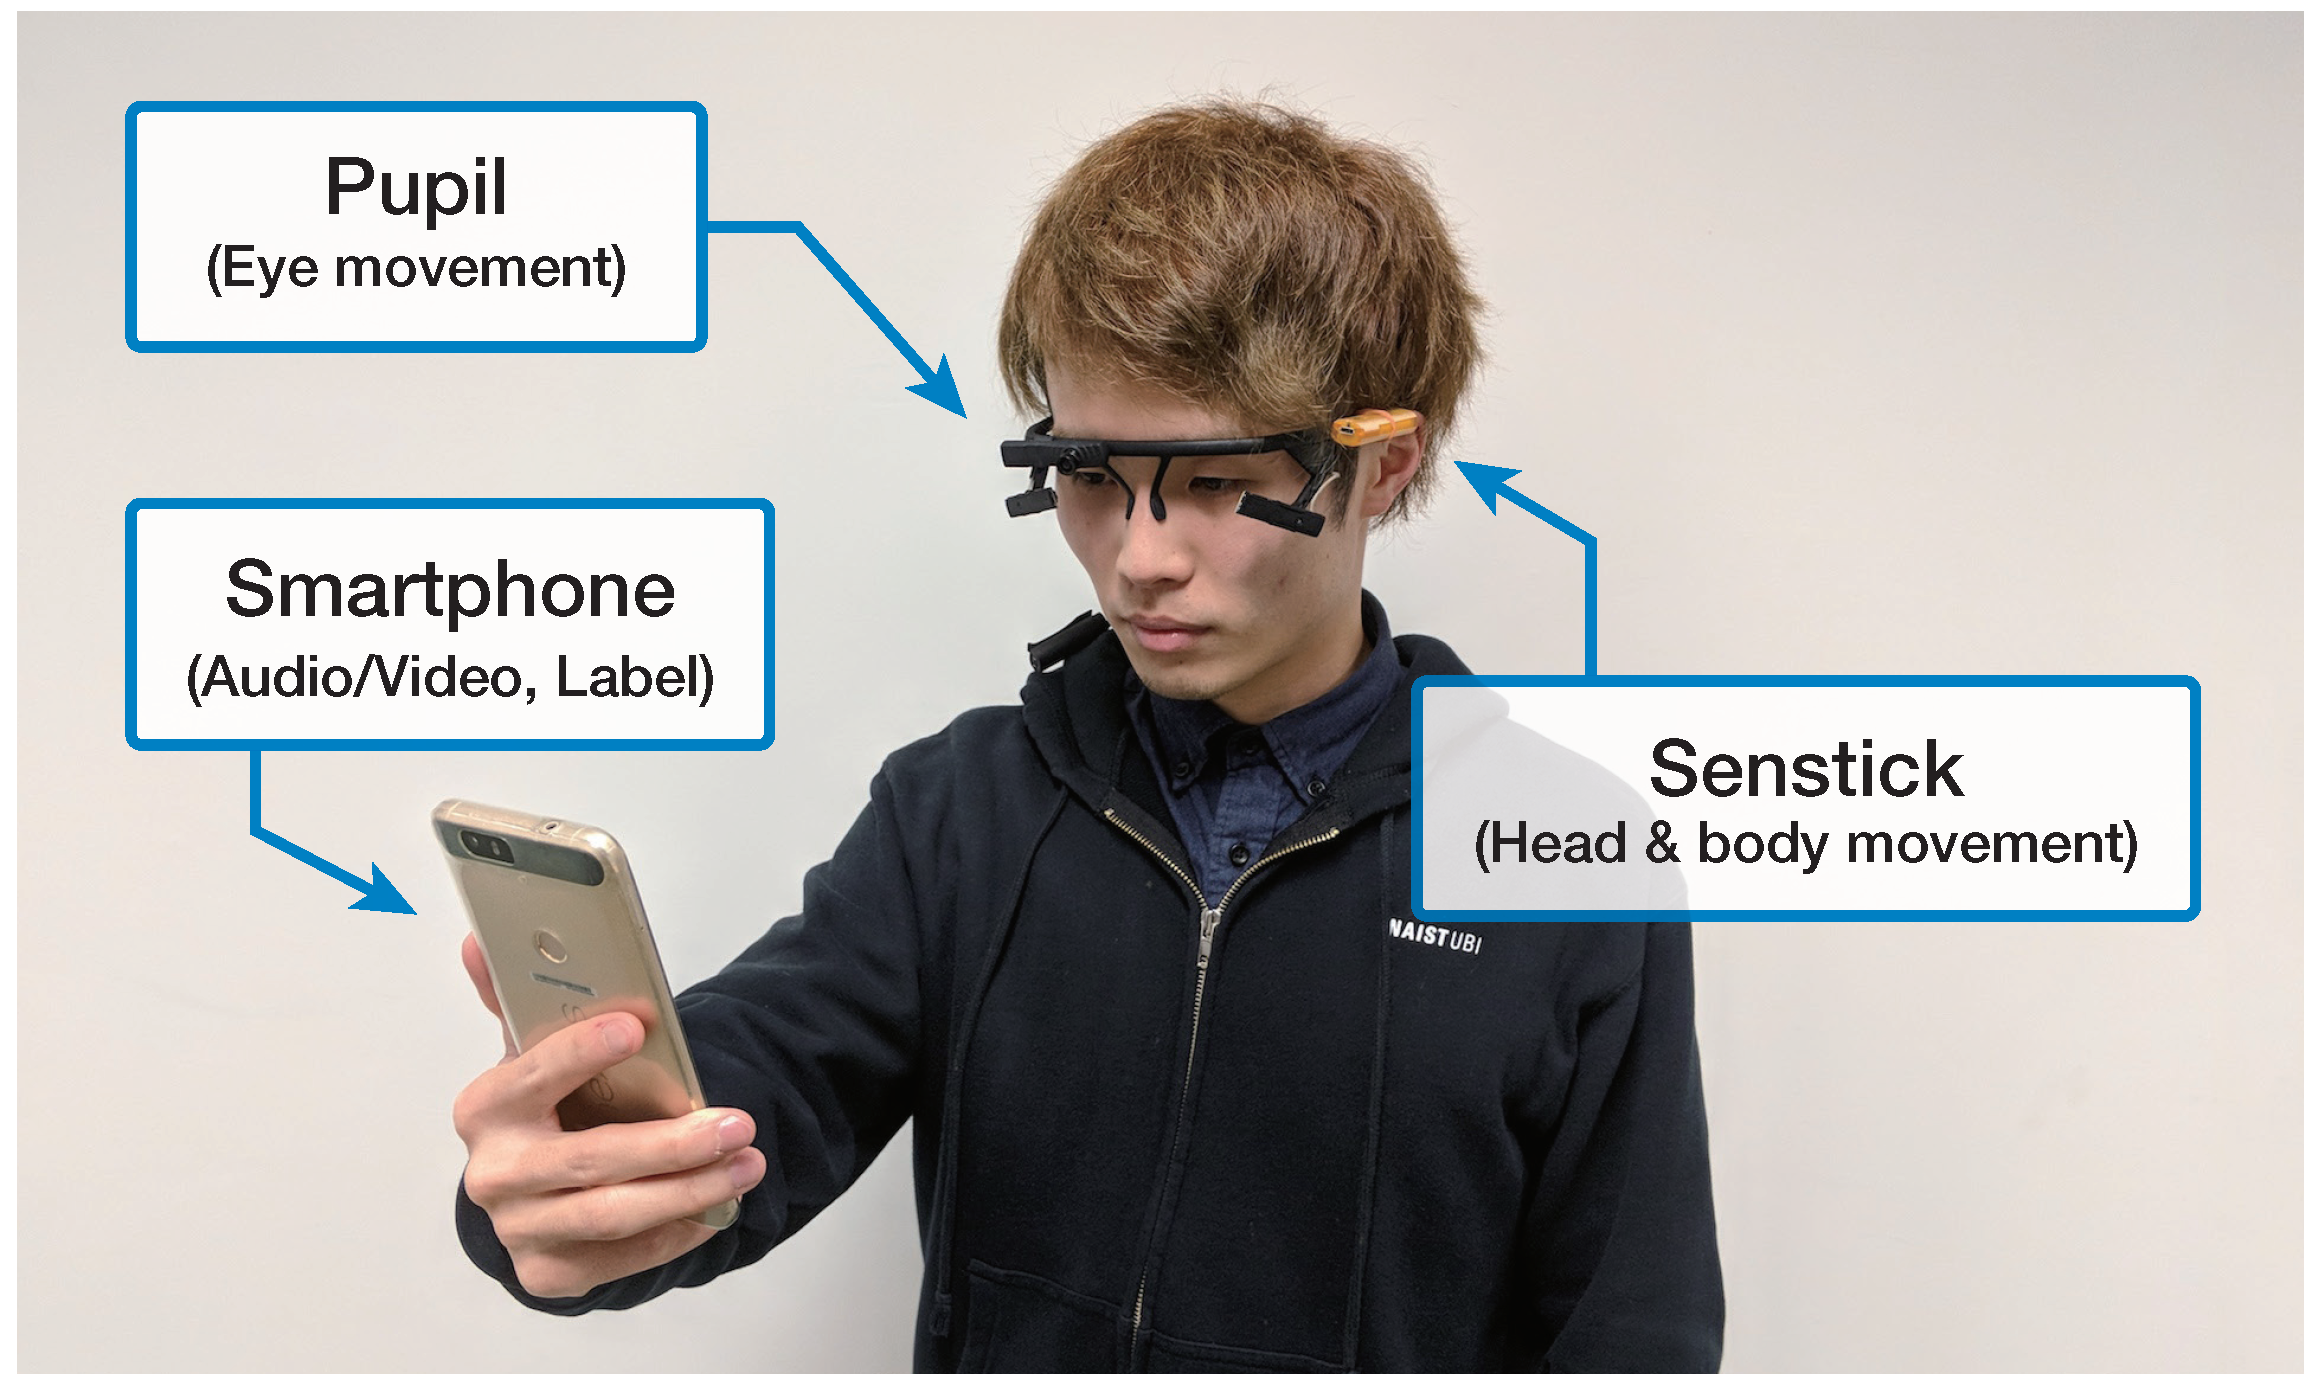
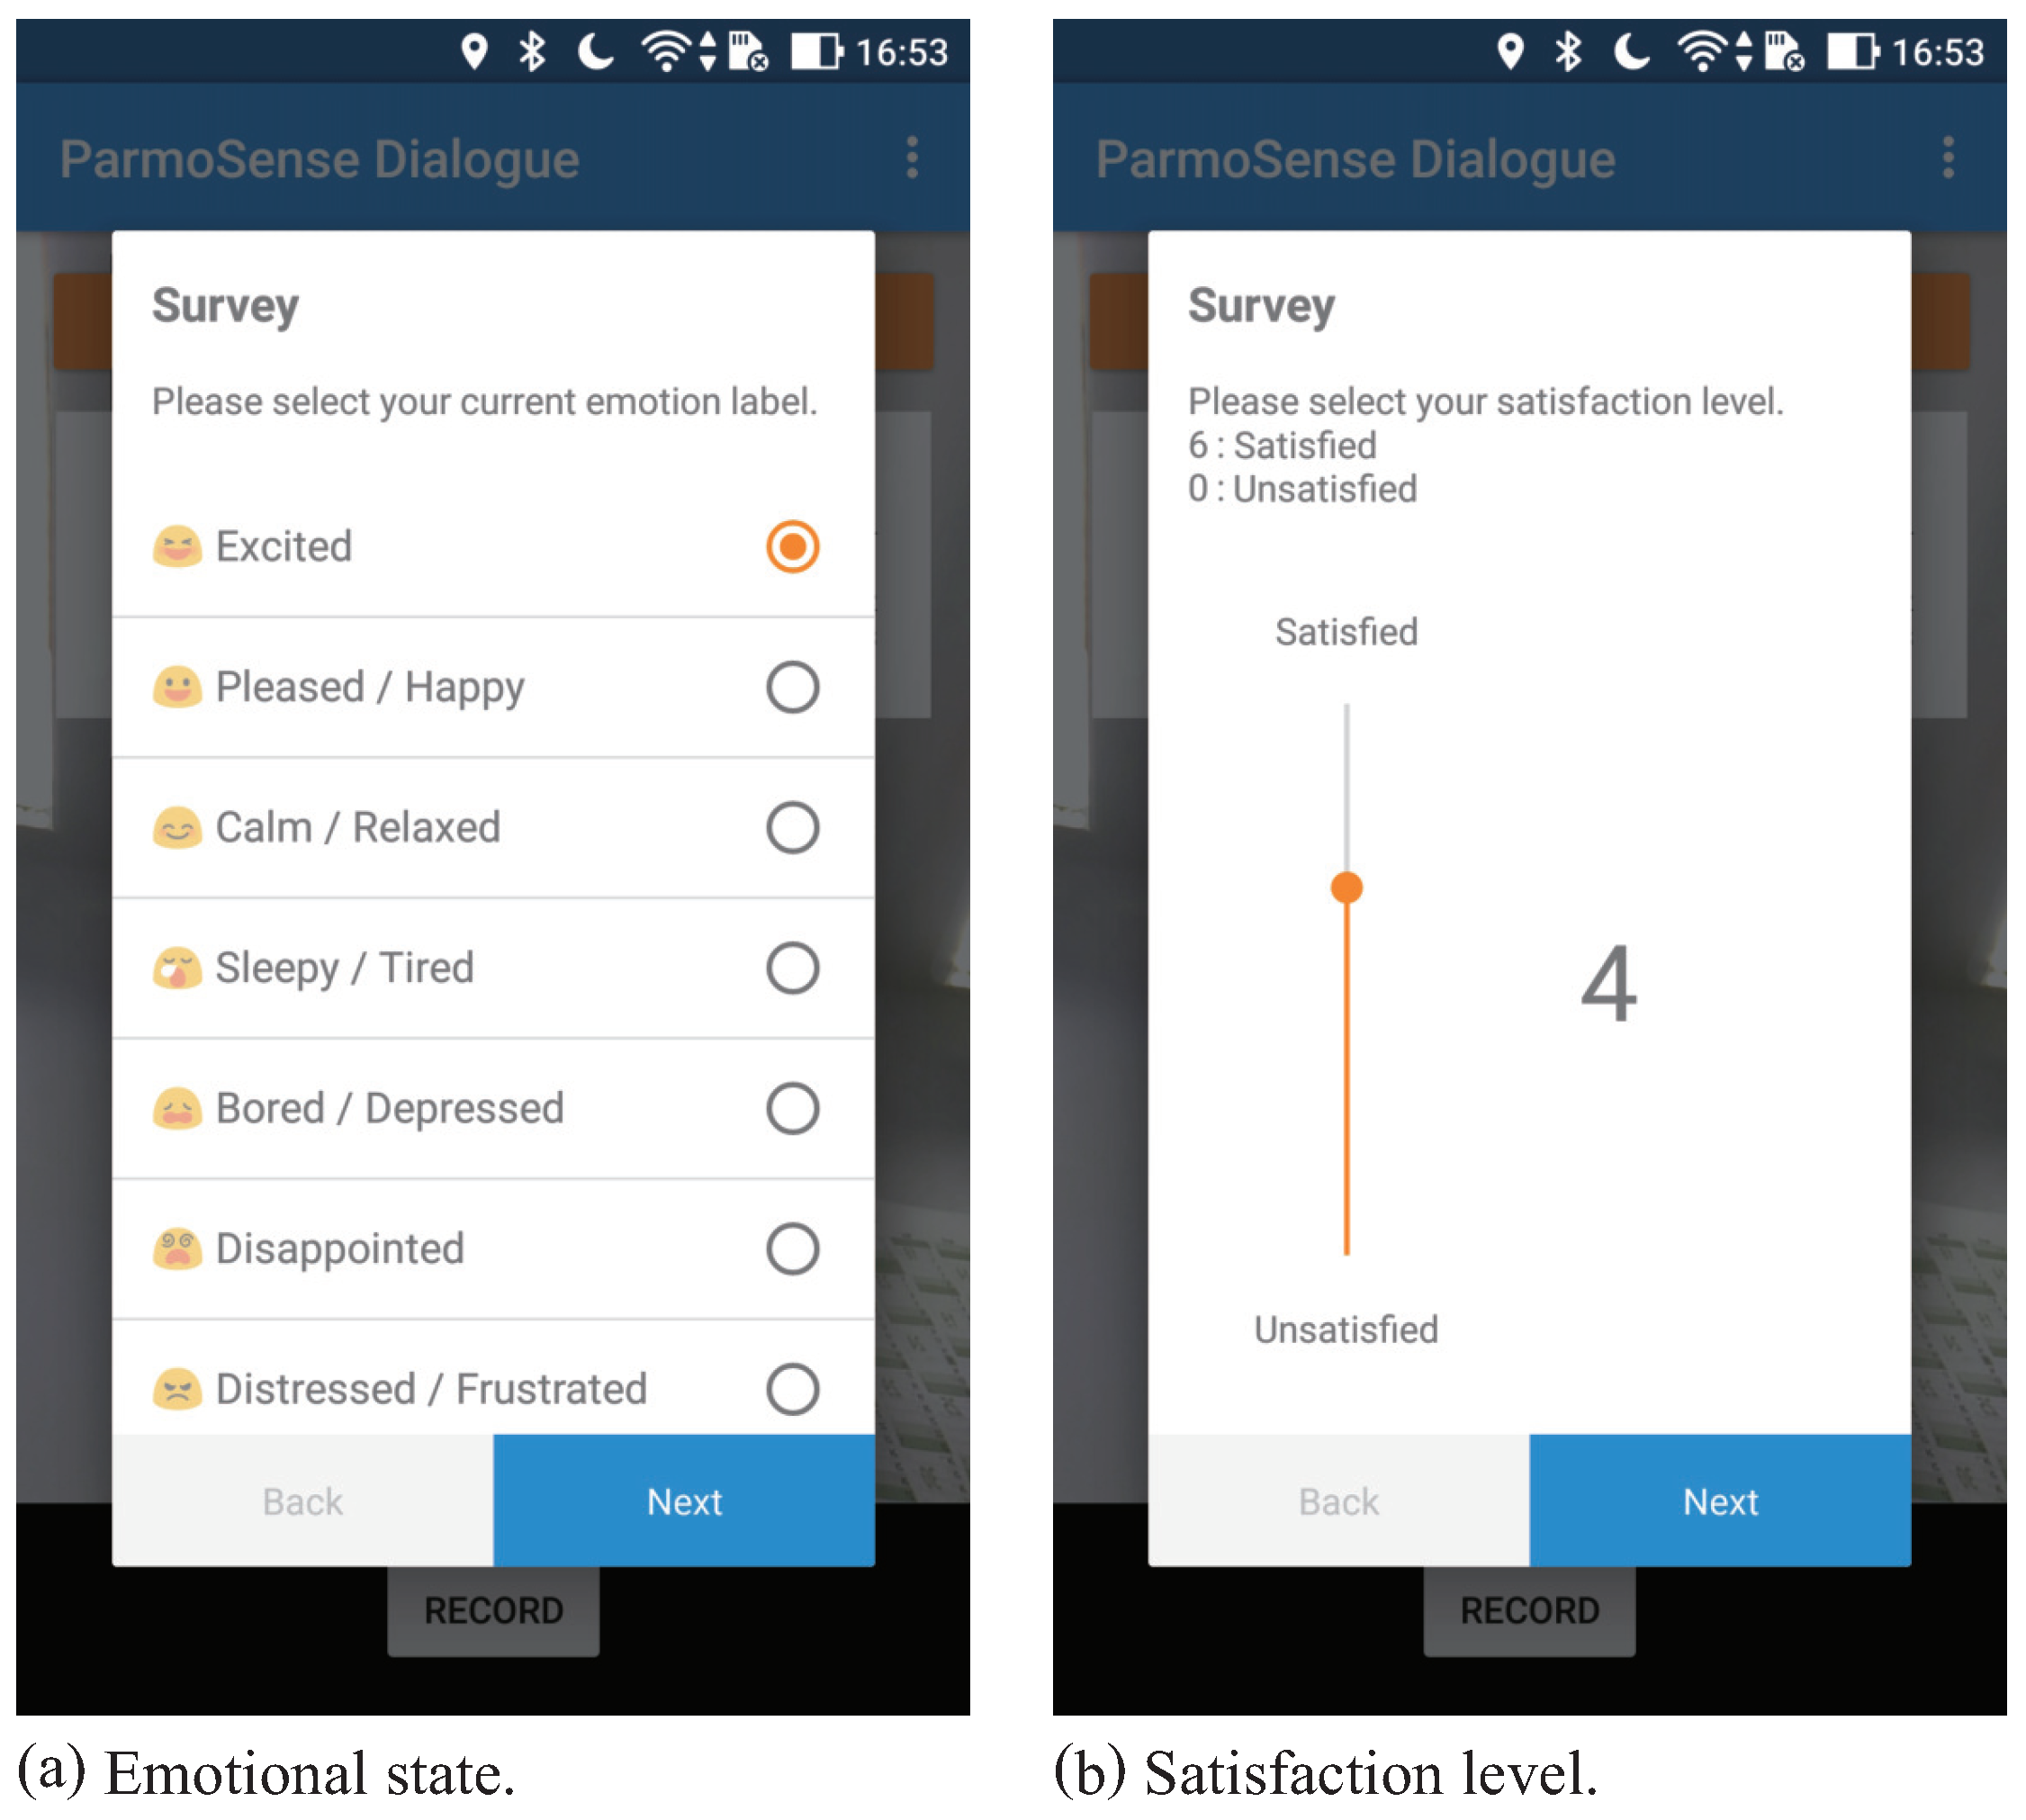
- Tourists could freely visit sights while equipped with wearable devices that continuously recorded their behavior during the whole sightseeing. At the end of each session, they gave small amounts of feedback about the latest session by recording a selfie video. We assumed that recording a video serves as a means of interacting with dialogue systems or sending a video message to their friends. They also manually input their current emotional status and satisfaction level as a label. Then, they repeated the same procedure for each of the tour sessions.
- Step 3—Building the estimating model
- The tourist emotion- and satisfaction-estimation model was built based on tourist behavior, audiovisual data, and labels.
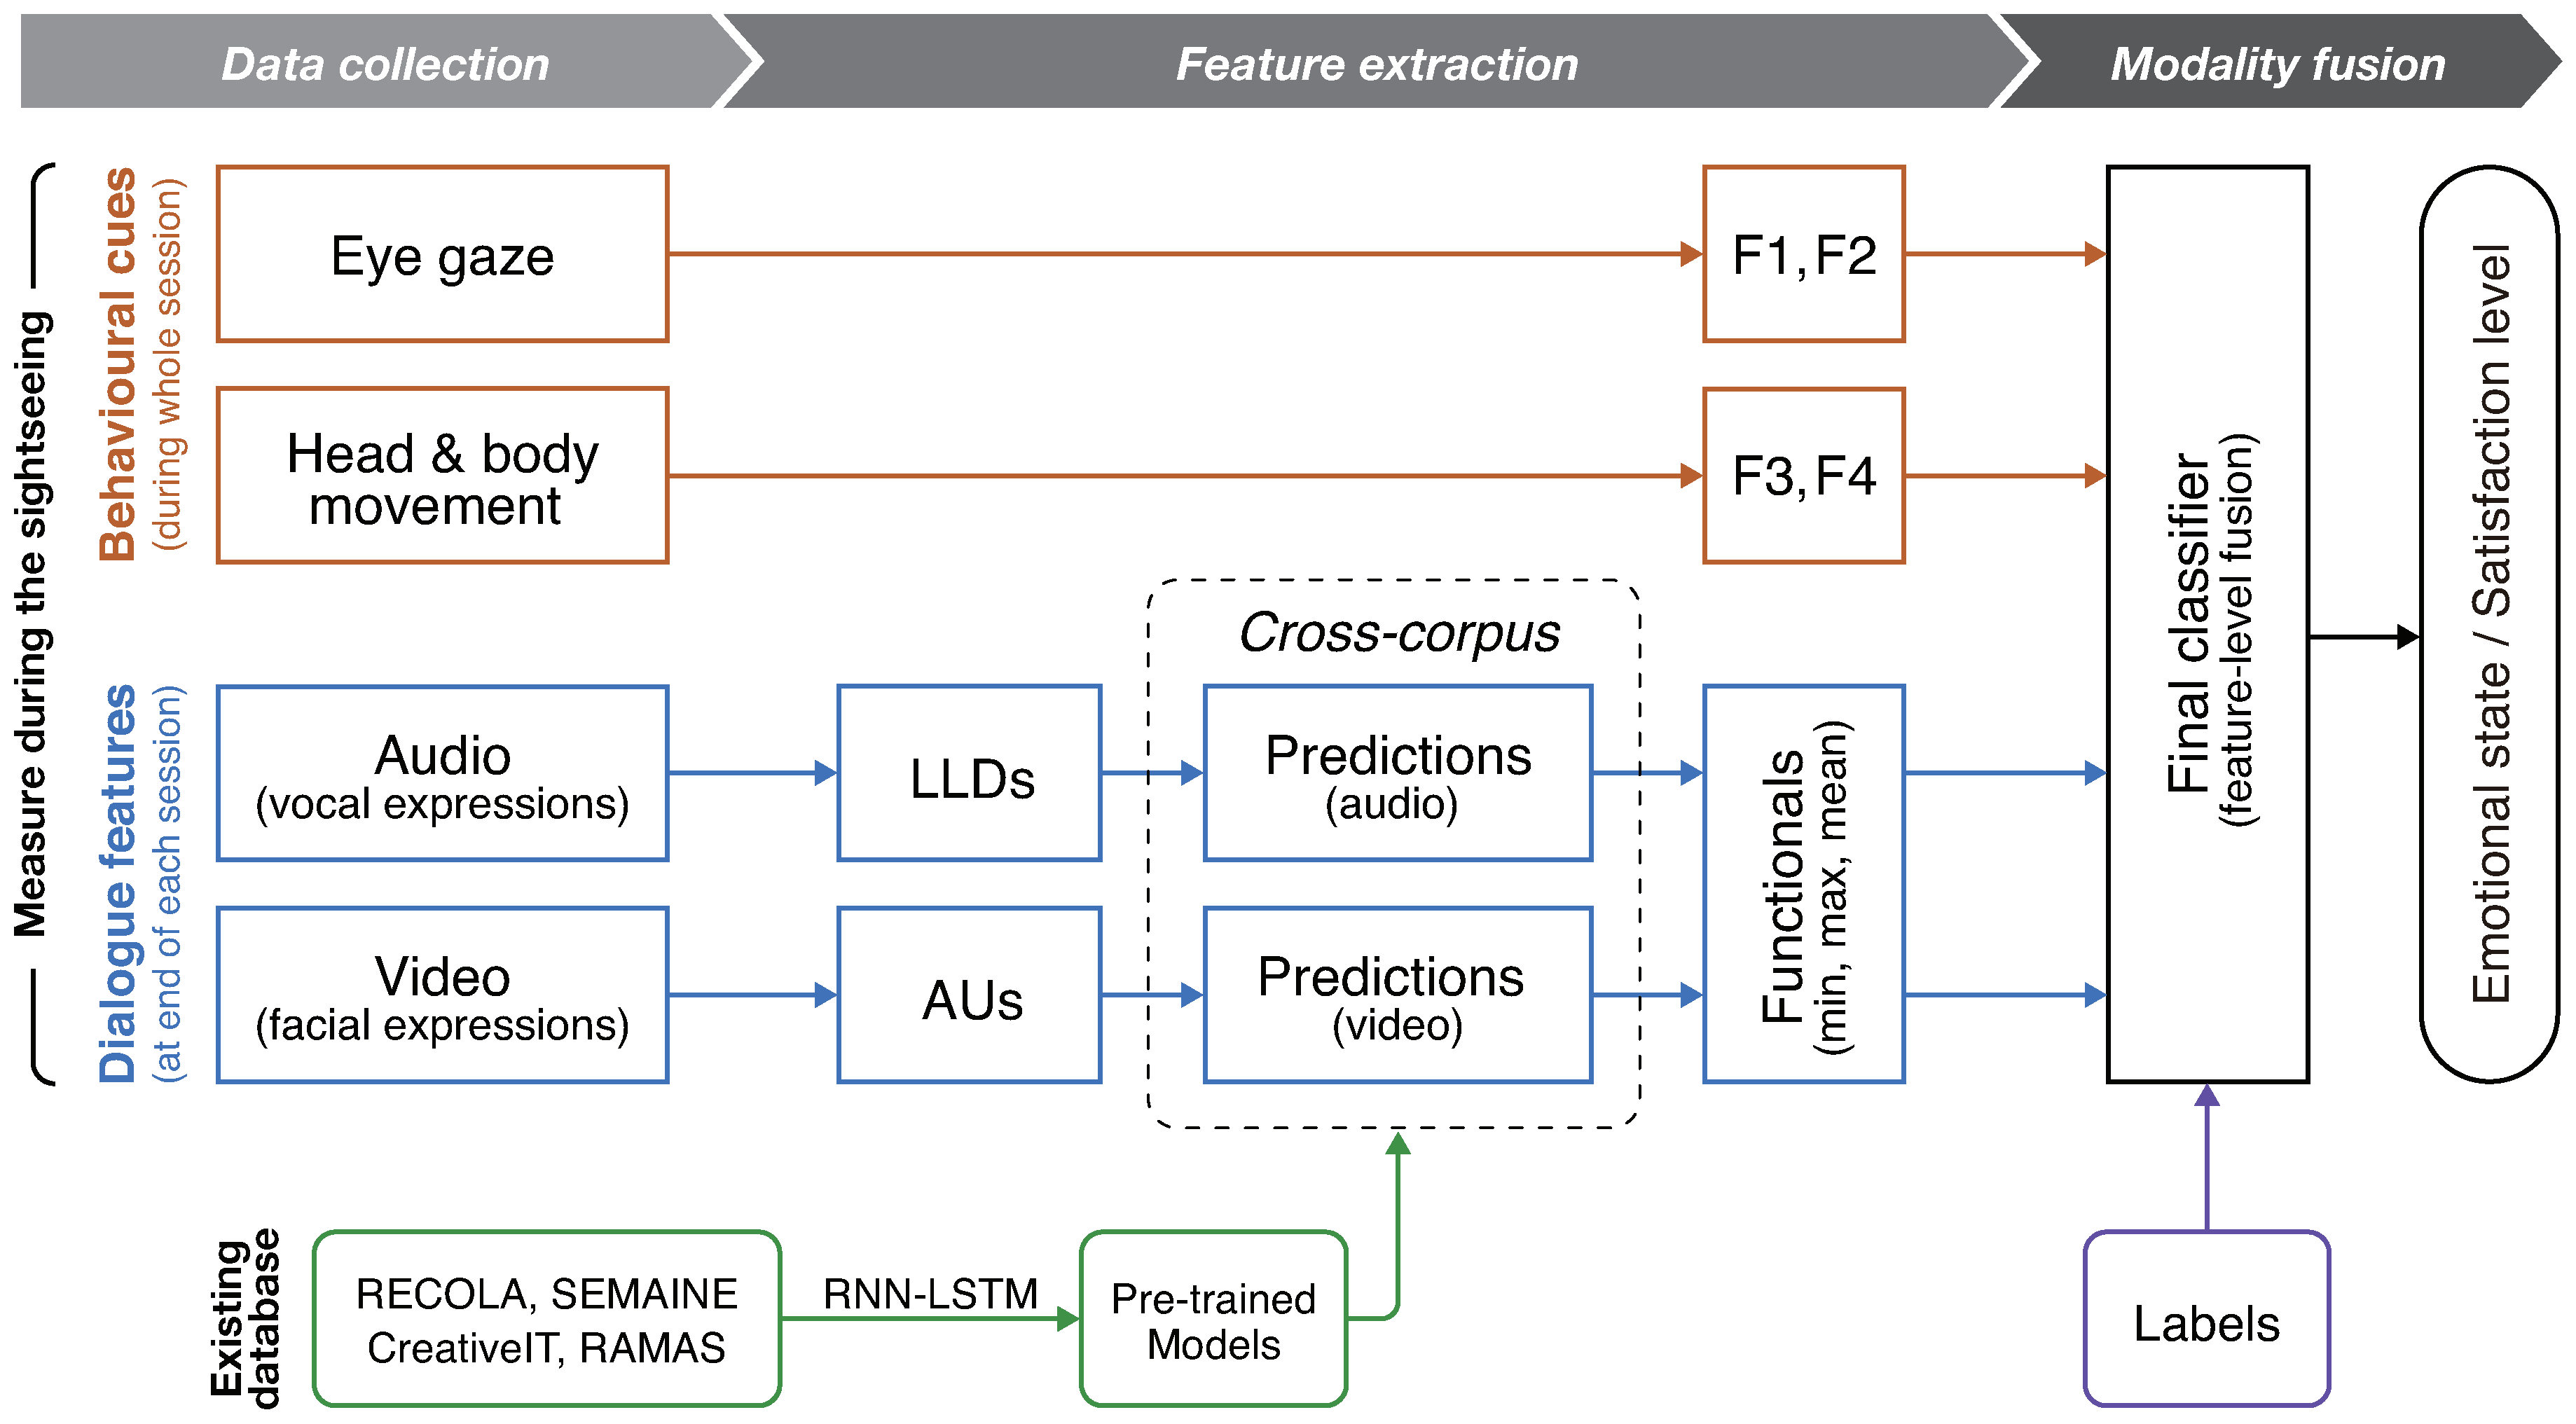
3.1. Modalities
3.2. Labels
- Emotional status
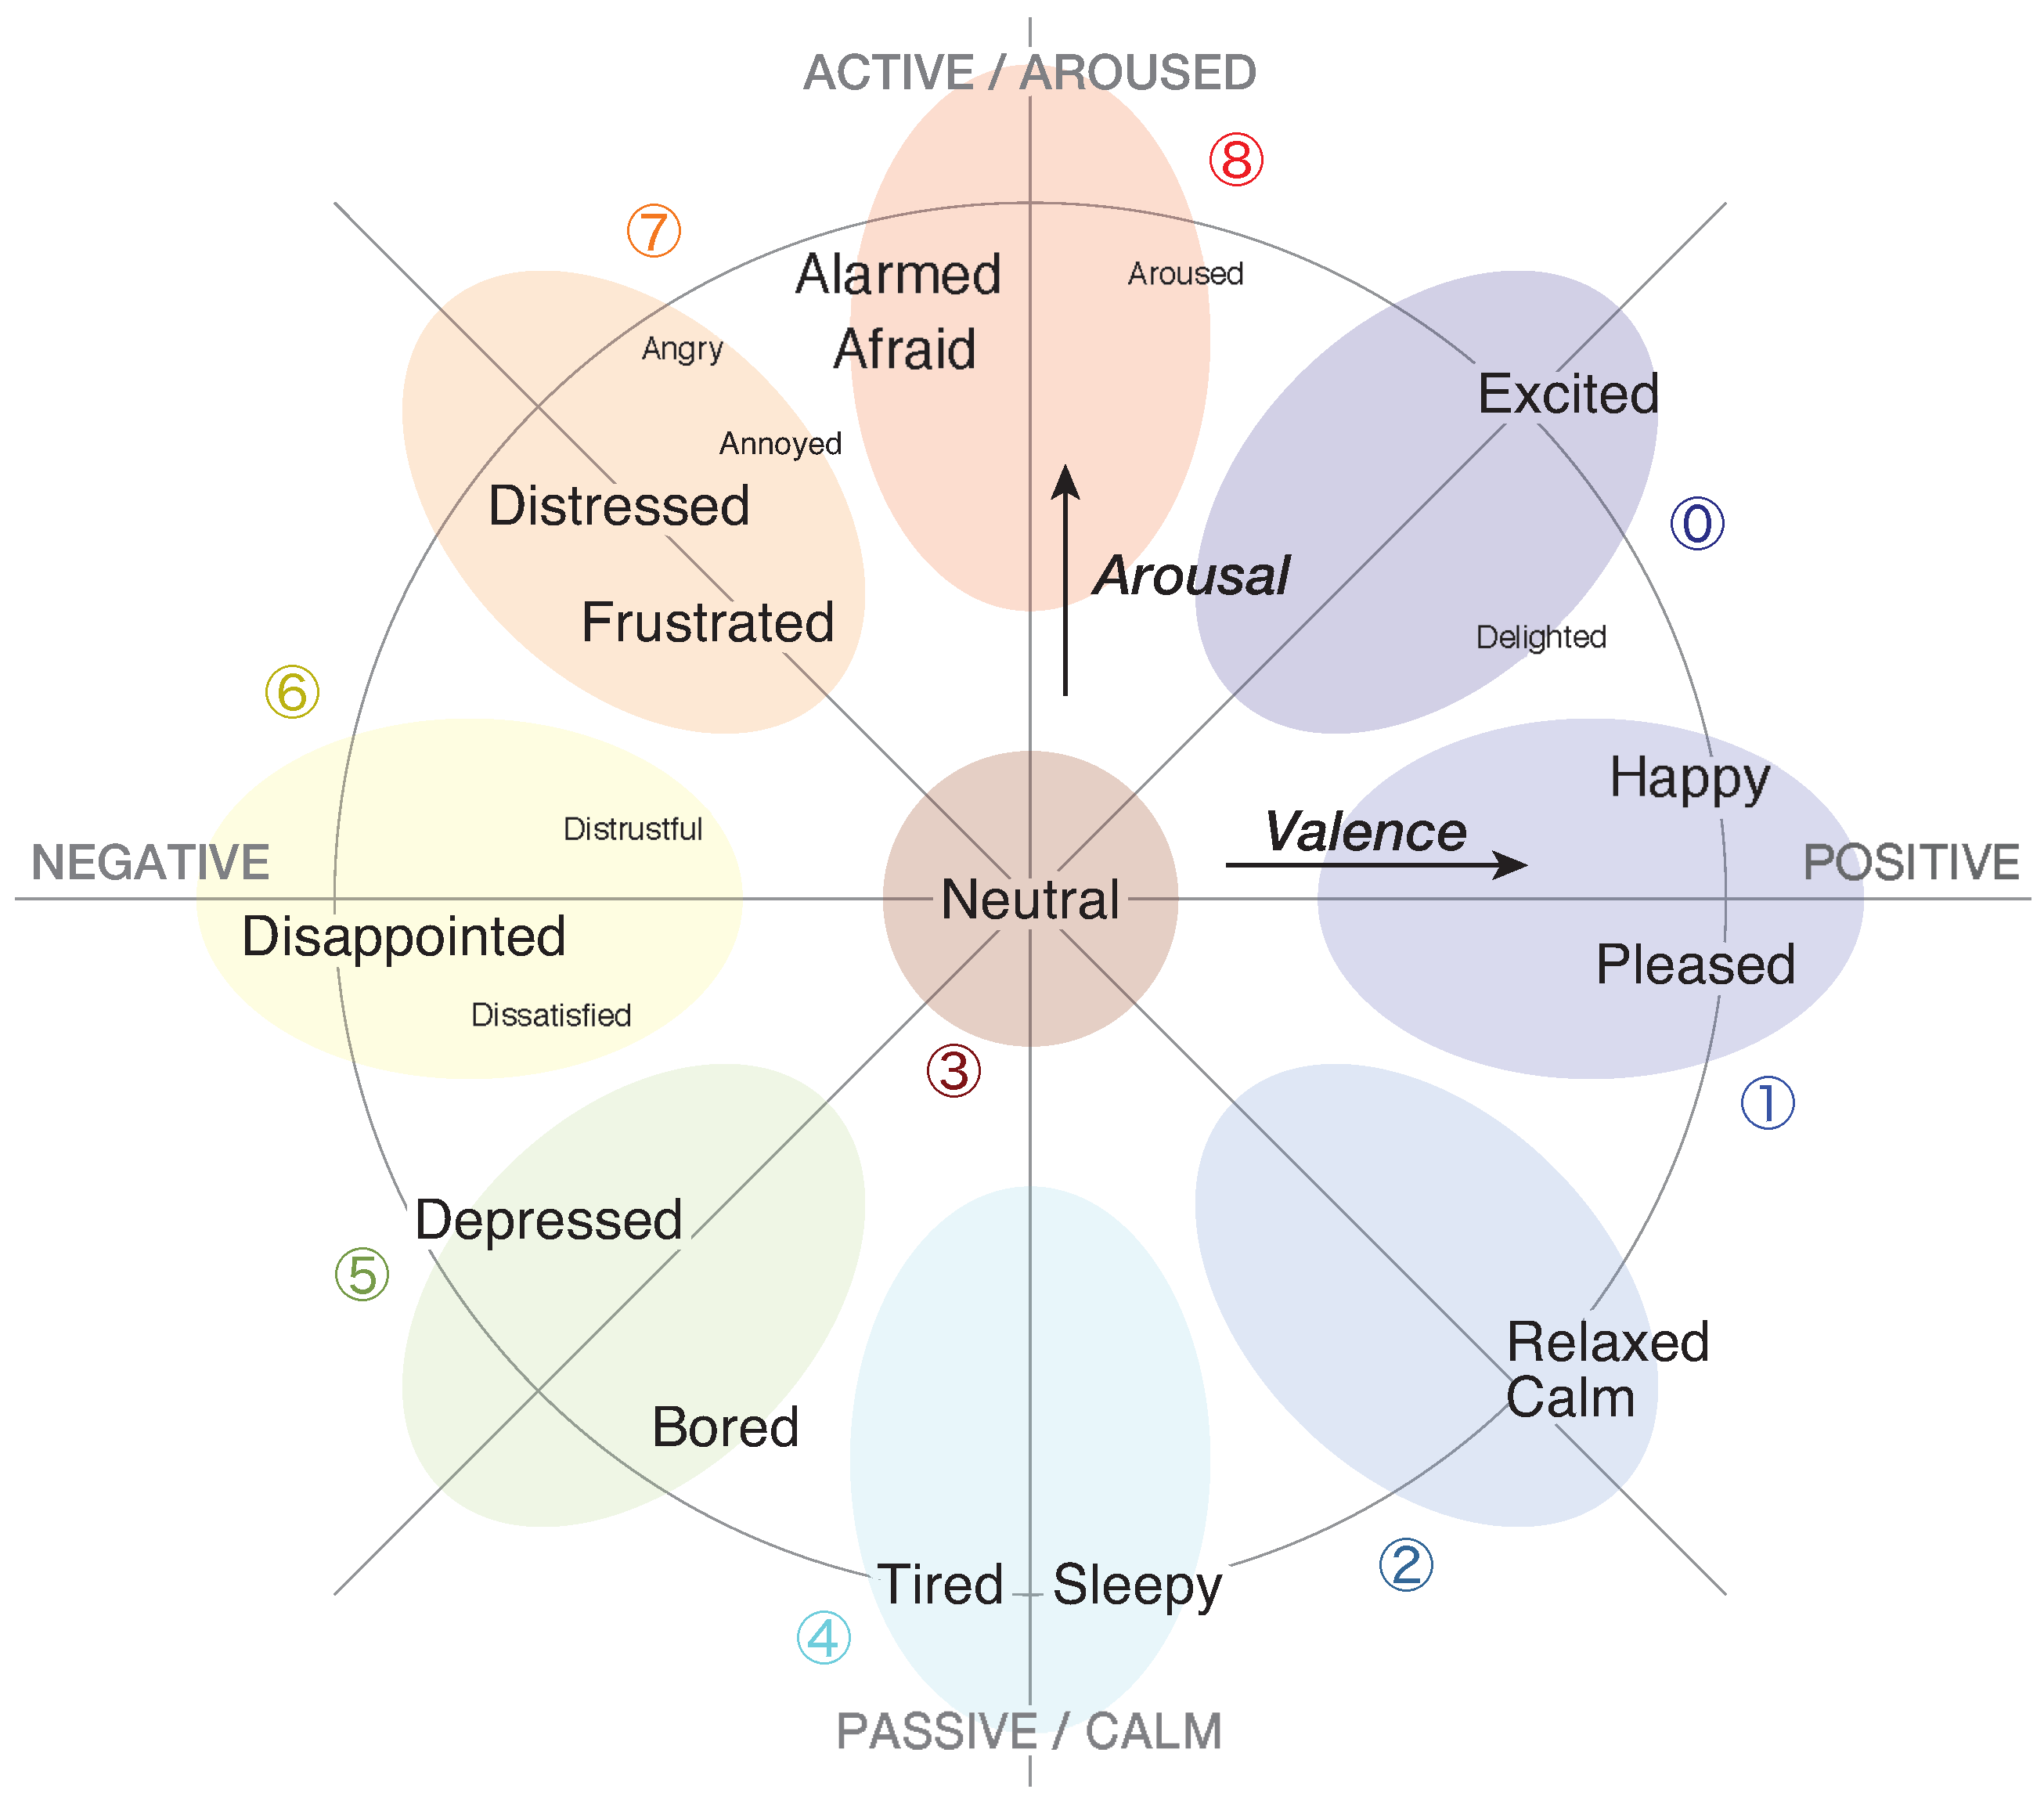
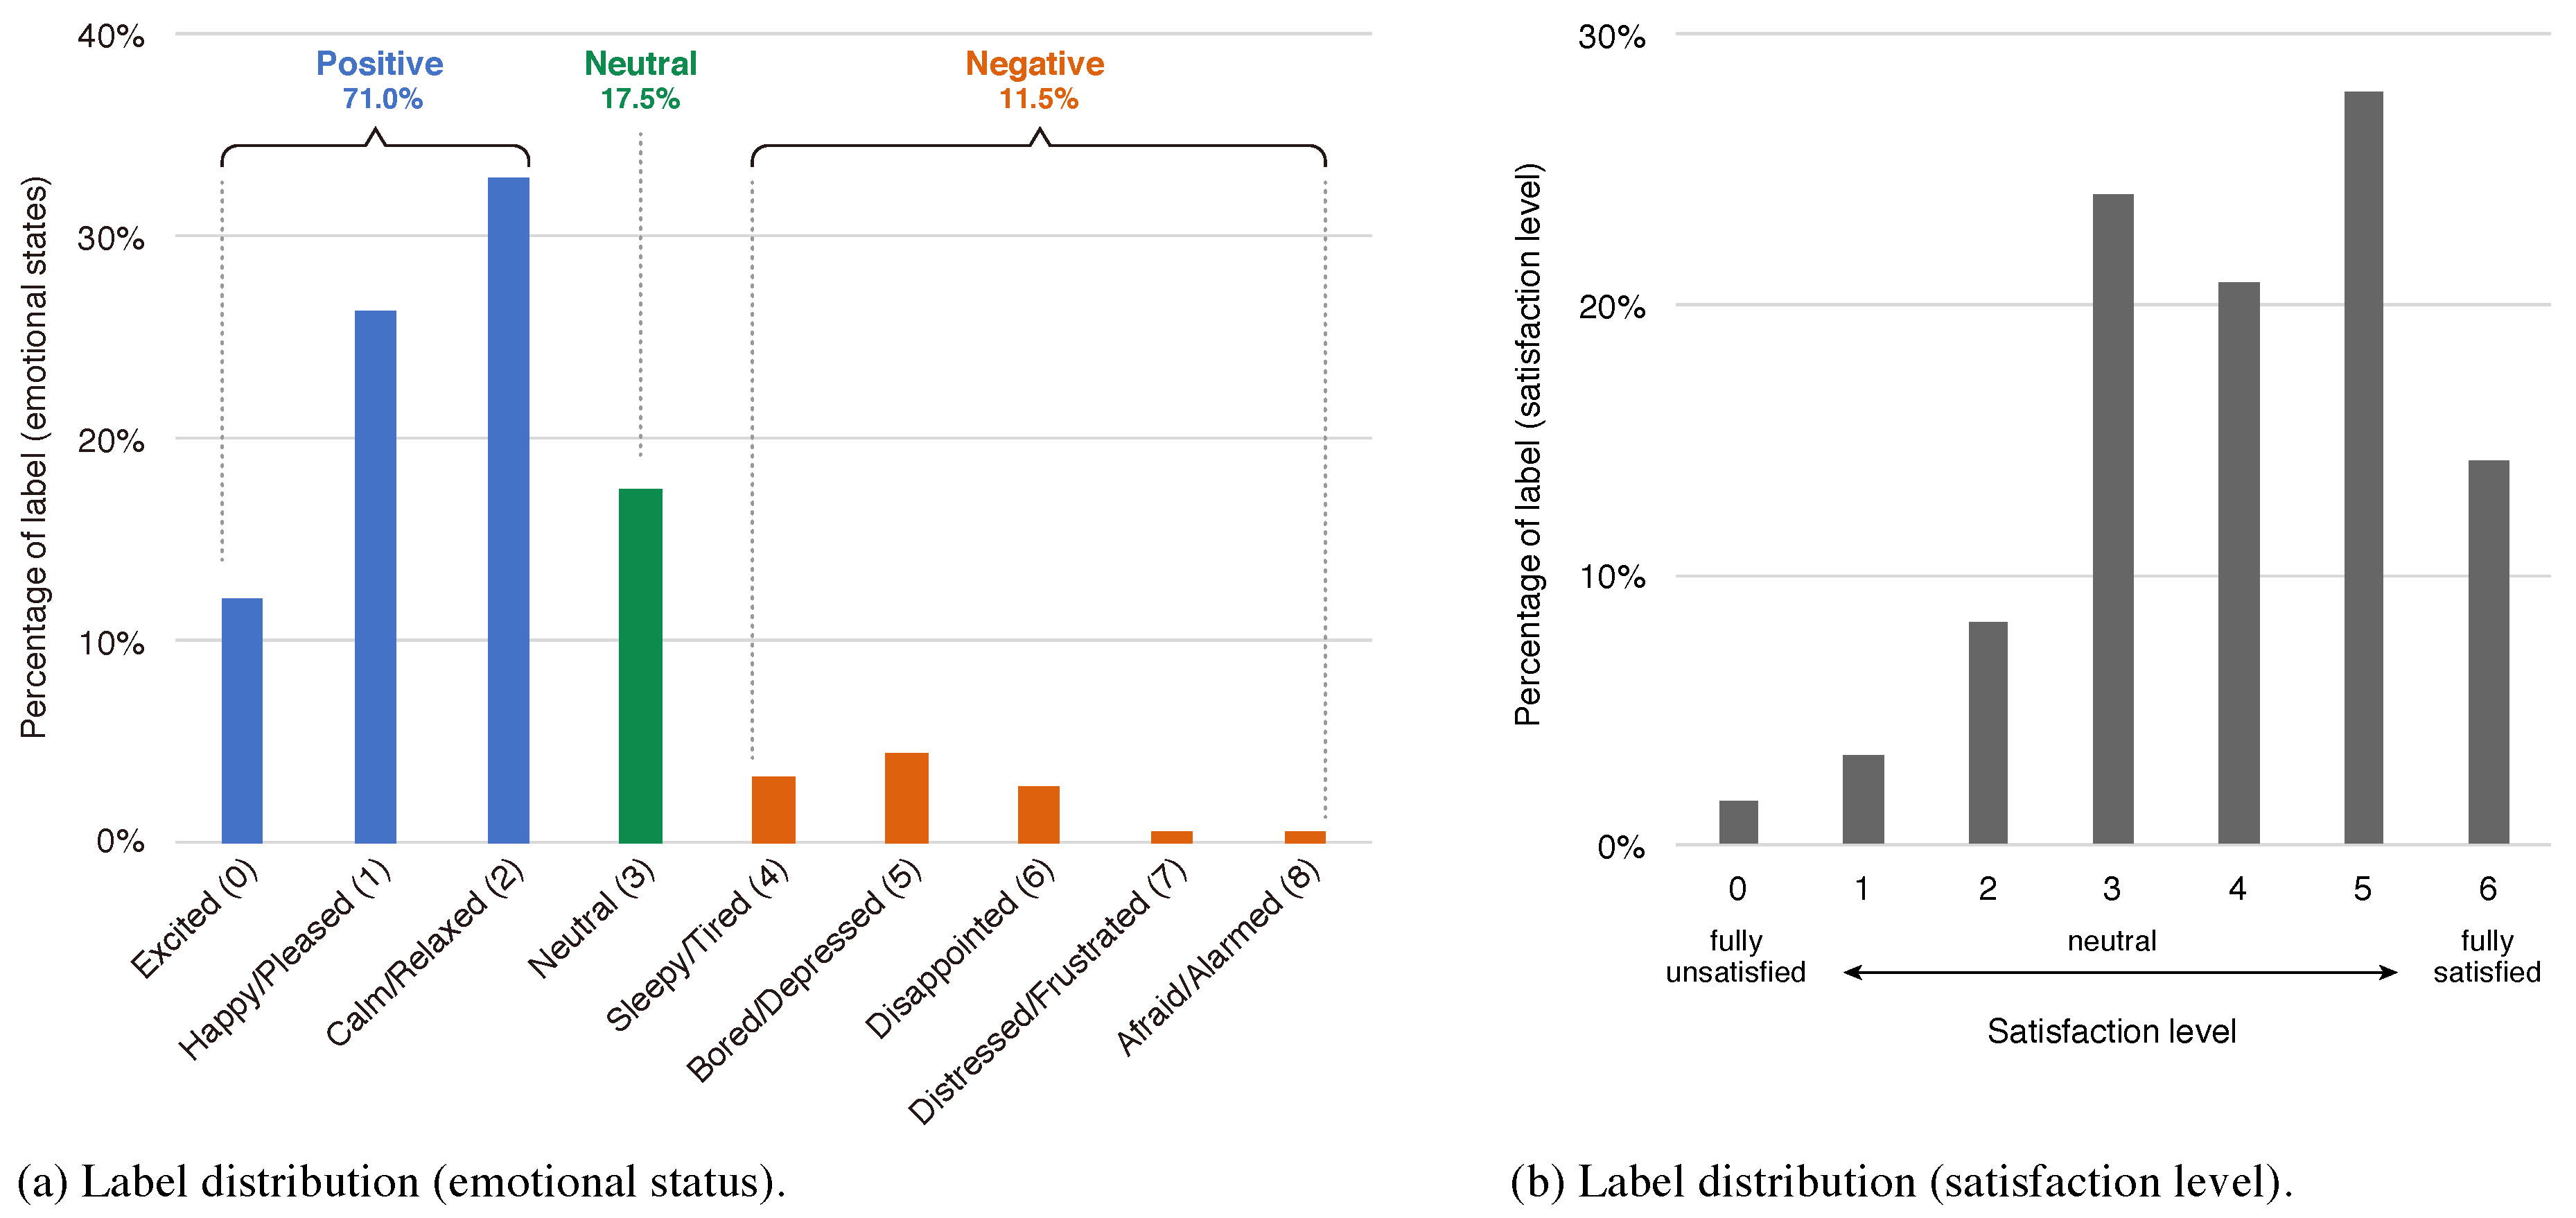
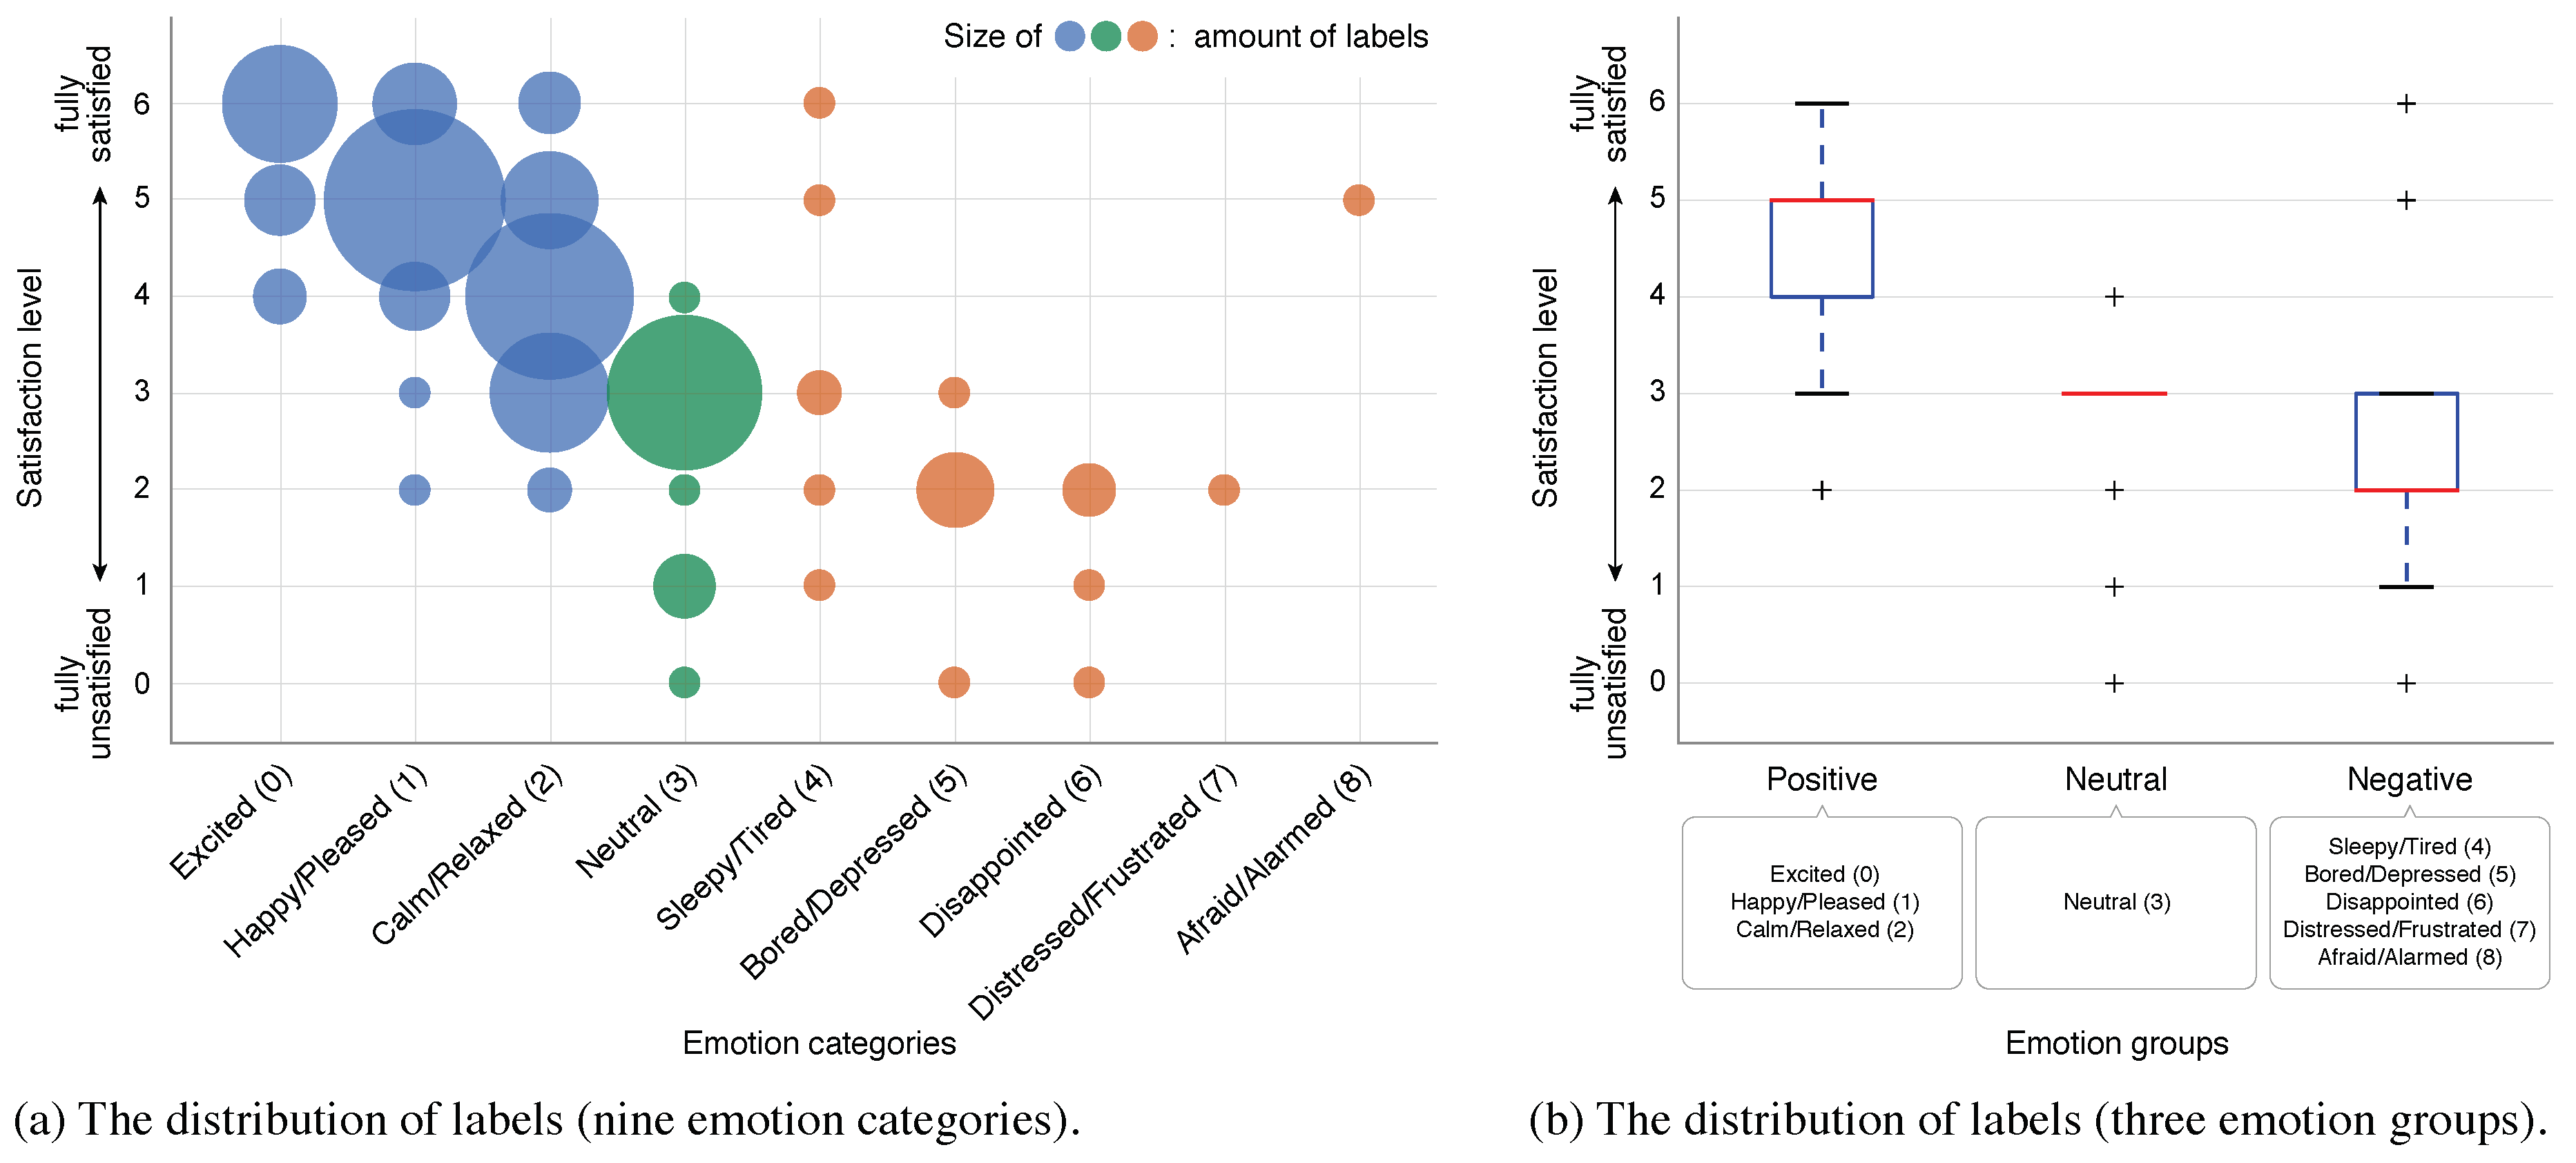
- To represent the emotional status of tourists, we adopted the two-dimensional map defined on Russell’s circumplex space model [34]. Figure 4 shows the representation of the emotional status. We divided this map into nine emotion categories and classified them into three emotion groups as follows:
- Positive
- : Excited (0), Happy/Pleased (1), Calm/Relaxed (2)
- Neutral
- : Neutral (3)
- Negative
- : Sleepy/Tired (4), Bored/Depressed (5), Disappointed (6),Distressed/Frustrated (7), Afraid/Alarmed (8)
- Satisfaction level
- To represent the satisfaction level of tourists, we used the Seven-Point Likert scale which the Japanese government (Ministry of Land, Infrastructure, Transport, and Tourism) uses as the official method. Tourists could choose their current satisfaction level between 0 (fully unsatisfied) and 6 (fully satisfied). A neutral satisfaction level is 3 and it should approximately represent the state of the participant at the beginning of the experiment.
4. Methodology of Tourist Emotion and Satisfaction Estimation
4.1. Preprocessing and Feature Extraction
4.1.1. Behavioral Cues—Eye-, Head-, and Body-Movement Features
- F1:
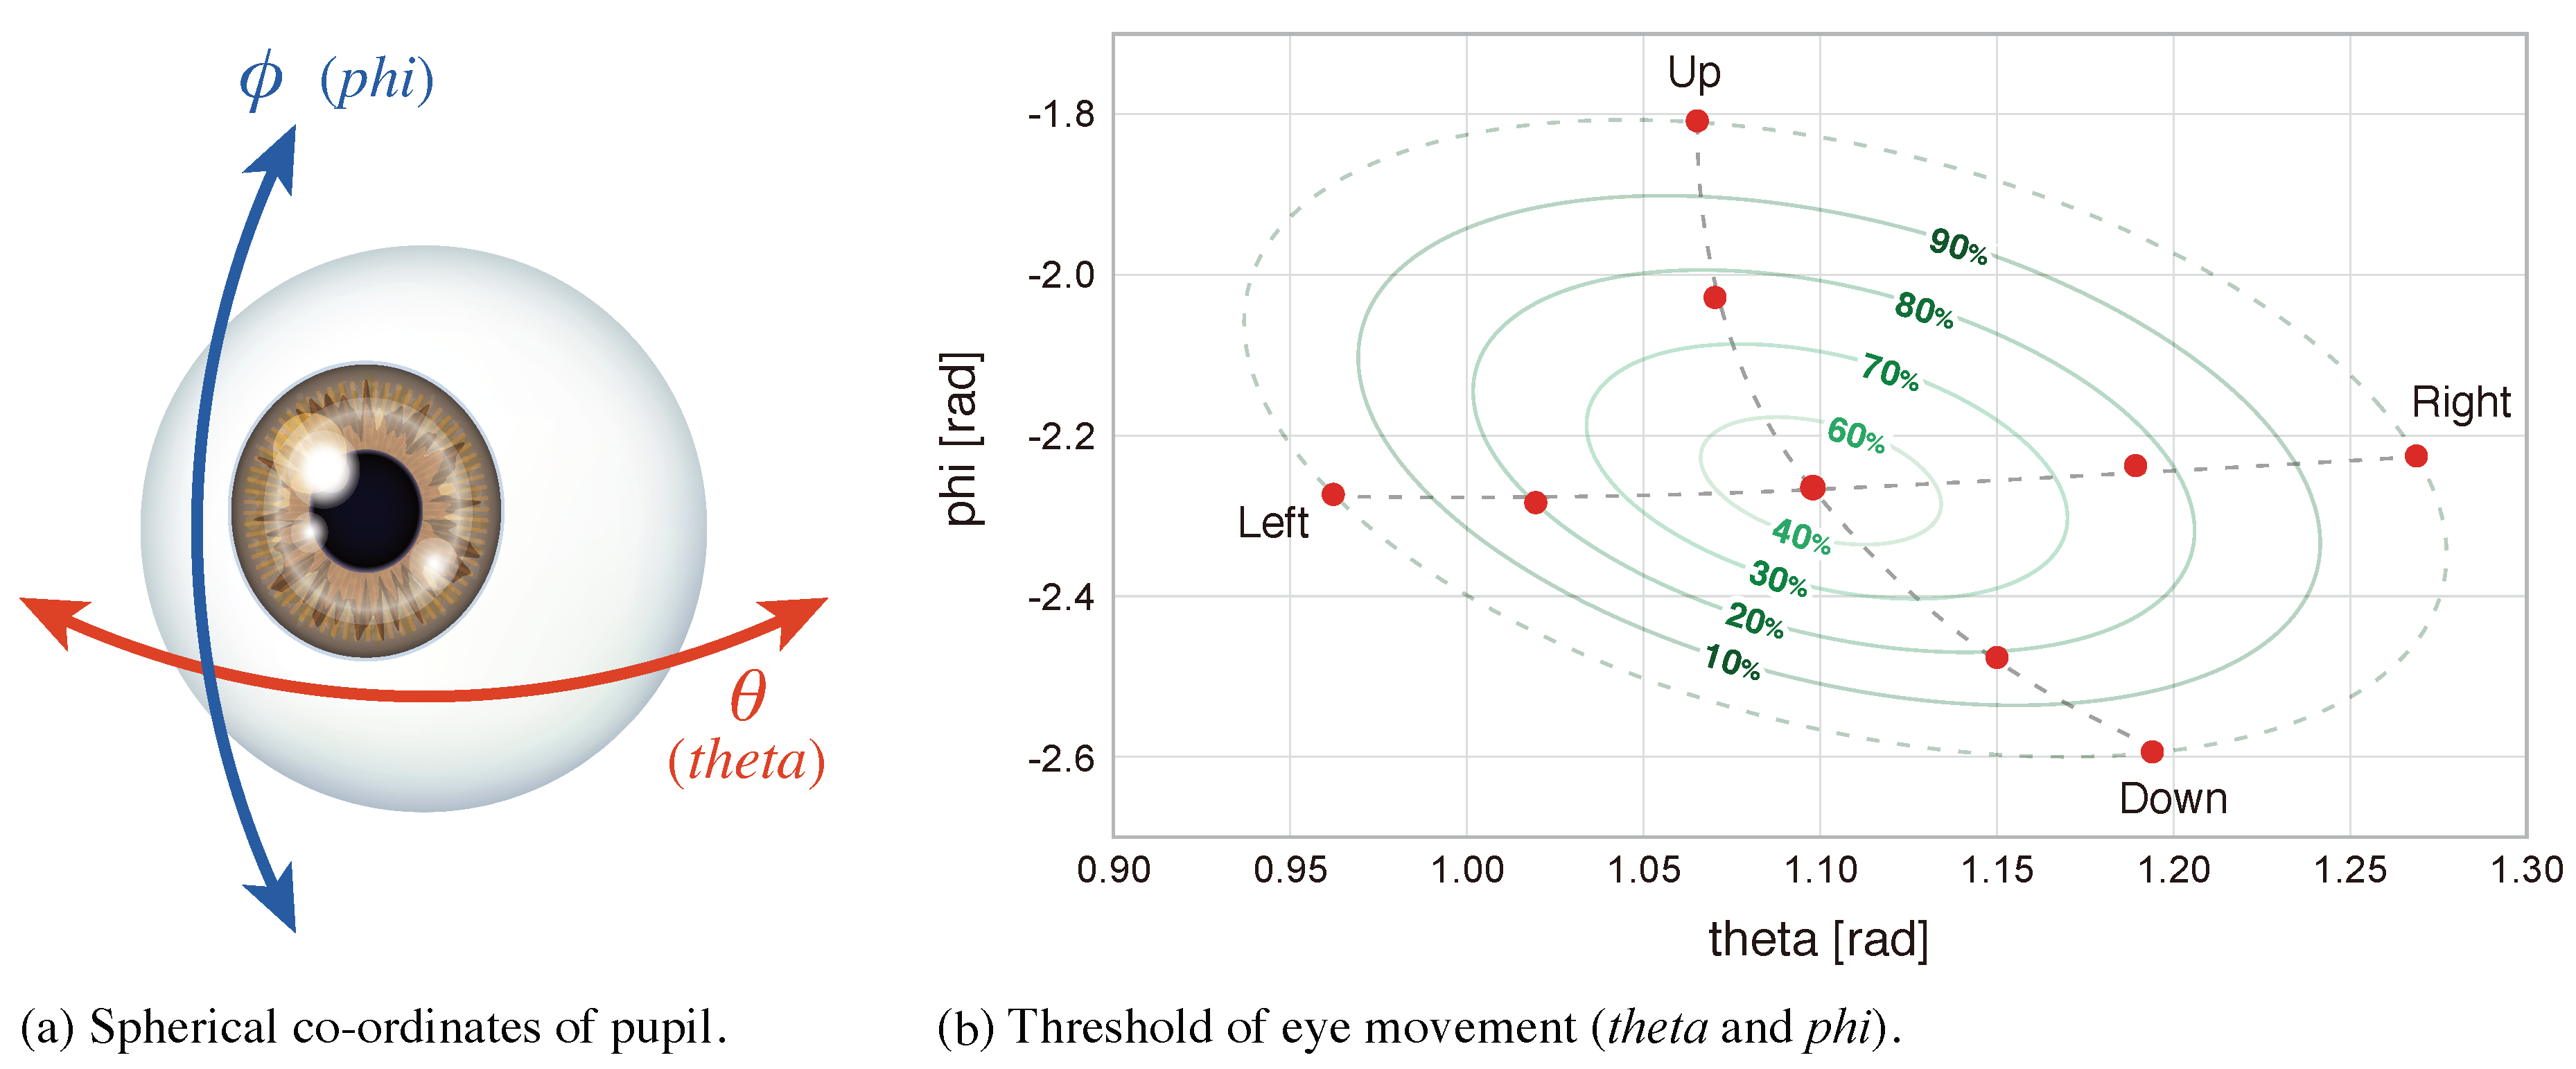
- Intensity of eye movementMinimum and maximum values for theta and phi were calculated for each participant; eight thresholds (10%–90%, 10% step, except 50%) were set for the range [min, max] as shown in Figure 6b, and then used to count the percentage of time outside each threshold per session. In total, 16 features were used.
- F2:
- Statistical features of eye movementAverage and standard deviation of theta and phi were calculated for a small window of recorded data and the values corresponding to the same session were averaged. The following window sizes were used: 1, 5, 10, 20, 60, 120, 180, and 240 s with the offset of of the window size. In total, 64 features were used.
- F3:
- Head movement (head tilt)As a head movement, head tilt was derived using gyroscope values. The average and the standard deviation of the gyroscope values were calculated for each participant. Then, the upper/lower thresholds were set with the following equations (Equations (1) and (2)). The parameter a represents the axis of the gyroscope.Finally, head tilt (looking up/down, right/left) was detected using threshold . In our condition, the Y-axis indicates a looking-up/down motion, and the Z-axis indicates a looking-left/right motion. Since the duration of each session was different, we converted these data to several features: head tilt per second; and average and standard deviation of the time interval looking at each direction. In total, 23 features were used.
- F4:
- Body movement (footsteps)Footsteps are analyzed with a method based on the approach of Ying et al. [36]. First, the noises of accelerometer values were removed by applying a Butterworth filter with 5 Hz cutoff frequency. Then, high-frequency components were emphasised through the differential processing shown in Equation (3). The parameter represents the accelerometer value at index n.Furthermore, the following integration process (Equation (4)) smoothed the accelerometer values, and small peaks of them were removed. In our condition, N was chosen to be 5 empirically. Since the sensor position was different from the original method in our condition, we used a modified parameter.Finally, footsteps were extracted by counting local maximum points. As features, we used footsteps per second, and average and standard deviation of a time interval for each step. In total, five features were used.
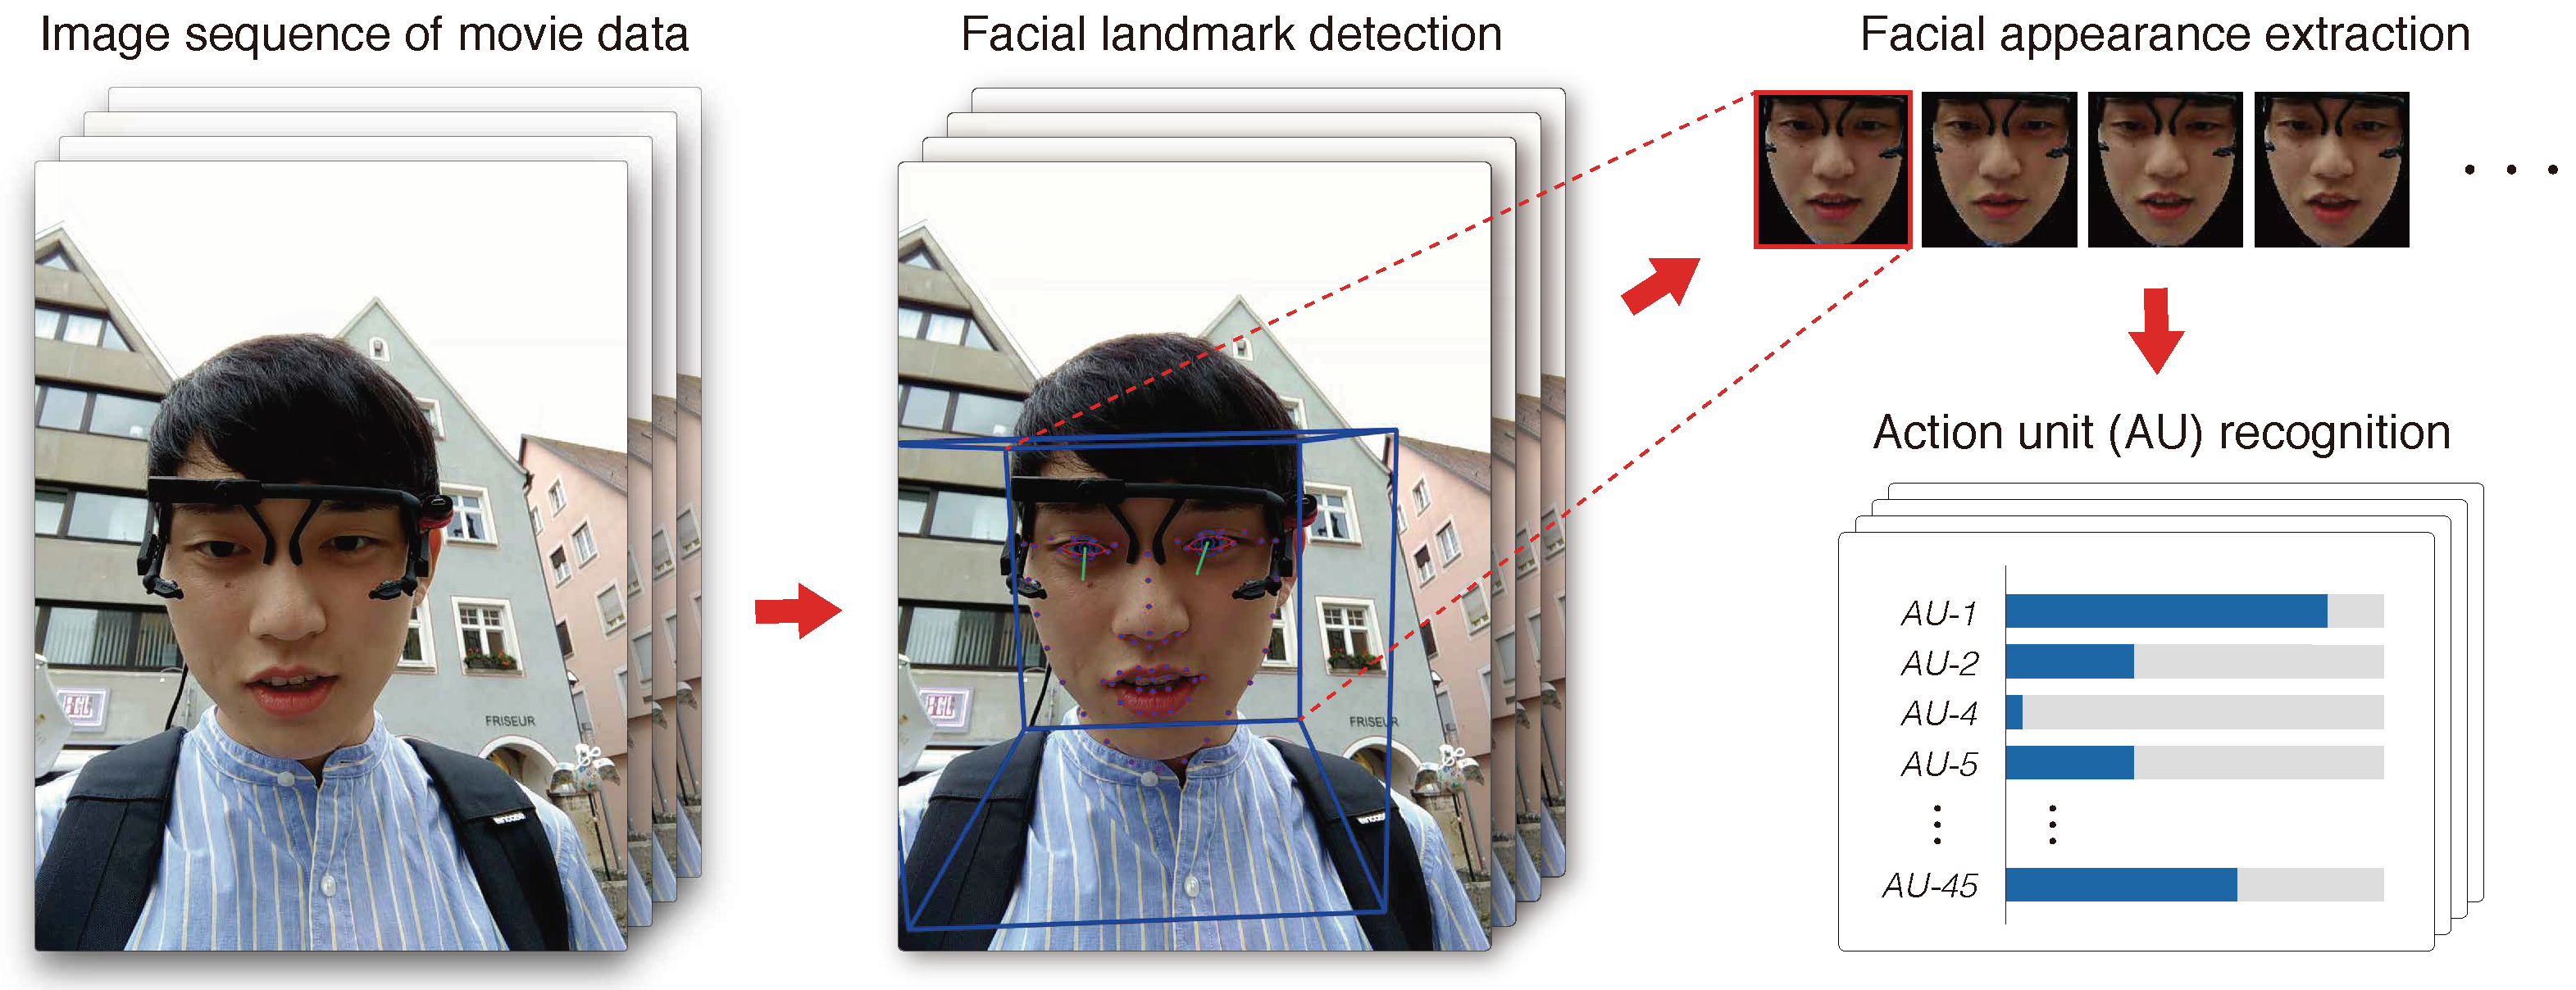
4.1.2. Audiovisual Data—Vocal and Facial Expressions
- Labels differ from those collected through our system in range and dimensions, i.e., they are on the arousal–valence scale instead of emotions for regression tasks, and an emotion set for a classification task does not match with ours.
- They are time-continuous, i.e., each value represents the emotional state for one frame of the audiovisual data, though we had one label per each session.
4.2. Modality Fusion
5. Experiments and Evaluation
5.1. Overview of Real-World Experiments
5.2. Results
6. Discussion and Limitations
6.1. Feasibility of Our Proposed System
6.2. Imbalance of Labels
6.3. Limitation of Data Sources
6.4. Future Perspectives
7. Conclusions
Author Contributions
Funding
Conflicts of Interest
References
- Alegre, J.; Garau, J. Tourist Satisfaction and Dissatisfaction. Ann. Tour. Res. 2010, 37, 52–73. [Google Scholar] [CrossRef]
- Chen, C.F.; Chen, F.S. Experience quality, perceived value, satisfaction and behavioral intentions for heritage tourists. Tour. Manag. 2010, 31, 29–35. [Google Scholar] [CrossRef]
- TripAdvisor. Available online: http://www.tripadvisor.com/ (accessed on 15 October 2018).
- Yelp. Available online: https://www.yelp.com/ (accessed on 15 October 2018).
- Amazon. Available online: https://www.amazon.com/ (accessed on 15 October 2018).
- Han, K.; Yu, D.; Tashev, I. Speech Emotion Recognition Using Deep Neural Network and Extreme Learning Machine. In Proceedings of the 15th Annual Conference of the International Speech Communication Association (InterSpeech ’14), Singapore, 14–18 September 2014. [Google Scholar]
- Kaya, H.; Karpov, A.A.; Salah, A.A. Robust Acoustic Emotion Recognition Based on Cascaded Normalization and Extreme Learning Machines. In Proceedings of the Advances in Neural Networks (ISNN ’16), St. Petersburg, Russia, 6–8 July 2016; pp. 115–123. [Google Scholar]
- Quck, W.Y.; Huang, D.Y.; Lin, W.; Li, H.; Dong, M. Mobile Acoustic Emotion Recognition. In Proceedings of the 2016 IEEE Region 10 Conference (TENCON ’16), Singapore, 22–25 November 2016; pp. 170–174. [Google Scholar]
- Tarnowski, P.; Kołodziej, M.; Majkowski, A.; Rak, R.J. Emotion recognition using facial expressions. Procedia Comput. Sci. 2017, 108, 1175–1184. [Google Scholar] [CrossRef]
- Tzirakis, P.; Trigeorgis, G.; Nicolaou, M.A.; Schuller, B.W.; Zafeiriou, S. End-to-End Multimodal Emotion Recognition Using Deep Neural Networks. IEEE J. Sel. Top. Signal Process. 2017, 11, 1301–1309. [Google Scholar] [CrossRef] [Green Version]
- Subramaniam, A.; Patel, V.; Mishra, A.; Balasubramanian, P.; Mittal, A. Bi-modal First Impressions Recognition Using Temporally Ordered Deep Audio and Stochastic Visual Features. In Proceedings of the 14th European Conference on Computer Vision (ECCV ’16) Workshops, Amsterdam, The Netherlands, 8–10 and 15–16 October 2016; pp. 337–348. [Google Scholar] [CrossRef]
- Ringeval, F.; Sonderegger, A.; Sauer, J.; Lalanne, D. Introducing the RECOLA multimodal corpus of remote collaborative and affective interactions. In Proceedings of the 2013 10th IEEE International Conference and Workshops on Automatic Face and Gesture Recognition (FG ’13), Shanghai, China, 22–26 April 2013; pp. 1–8. [Google Scholar] [CrossRef]
- Dhall, A.; Goecke, R.; Ghosh, S.; Joshi, J.; Hoey, J.; Gedeon, T. From Individual to Group-level Emotion Recognition: EmotiW 5.0. In Proceedings of the 19th ACM International Conference on Multimodal Interaction (ICMI ’17), Glasgow, UK, 13–17 November 2017; ACM: New York, NY, USA, 2017; pp. 524–528. [Google Scholar] [CrossRef]
- Sidorov, M.; Minker, W. Emotion Recognition in Real-world Conditions with Acoustic and Visual Features. In Proceedings of the 16th International Conference on Multimodal Interaction (ICMI ’14), Istanbul, Turkey, 12–16 November 2014; ACM: New York, NY, USA, 2014; pp. 521–524. [Google Scholar] [CrossRef]
- Hu, P.; Cai, D.; Wang, S.; Yao, A.; Chen, Y. Learning Supervised Scoring Ensemble for Emotion Recognition in the Wild. In Proceedings of the 19th ACM International Conference on Multimodal Interaction (ICMI ’17), Glasgow, UK, 13–17 November 2017; ACM: New York, NY, USA, 2017; pp. 553–560. [Google Scholar] [CrossRef]
- Shapsough, S.; Hesham, A.; Elkhorazaty, Y.; Zualkernan, I.A.; Aloul, F. Emotion recognition using mobile phones. In Proceedings of the 2016 IEEE 18th International Conference on e-Health Networking, Applications and Services (HealthCom ’16), Munich, Germany, 14–16 September 2016; pp. 1–6. [Google Scholar] [CrossRef]
- Resch, B.; Summa, A.; Sagl, G.; Zeile, P.; Exner, J.P. Urban Emotions—Geo-Semantic Emotion Extraction from Technical Sensors, Human Sensors and Crowdsourced Data. In Progress in Location-Based Services 2014; Springer: Cham, Switzerland, 2014; pp. 199–212. [Google Scholar]
- Petrantonakis, P.C.; Hadjileontiadis, L.J. Emotion Recognition from Brain Signals Using Hybrid Adaptive Filtering and Higher Order Crossings Analysis. IEEE Trans. Affect. Comput. 2010, 1, 81–97. [Google Scholar] [CrossRef]
- Lin, Y.; Wang, C.; Wu, T.; Jeng, S.; Chen, J. EEG-based emotion recognition in music listening: A comparison of schemes for multiclass support vector machine. In Proceedings of the 2009 IEEE International Conference on Acoustics, Speech and Signal Processing (ICASSP ’09), Taipei, Taiwan, 19–24 April 2009; pp. 489–492. [Google Scholar] [CrossRef]
- Ringeval, F.; Eyben, F.; Kroupi, E.; Yuce, A.; Thiran, J.P.; Ebrahimi, T.; Lalanne, D.; Schuller, B.W. Prediction of Asynchronous Dimensional Emotion Ratings from Audiovisual and Physiological Data. Pattern Recognit. Lett. 2015, 66, 22–30. [Google Scholar] [CrossRef]
- AlHanai, T.W.; Ghassemi, M.M. Predicting Latent Narrative Mood Using Audio and Physiologic Data. In Proceedings of the Thirty-First AAAI Conference on Artificial Intelligence (AAAI ’17), San Francisco, CA, USA, 4–9 February 2017; pp. 948–954. [Google Scholar]
- Zheng, W.L.; Dong, B.N.; Lu, B.L. Multimodal emotion recognition using EEG and eye tracking data. In Proceedings of the 2014 36th Annual International Conference of the IEEE Engineering in Medicine and Biology Society (EMBC ’14), Chicago, IL, USA, 26–30 August 2014; pp. 5040–5043. [Google Scholar] [CrossRef]
- Soleymani, M.; Pantic, M.; Pun, T. Multimodal emotion recognition in response to videos. IEEE Trans. Affect. Comput. 2012, 3, 211–223. [Google Scholar] [CrossRef]
- Soleymani, M.; Asghari-Esfeden, S.; Fu, Y.; Pantic, M. Analysis of EEG Signals and Facial Expressions for Continuous Emotion Detection. IEEE Trans. Affect. Comput. 2016, 7, 17–28. [Google Scholar] [CrossRef]
- Kanjo, E.; Younis, E.M.; Sherkat, N. Towards unravelling the relationship between on-body, environmental and emotion data using sensor information fusion approach. Inf. Fus. 2018, 40, 18–31. [Google Scholar] [CrossRef] [Green Version]
- Yamamoto, J.; Kawazoe, M.; Nakazawa, J.; Takashio, K.; Tokuda, H. MOLMOD: Analysis of feelings based on vital information for mood acquisition. In Proceedings of the 11th International Conference on Human-Computer Interaction with Mobile Devices and Services (MobileHCI ’09), Bonn, Germany, 15–18 September 2009; Volume 4. [Google Scholar]
- Fedotov, D.; Matsuda, Y.; Takahashi, Y.; Arakawa, Y.; Yasumoto, K.; Minker, W. Towards Estimating Emotions and Satisfaction Level of Tourist based on Eye Gaze and Head Movement. In Proceedings of the 2018 IEEE International Conference on Smart Computing (SMARTCOMP), Taormina, Italy, 18–20 June 2018; pp. 399–404. [Google Scholar] [CrossRef]
- Balandina, E.; Balandin, S.; Koucheryavy, Y.; Mouromtsev, D. IoT Use Cases in Healthcare and Tourism. In Proceedings of the 2015 IEEE 17th Conference on Business Informatics (CBI ’15), Lisbon, Portugal, 13–16 July 2015; Volume 2, pp. 37–44. [Google Scholar] [CrossRef]
- Morishita, S.; Maenaka, S.; Daichi, N.; Tamai, M.; Yasumoto, K.; Fukukura, T.; Sato, K. SakuraSensor: Quasi-Realtime Cherry-Lined Roads Detection through Participatory Video Sensing by Cars. In Proceedings of the 2015 ACM International Joint Conference on Pervasive and Ubiquitous Computing (UbiComp ’15), Osaka, Japan, 7–11 September 2015; pp. 695–705. [Google Scholar] [CrossRef]
- Wu, C.H.; Lin, J.C.; Wei, W.L. Survey on audiovisual emotion recognition: Databases, features, and data fusion strategies. APSIPA Trans. Signal Inf. Process. 2014, 3, E12. [Google Scholar] [CrossRef]
- Matsuda, Y.; Fedotov, D.; Takahashi, Y.; Arakawa, Y.; Yasumoto, K.; Minker, W. EmoTour: Multimodal Emotion Recognition using Physiological and Audio-Visual Features. In Proceedings of the Ubiquitous Emotion Recognition with Multimodal Mobile Interfaces (UERMMI), Singapore, 8 October 2018. [Google Scholar]
- Kassner, M.; Patera, W.; Bulling, A. Pupil: An Open Source Platform for Pervasive Eye Tracking and Mobile Gaze-based Interaction. In Proceedings of the 2014 ACM International Joint Conference on Pervasive and Ubiquitous Computing: Adjunct Publication (UbiComp ’14 Adjunct), Seattle, WA, USA, 13–17 September 2014; pp. 1151–1160. [Google Scholar] [CrossRef]
- Nakamura, Y.; Arakawa, Y.; Kanehira, T.; Fujiwara, M.; Yasumoto, K. SenStick: Comprehensive Sensing Platform with an Ultra Tiny All-In-One Sensor Board for IoT Research. J. Sens. 2017, 2017. [Google Scholar] [CrossRef]
- Russell, J.A. A circumplex model of affect. J. Personal. Soc. Psychol. 1980, 39, 1161–1178. [Google Scholar] [CrossRef]
- Paltoglou, G.; Thelwall, M. Seeing Stars of Valence and Arousal in Blog Posts. IEEE Trans. Affect. Comput. 2013, 4, 116–123. [Google Scholar] [CrossRef]
- Ying, H.; Silex, C.; Schnitzer, A.; Leonhardt, S.; Schiek, M. Automatic Step Detection in the Accelerometer Signal. In Proceedings of the 4th International Workshop on Wearable and Implantable Body Sensor Networks (BSN ’07), Aachen, Germany, 26–28 March 2007; pp. 80–85. [Google Scholar] [CrossRef]
- Eyben, F.; Wöllmer, M.; Schuller, B.W. Opensmile: The munich versatile and fast open-source audio feature extractor. In Proceedings of the 18th ACM International Conference on Multimedia (MM ’10), Firenze, Italy, 25–29 October 2010; pp. 1459–1462. [Google Scholar] [CrossRef]
- Schuller, B.W.; Steidl, S.; Batliner, A.; Epps, J.; Eyben, F.; Ringeval, F.; Marchi, E.; Zhang, Y. The INTERSPEECH 2014 Computational Paralinguistics Challenge: Cognitive & Physical Load. In Proceedings of the 15th Annual Conference of the International Speech Communication Association (InterSpeech ’14), Singapore, 14–18 September 2014; pp. 427–431. [Google Scholar]
- Baltrušaitis, T. OpenFace. 2017. Available online: https://github.com/TadasBaltrusaitis/OpenFace (accessed on 15 October 2018).
- Baltrušaitis, T.; Robinson, P.; Morency, L.P. OpenFace: An open source facial behavior analysis toolkit. In Proceedings of the 2016 IEEE Winter Conference on Applications of Computer Vision (WACV ’16), Lake Placid, NY, USA, 7–10 March 2016; pp. 1–10. [Google Scholar] [CrossRef]
- Ekman, P.; Friesen, W.V. Manual for the Facial Action Coding System; Consulting Psychologists Press: Sunnyvale, CA, USA, 1978. [Google Scholar]
- Ekman, P.; Rosenberg, E.L. What the Face Reveals: Basic and Applied Studies of Spontaneous Expression Using the Facial Action Coding System (FACS); Oxford University Press: Oxford, UK, 1997. [Google Scholar]
- McKeown, G.; Valstar, M.; Cowie, R.; Pantic, M.; Schroder, M. The SEMAINE Database: Annotated Multimodal Records of Emotionally Colored Conversations Between a Person and a Limited Agent. IEEE Trans. Affect. Comput. 2012, 3, 5–17. [Google Scholar] [CrossRef] [Green Version]
- Metallinou, A.; Yang, Z.; Lee, C.C.; Busso, C.; Carnicke, S.; Narayanan, S. The USC CreativeIT Database of Multimodal Dyadic Interactions: From Speech and Full Body Motion Capture to Continuous Emotional Annotations. Lang. Resour. Eval. 2016, 50, 497–521. [Google Scholar] [CrossRef]
- Perepelkina, O.; Kazimirova, E.; Konstantinova, M. RAMAS: Russian Multimodal Corpus of Dyadic Interaction for Affective Computing. In Proceedings of the International Conference on Speech and Computer (SPECOM ’18), Leipzig, Germany, 18–22 September 2018; pp. 501–510. [Google Scholar]
- Fedotov, D.; Ivanko, D.; Sidorov, M.; Minker, W. Contextual Dependencies in Time-Continuous Multidimensional Affect Recognition. In Proceedings of the Eleventh International Conference on Language Resources and Evaluation (LREC ’18), Miyazaki, Japan, 7–12 May 2018; pp. 1220–1224. [Google Scholar]
- Tieleman, T.; Hinton, G. Lecture 6.5-RMSProp, COURSERA: Neural Networks for Machine Learning; Technical Report; University of Toronto: Toronto, ON, Canada, 2012. [Google Scholar]
- Stanley, J.T.; Zhang, X.; Fung, H.H.; Isaacowitz, D.M. Cultural differences in gaze and emotion recognition: Americans contrast more than Chinese. Emotion 2013, 13, 36–46. [Google Scholar] [CrossRef] [PubMed]
- Pragst, L.; Ultes, S.; Kraus, M.; Minker, W. Adaptive dialogue management in the kristina project for multicultural health care applications. In Proceedings of the 19th Workshop on the Semantics and Pragmatics of Dialogue (SEMDIAL ’15), Gothenburg, Sweden, 24–26 August 2015; pp. 202–203. [Google Scholar]
- Miehle, J.; Minker, W.; Ultes, S. What Causes the Differences in Communication Styles? A Multicultural Study on Directness and Elaborateness. In Proceedings of the Eleventh International Conference on Language Resources and Evaluation (LREC ’18), Miyazaki, Japan, 7–12 May 2018. [Google Scholar]
- Kanoh, S.; Ichi-nohe, S.; Shioya, S.; Inoue, K.; Kawashima, R. Development of an eyewear to measure eye and body movements. In Proceedings of the 2015 37th Annual International Conference of the IEEE Engineering in Medicine and Biology Society (EMBC ’15), Milano, Italy, 25–29 August 2015; pp. 2267–2270. [Google Scholar] [CrossRef]


| Modality | Emotion (Unweighted Average Recall: UAR) | Satisfaction (Mean Absolute Error: MAE) |
|---|---|---|
| Eye movement (F1, F2) | 0.401 | 1.238 |
| Head/body movement (F3, F4) | 0.434 | 1.230 |
| Behavioral cues (eye + head/body movement) | 0.458 | 1.265 |
| Audio (vocal expressions) | 0.386 | 1.208 |
| Video (facial expressions) | 0.411 | 1.198 |
| Audiovisual data (audio + video) | 0.414 | 1.194 |
| Feature-level fusion | 0.428 | 1.311 |
| Decision-level fusion | 0.484 | 1.110 |
| Modality | Emotion (UAR) | Satisfaction (MAE) | ||
|---|---|---|---|---|
| Japanese | Russian | Japanese | Russian | |
| Eye movement (F1, F2) | 0.438 | 0.426 | 1.045 | 1.345 |
| Head/body movement (F3, F4) | 0.417 | 0.438 | 1.314 | 1.290 |
| Behavioral cues (eye + head/body movement) | 0.415 | 0.576 | 1.099 | 1.347 |
| Audio (vocal expressions) | 0.447 | 0.372 | 1.093 | 1.304 |
| Video (facial expressions) | 0.463 | 0.346 | 1.100 | 1.300 |
| Audiovisual data (audio + video) | 0.445 | 0.417 | 1.067 | 1.300 |
| Feature-level fusion | 0.423 | 0.507 | 1.190 | 1.420 |
| Decision-level fusion | 0.473 | 0.496 | 1.000 | 1.157 |
© 2018 by the authors. Licensee MDPI, Basel, Switzerland. This article is an open access article distributed under the terms and conditions of the Creative Commons Attribution (CC BY) license (http://creativecommons.org/licenses/by/4.0/).
Share and Cite
Matsuda, Y.; Fedotov, D.; Takahashi, Y.; Arakawa, Y.; Yasumoto, K.; Minker, W. EmoTour: Estimating Emotion and Satisfaction of Users Based on Behavioral Cues and Audiovisual Data. Sensors 2018, 18, 3978. https://doi.org/10.3390/s18113978
Matsuda Y, Fedotov D, Takahashi Y, Arakawa Y, Yasumoto K, Minker W. EmoTour: Estimating Emotion and Satisfaction of Users Based on Behavioral Cues and Audiovisual Data. Sensors. 2018; 18(11):3978. https://doi.org/10.3390/s18113978
Chicago/Turabian StyleMatsuda, Yuki, Dmitrii Fedotov, Yuta Takahashi, Yutaka Arakawa, Keiichi Yasumoto, and Wolfgang Minker. 2018. "EmoTour: Estimating Emotion and Satisfaction of Users Based on Behavioral Cues and Audiovisual Data" Sensors 18, no. 11: 3978. https://doi.org/10.3390/s18113978
APA StyleMatsuda, Y., Fedotov, D., Takahashi, Y., Arakawa, Y., Yasumoto, K., & Minker, W. (2018). EmoTour: Estimating Emotion and Satisfaction of Users Based on Behavioral Cues and Audiovisual Data. Sensors, 18(11), 3978. https://doi.org/10.3390/s18113978