Dynamic Balance Measurement and Quantitative Assessment Using Wearable Plantar-Pressure Insoles in a Pose-Sensed Virtual Environment

 ,
, 
Abstract
:1. Introduction
2. Methods
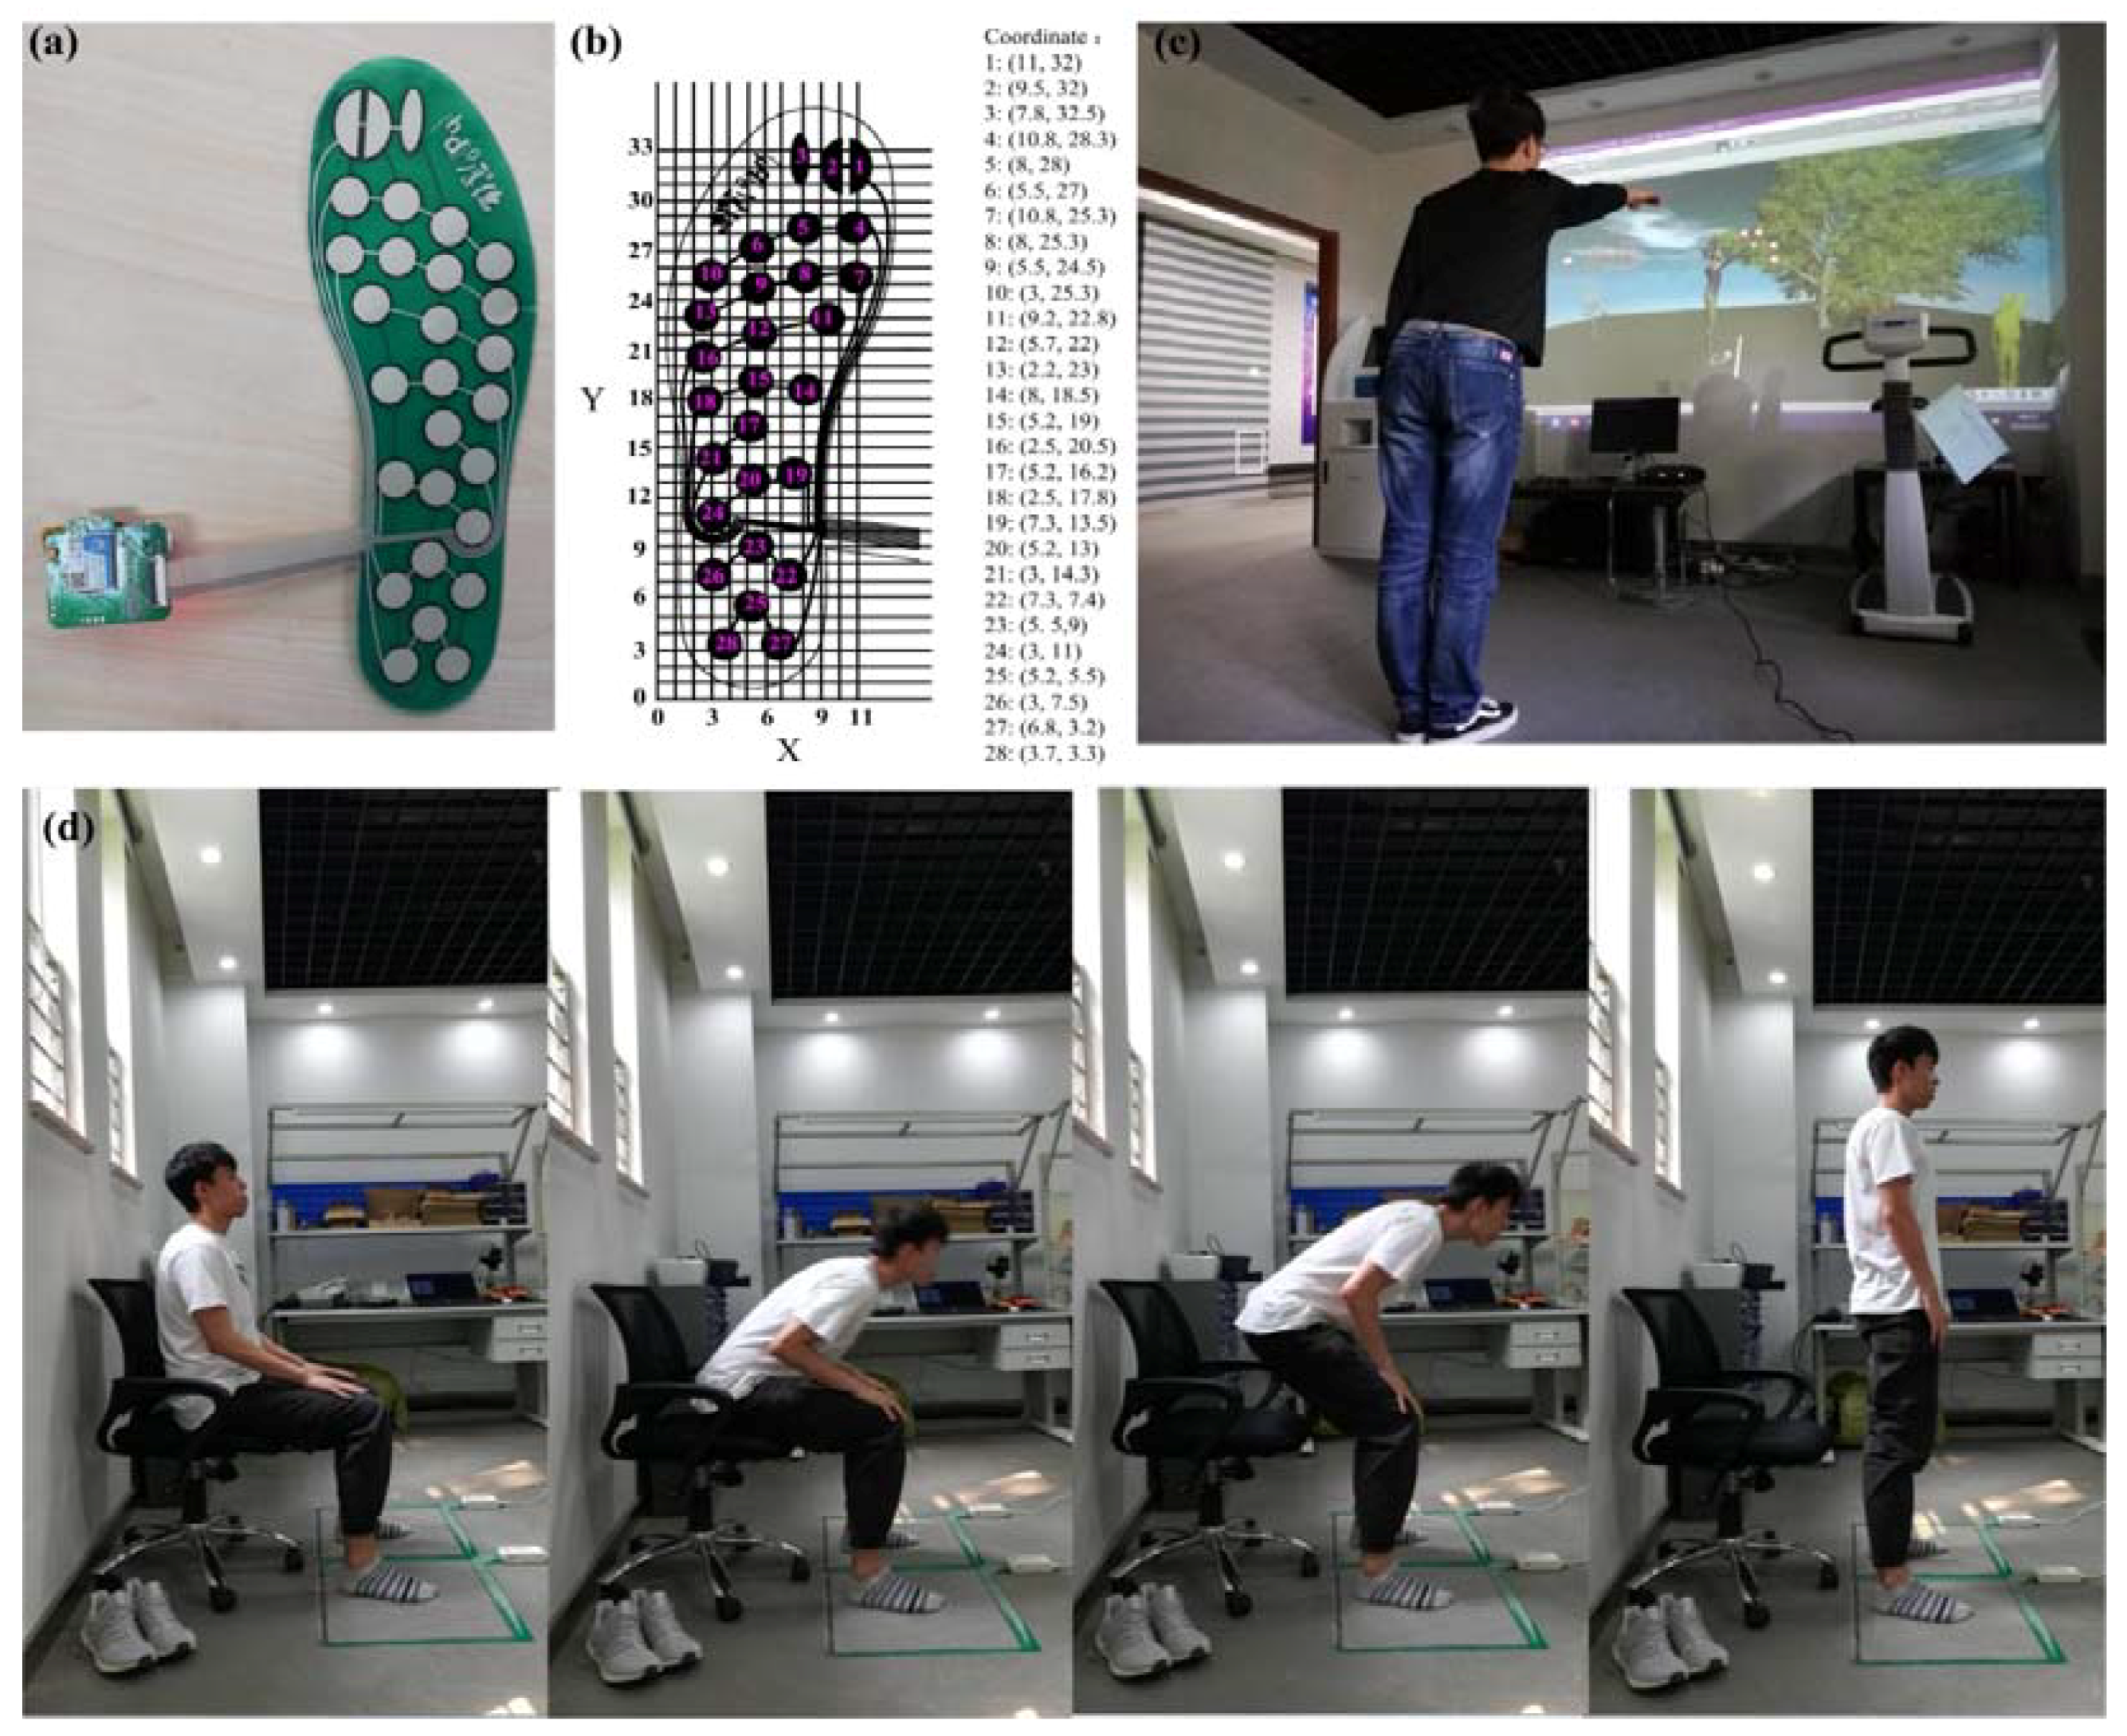
2.1. Experiment System
2.2. Experiment Procedure
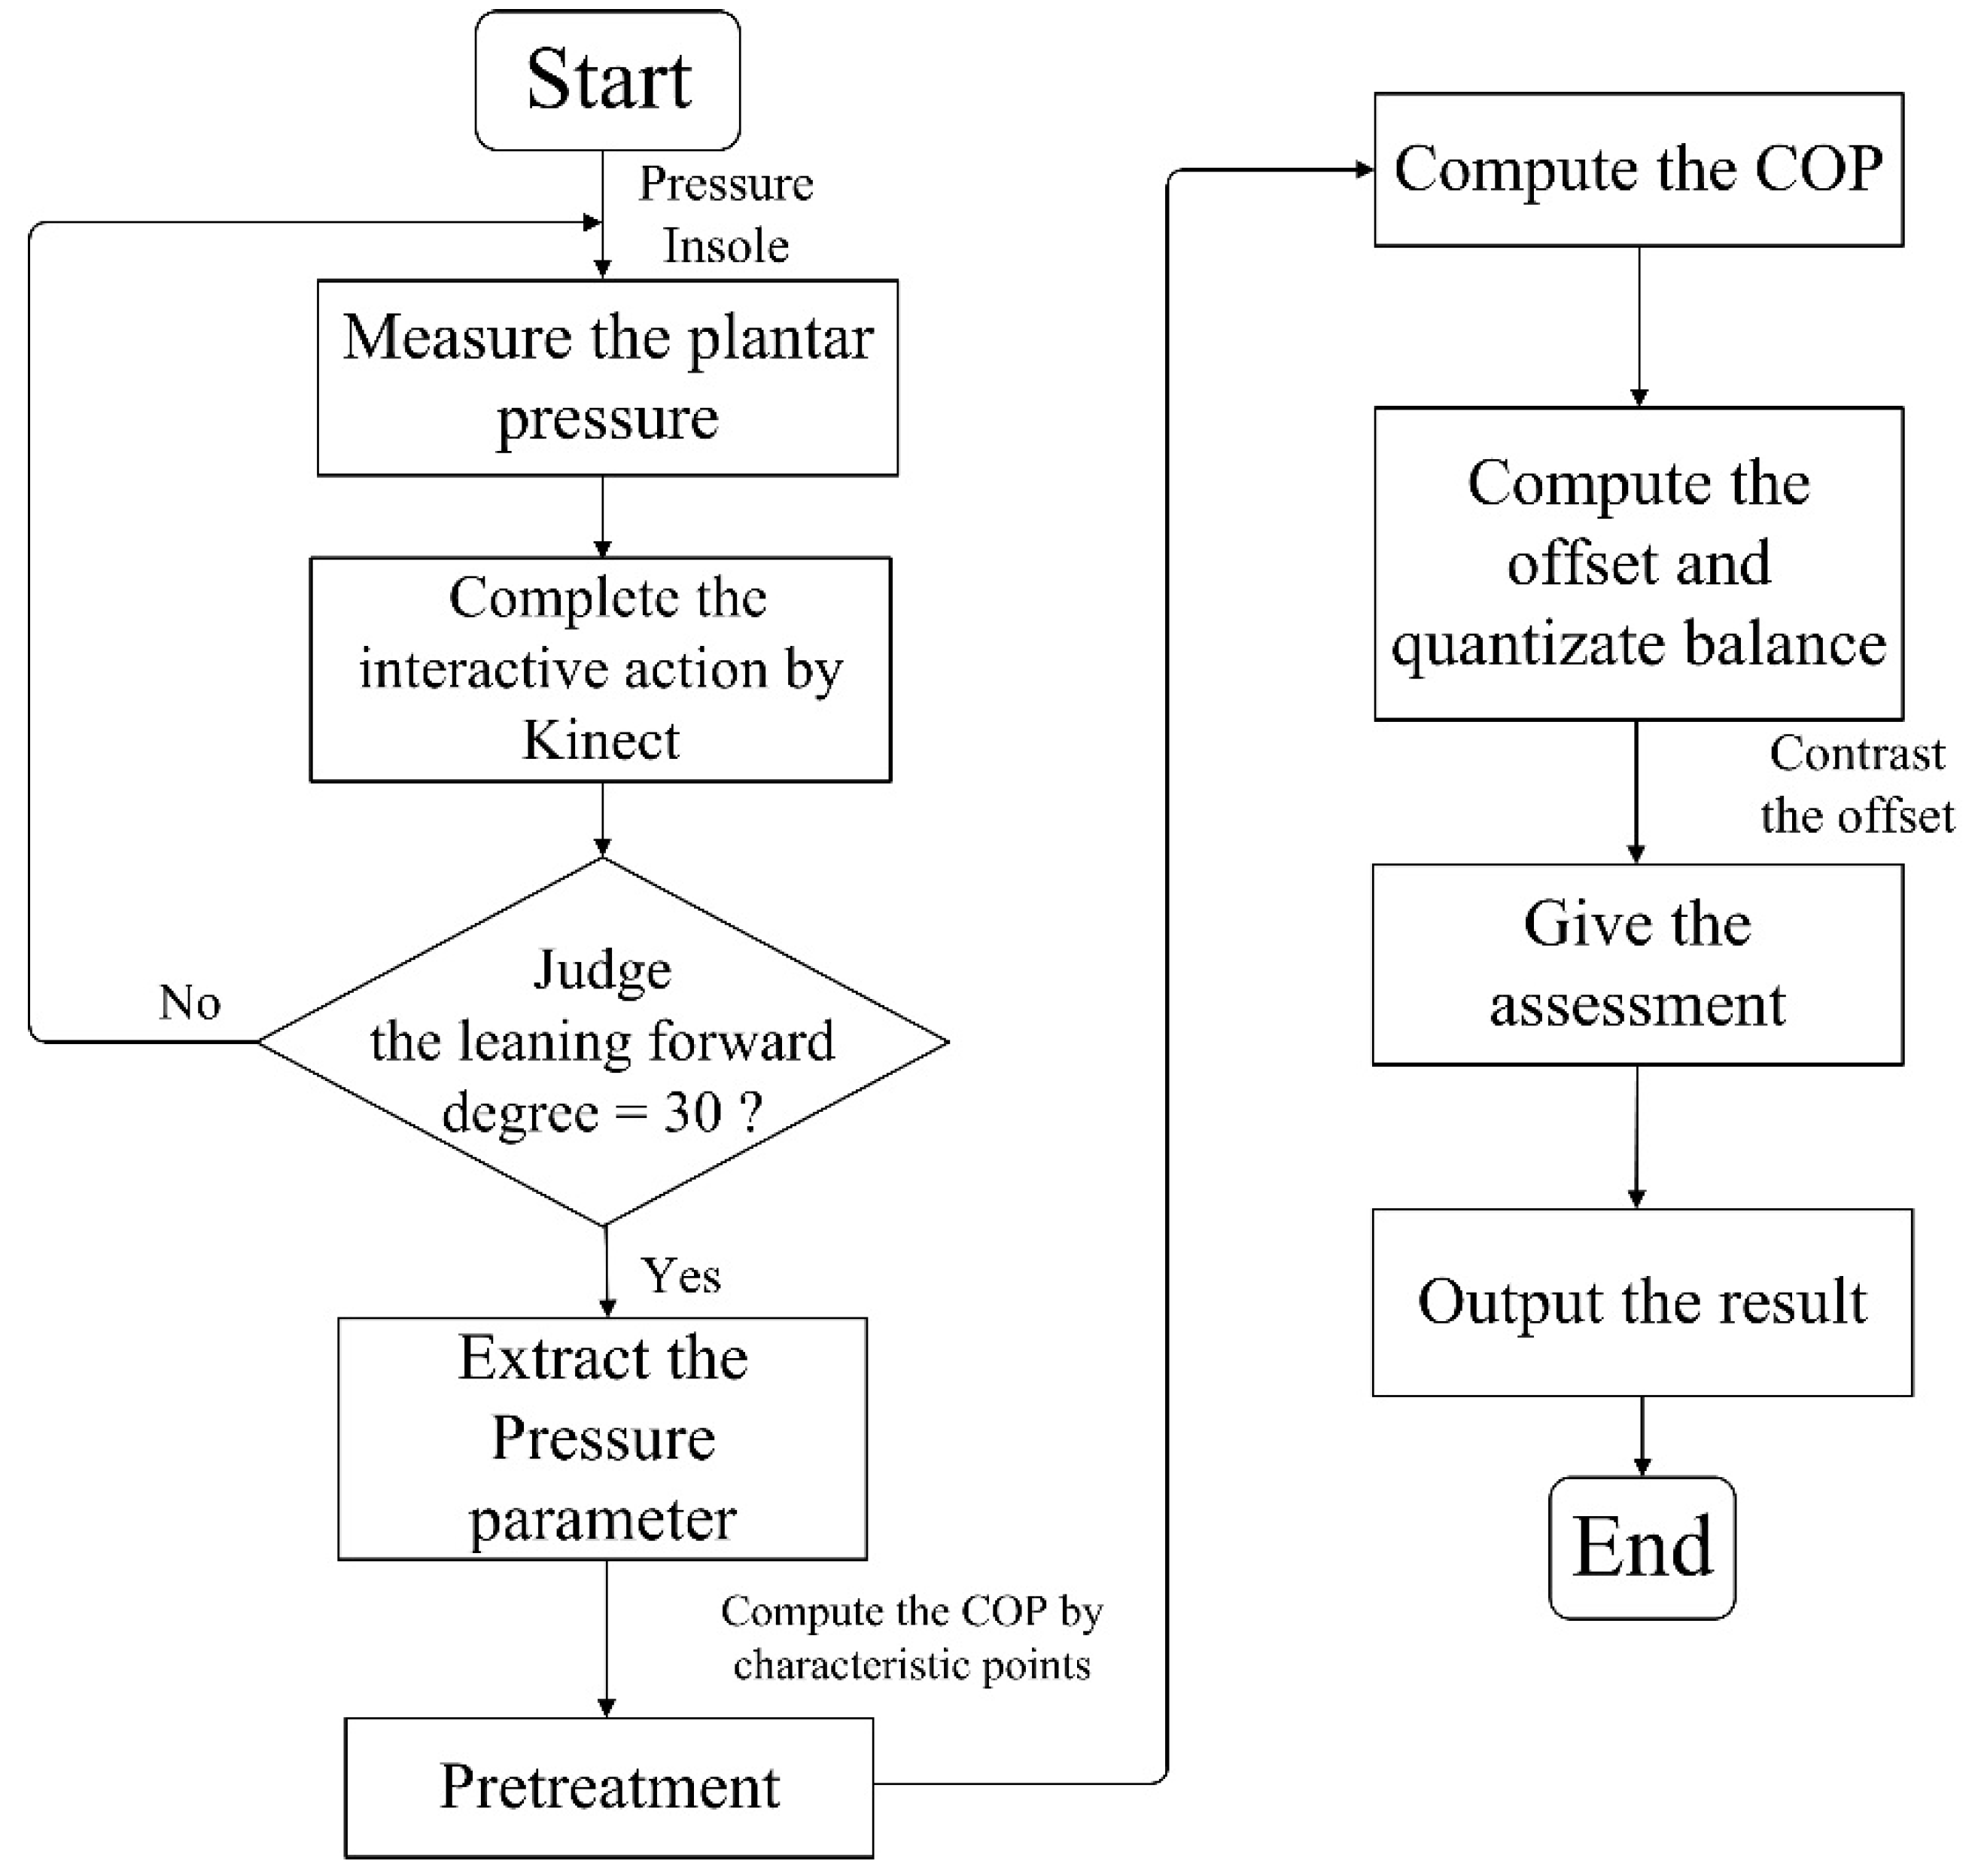
2.3. Data Processing
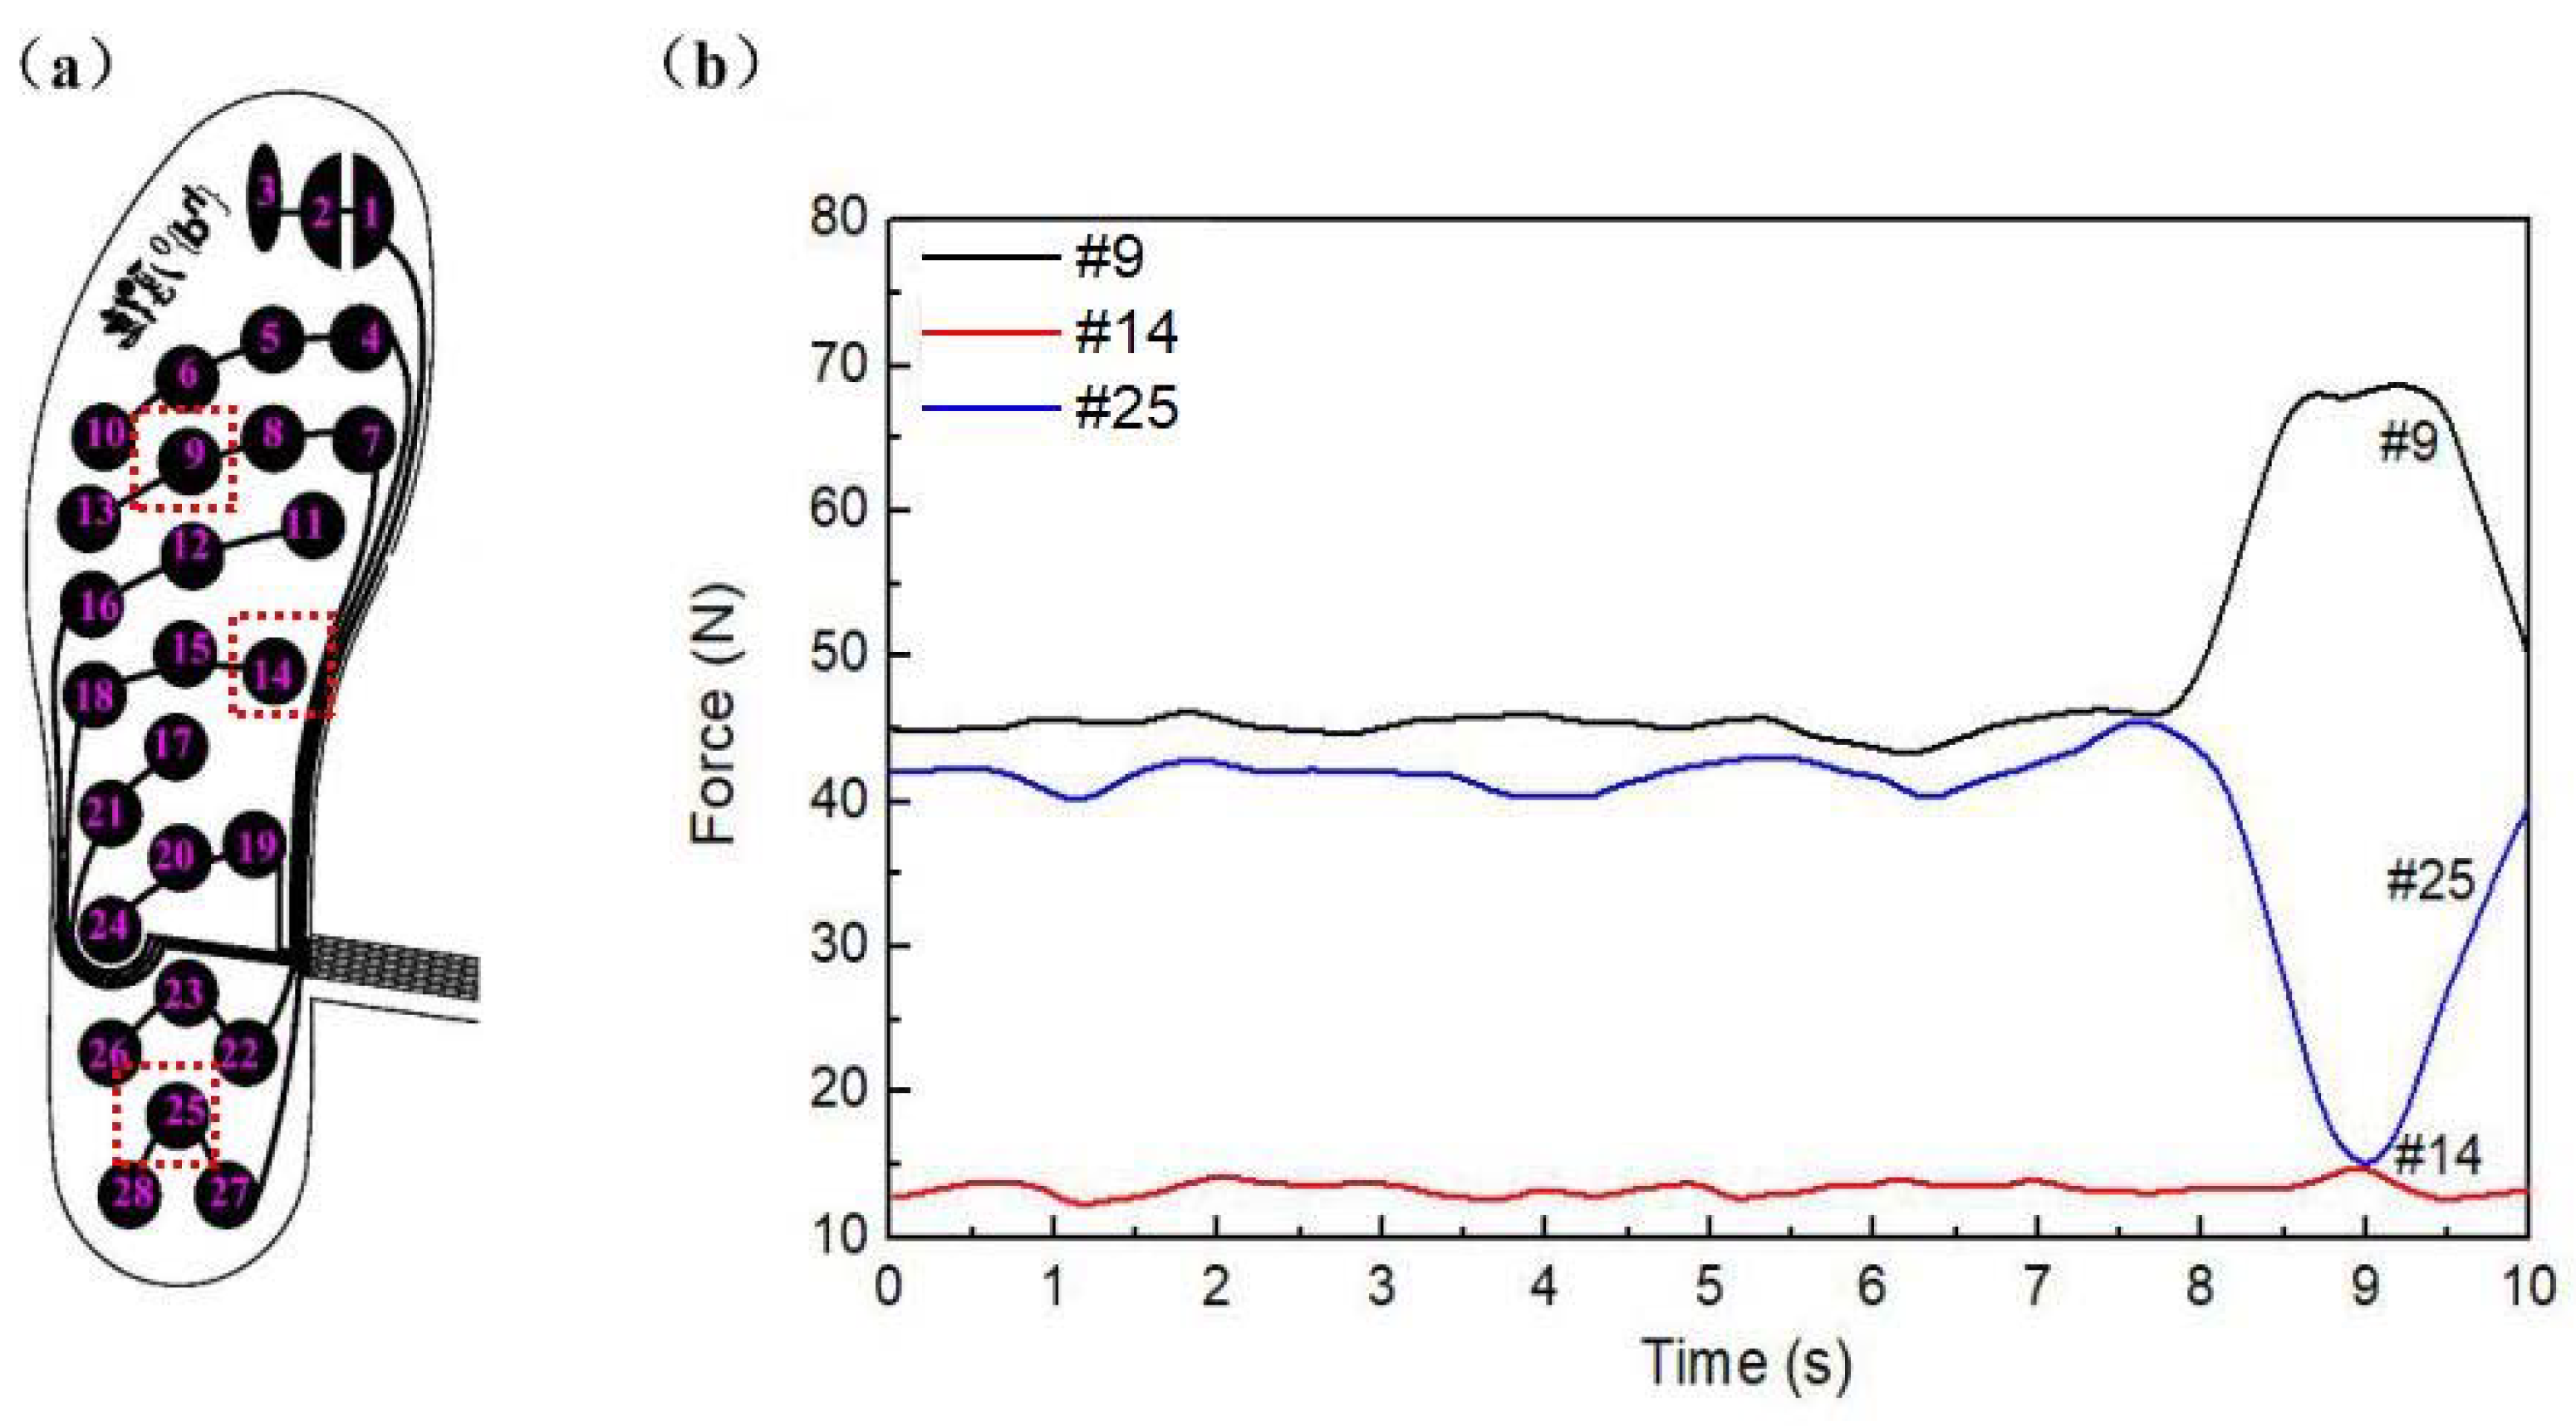
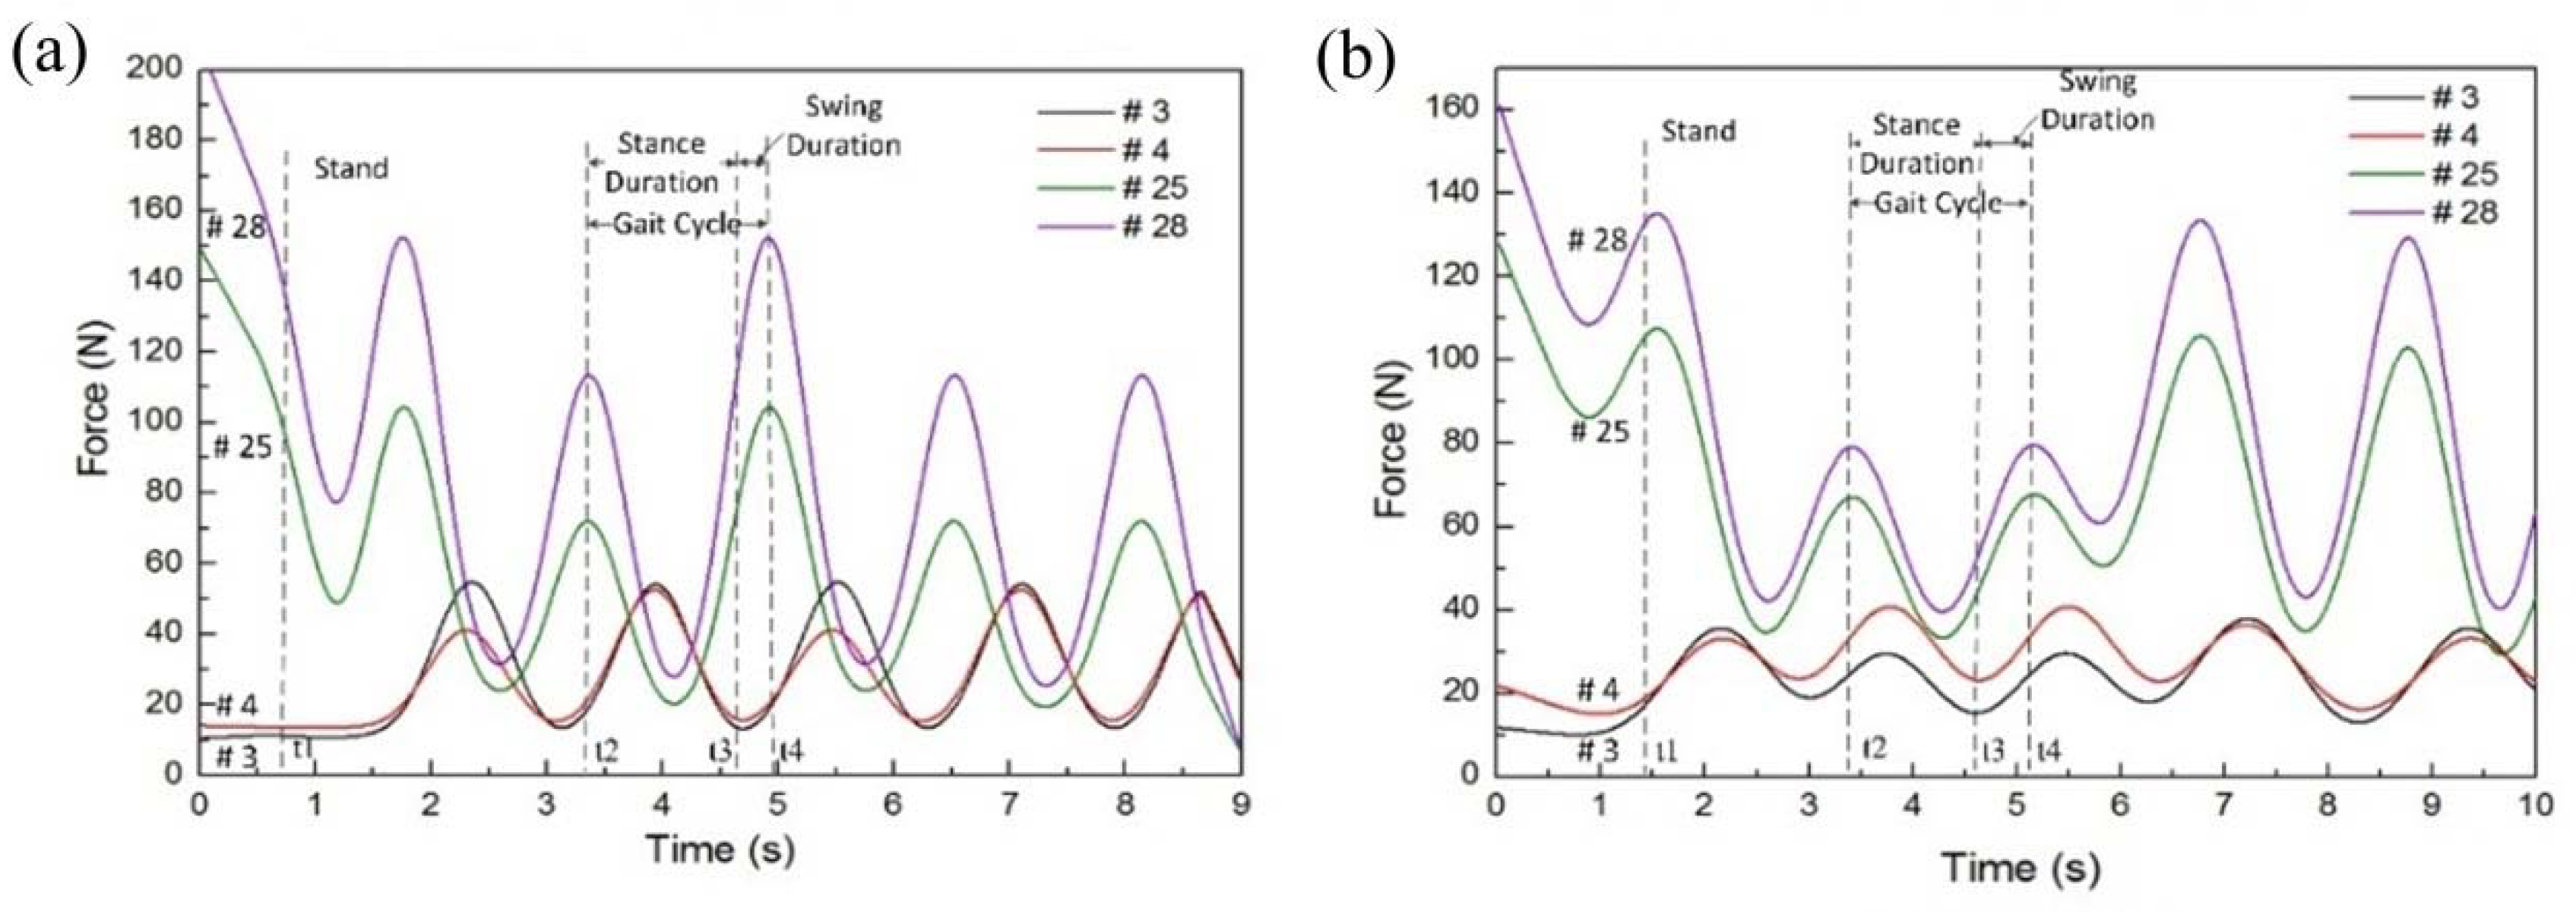
3. Results and Discussions
4. Conclusions
Author Contributions
Funding
Conflicts of Interest
References
- Guo, Y.; Zhao, G.; Liu, Q.; Mei, Z.; Ivanov, K.; Wang, L. Balance and knee extensibility evaluation of hemiplegic gait using an inertial body sensor network. Biomed. Eng. Online 2013, 12, 83. [Google Scholar] [CrossRef] [PubMed] [Green Version]
- Pandit, S.; Godiyal, A.K.; Vimal, A.K.; Singh, U.; Joshi, D.; Kalyanasundaram, D. An Affordable Insole-Sensor-Based Trans-Femoral Prosthesis for Normal Gait. Sensors 2018, 18, 706. [Google Scholar] [CrossRef] [PubMed]
- Alcalá, J.M.; Ureña, J.; Hernández, Á.; Gualda, D. Assessing Human Activity in Elderly People Using Non-Intrusive Load Monitoring. Sensors 2017, 17, 351. [Google Scholar] [CrossRef] [PubMed]
- Chakravarty, K.; Suman, S.; Bhowmick, B.; Sinha, A.; Das, A. Quantification of balance in single limb stance using Kinect. In Proceedings of the IEEE International Conference on Acoustics, Speech and Signal Processing, Shanghai, China, 20–25 March 2016; pp. 854–858. [Google Scholar]
- Van, D.M.; Lamoth, C.J.; Stegenga, J.; Verkerke, G.J.; Postema, K. Exergaming for balance training of elderly: State: State of the art and future developments. J. Neuroeng. Rehabil. 2013, 10, 101. [Google Scholar]
- Lord, S.R.; Murray, S.M.; Chapman, K.; Munro, B.; Tiedemann, A. Sit-to-stand performance depends on sensation, speed, balance, and psychological status in addition to strength in older people. J. Gerontol. A Biol. Sci. Med. Sci. 2002, 57, M539–M543. [Google Scholar] [CrossRef] [PubMed]
- Whitney, S.L.; Wrisley, D.M.; Marchetti, G.F.; Gee, M.A.; Redfern, M.S.; Furman, J.M. Clinical measurement of sit-to-stand performance in people with balance disorders: Validity: Validity of data for the Five-Times-Sit-to-Stand Test. Phys. Ther. 2005, 85, 1034–1045. [Google Scholar] [PubMed]
- Chandra, D.; Anggraeni, N.D.; Dirgantara, T.; Mihradi, S.; Mahyuddin, A.I. Improvement of Three-dimensional Motion Analyzer System for the Development of Indonesian Gait Database. Procedia Manuf. 2015, 2, 268–274. [Google Scholar] [CrossRef]
- Gil, A.W.; Oliveira, M.R.; Coelho, V.A.; Carvalho, C.E.; Teixeira, D.C.; da Silva, R.A., Jr. Relationship between force platform and two functional tests for measuring balance in the elderly. Revista Brasileira De Fisioterapia 2011, 15, 429–435. [Google Scholar] [CrossRef] [PubMed] [Green Version]
- Fairus, F.Z.; Nordin, N.A.M.; Singh, D.K.A. Test-retest reliability of knee kinematics measurement during gait with 3D motion analysis system. J. Fundam. Appl. Sci. 2017, 9, 1236–1249. [Google Scholar] [CrossRef]
- Howcroft, J.; Lemaire, E.D.; Kofman, J.; Kendell, C. Understanding responses to gait instability from plantar pressure measurement and the relationship to balance and mobility in lower-limb amputees. Clin. Biomech. 2015, 32, 241–248. [Google Scholar] [CrossRef] [PubMed]
- Pai, Y.C.; Patton, J. Center of mass velocity-position predictions for balance control. J. Biomech. 1997, 30, 347–354. [Google Scholar] [CrossRef]
- Cherng, R.J.; Chou, L.S.; Su, F.C.; Shaughnessy, W.J.; Kaufman, K.R. Using motion of the whole-body center of mass to assess the balance during gait of children with spastic cerebral palsy. J. Med. Biol. Eng. 2007, 27, 150–155. [Google Scholar]
- Bhattacharyya, B.K.; Chan, K.C. Computation of Gravity and Magnetic Anomalies due to Inhomogeneous Distribution of Magnetization and Density in a Localized Region. Geophysics 1977, 42, 602. [Google Scholar] [CrossRef]
- Pavão, S.L.; Nunes, G.S.; Santos, A.N.; Rocha, N.A. Relationship between static postural control and the level of functionalabilities in children with cerebral palsy. Braz. J. Phys. Ther. 2014, 18, 300–307. [Google Scholar] [CrossRef] [PubMed]
- Nakamura, M.; Urashima, A.; Toriyama, T.; Ninomiya, T.; Fukumoto, N.; Aiboshi, Y. The visualization system of center of pressure and base of support in sit-to-stand movement. In Proceedings of the IEEE 4th Global Conference on Consumer Electronics, Osaka, Japan, 27–30 October 2015; pp. 502–503. [Google Scholar]
- Huang, C.W.; Sue, P.D.; Abbod, M.F.; Jiang, B.C.; Shieh, J.S. Measuring Center of Pressure Signals to Quantify Human Balance Using Multivariate Multiscale Entropy by Designing a Force Platform. Sensors 2013, 13, 10151–10166. [Google Scholar] [CrossRef] [PubMed] [Green Version]
- Tamei, T.; Orito, Y.; Funaya, H.; Ikeda, K.; Okada, Y.; Shibata, T. Kinect-based posturography for in-home rehabilitation of balance disorders. Apsipa Trans. Signal Inf. Process. 2015, 4, 1–6. [Google Scholar] [CrossRef]
- Mettler, A.; Chinn, L.; Saliba, S.A.; McKeon, P.O.; Hertel, J. Balance training and center-of-pressure location in participants with chronic ankle instability. J. Athl. Train. 2015, 50, 343–349. [Google Scholar] [CrossRef] [PubMed]
- Kawano, T.; Ueda, T.; Fukui, Y.; Sugimura, N. Formulation of the Degree of Postural Instability Based on the COP and EMG Data; SAE Technical Papers 2009-1-2308; SAE International: Tokyo, Japan, 2009. [Google Scholar]
- Leach, J.M.; Mancini, M.; Peterka, R.J.; Hayes, T.L.; Horak, F.B. Validating and calibrating the nintendo wii balance board to derive reliable center of pressure measures. Sensors 2014, 14, 18244–18267. [Google Scholar] [CrossRef] [PubMed]
- Shu, L.; Hua, T.; Wang, Y.; Li, Q.; Feng, D.D.; Tao, X. In-Shoe Plantar Pressure Measurement and Analysis System Based on Fabric Pressure Sensing Array. IEEE Trans. Inf. Technol. Biomed. 2010, 14, 767–775. [Google Scholar] [PubMed] [Green Version]
- Crea, S.; Donati, M.; De Rossi, S.M.; Oddo, C.M.; Vitiello, N. A Wireless Flexible Sensorized Insole for Gait Analysis. Sensors 2014, 14, 1073–1093. [Google Scholar] [CrossRef] [PubMed] [Green Version]
- Herrington, L.; Hatcher, J.; Hatcher, A.; McNicholas, M. A comparison of Star Excursion Balance assessment reach distances between ACL deficient patients and asymptomatic controls. Knee 2009, 16, 149–152. [Google Scholar] [CrossRef] [PubMed]
- Dong, Y.K.; Han, S.L. The Changes of COP and Foot Pressure after One Hour’s Walking Wearing High-heeled and Flat Shoes. J. Phys. Ther. Sci. 2013, 25, 1309–1312. [Google Scholar] [Green Version]
- Shin, J.Y.; Ryu, Y.U.; Yi, C.W. Effects of insoles contact on static balance. J. Phys. Ther. Sci. 2016, 28, 1241–1244. [Google Scholar] [CrossRef] [PubMed] [Green Version]
- Lv, Z.; Penades, V.; Blasco, S.; Chirivella, J.; Gagliardo, P. Intuitive Evaluation of Kinect2 based Balance Measurement Software. In Proceedings of the 3rd 2015 Workshop on ICTs for improving Patients Rehabilitation Research Techniques, Lisbon, Portugal, 1–2 October 2015; ACM: New York, NY, USA, 2015; pp. 62–65. [Google Scholar]
- Davies, T.C. Let’s Kinect to increase balance and coordination of Older People: Pilot testing of a balloon catching game. Int. J. Virtual Worlds Hum. Comput. Interact. 2014, 1, 37–46. [Google Scholar] [CrossRef]
- Lim, D.; Kim, C.Y.; Jung, H.H.; Jung, D.; Chun, K.J. Use of the Microsoft Kinect system to characterize balance ability during balance training. Clin. Interv. Aging 2015, 10, 1077–1083. [Google Scholar] [PubMed]
- Sugawara, K.; Okada, K.; Saito, I.; Saito, A.; Wakasa, M. Foot Pressure Pattern During Walking in Individuals with Anterior Cruciate Ligament Injury. J. Am. Podiatr. Med. Assoc. 2016, 106, 201–206. [Google Scholar] [CrossRef] [PubMed]
- Saito, I.; Okada, K.; Nishi, T.; Wakasa, M.; Saito, A.; Sugawara, K.; Takahashi, Y.; Kinoshita, K. Foot Pressure Pattern and its Correlation with Knee Range of Motion Limitations for Individuals with Medial Knee Osteoarthritis. Arch. Phys. Med. Rehabil. 2013, 94, 2502–2508. [Google Scholar] [CrossRef] [PubMed]
- Mazzà, C.; Zok, M.; Croce, U.D. Sequencing sit-to-stand and upright posture for mobility limitation assessment: Determination of the timing of the task phases from force platform data. Gait Posture 2005, 21, 425–431. [Google Scholar] [CrossRef] [PubMed]
- Medeiros, D.L.; Conceição, J.S.; Graciosa, M.D.; Koch, D.B.; Santos, M.J.; Ries, L.G. The influence of seat heights and foot placement positions on postural control in children with cerebral palsy during a sit-to-stand task. Res. Dev. Disabil. 2015, 43–44, 1–10. [Google Scholar] [CrossRef] [PubMed]
- Chou, S.W.; Wong, A.M.; Leong, C.P.; Hong, W.S.; Tang, F.T.; Lin, T.H. Postural control during sit-to stand and gait in stroke patients. Am. J. Phys. Med. Rehabil. 2003, 82, 42–47. [Google Scholar] [CrossRef] [PubMed]
- Young, L.M.; Yong, L.H. Analysis for Sit-to-Stand Performance According to the Angle of Knee Flexion in Individuals with Hemiparesis. J. Phys. Ther. Sci. 2013, 25, 1583–1585. [Google Scholar] [Green Version]


| Point | Subject | |||||||||
|---|---|---|---|---|---|---|---|---|---|---|
| 1 | 2 | 3 | 4 | 5 | ||||||
| Insole a | Tek b | Insole | Tek | Insole | Tek | Insole | Tek | Insole | Tek | |
| 1 | 26.22 | 150 | 19.23 | 179 | 17.24 | 135 | 25.22 | 187 | 15.25 | 147 |
| 2 | 13.77 | 78 | 15.25 | 144 | 5.88 | 30 | 12.78 | 122 | 4.89 | 45 |
| 3 | 13.77 | 66 | 9.81 | 71 | 5.88 | 30 | 5.88 | 37 | 12.78 | 115 |
| 4 | 25.22 | 141 | 11.29 | 119 | 19.23 | 172 | 11.29 | 102 | 18.23 | 168 |
| 5 | 12.78 | 96 | 27.22 | 218 | 13.77 | 113 | 12.78 | 150 | 12.78 | 119 |
| 6 | 20.72 | 112 | 20.72 | 137 | 13.77 | 113 | 13.77 | 140 | 13.27 | 120 |
| 7 | 31.75 | 165 | 31.24 | 245 | 27.72 | 191 | 31.24 | 161 | 24.22 | 199 |
| 8 | 45.44 | 185 | 27.72 | 223 | 32.75 | 255 | 41.37 | 242 | 16.74 | 132 |
| 9 | 45.95 | 202 | 45.95 | 252 | 44.93 | 255 | 44.93 | 255 | 12.78 | 124 |
| 10 | 27.22 | 188 | 13.77 | 102 | 27.22 | 199 | 25.22 | 196 | 13.77 | 134 |
| 11 | 25.22 | 126 | 19.23 | 194 | 25.22 | 179 | 26.22 | 191 | 9.32 | 68 |
| 12 | 20.72 | 104 | 15.75 | 124 | 20.72 | 133 | 13.77 | 137 | 5.39 | 51 |
| 13 | 49.54 | 212 | 45.95 | 240 | 51.59 | 220 | 58.81 | 214 | 12.78 | 120 |
| 14 | 19.23 | 90 | 11.29 | 91 | 13.23 | 102 | 11.29 | 98 | 10.31 | 81 |
| 15 | 13.77 | 67 | 5.88 | 46 | 13.77 | 91 | 13.77 | 208 | 9.32 | 74 |
| 16 | 27.22 | 187 | 13.77 | 136 | 27.22 | 219 | 27.22 | 154 | 9.81 | 79 |
| 17 | 5.88 | 50 | 13.77 | 136 | 12.78 | 79 | 12.78 | 146 | 5.88 | 48 |
| 18 | 25.22 | 187 | 12.78 | 134 | 25.22 | 207 | 19.23 | 204 | 5.88 | 39 |
| 19 | 15.25 | 84 | 11.29 | 108 | 18.23 | 165 | 13.27 | 139 | 16.24 | 167 |
| 20 | 12.78 | 73 | 12.78 | 132 | 13.77 | 119 | 13.77 | 147 | 13.77 | 113 |
| 21 | 27.22 | 168 | 13.77 | 156 | 26.22 | 237 | 19.23 | 164 | 7.84 | 84 |
| 22 | 27.22 | 168 | 27.22 | 255 | 27.22 | 208 | 29.73 | 234 | 24.22 | 193 |
| 23 | 41.37 | 255 | 40.35 | 255 | 41.87 | 255 | 41.37 | 226 | 28.73 | 255 |
| 24 | 24.22 | 110 | 12.78 | 119 | 25.22 | 192 | 25.22 | 218 | 13.77 | 160 |
| 25 | 36.8 | 255 | 36.8 | 255 | 45.95 | 255 | 38.83 | 255 | 100.51 | 255 |
| 26 | 43.4 | 205 | 41.37 | 213 | 50.56 | 205 | 41.37 | 204 | 44.93 | 225 |
| 27 | 31.24 | 207 | 29.23 | 238 | 27.22 | 206 | 27.22 | 193 | 48.51 | 225 |
| 28 | 51.59 | 229 | 36.8 | 176 | 45.44 | 210 | 52.62 | 209 | 125.58 | 255 |
| r | 0.882 | 0.8705 | 0.8372 | 0.7535 | 0.7443 | |||||
| Pressure Measurement System | The Pressure Insole | ||||||
|---|---|---|---|---|---|---|---|
| Foot | Stance Phase (s) | Swing Phase (s) | Gait Cycle (s) | Stance Phase (s) | Swing Phase (s) | Gait Cycle (s) | |
| subject 1 | L | 1300 | 0.300 | 1600 | 1300 | 0.267 | 1567 |
| R | 1260 | 0.450 | 1710 | 1213 | 0.399 | 1612 | |
| subject 2 | L | 1300 | 0.350 | 1650 | 1344 | 0.249 | 1593 |
| R | 1460 | 0.350 | 1810 | 1501 | 0.281 | 1782 | |
| subject 3 | L | 1300 | 0.330 | 1630 | 1373 | 0.227 | 1600 |
| R | 1390 | 0.400 | 1790 | 1520 | 0.239 | 1759 | |
| subject 4 | L | 1290 | 0.310 | 1600 | 1370 | 0.270 | 1640 |
| R | 1500 | 0.420 | 1920 | 1550 | 0.337 | 1887 | |
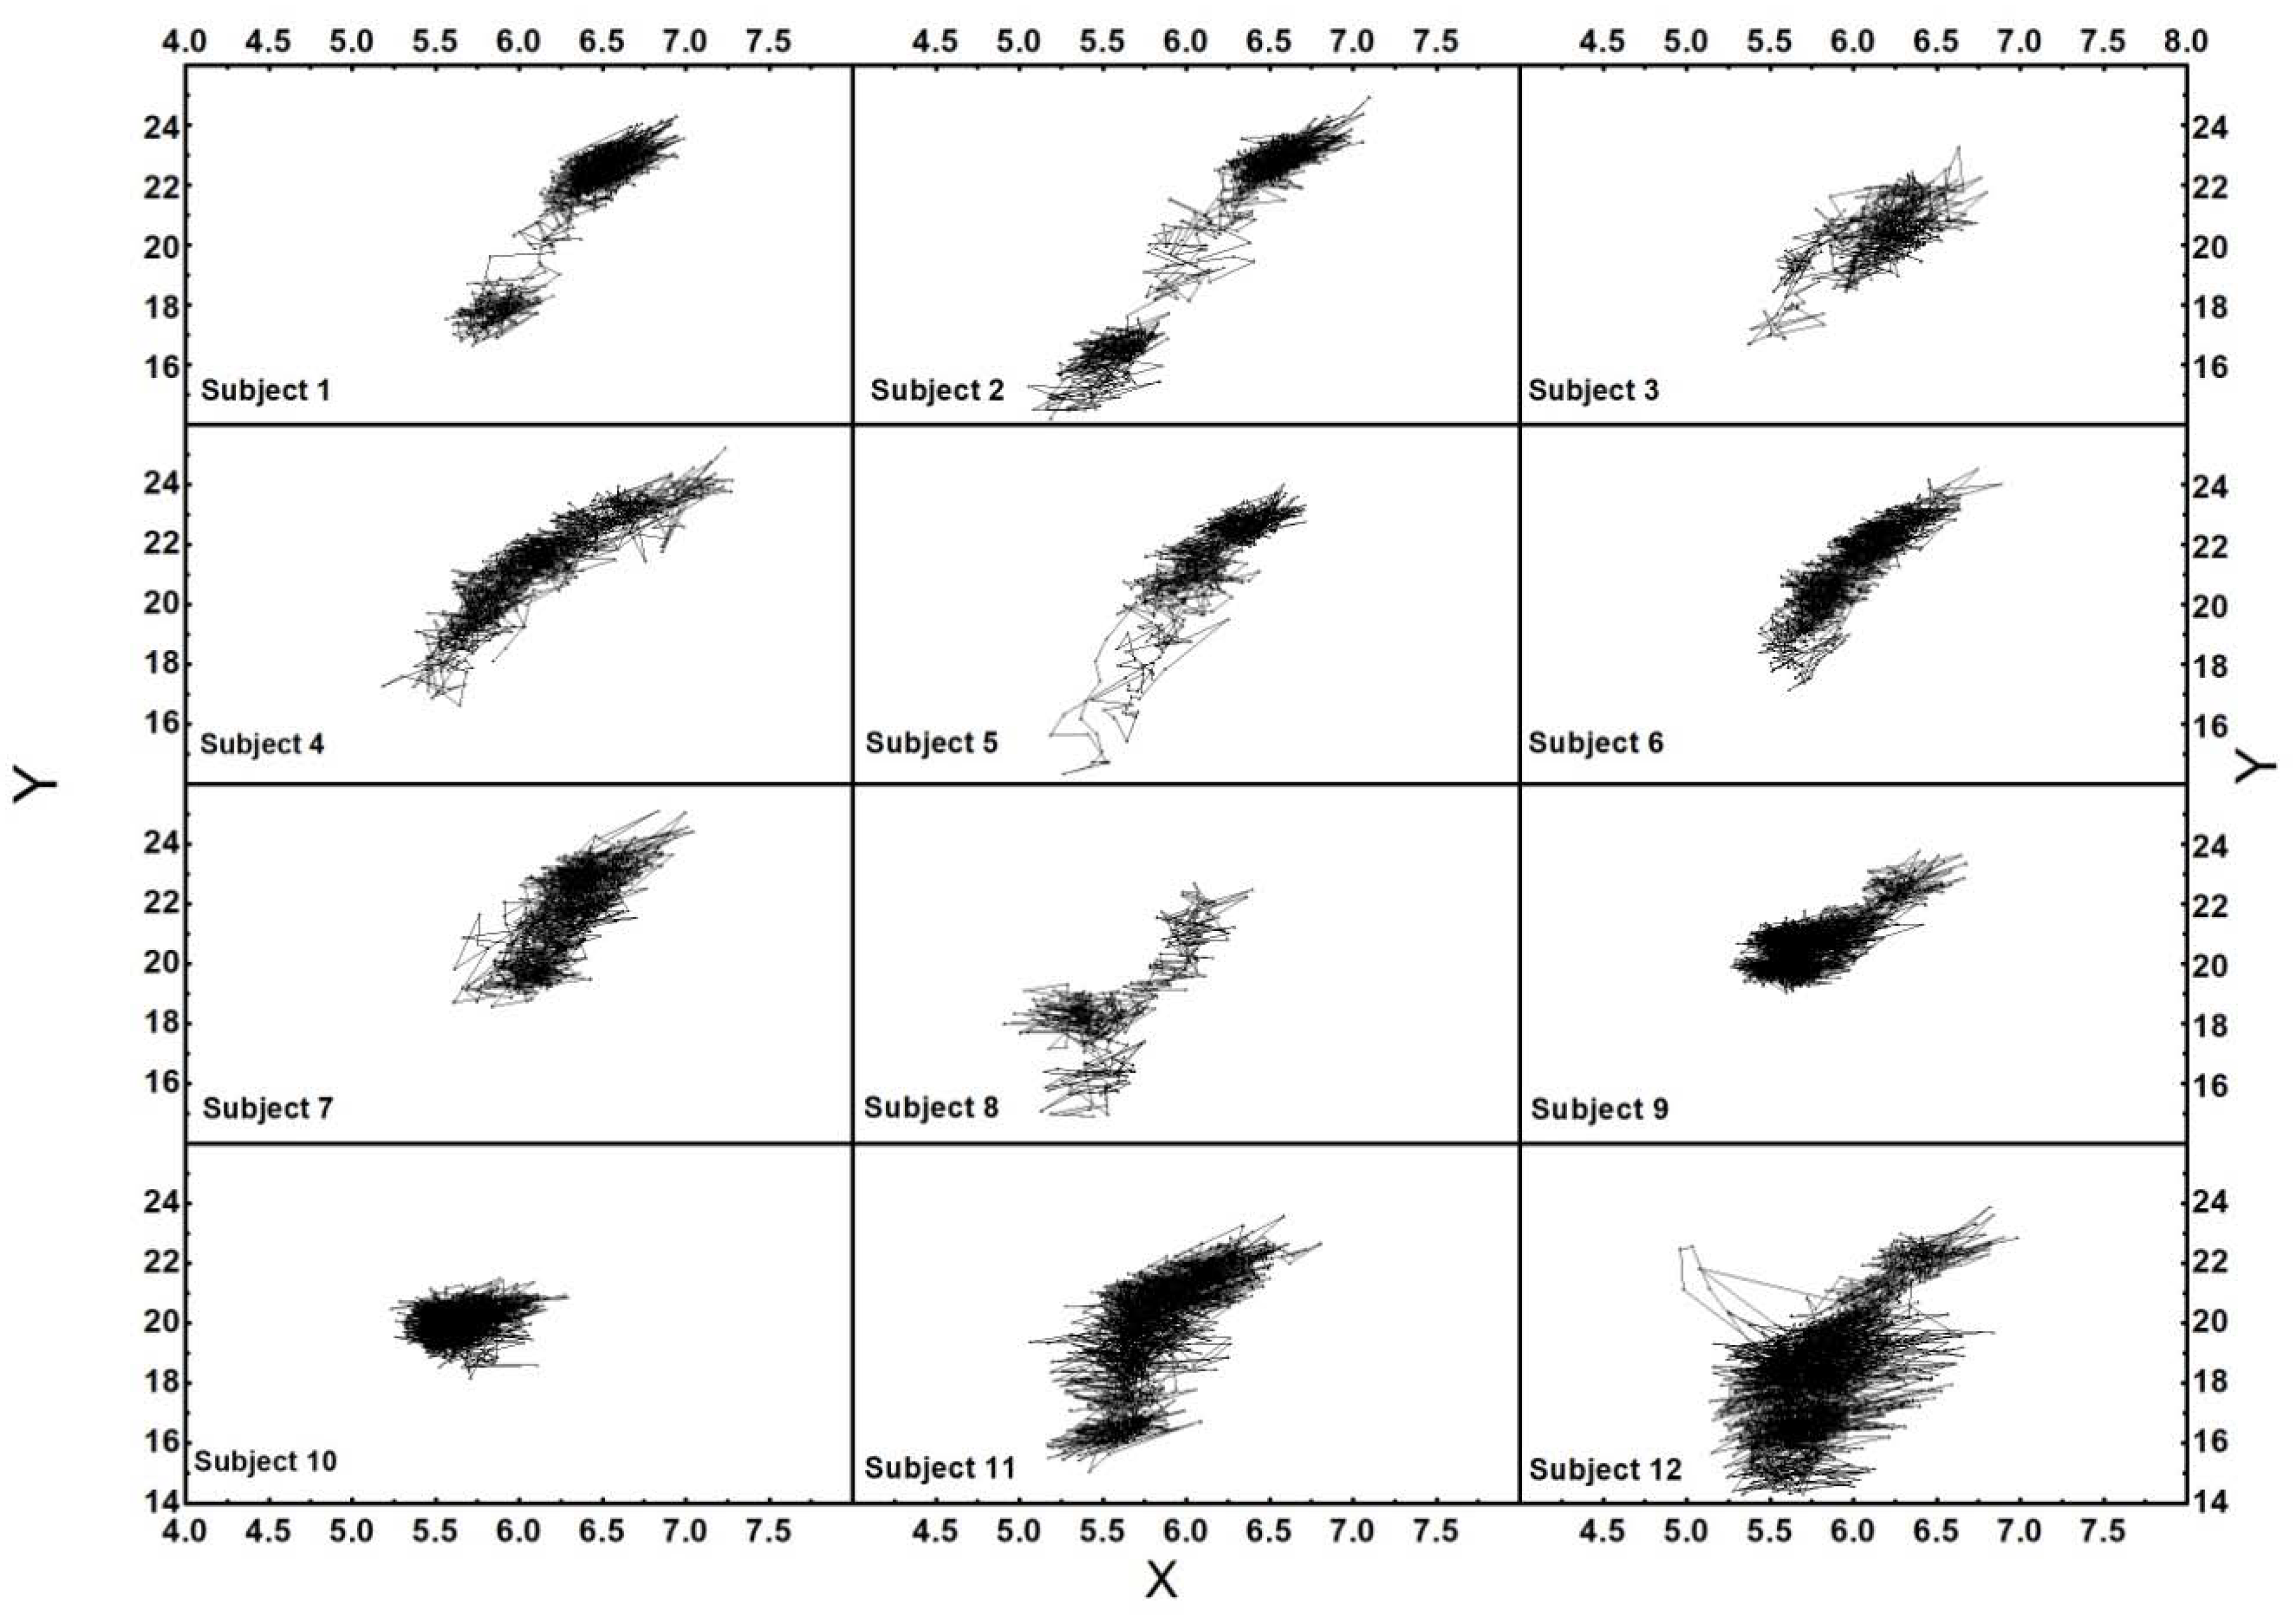
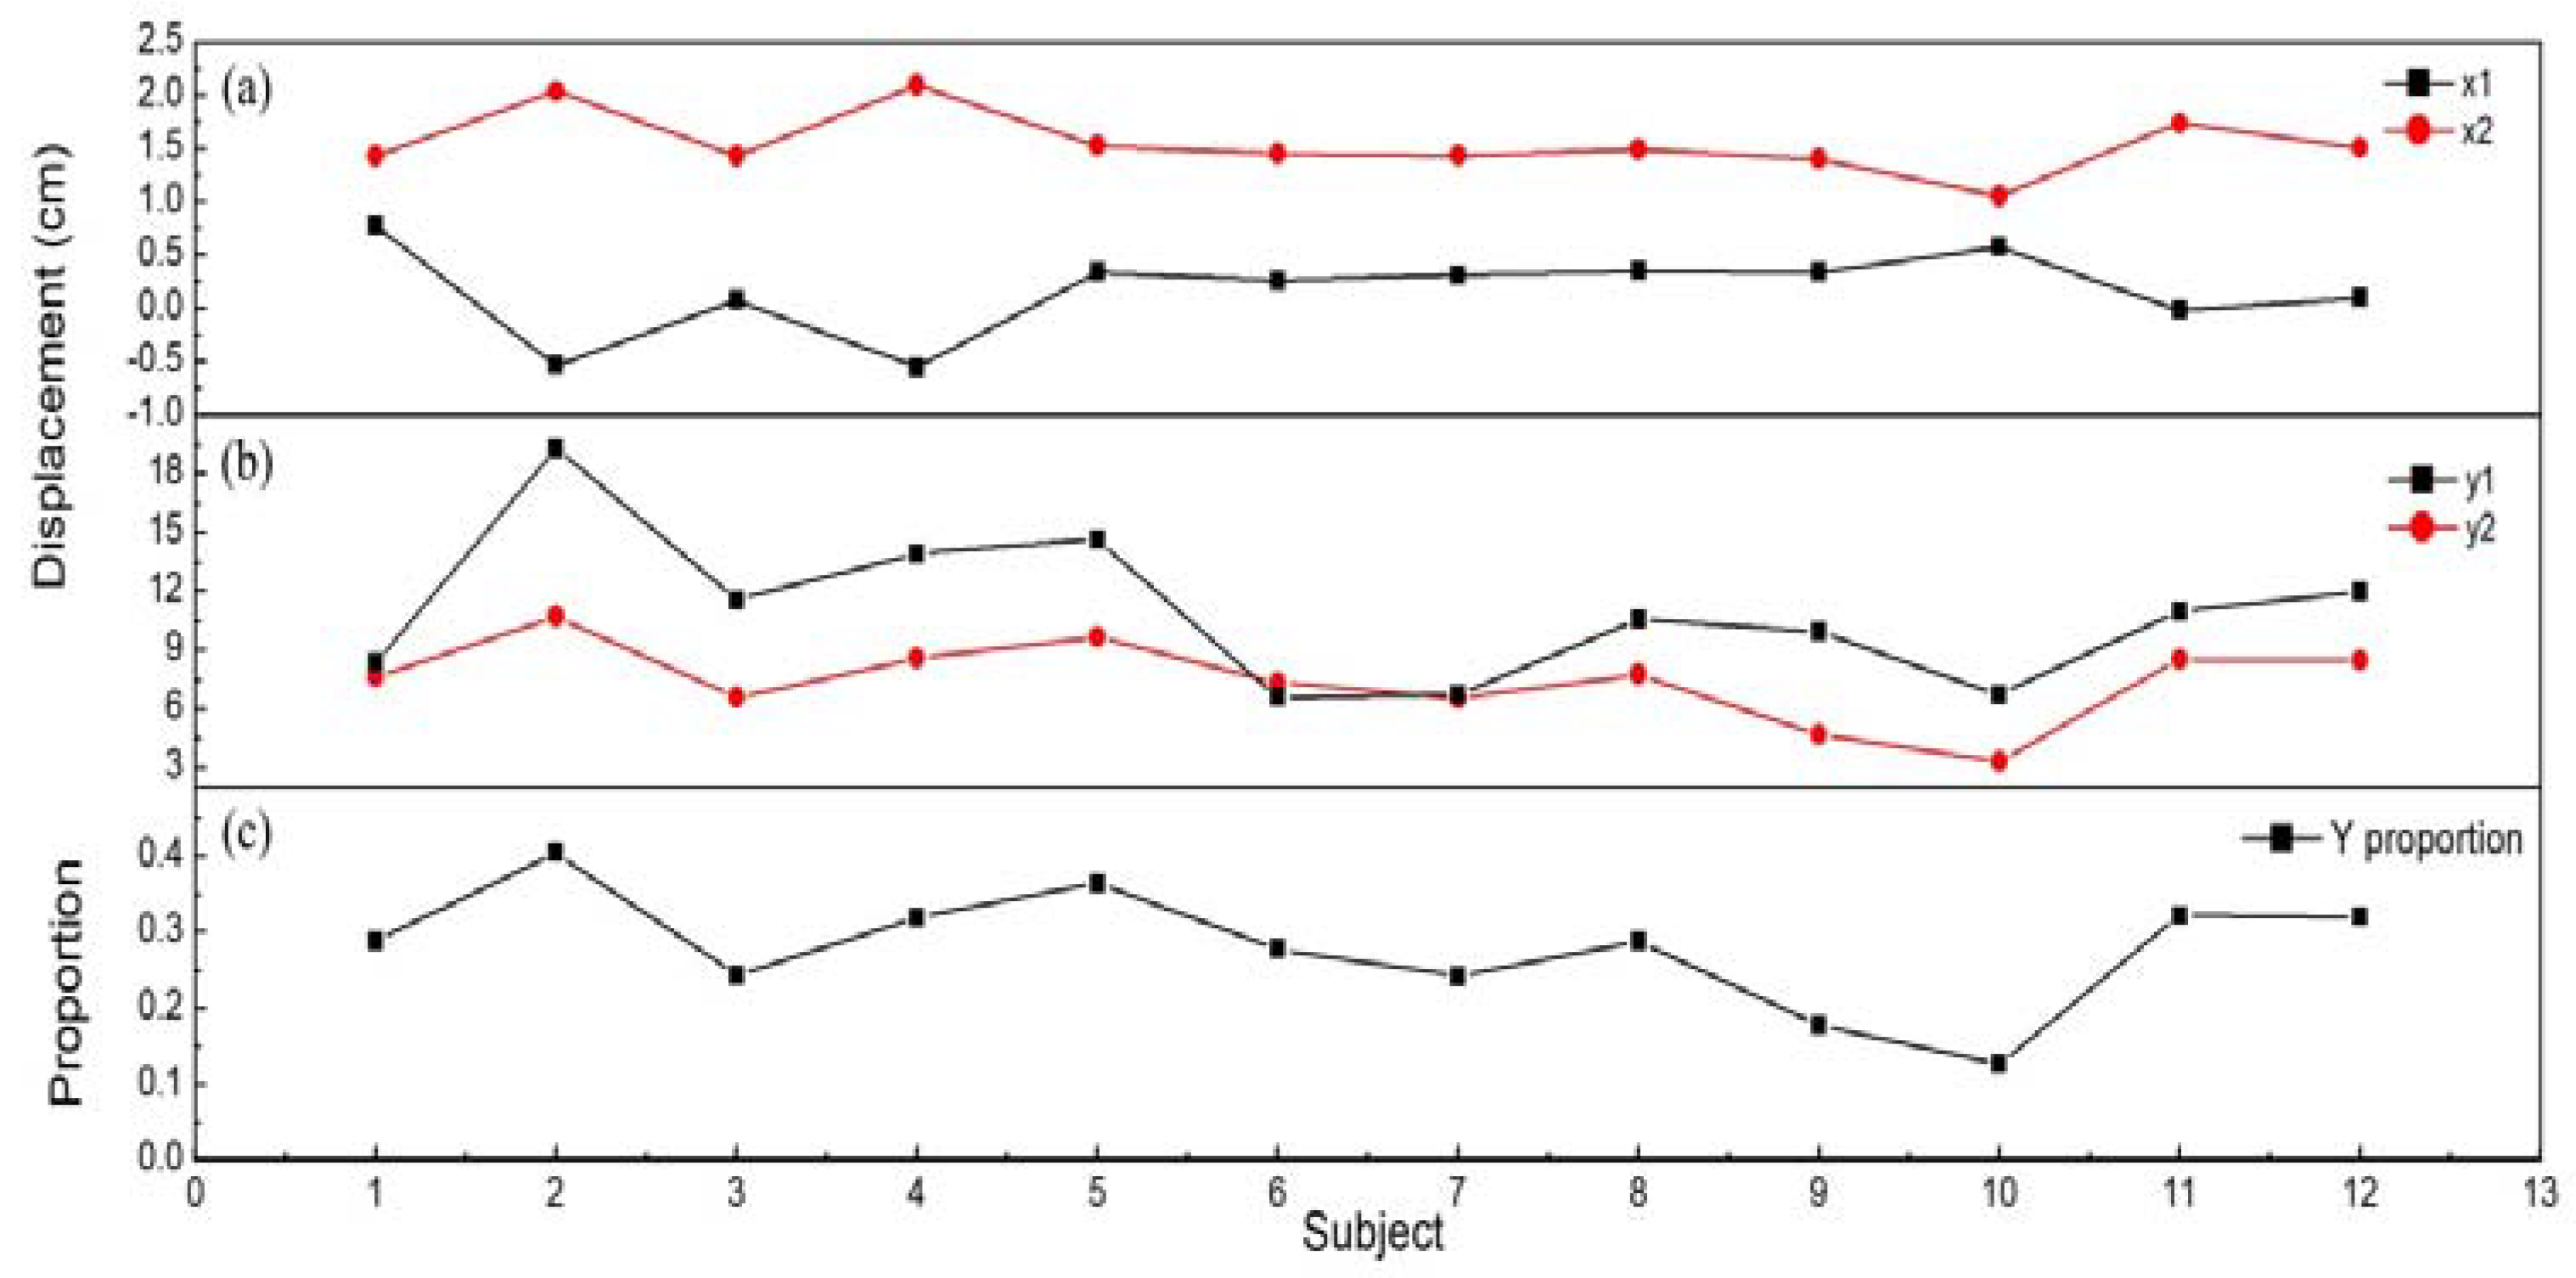
| Subject | X-Displacement (cm) | Y-Displacement (cm) | The Shift Speed of X (cm/s) | The Shift Speed of Y (cm/s) | X-Proportion | Y-Proportion |
|---|---|---|---|---|---|---|
| 1 | 1427 | 7638 | 0.157 | 0.495 | 1223 | 0.288 |
| 2 | 2040 | 10.712 | 0.163 | 0.480 | 1359 | 0.404 |
| 3 | 1429 | 6574 | 0.110 | 0.406 | 0.947 | 0.243 |
| 4 | 2096 | 8606 | 0.127 | 0.379 | 1361 | 0.319 |
| 5 | 1527 | 9661 | 0.124 | 0.390 | 0.819 | 0.365 |
| 6 | 1450 | 7356 | 0.126 | 0.343 | 0.849 | 0.278 |
| 7 | 1433 | 6535 | 0.148 | 0.480 | 0.821 | 0.242 |
| 8 | 1489 | 7767 | 0.146 | 0.372 | 0.812 | 0.288 |
| 9 | 1402 | 4701 | 0.157 | 0.409 | 0.807 | 0.177 |
| 10 | 1055 | 3336 | 0.165 | 0.392 | 0.647 | 0.126 |
| 11 | 1738 | 8527 | 0.190 | 0.472 | 1.009 | 0.322 |
| 12 | 1506 | 8482 | 0.186 | 0.465 | 0.938 | 0.320 |
© 2018 by the authors. Licensee MDPI, Basel, Switzerland. This article is an open access article distributed under the terms and conditions of the Creative Commons Attribution (CC BY) license (http://creativecommons.org/licenses/by/4.0/).
Share and Cite
Lou, C.; Pang, C.; Jing, C.; Wang, S.; He, X.; Liu, X.; Huang, L.; Lin, F.; Liu, X.; Wang, H. Dynamic Balance Measurement and Quantitative Assessment Using Wearable Plantar-Pressure Insoles in a Pose-Sensed Virtual Environment. Sensors 2018, 18, 4193. https://doi.org/10.3390/s18124193
Lou C, Pang C, Jing C, Wang S, He X, Liu X, Huang L, Lin F, Liu X, Wang H. Dynamic Balance Measurement and Quantitative Assessment Using Wearable Plantar-Pressure Insoles in a Pose-Sensed Virtual Environment. Sensors. 2018; 18(12):4193. https://doi.org/10.3390/s18124193
Chicago/Turabian StyleLou, Cunguang, Chenyao Pang, Congrui Jing, Shuo Wang, Xufeng He, Xiaoguang Liu, Lei Huang, Feng Lin, Xiuling Liu, and Hongrui Wang. 2018. "Dynamic Balance Measurement and Quantitative Assessment Using Wearable Plantar-Pressure Insoles in a Pose-Sensed Virtual Environment" Sensors 18, no. 12: 4193. https://doi.org/10.3390/s18124193