Monitoring of Carbon Fiber-Reinforced Old Timber Beams via Strain and Multiresonant Acoustic Emission Sensors

 , and
, and
Abstract
:1. Introduction
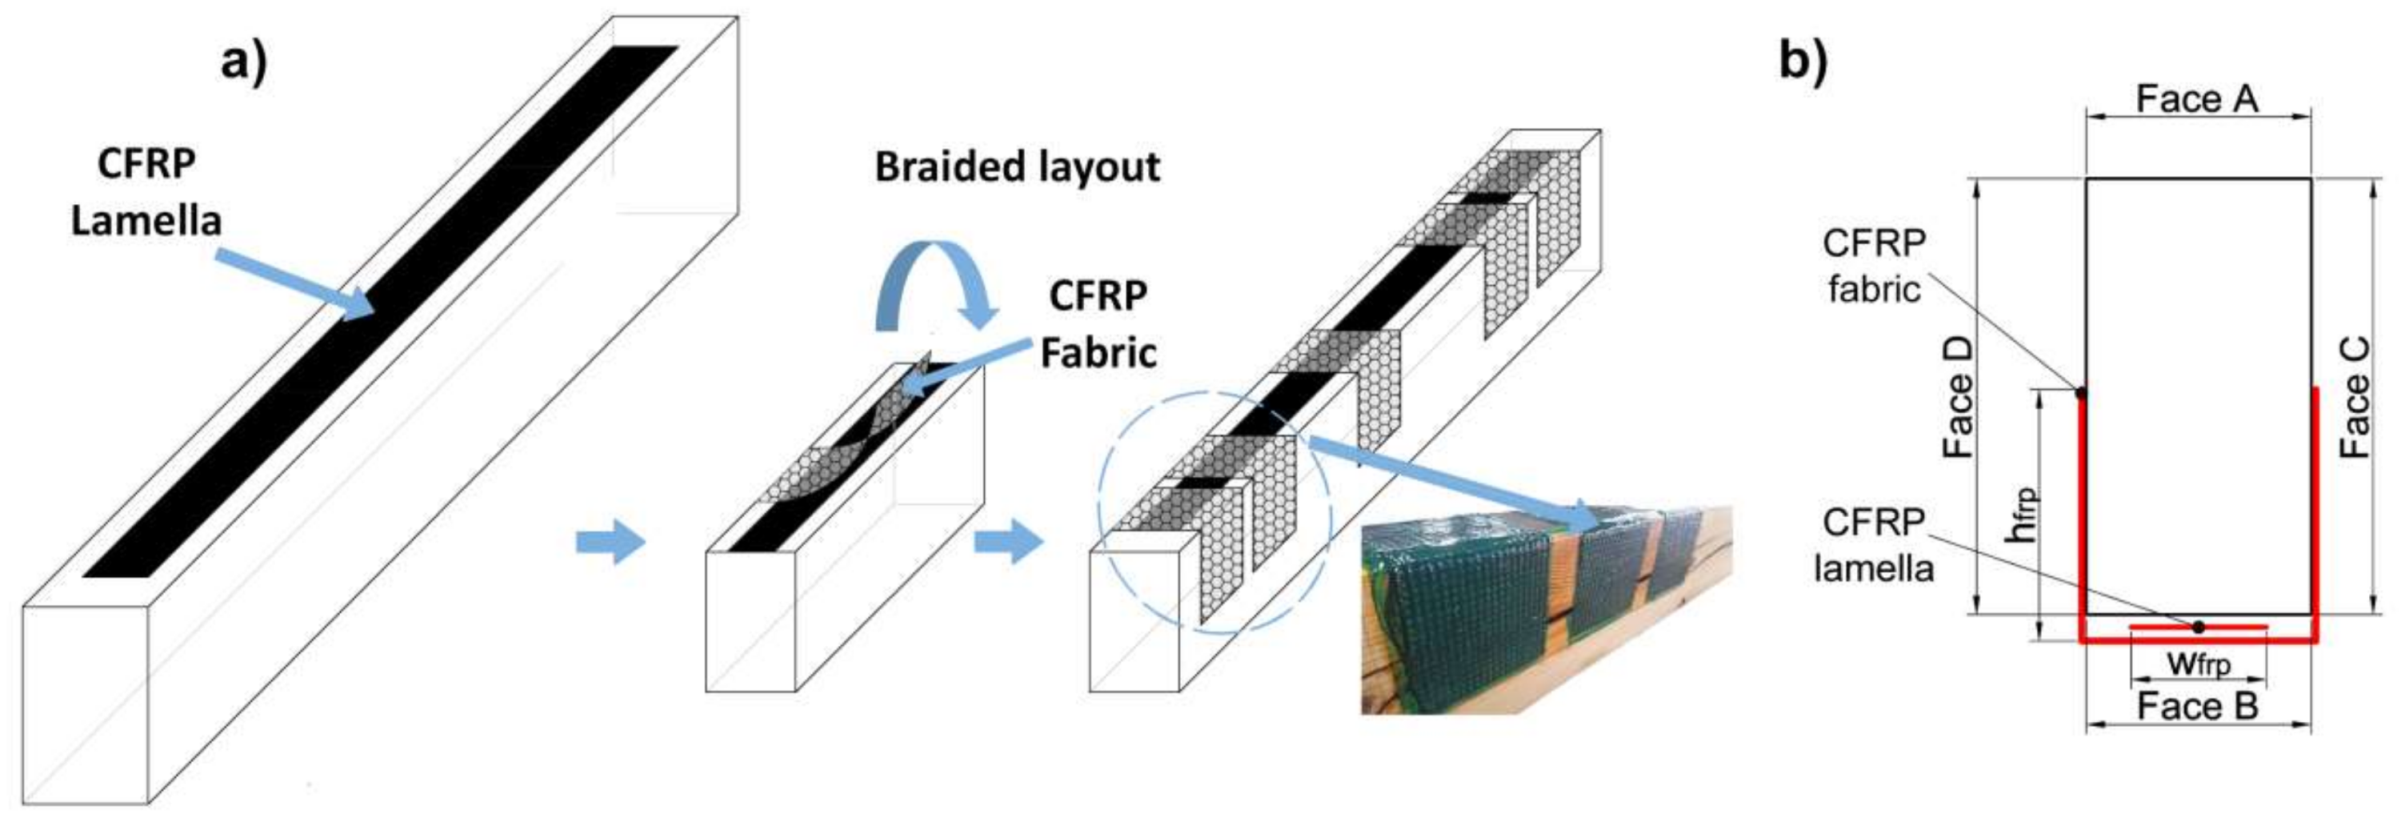
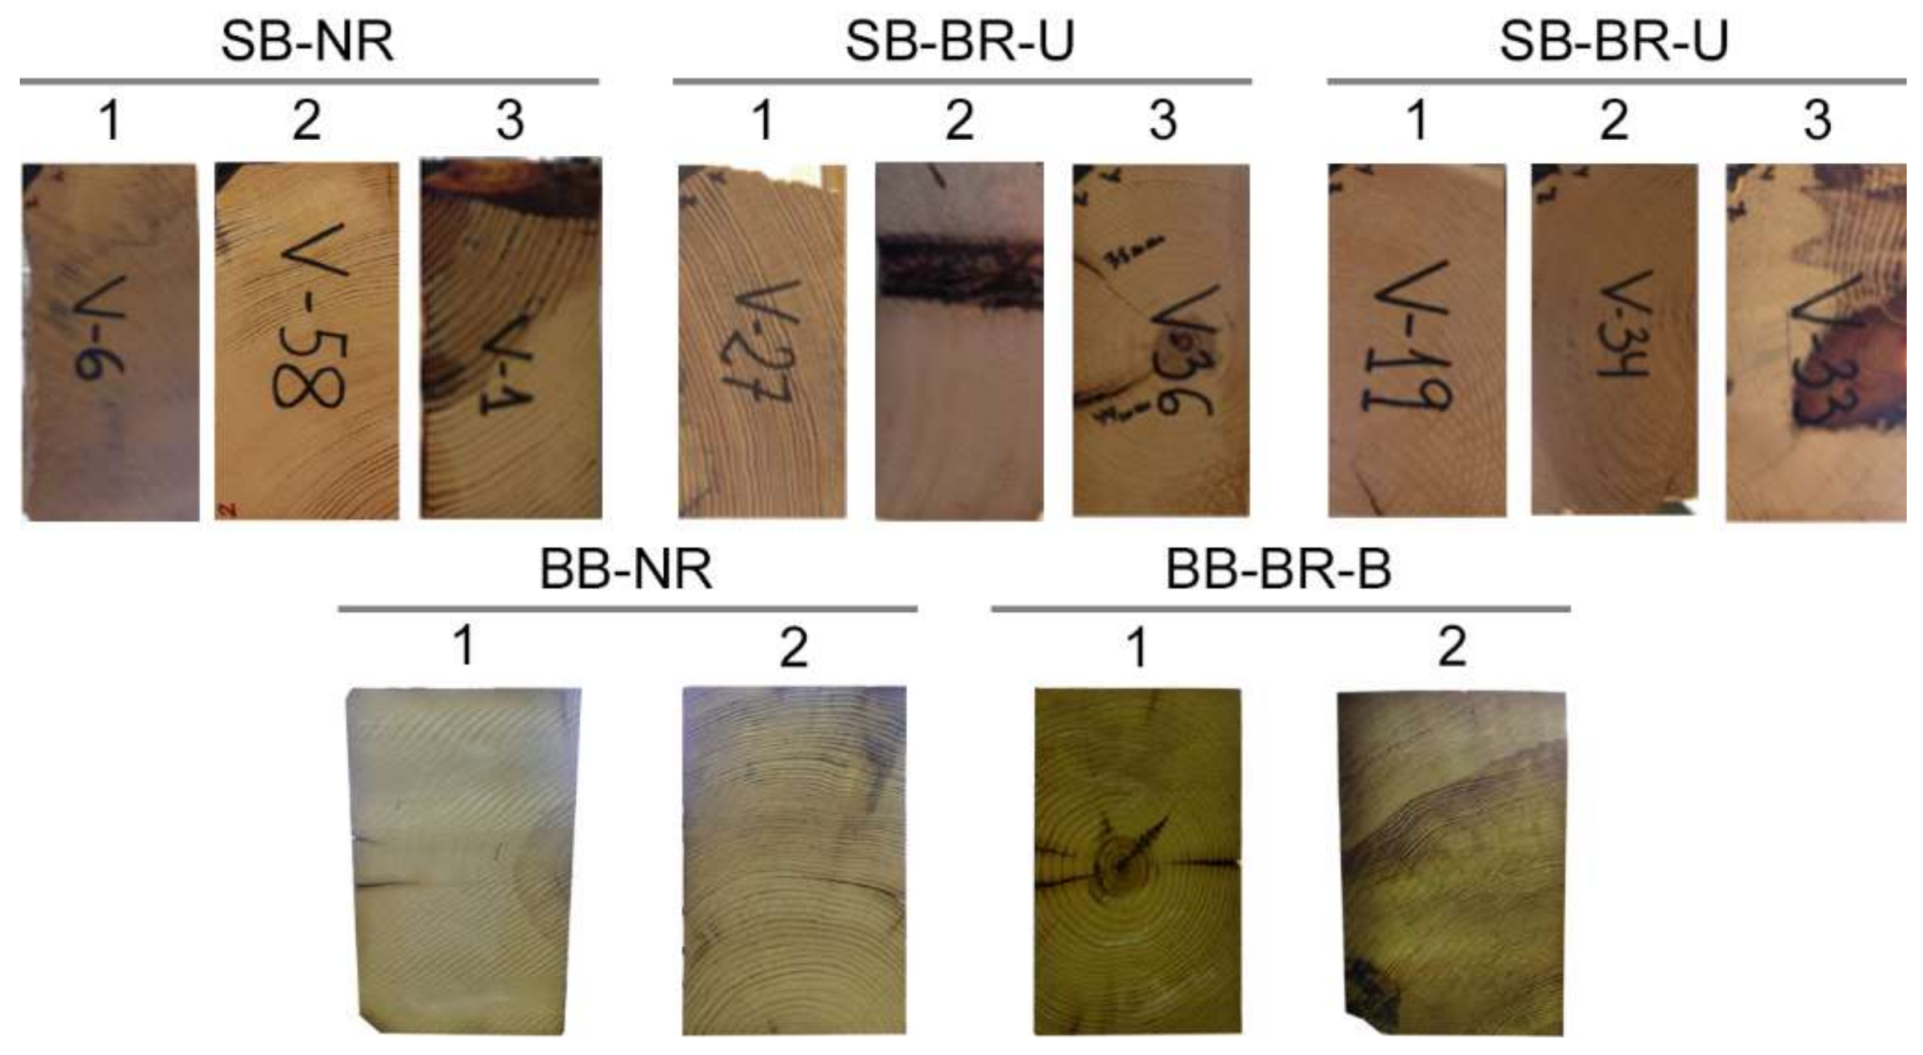
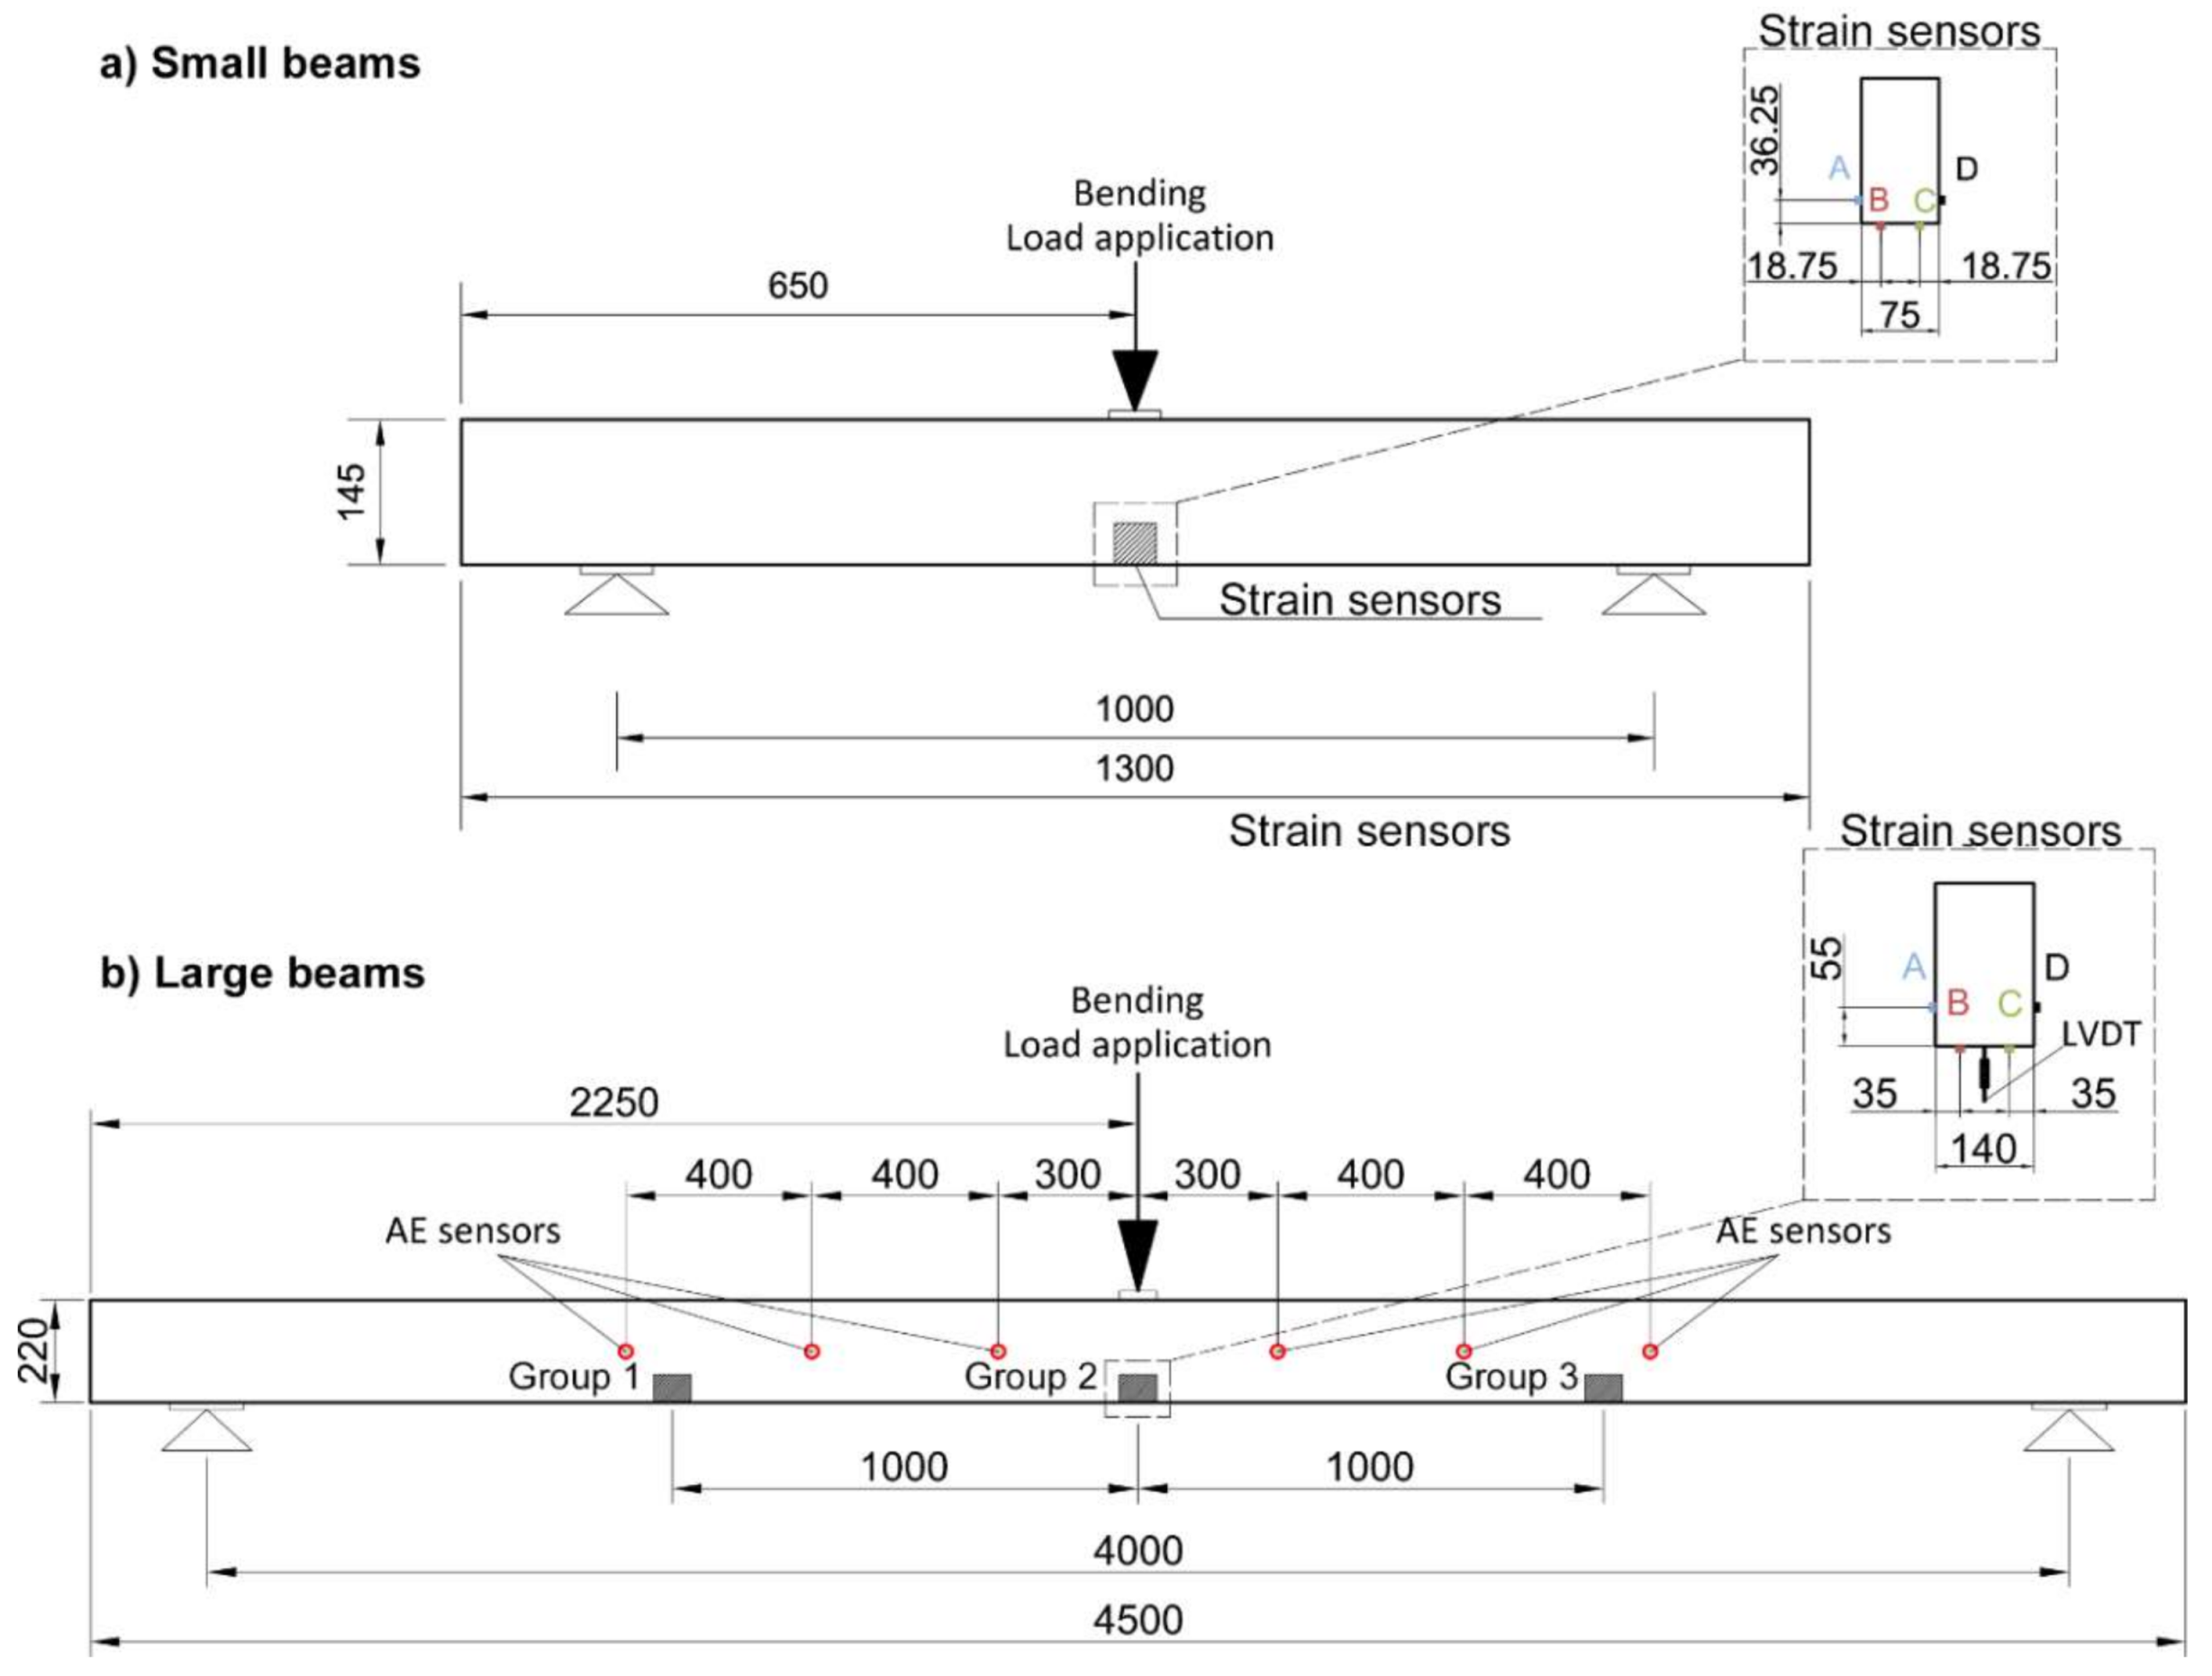
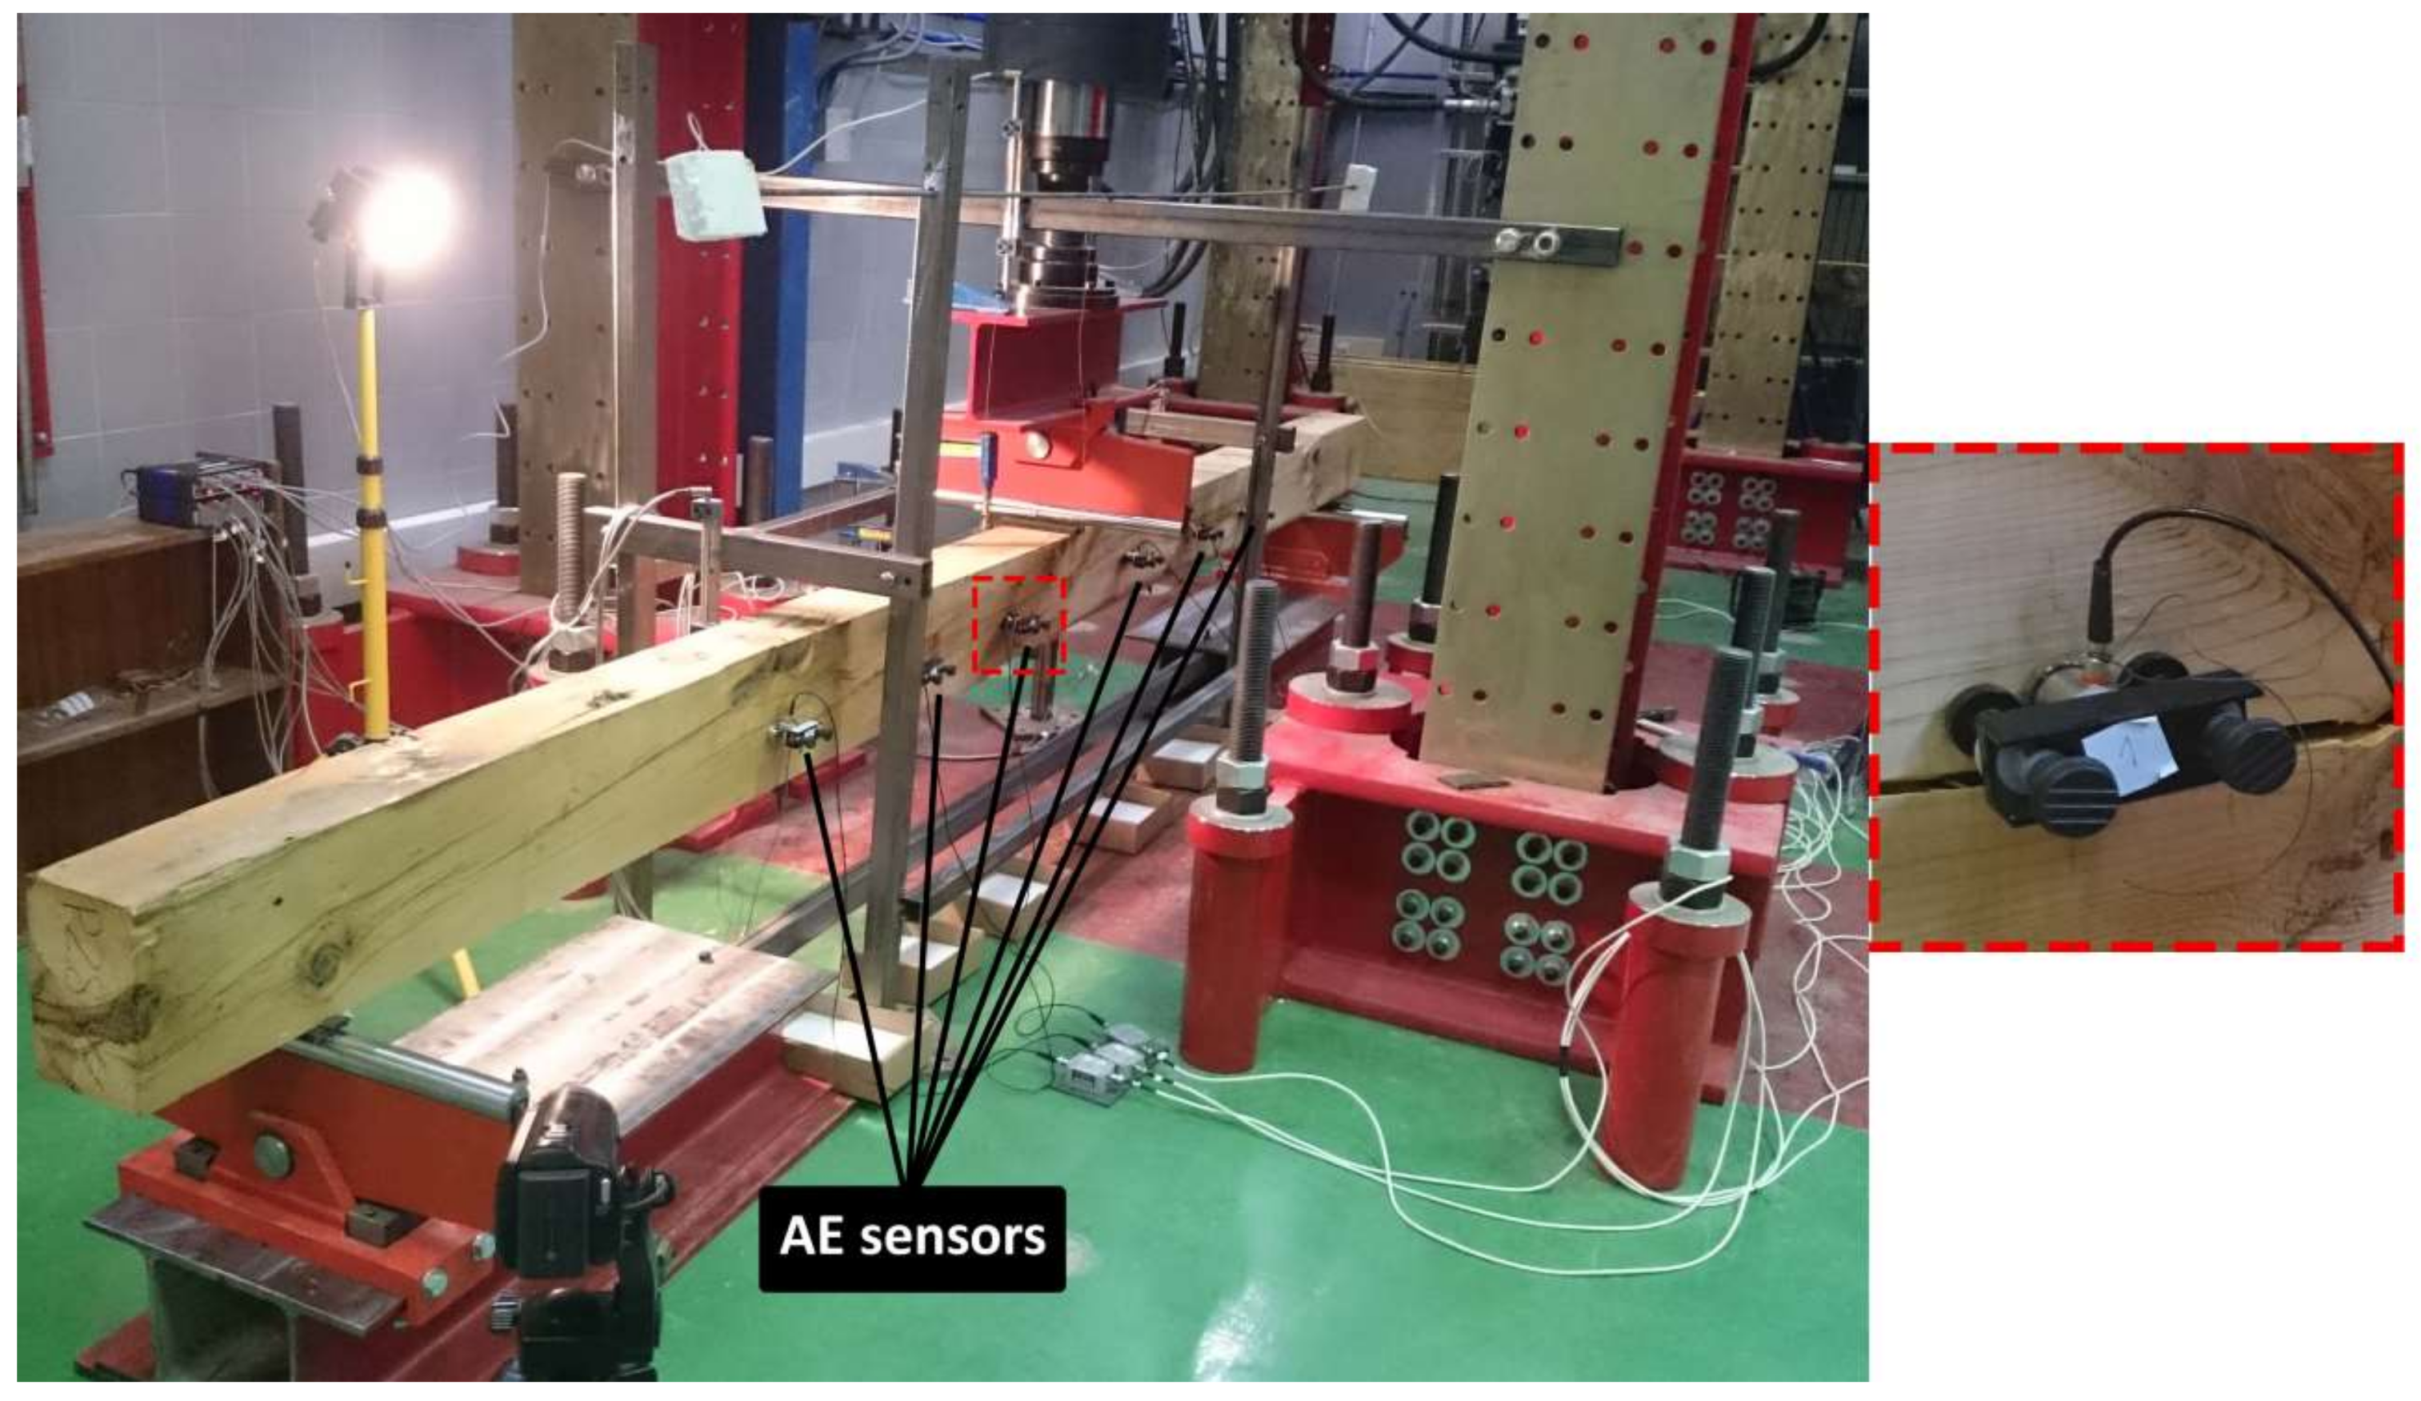
2. Specimens and Mechanical Test Description
3. Monitoring Sensors
3.1. Strain Sensors
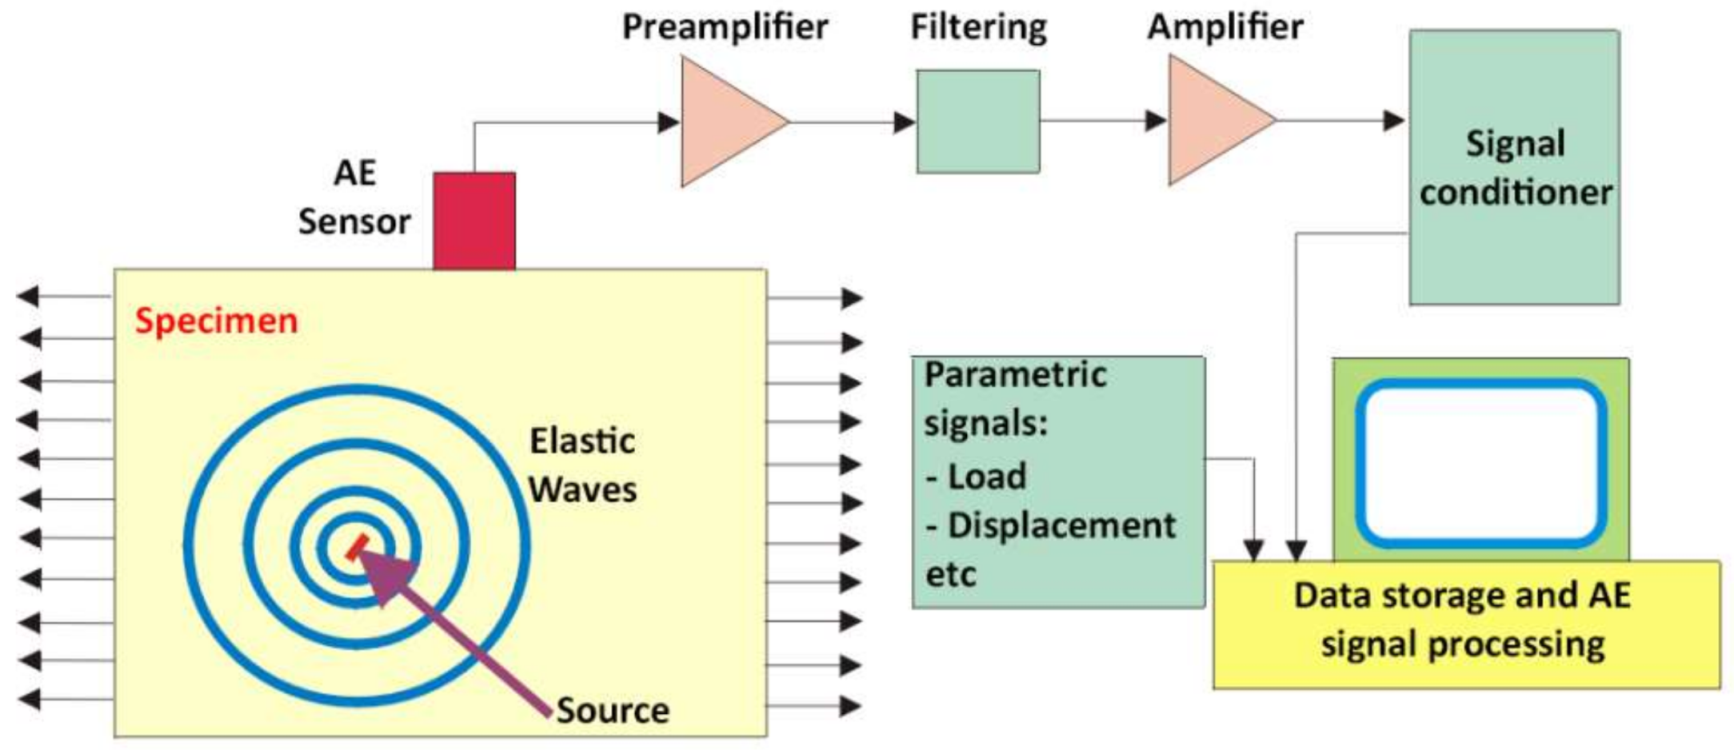
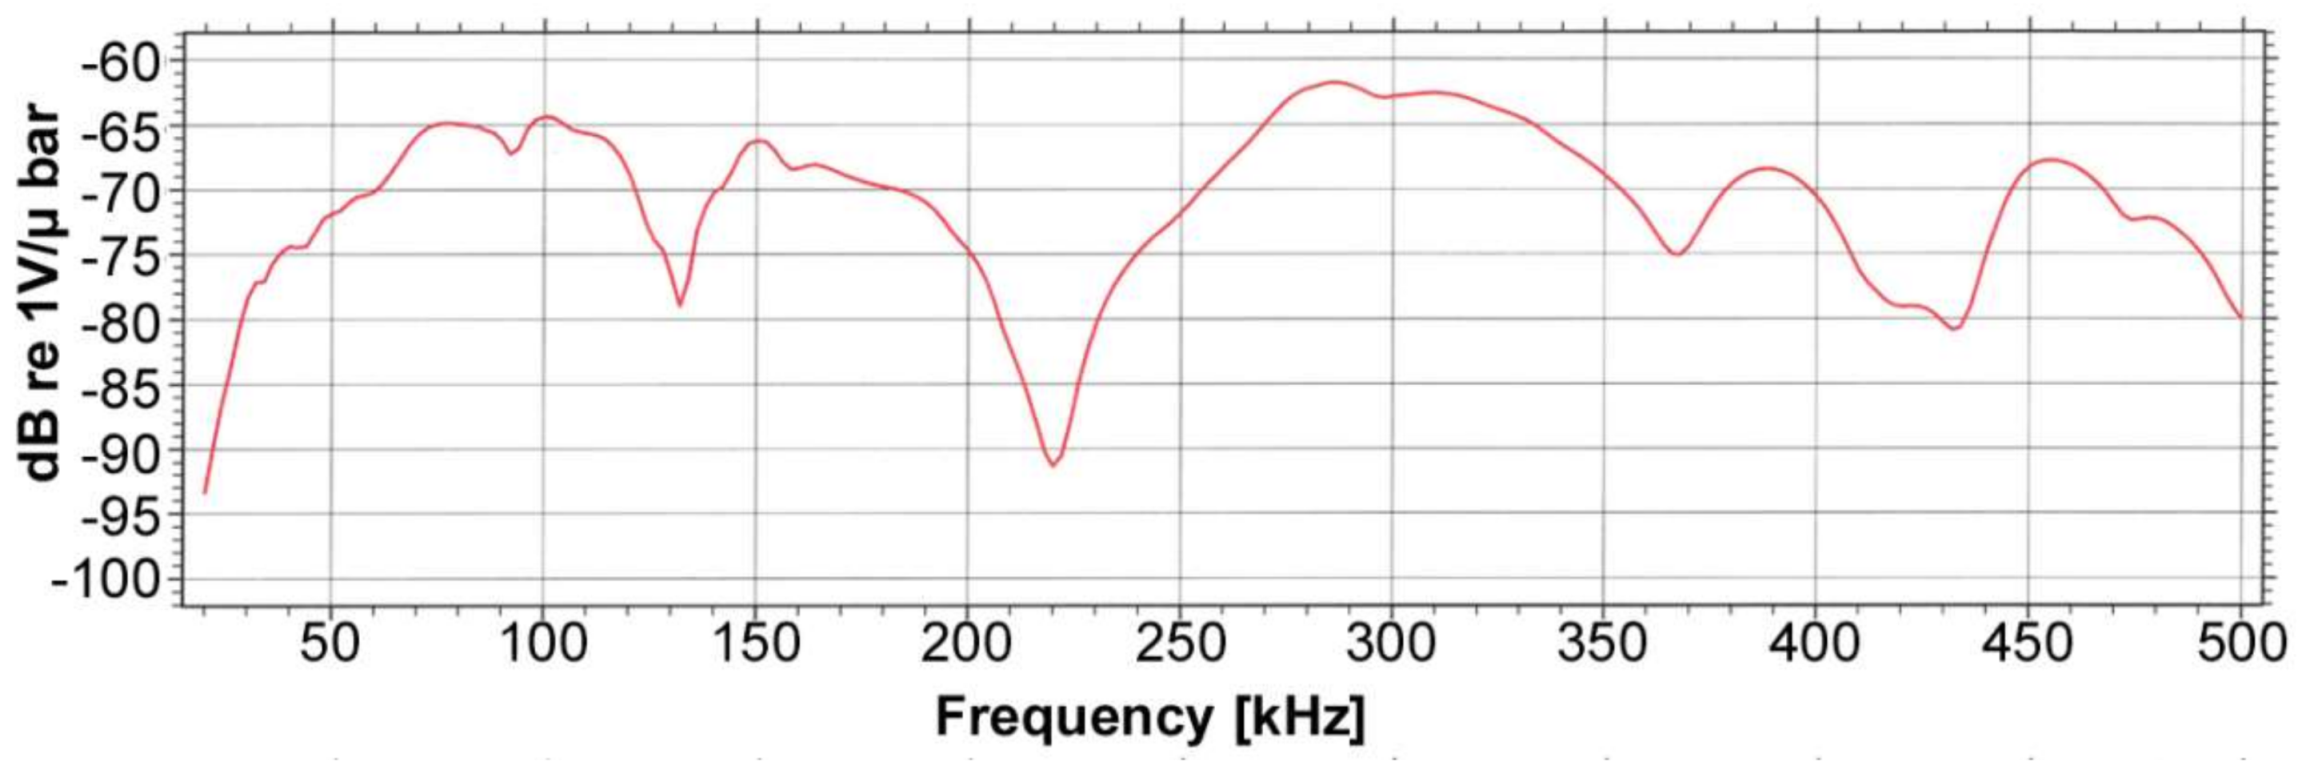
3.2. Multi-Resonant Acoustic Emission Sensors
4. Results
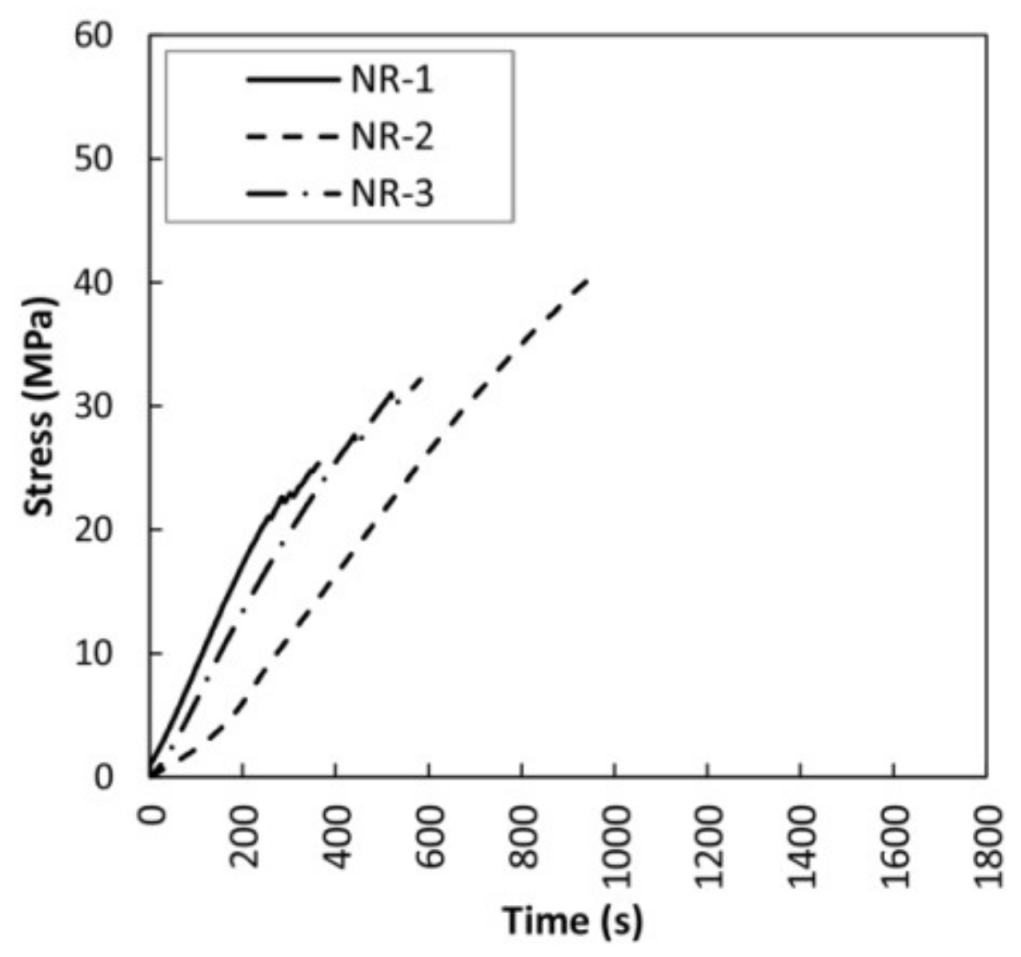
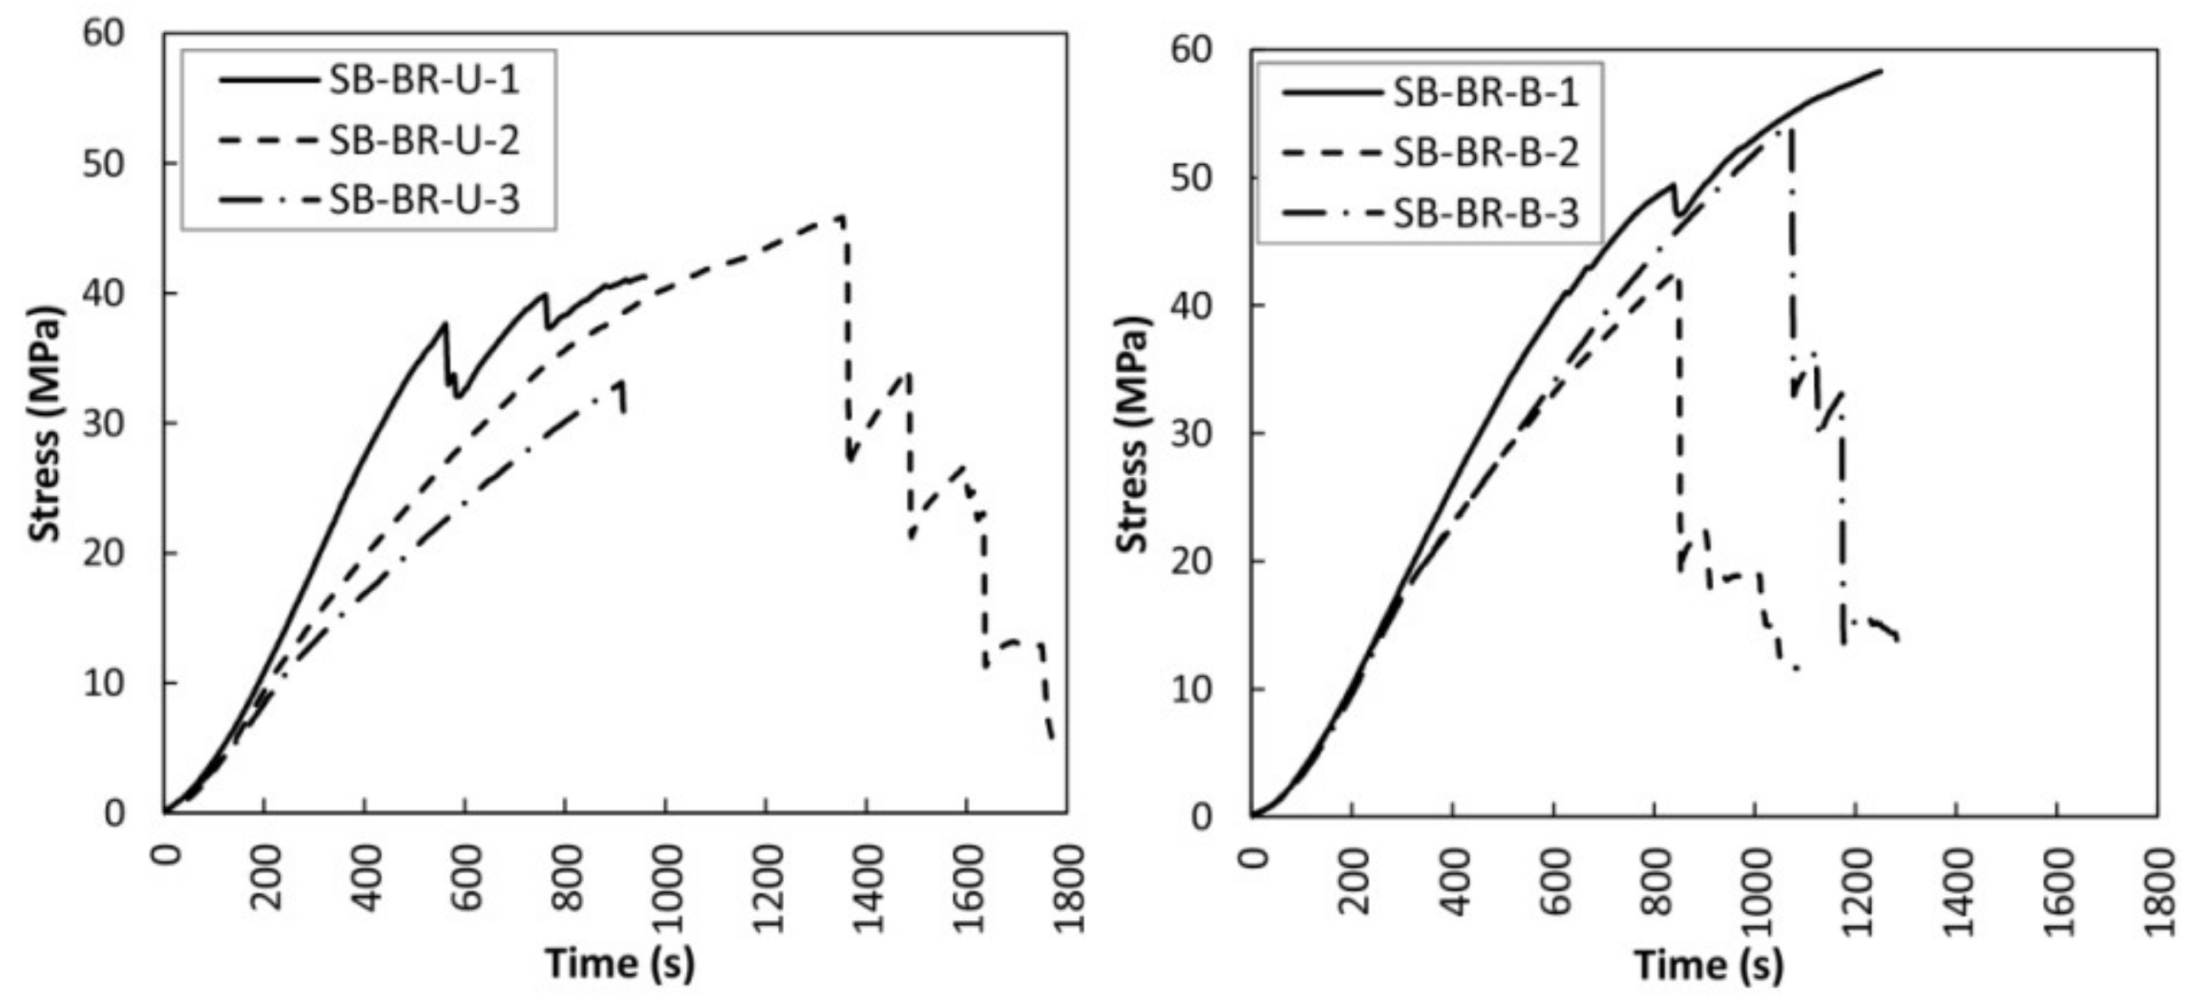
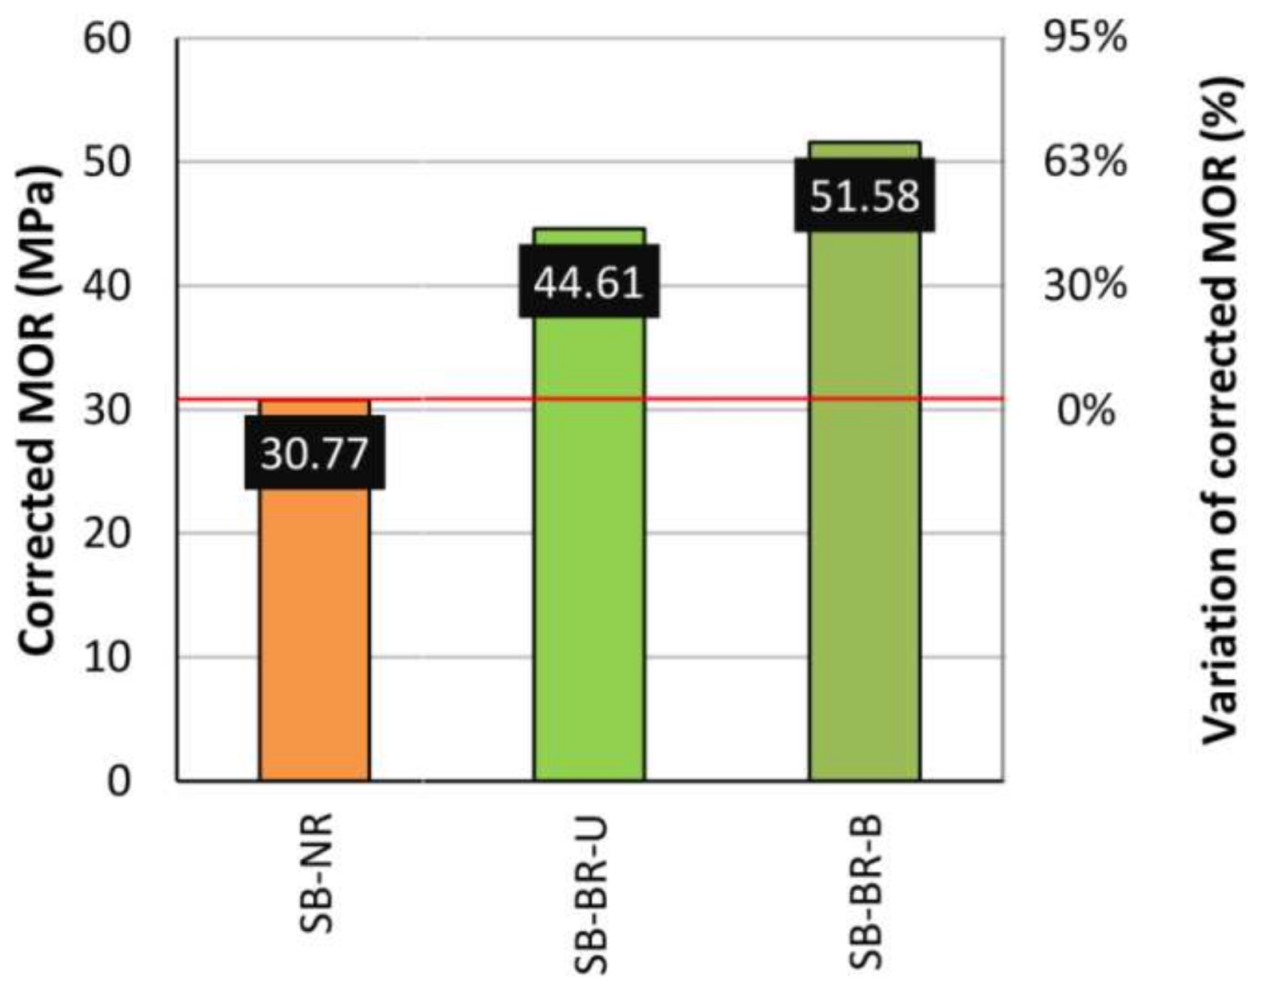
4.1. Mechanical Behavior of Small Beams
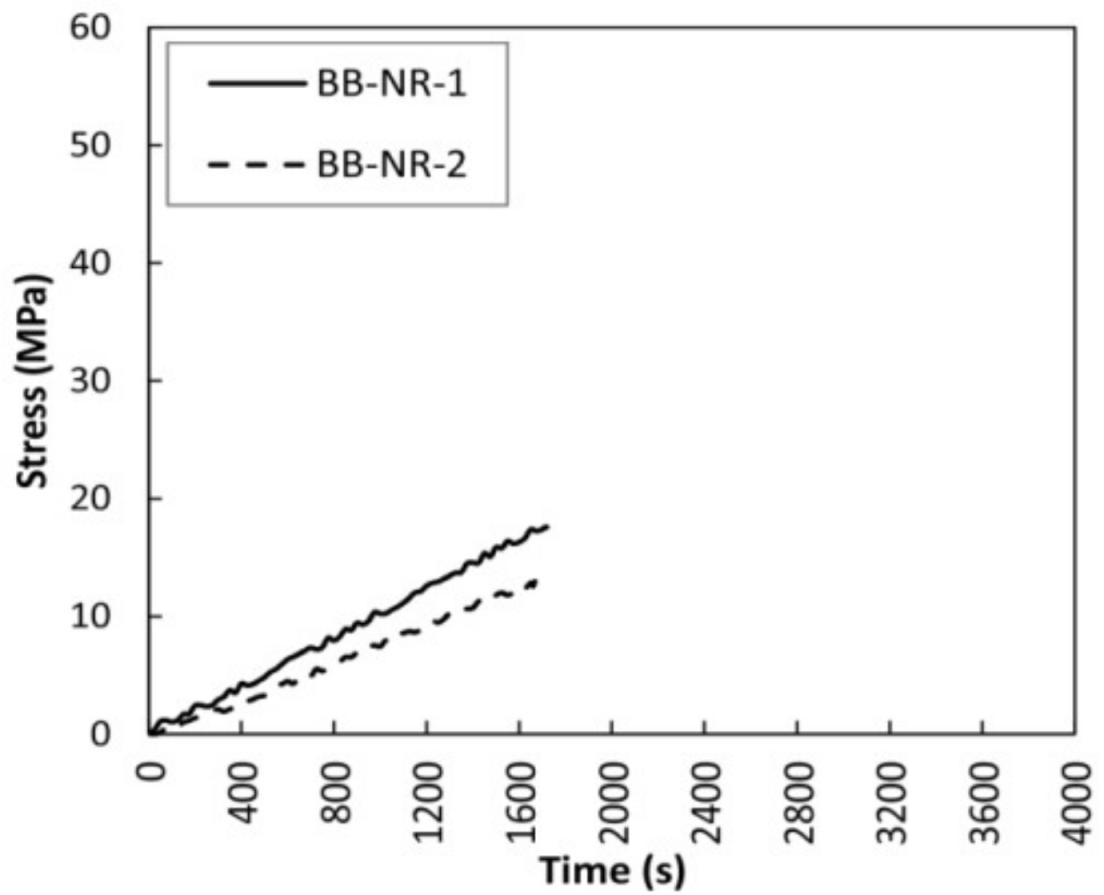
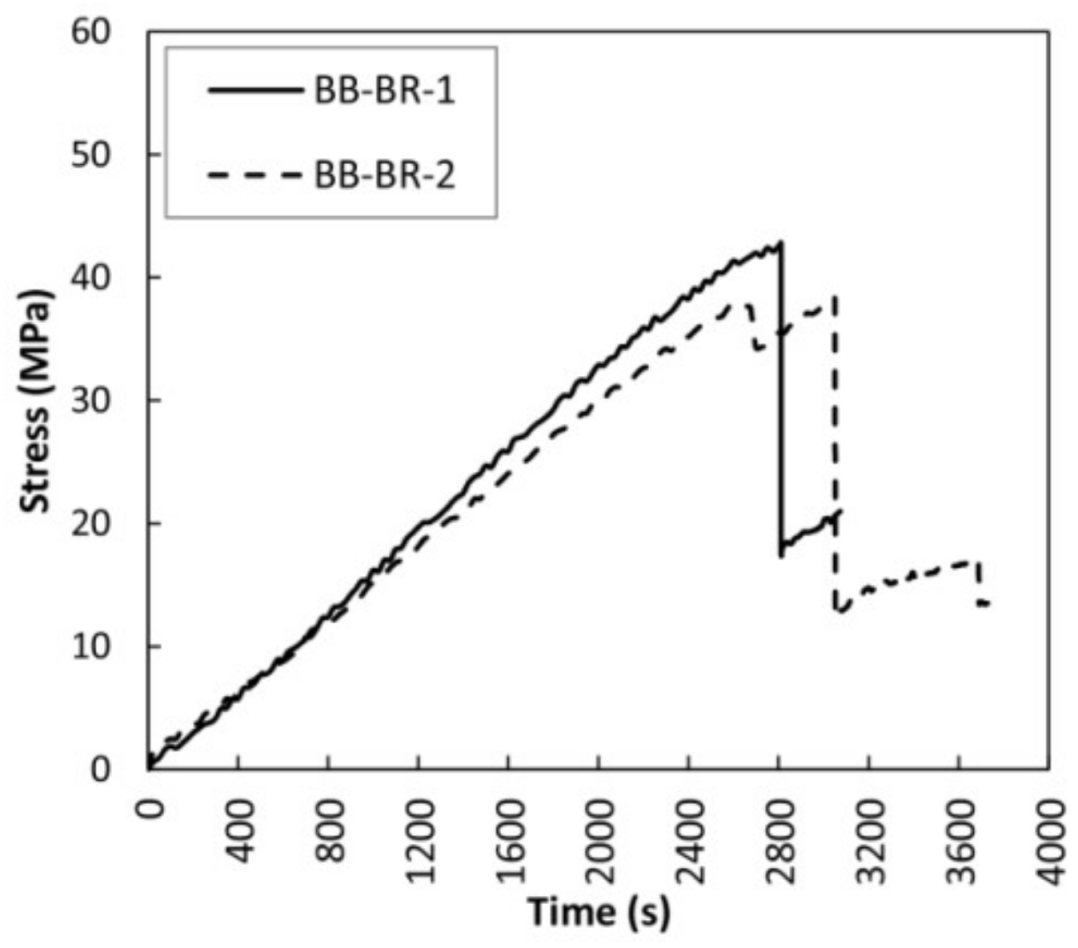
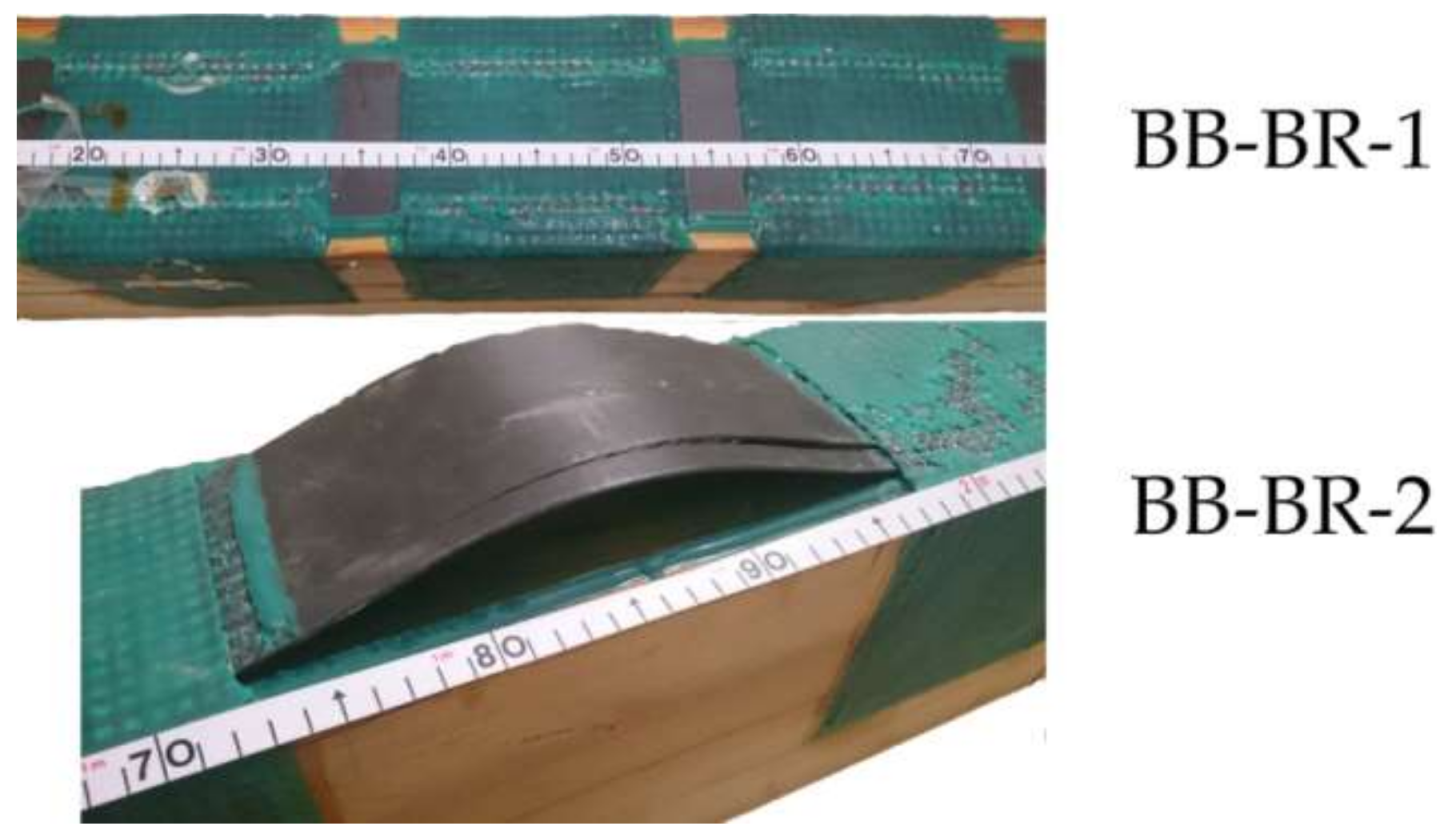
4.2. Mechanical Behavior of Large Beams
4.3. Sensors Monitoring Results
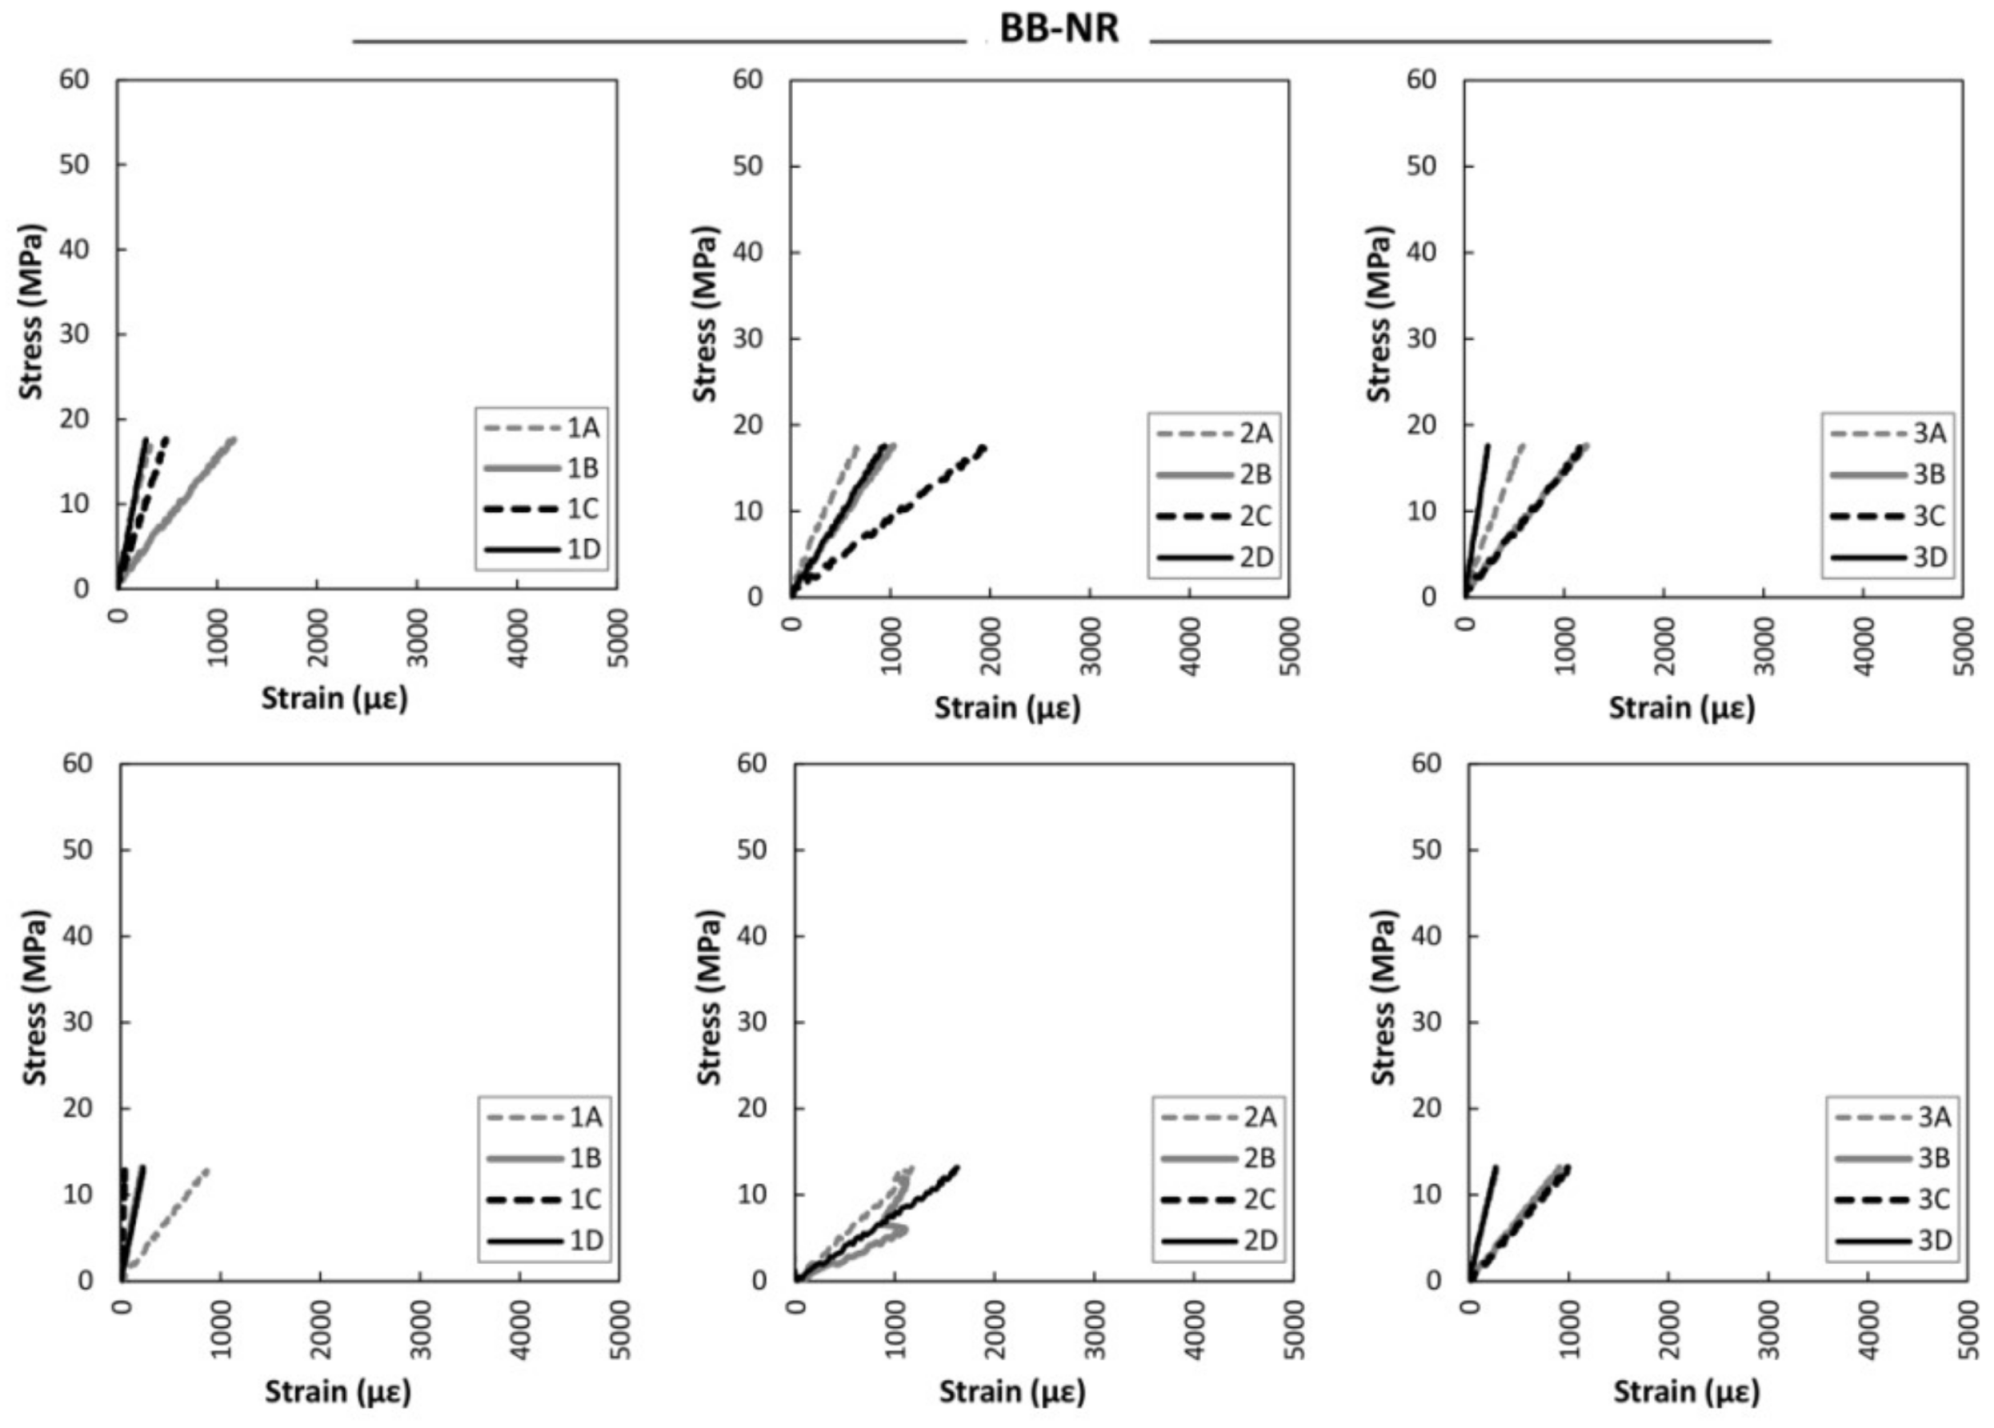
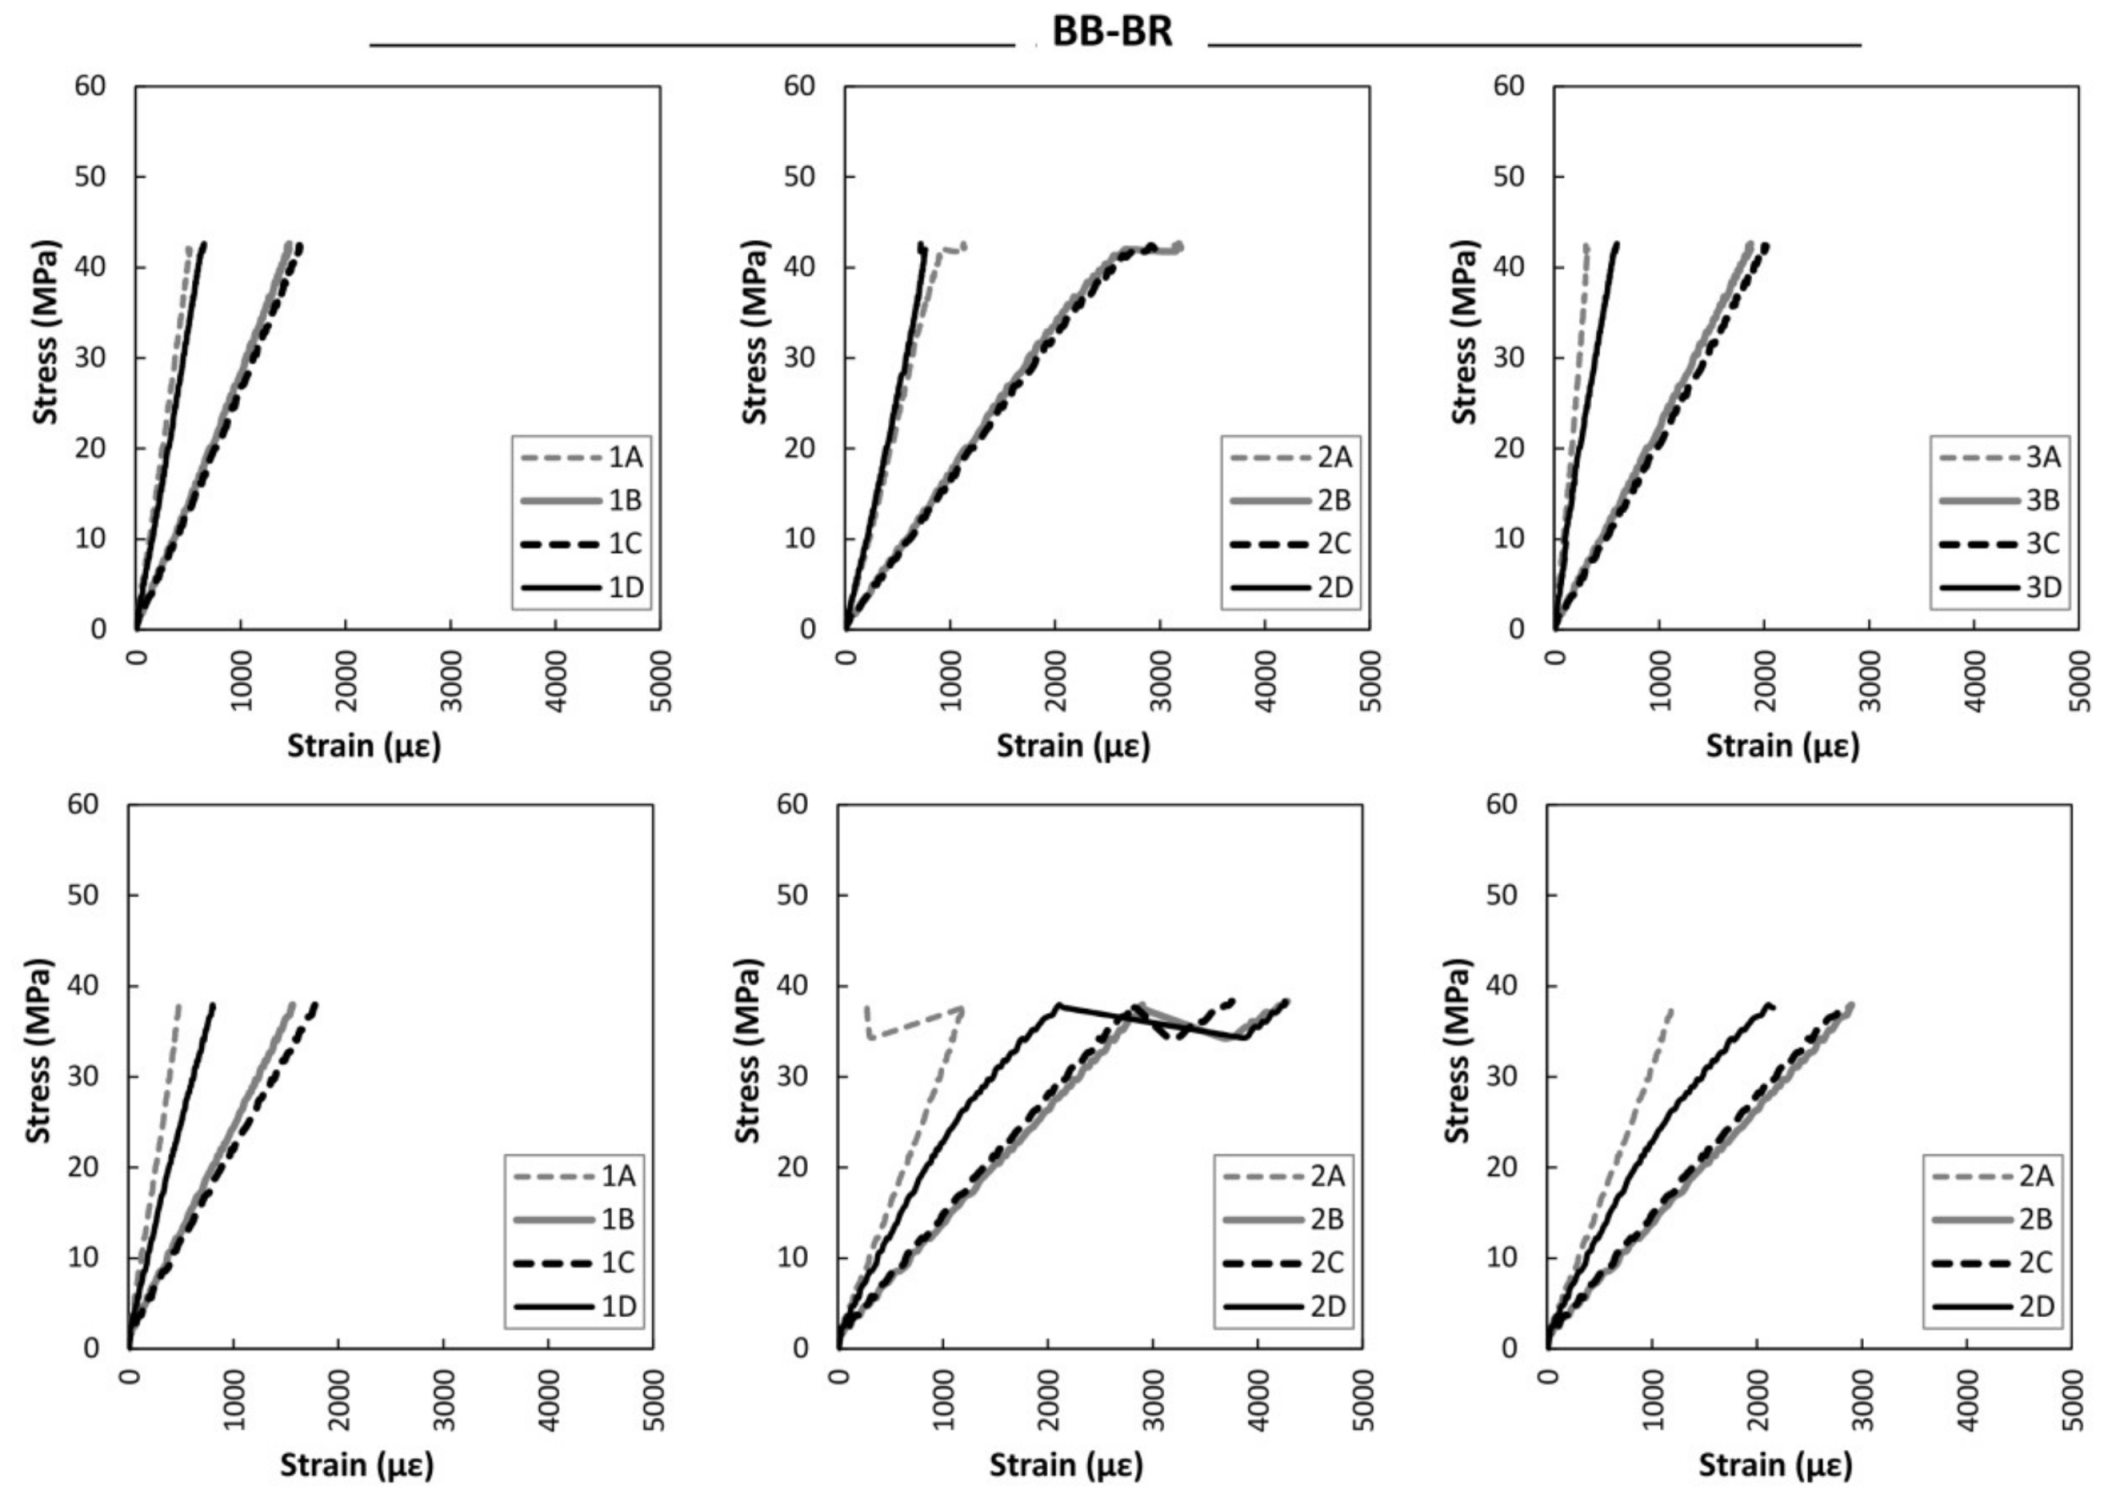
4.3.1. Strain Sensors Data
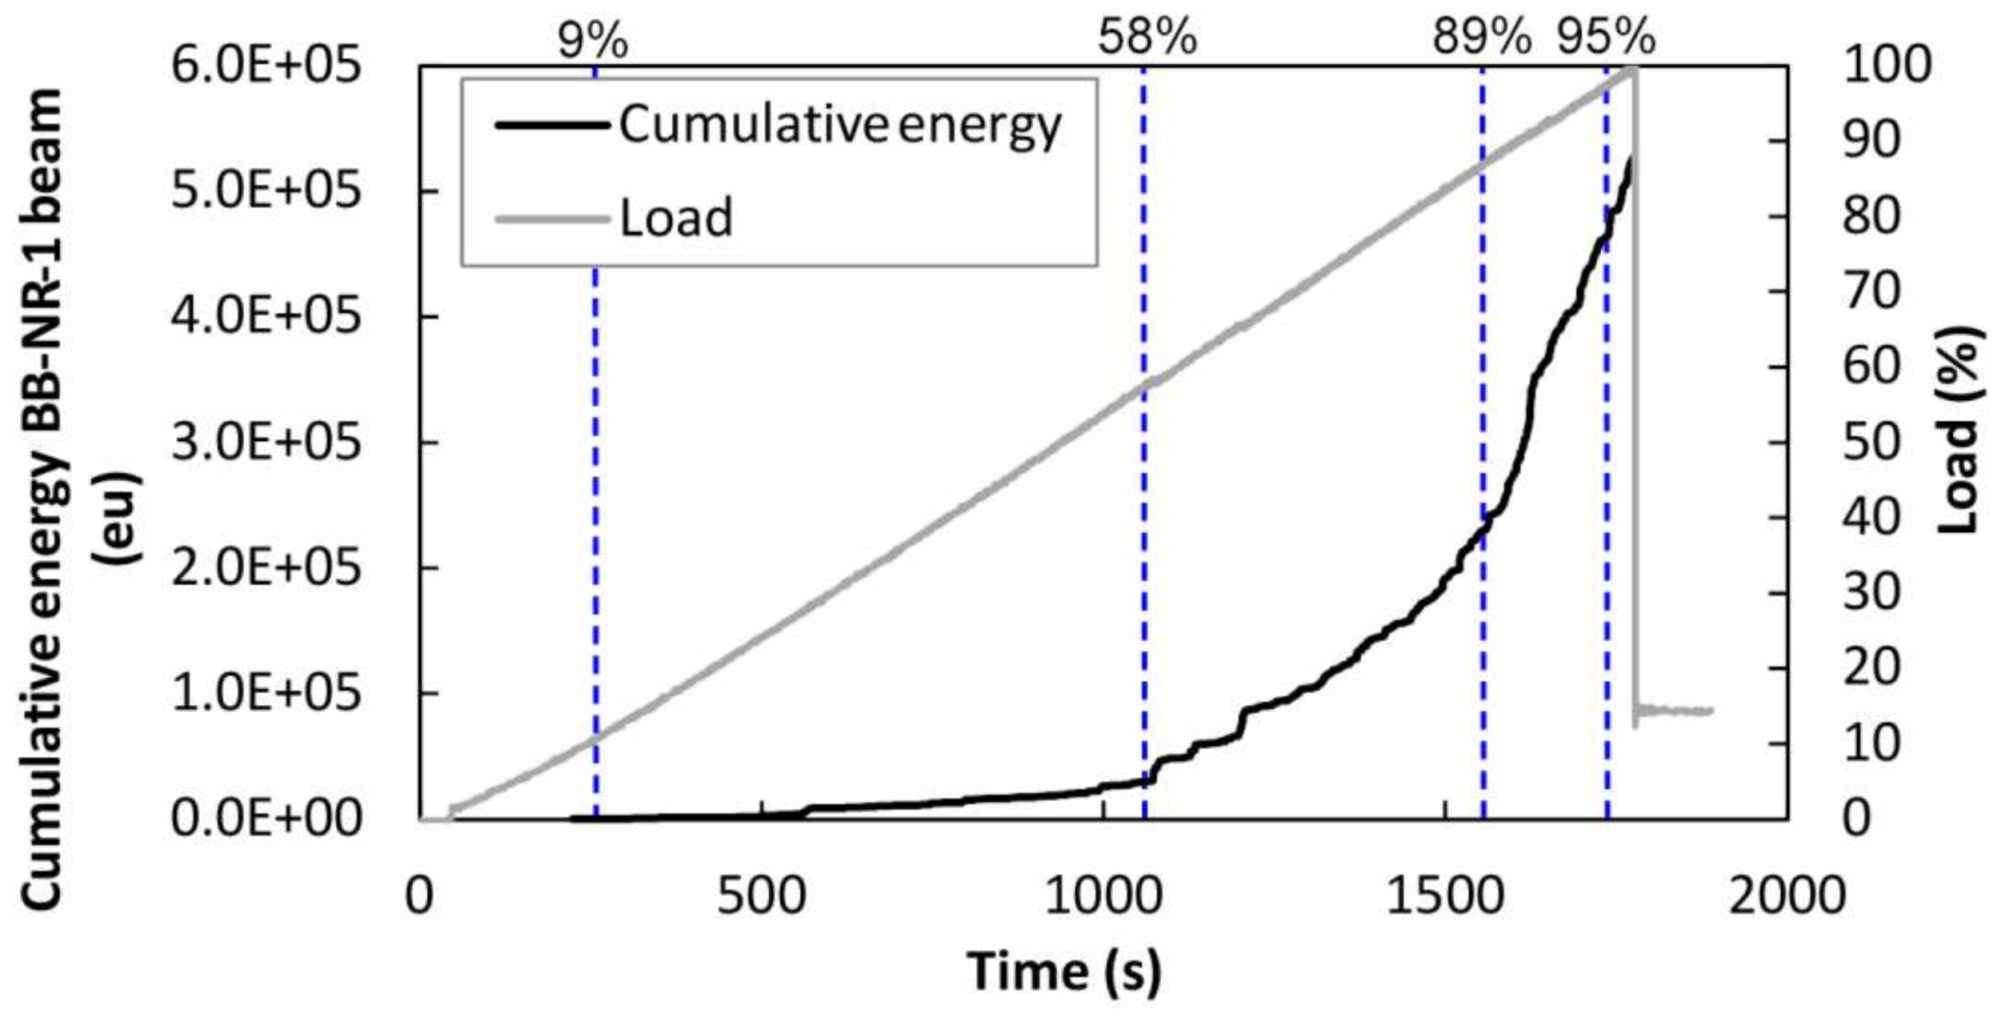
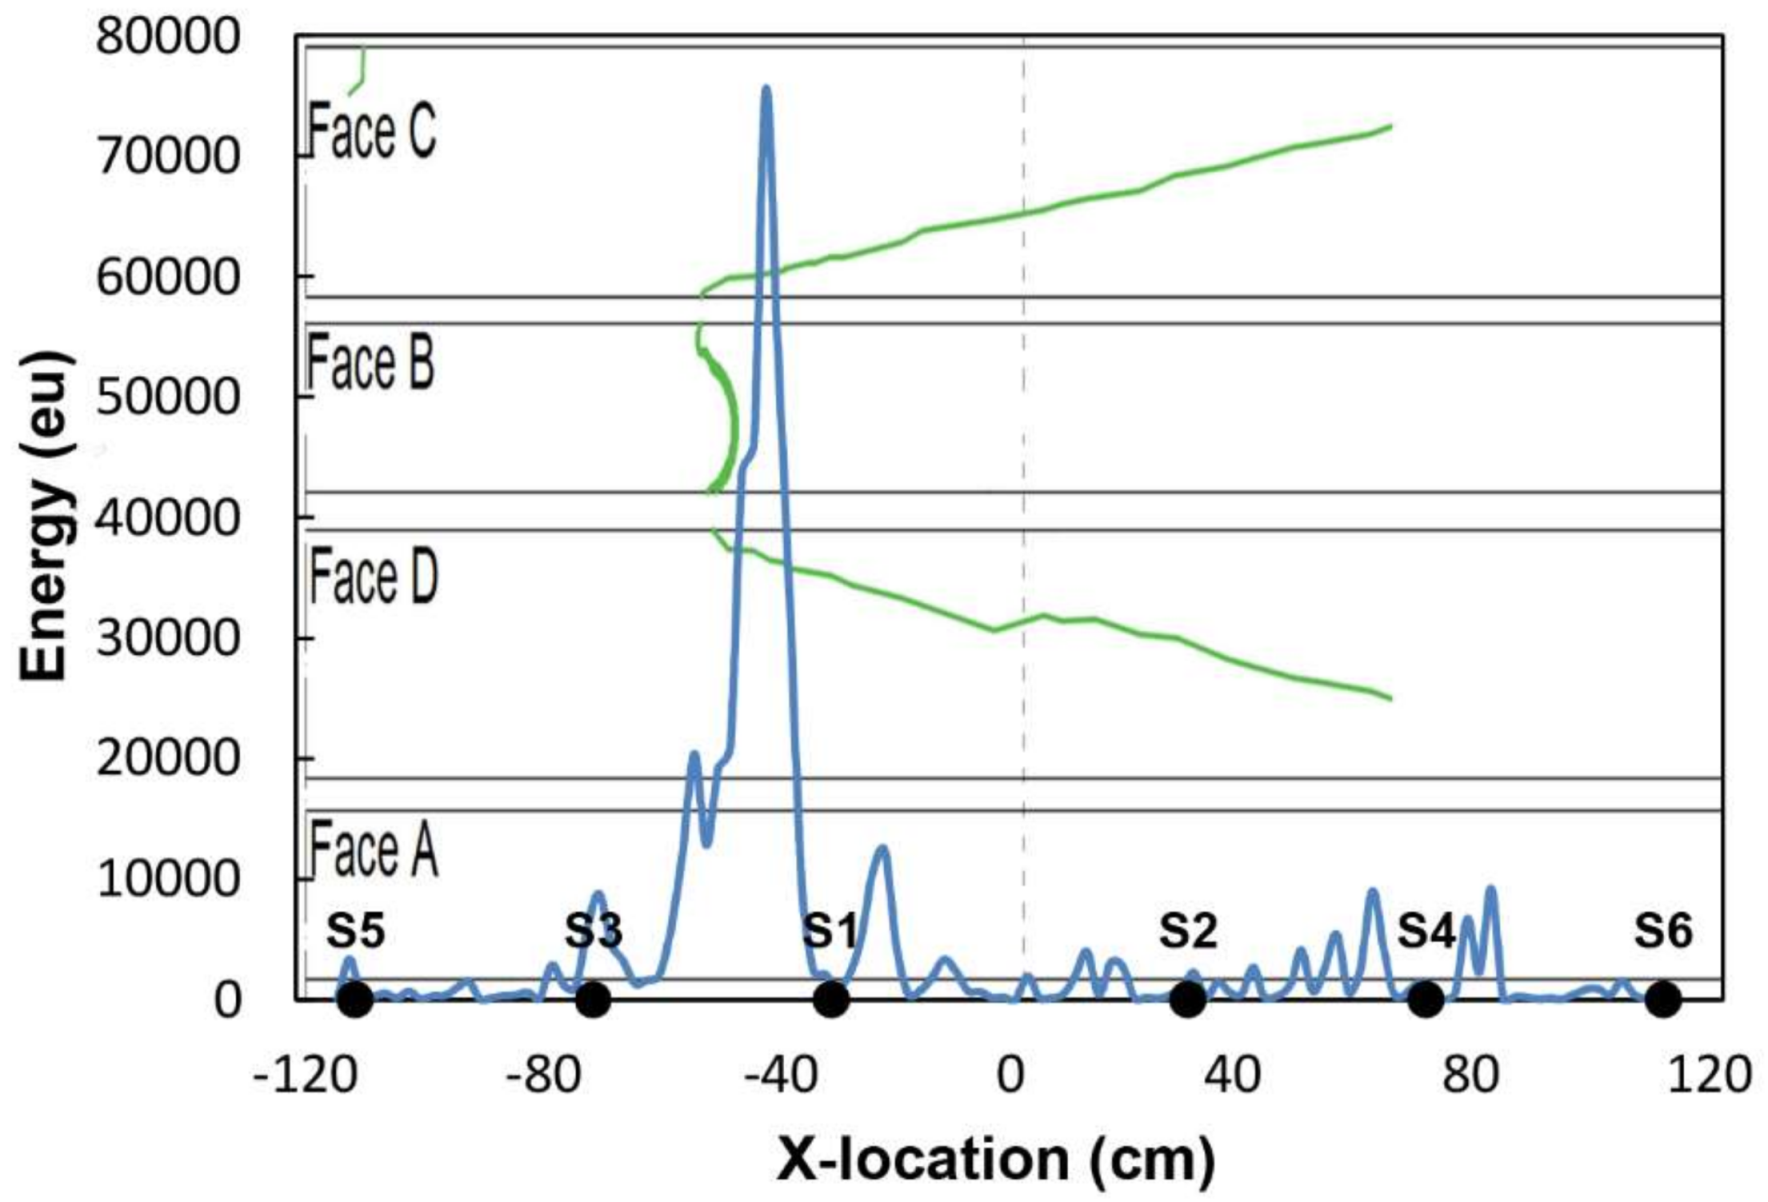
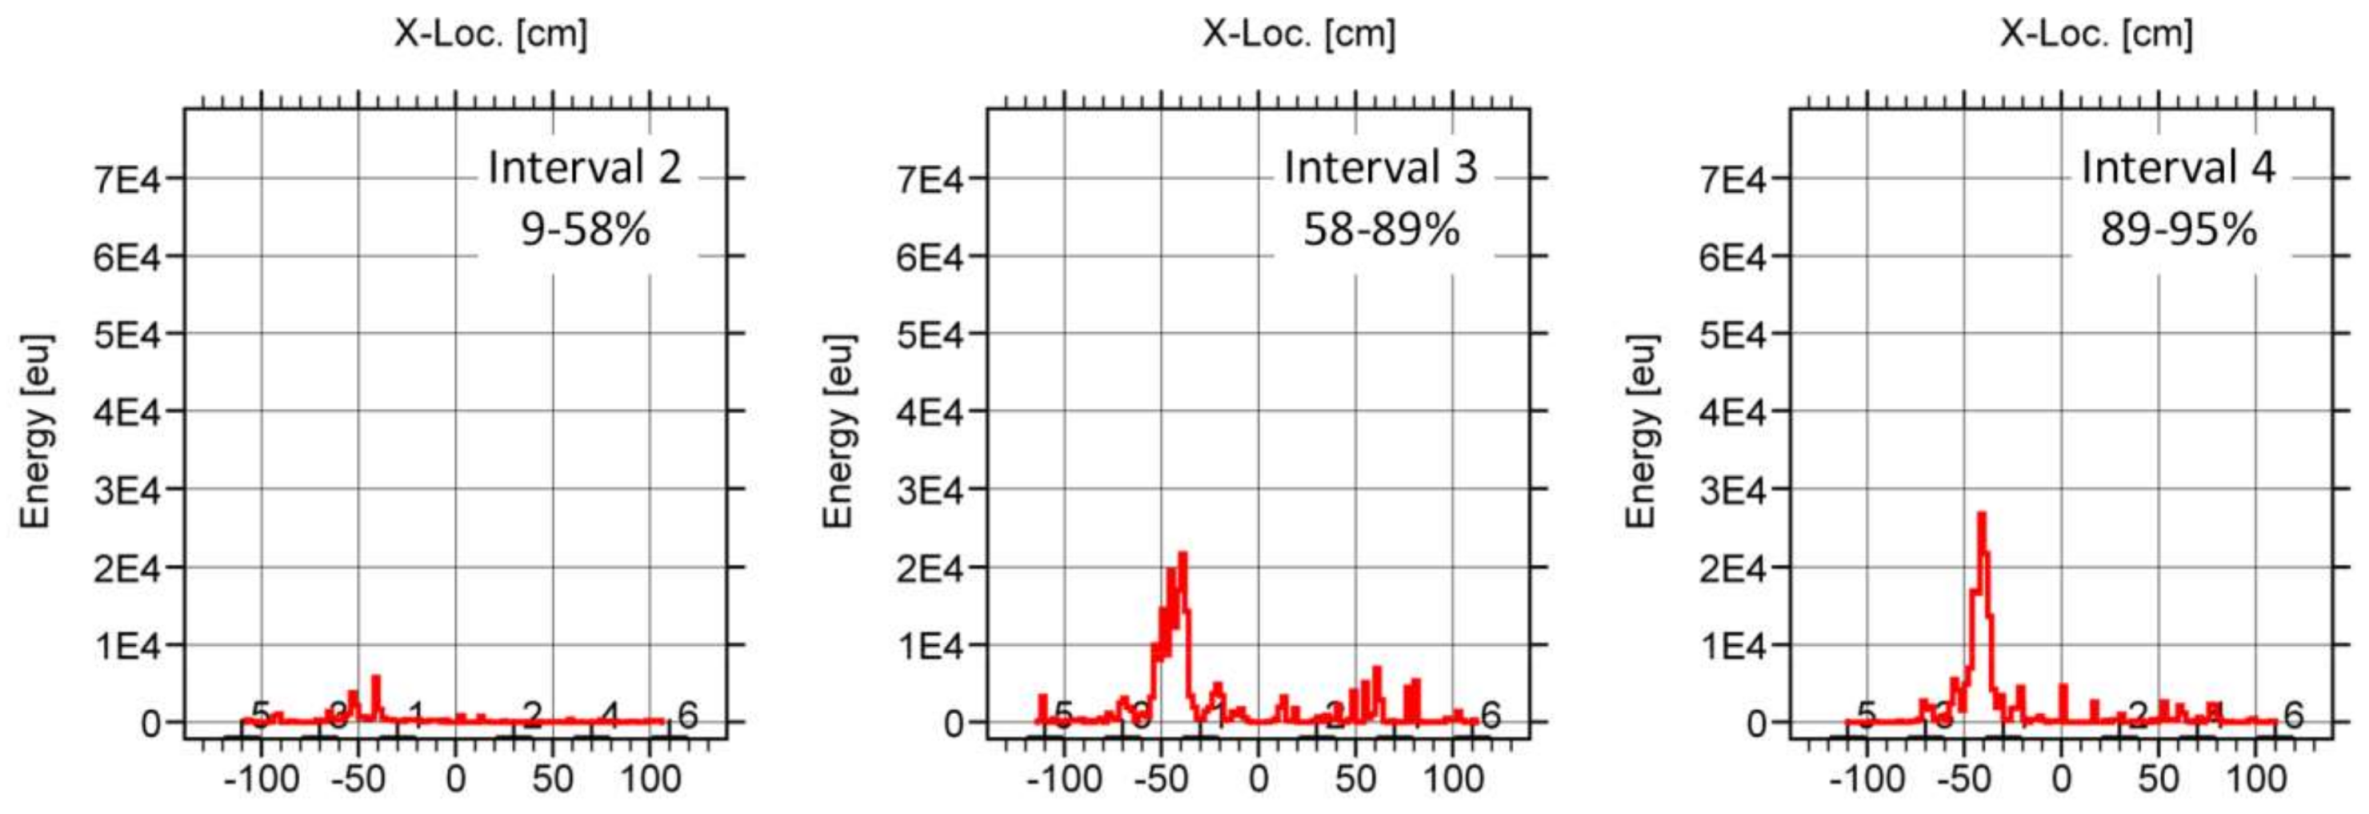
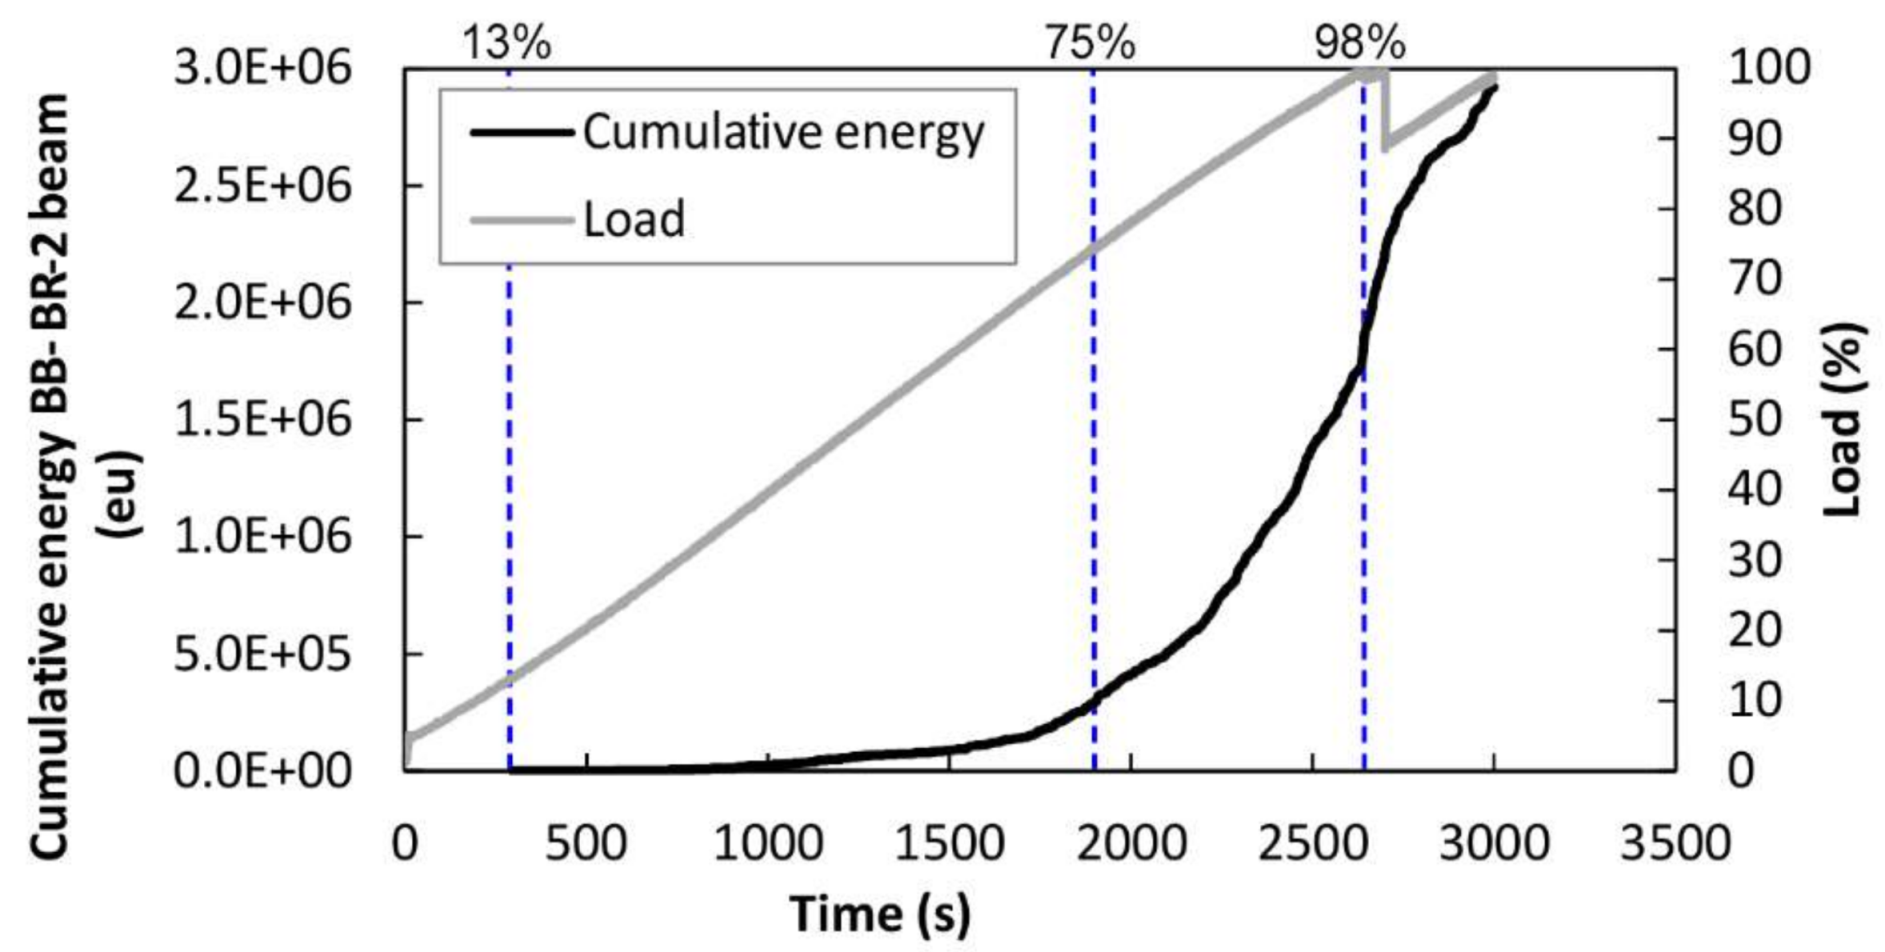
4.3.2. AE Sensors Results
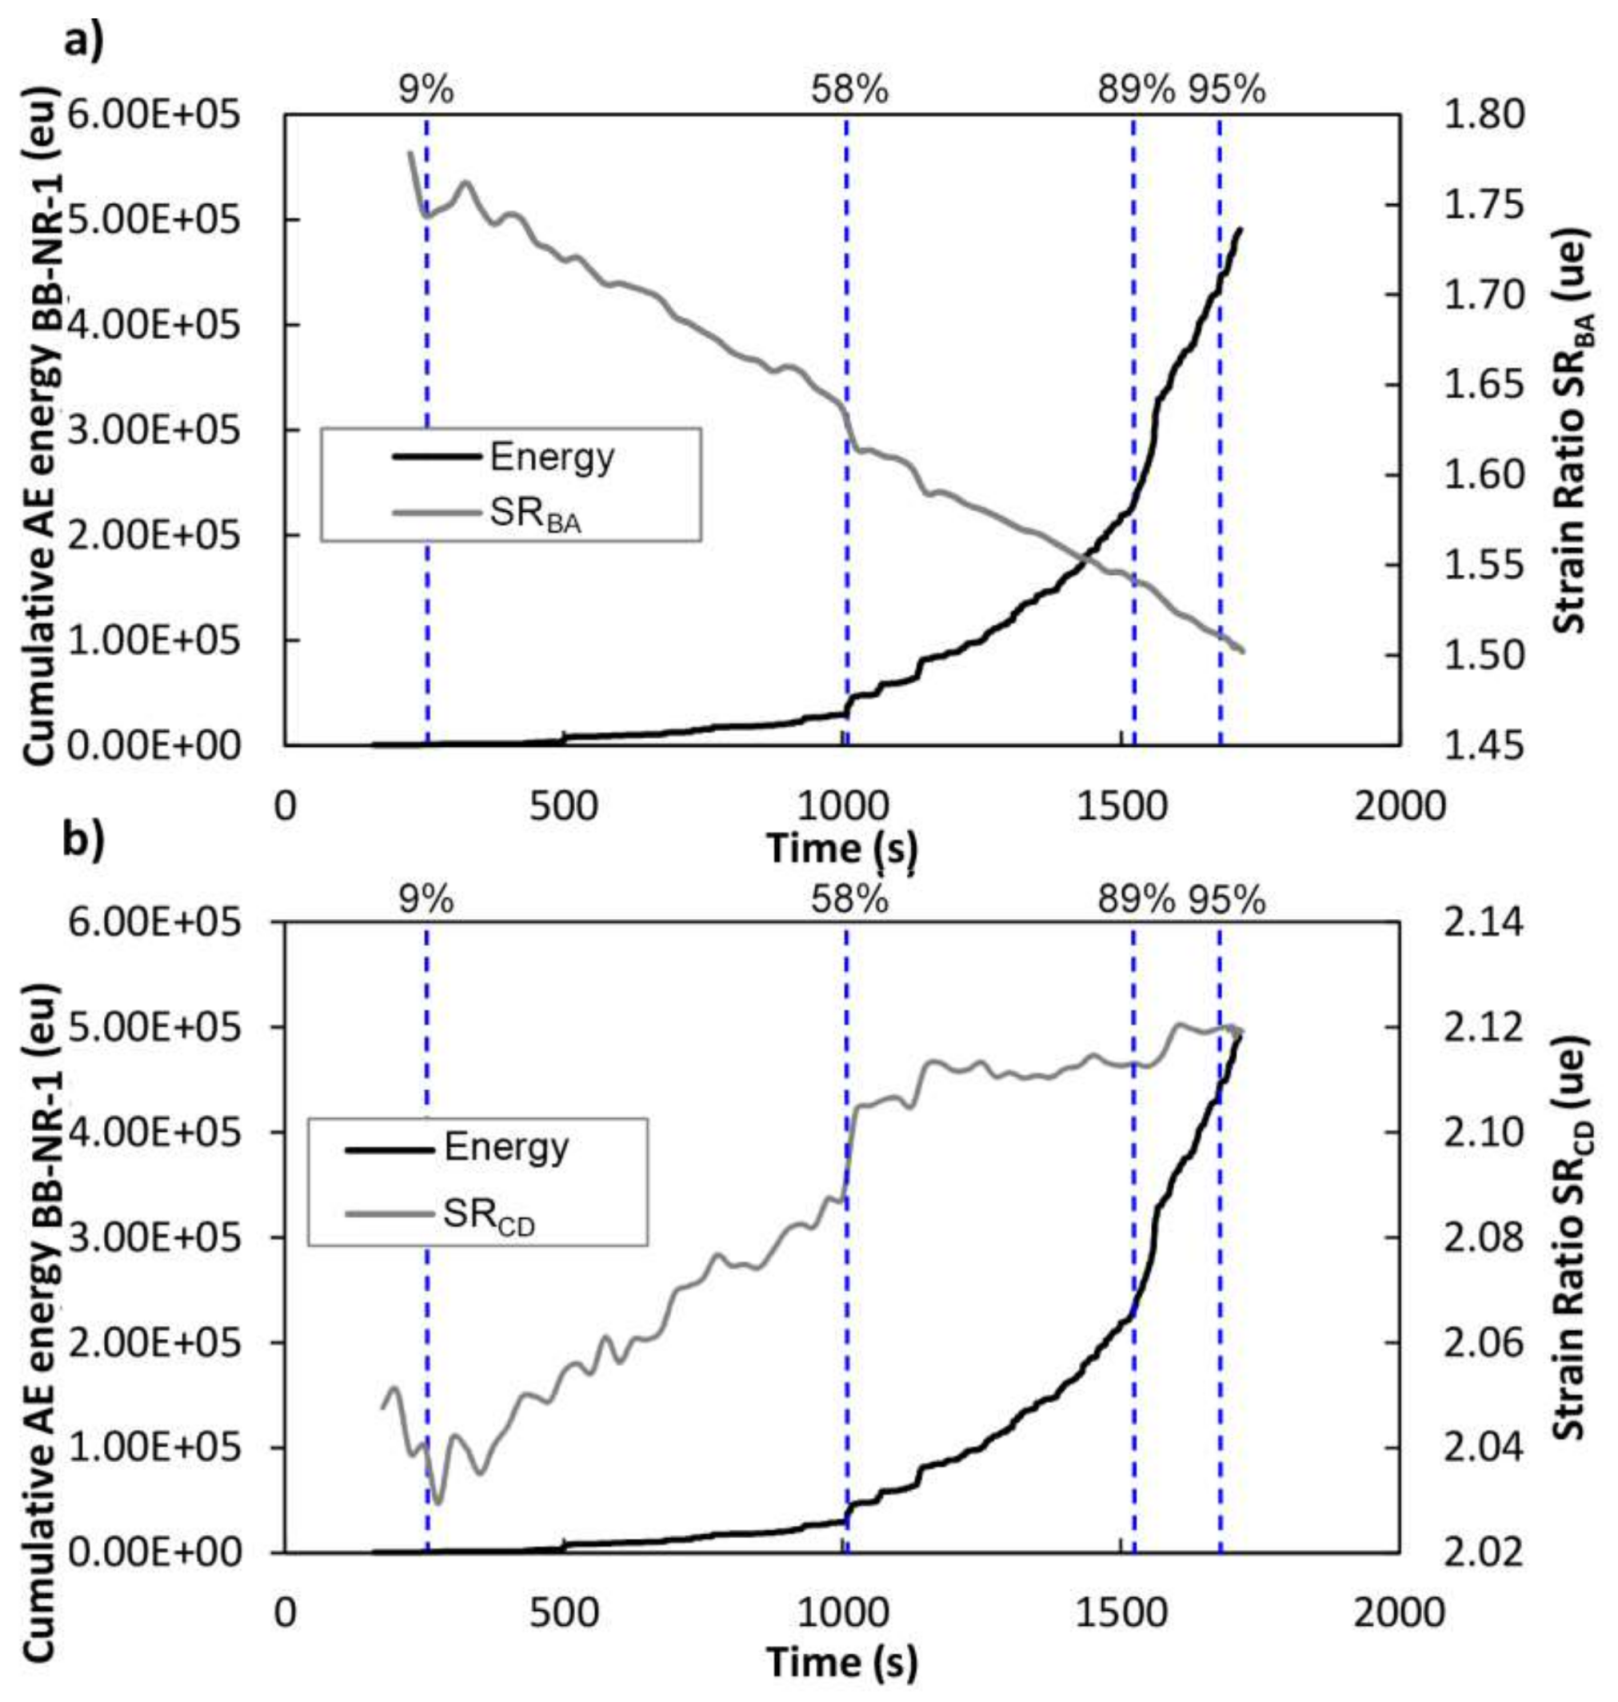
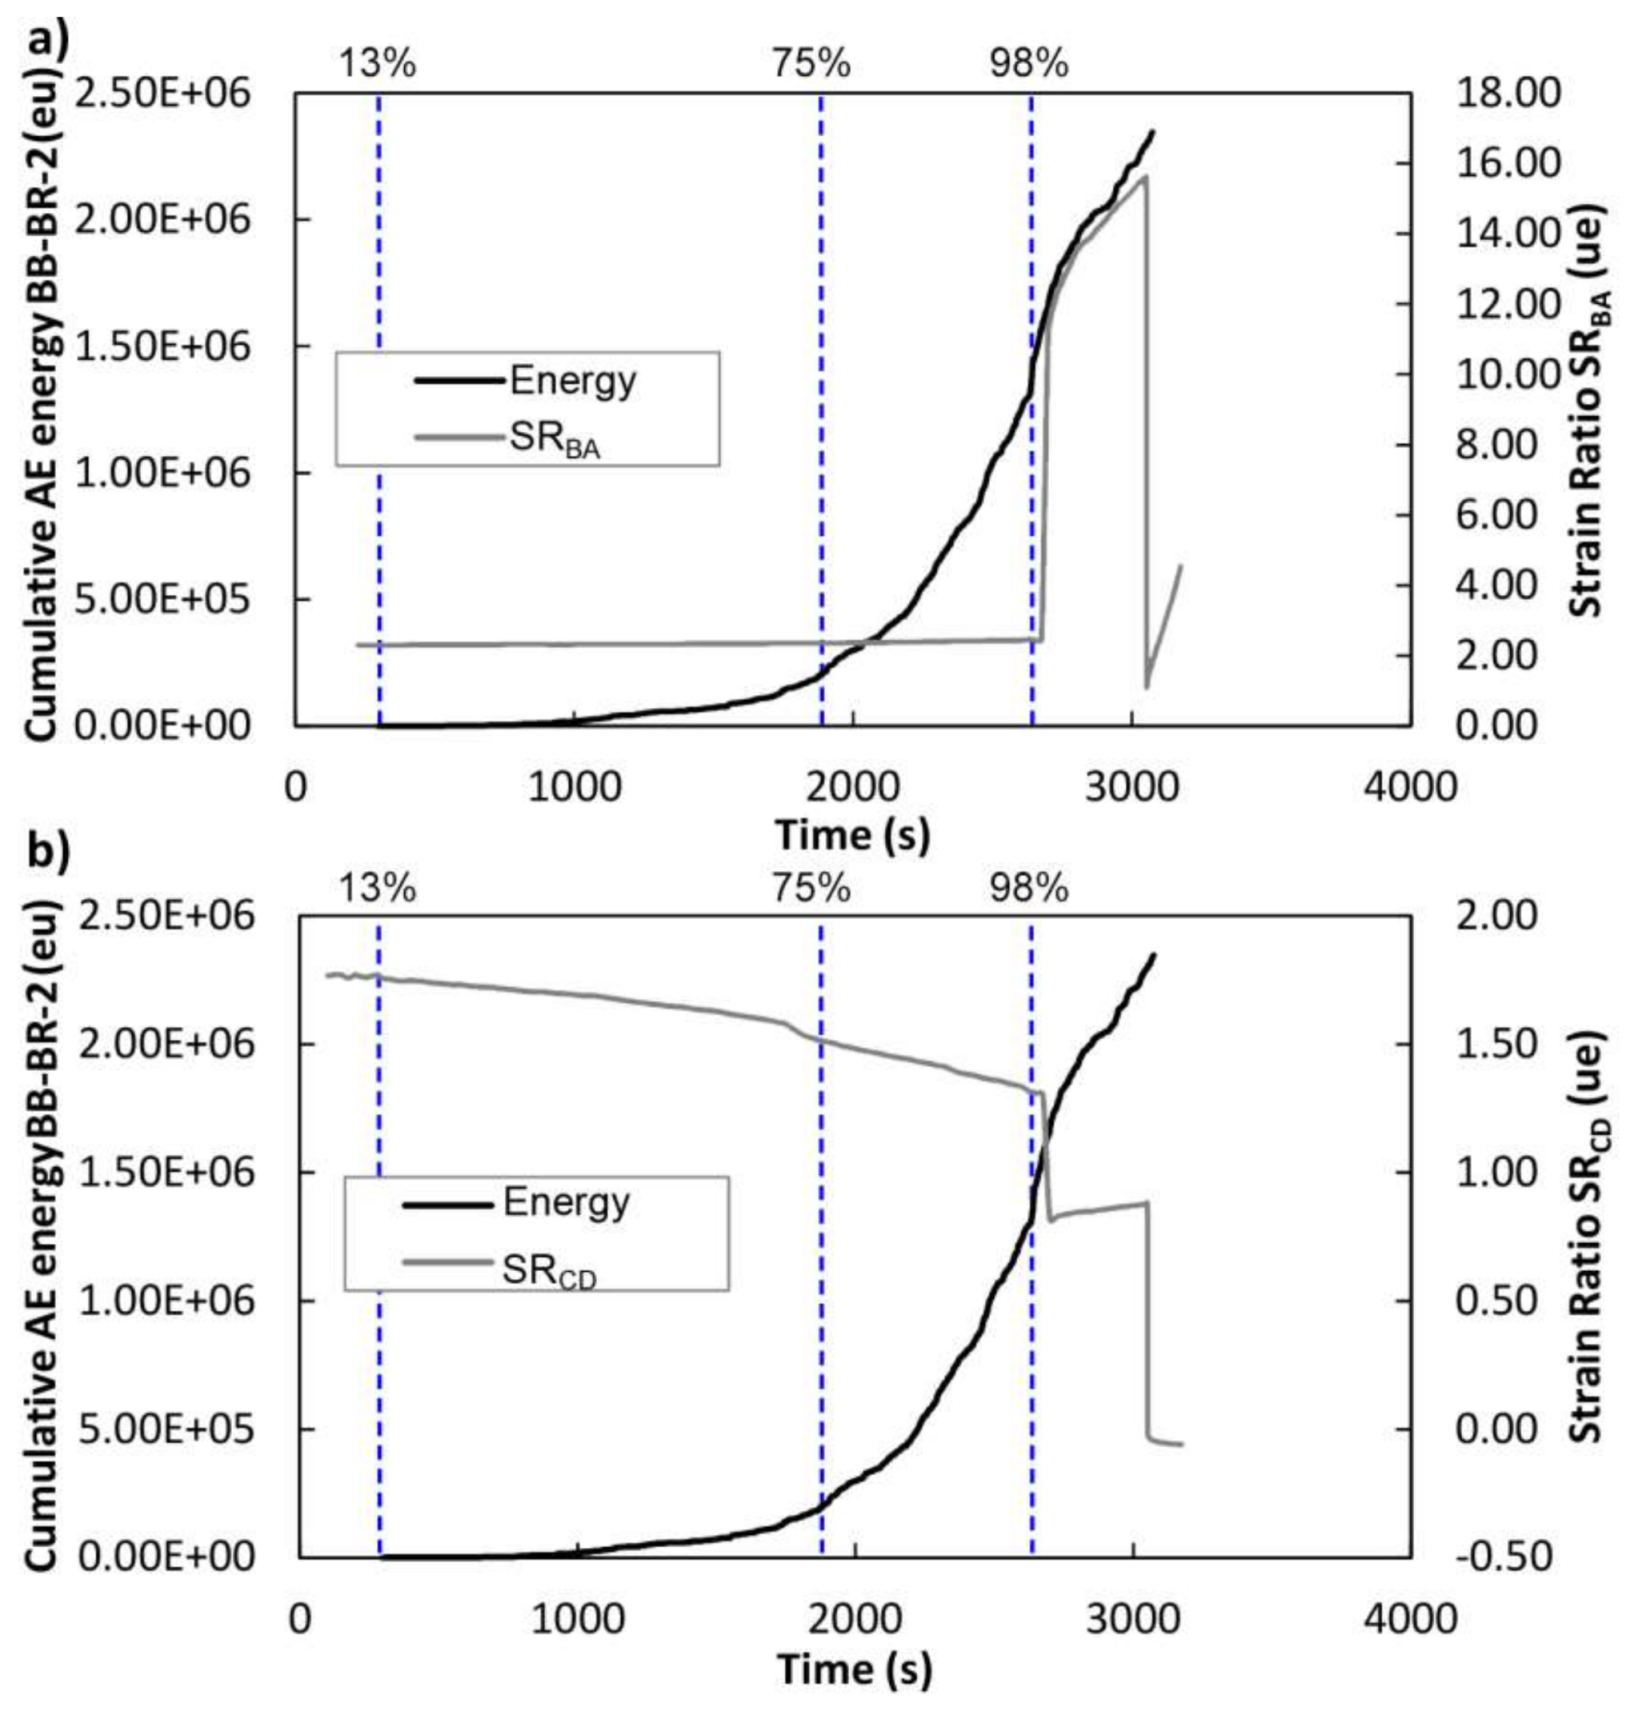
4.3.3. Comparison of AE and Strain Sensors Measurements
5. Conclusions
- The increasing level of damage in the element induces very significant increases in the released AE, a key point when considering structural safety.
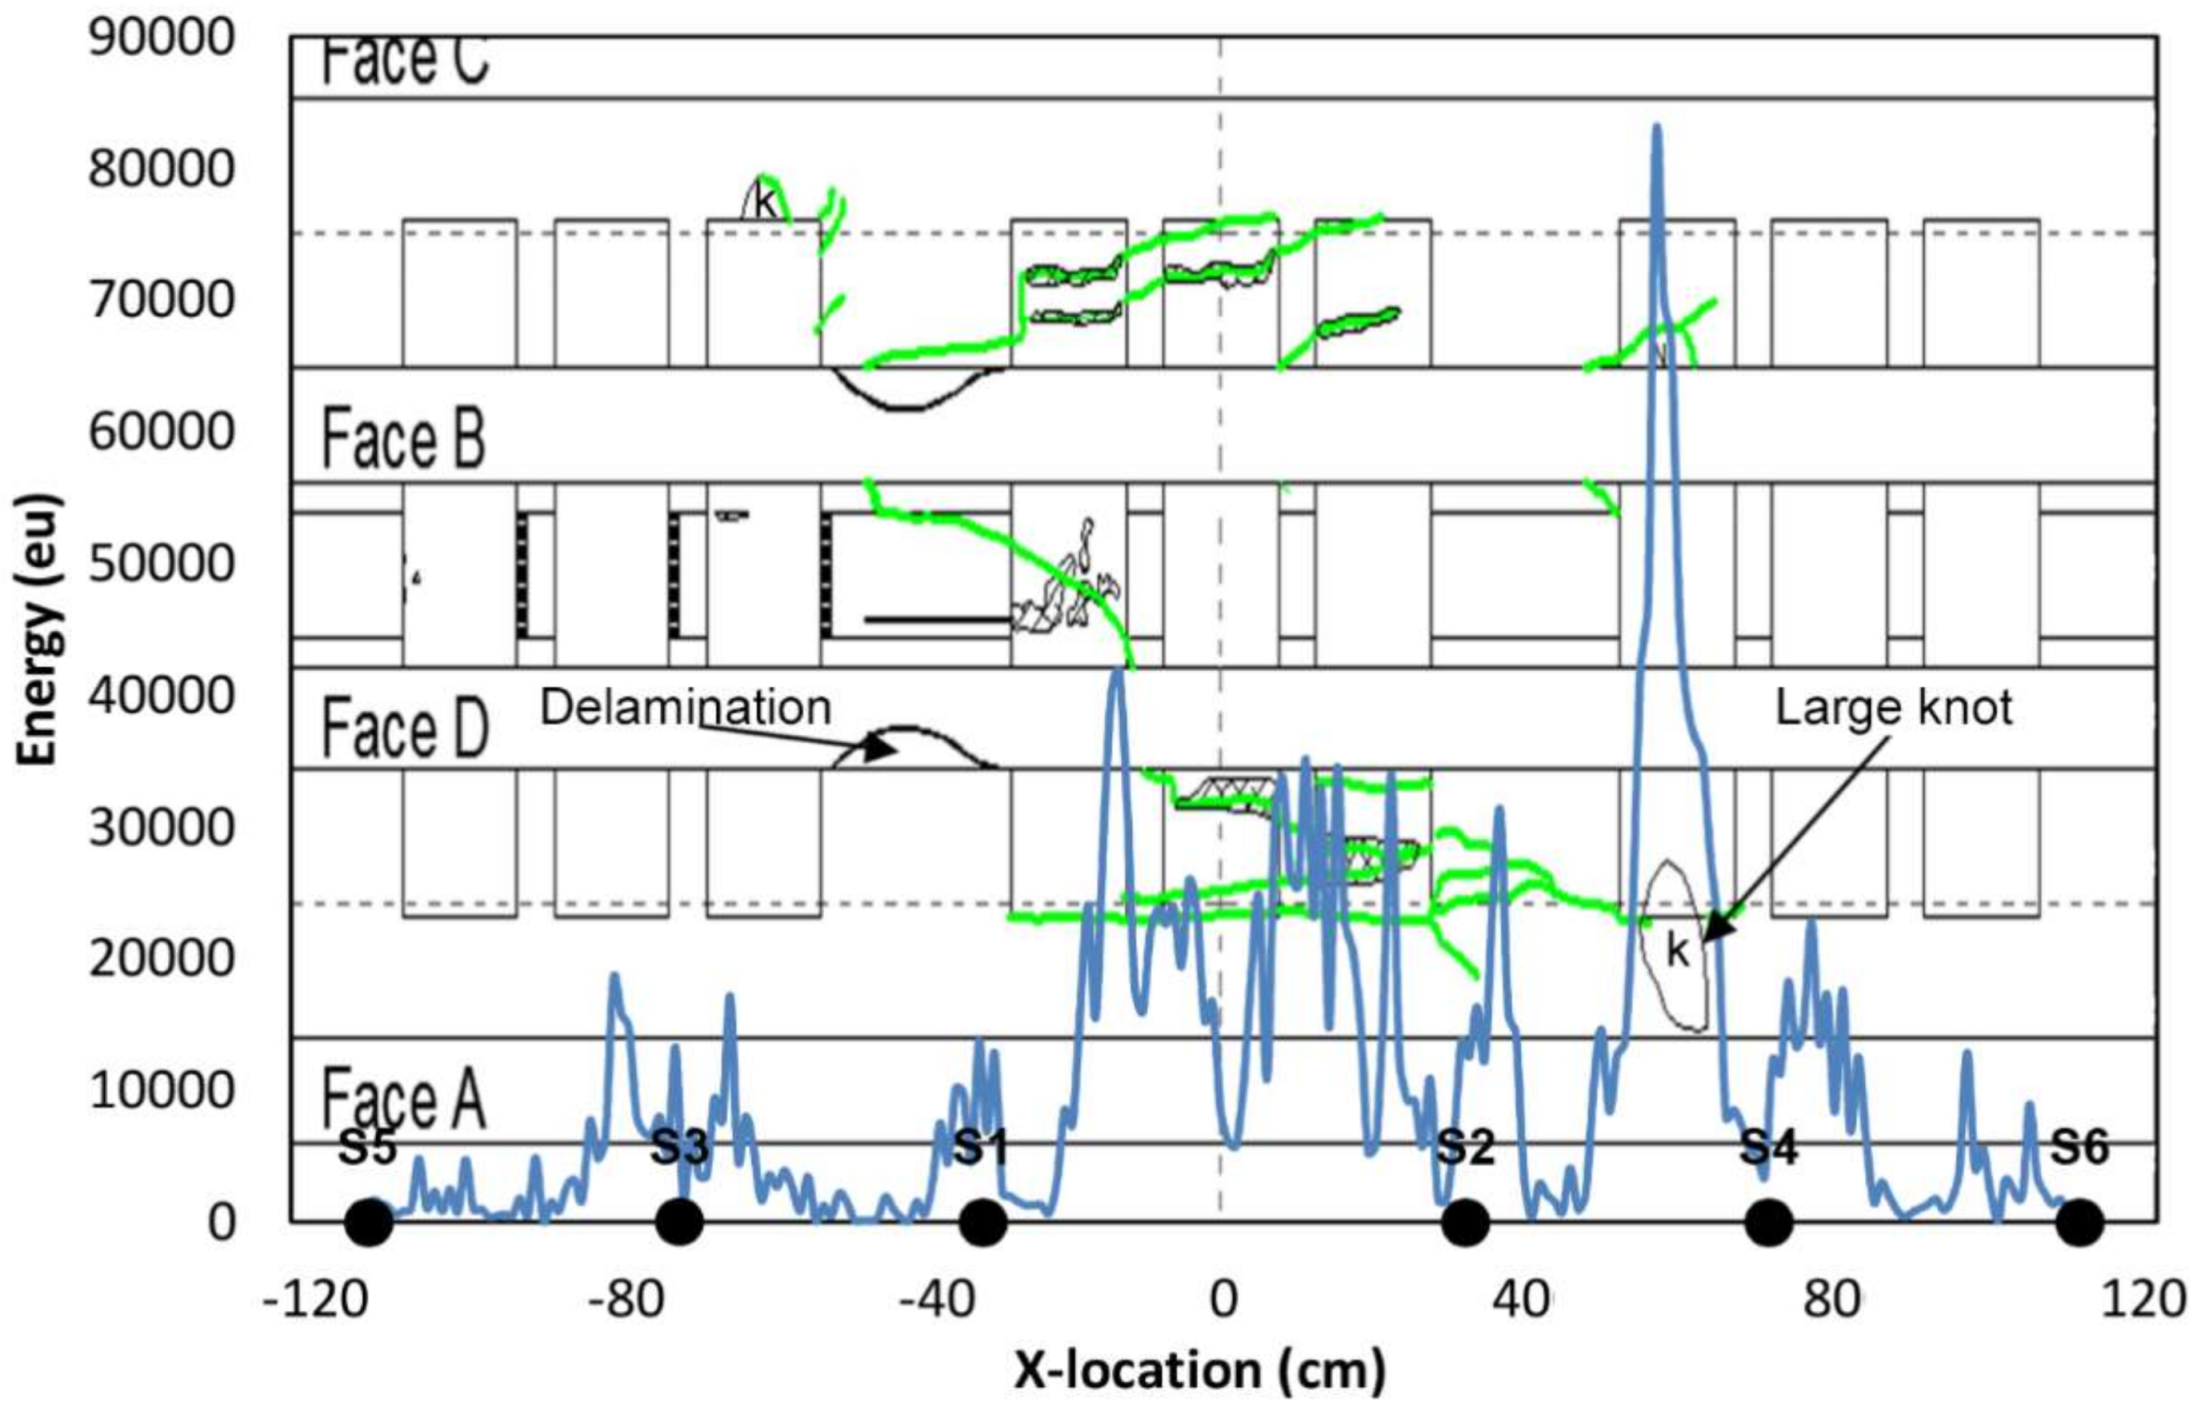
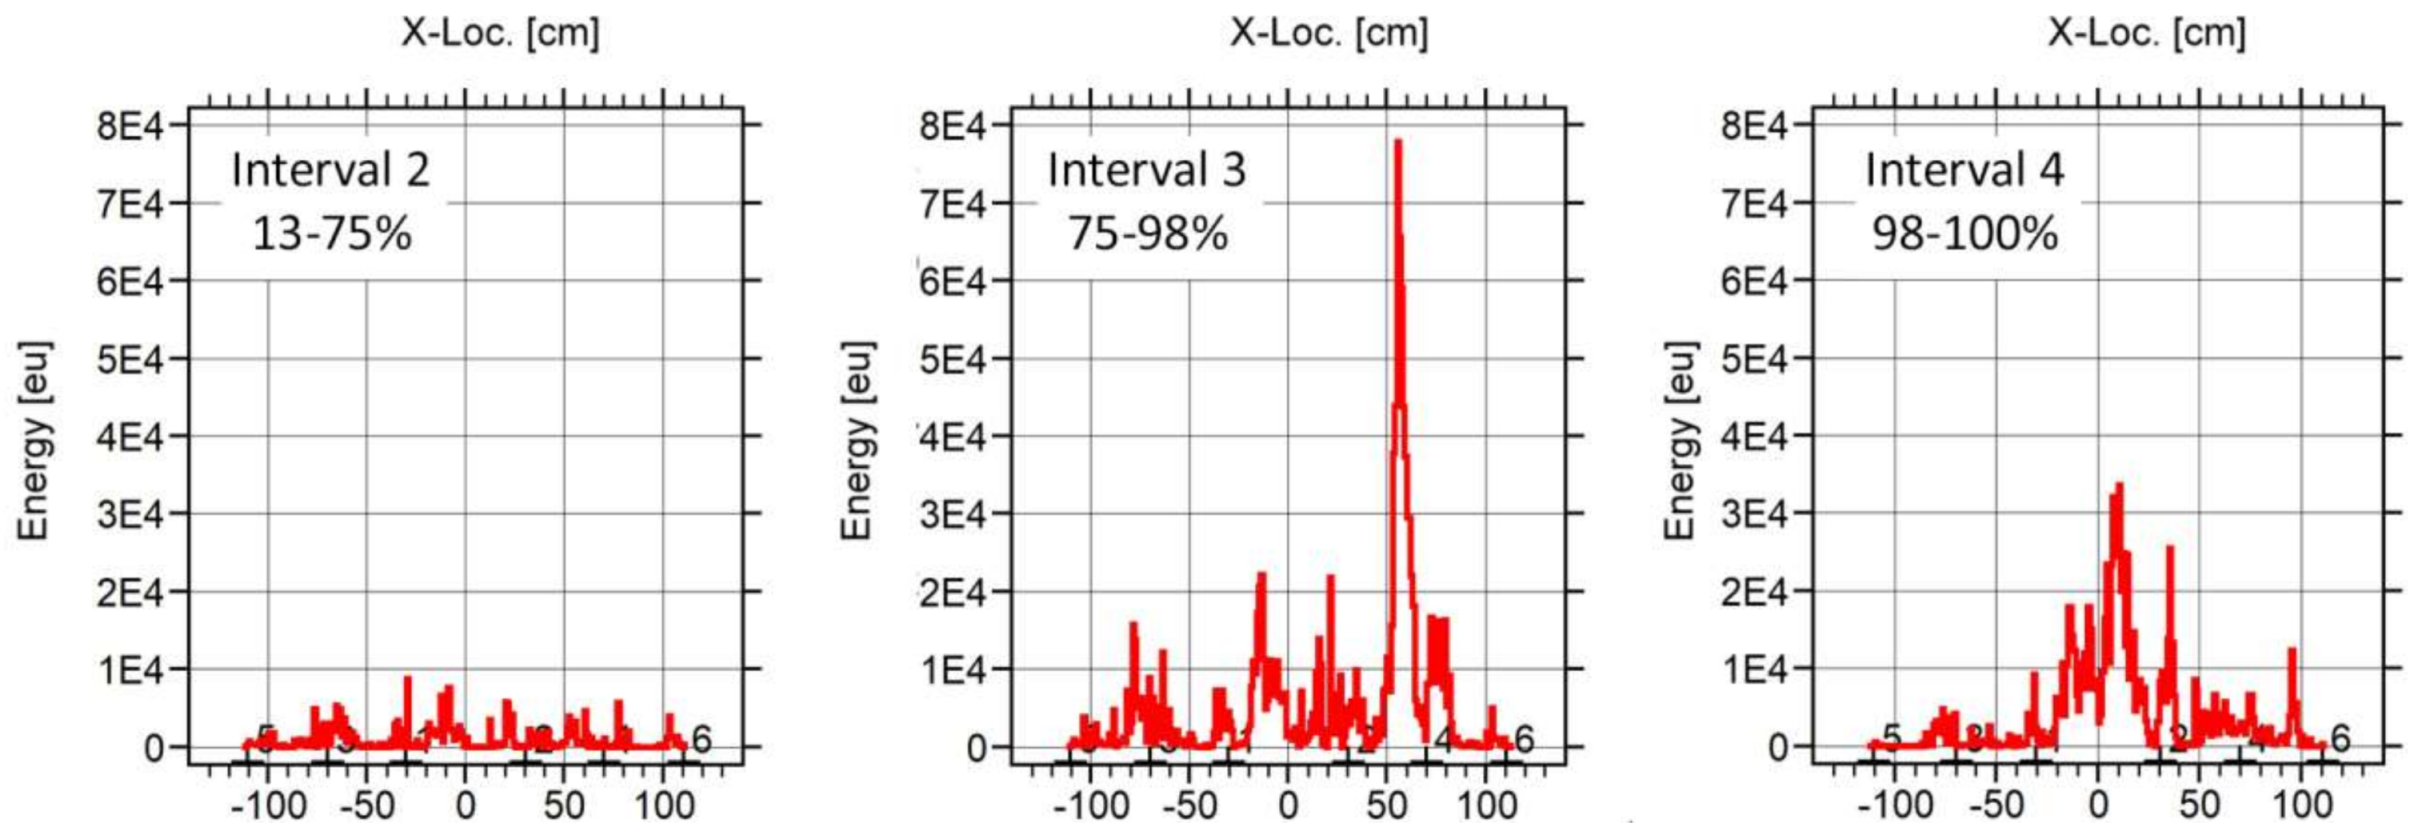
- The linear location results match the visual observation of the damage very closely. More specifically, AE located the stress concentration produced by knots in the wood and final existence of CFRP-wood delamination. The AE linear location confirmed that AE can announce well in advance the location of a main damage area, which is very important for future interventions entailing the repair or conservation of wood beams.
- A good correlation exists between measurements of AE and strain sensors, thus confirming the validity of the AE methodology for SHM of this kind of structures.
- Although both unidirectional and bidirectional fabrics provided relevant improvements in bending load capacity, the bidirectional ones demonstrated a 15.5% better performance on average than the unidirectional ones.
- Bending tests on large beams provided an improvement of 163% in terms of the corrected MOR and 90% in stiffness, in comparison with the non-reinforced beams, confirming the advantages of Braided Reinforcement in situations close to the field applications.
Acknowledgments
Author Contributions
Conflicts of Interest
References
- Commission, E. Directive 2010/31/EU of the European parliament and of the council of 19 May 2010 on the energy performance of buildings. Off. J. Eur. Commun. 2010, 18, 2010. [Google Scholar]
- Ansell, M.P. Hybrid wood composites-integration of wood with other engineering materials. In Wood Composites; Elsevier: New York City, NY, USA, 2015; Volume 54, pp. 411–426. [Google Scholar]
- Argüelles, R.; Arriaga, F.; Martínez, J.J. Estructuras de Madera, Diseño y Cálculo; Asociación de Investigación Técnica de la Industria de la Madera y del Corcho (AITIM): Madrid, Spain, 1996. [Google Scholar]
- High performance Synthetic Composites; Manufacturing, Recent Developments and Applications. Available online: https://textiletoday.com.bd/high-performance-synthetic-composites-manufacturing-recent-developments-and-applications/ (accessed on 15 April 2018).
- Theakston, F. A feasibility study for strengthening timber beams with fiberglass. Can. Agric. Eng. 1965, 7, 17–19. [Google Scholar]
- Biblis, E. Analysis of wood-fiberglass composite beams within and beyond the elastic region. FPJ 1965, 15, 81–88. [Google Scholar]
- Kellogg, R.; Wangaard, F. Influence of fiber strength on sheet properties of hardwood pulps. Tappi 1964, 47, 361. [Google Scholar]
- Rescalvo, F.J.; Valverde-Palacios, I.; Suarez, E.; Gallego, A. Experimental comparison of different carbon fiber composites in reinforcement layouts for wooden beams of historical buildings. Materials 2017, 10, 1113. [Google Scholar] [CrossRef] [PubMed]
- Chen, B.; Liu, J. Damage in carbon fiber-reinforced concrete, monitored by both electrical resistance measurement and acoustic emission analysis. Constr. Build. Mater. 2008, 22, 2196–2201. [Google Scholar] [CrossRef]
- Niccolini, G.; Borla, O.; Accornero, F.; Lacidogna, G.; Carpinteri, A. Scaling in damage by electrical resistance measurements: An application to the terracotta statues of the sacred mountain of varallo renaissance complex (Italy). Rendiconti Lincei 2015, 26, 203–209. [Google Scholar] [CrossRef]
- Grosse, C.U.; Ohtsu, M. Acoustic Emission Testing; Springer Science & Business Media: Berlin/Heidelberg, Germany, 2008. [Google Scholar]
- Ono, K. Application of acoustic emission for structure diagnosis. Diagnostyka 2011, 2, 3–18. [Google Scholar]
- Mizutani, Y. Practical Acoustic Emission Testing (The Japanese Society for Non-Destructive Inspection); Springer: Tokyo, Japan, 2016. [Google Scholar]
- Gallego, A.; Martínez, E. Emisión acústica. Niveles I y II (Ensayos no Destructivos-AEND); FC Editorial: Madrid, Spain, 2016. [Google Scholar]
- Sause, M.G. In Situ Monitoring of Fiber-Reinforced Composites: Theory, Basic Concepts, Methods, and Applications; Springer: Berlin, Germany, 2016; Volume 242. [Google Scholar]
- Sagasta, F.; Benavent-Climent, A.; Roldán, A.; Gallego, A. Correlation of plastic strain energy and acoustic emission energy in reinforced concrete structures. Appl. Sci. 2016, 6, 84. [Google Scholar] [CrossRef]
- Miller, R.K.; Hill, E.V.K.; Moore, P.O. Acoustic Emission Testing (AE), Nondestructive Testing Handbook, 3rd ed.; American Society for Nondestructive Testing, Inc.: Columbus, OH, USA, 2005; Volume 6. [Google Scholar]
- Rescalvo, F.J.; Valverde-Palacios, I.; Suárez, E.; Gallego, A. Monitoring of debondings in timber beams reinforced with using acoustic emission technique. In Proceedings of the 8th International Conference on Acoustic Emission (IIIAE 2016), Kioto, Japan, 5–9 December 2016. [Google Scholar]
- Ono, K.; Gallego, A. Research and applications of AE on advanced composites. In Proceedings of the 30th European Conference on Acoustic Emission Testing, Granada, Spain, 12–15 September 2012. [Google Scholar]
- Martínez-Jequier, J.; Gallego, A.; Suárez, E.; Juanes, F.J.; Valea, Á. Real-time damage mechanisms assessment in CFRP samples via acoustic emission lamb wave modal analysis. Compos. Part B-Eng. 2015, 68, 317–326. [Google Scholar] [CrossRef]
- Kowalski, S.J.; Moliński, W.; Musielak, G. The identification of fracture in dried wood based on theoretical modelling and acoustic emission. Wood Sci. Technol. 2004, 38, 35–52. [Google Scholar] [CrossRef]
- Gozdecki, C.; Smardzewski, J. Detection of failures of adhesively bonded joints using the acoustic emission method. Holzforschung 2005, 59, 219–229. [Google Scholar] [CrossRef]
- Ritschel, F.; Brunner, A.J.; Niemz, P. Nondestructive evaluation of damage accumulation in tensile test specimens made from solid wood and layered wood materials. Compos. Struct. 2013, 95, 44–52. [Google Scholar] [CrossRef]
- Lamy, F.; Takarli, M.; Angellier, N.; Dubois, F.; Pop, O. Acoustic emission technique for fracture analysis in wood materials. Int. J. Fract. 2015, 192, 57–70. [Google Scholar] [CrossRef]
- Diakhaté, M.; Bastidas-Arteaga, E.; Pitti, R.M.; Schoefs, F. Cluster analysis of acoustic emission activity within wood material: Towards a real-time monitoring of crack tip propagation. Eng. Fract. Mech. 2017, 180, 254–267. [Google Scholar] [CrossRef]
- Diakhate, M.; Angellier, N.; Pitti, R.M.; Dubois, F. On the crack tip propagation monitoring within wood material: Cluster analysis of acoustic emission data compared with numerical modelling. Constr. Build. Mater. 2017, 156, 911–920. [Google Scholar] [CrossRef]
- Rescalvo, F.J.; Valverde-Palacios, I.; Suarez, E.; Gallego, A. Experimental and analytical analysis for bending load capacity of old timber beams with defects when reinforced with carbon fiber strips. Compos. Struct. 2018, 186, 29–38. [Google Scholar] [CrossRef]
- De la Rosa García, P.; Escamilla, A.C.; García, M.N.G. Bending reinforcement of timber beams with composite carbon fiber and basalt fiber materials. Compos. Part B-Eng. 2013, 55, 528–536. [Google Scholar] [CrossRef]
- Aggelis, D.G.; Verbruggen, S.; Tsangouri, E.; Tysmans, T.; Van Hemelrijck, D. Characterization of mechanical performance of concrete beams with external reinforcement by acoustic emission and digital image correlation. Constr. Build. Mater. 2013, 47, 1037–1045. [Google Scholar] [CrossRef]


| Size of Timber Beam | Reinforcement Layout | Width of the CFRP Lamella (mm) | CFRP Fabric | Number of Beams | Short Name |
|---|---|---|---|---|---|
| Small-sized beams (SB) | Non- Reinforced (NR) | - | - | 3 | SB-NR |
| Braided Reinforcement (BR) | 45 | Laminate + Unidirectional wrap (U) | 3 | SB-BR-U | |
| 45 | Laminate + Bidirectional wrap (B) | 3 | SB-BR-B | ||
| Large-sized beams (BB) | Non- Reinforced (NR) | - | - | 2 | BB-NR |
| Braided Reinforcement (BR) | 100 | Laminate + Bidirectional wrap (B) | 2 | BB-BR-B |
| Name | MOR (MPa) | Density (kg/m3) | Corrected MOR (MPa) | MOE (MPa) | Maximum Deflection (mm) | Type of Failure |
|---|---|---|---|---|---|---|
| SB-NR-1 | 25.74 | 692.17 | 22.10 | 13,410.55 | 10.39 | Tension |
| SB-NR-2 | 43.63 | 653.77 | 39.66 | 14,978.33 | 18.52 | Tension and shear |
| SB-NR-3 | 32.88 | 639.57 | 30.55 | 7508.31 | 15.21 | Shear |
| Mean SB-NR value | 34.08 | 661.84 | 30.77 | 11,965.73 | 14.71 | - |
| Name | MOR (MPa) | Density (kg/m3) | Corrected MOR (MPa) | MOE (MPa) | Maximum Deflection (mm) | Type of Failure |
|---|---|---|---|---|---|---|
| SB-BR-U-1 | 41.28 | 688.30 | 35.64 | 16,870.84 | 22.71 | Shear |
| SB-BR-U-2 | 45.83 | 521.17 | 52.26 | 18,491.64 | 24.79 | Tension and shear |
| SB-BR-U-3 | 33.14 | 428.69 | 45.94 | 18,647.46 | 19.96 | Tension and shear |
| Mean SB-BR-U value | 40.09 | 546.05 | 44.61 | 18,003.31 | 22.49 | - |
| Variation respect NR (%) | 17.61 | - | 44.99 | 58.81 | 52.90 | - |
| SB-BR-B-1 | 58.31 | 549.73 | 63.03 | 13,439.87 | 27.30 | Shear |
| SB-BR-B-2 | 42.86 | 628.10 | 40.55 | 17,591.69 | 19.15 | Shear |
| SB-BR-B-3 | 54.08 | 628.26 | 51.15 | 16,875.22 | 22.66 | Tension and shear |
| Mean SB-BR-B value | 51.75 | 602.03 | 51.58 | 15,968.93 | 23.04 | - |
| Variation respect NR (%) | 51.83 | −9.04 | 67.63 | 33.46 | 56.64 | - |
| Name | MOR (MPa) | Density (kg/m3) | Corrected MOR (MPa) | MOE (MPa) | Maximum Deflection (mm) | Type of Failure |
|---|---|---|---|---|---|---|
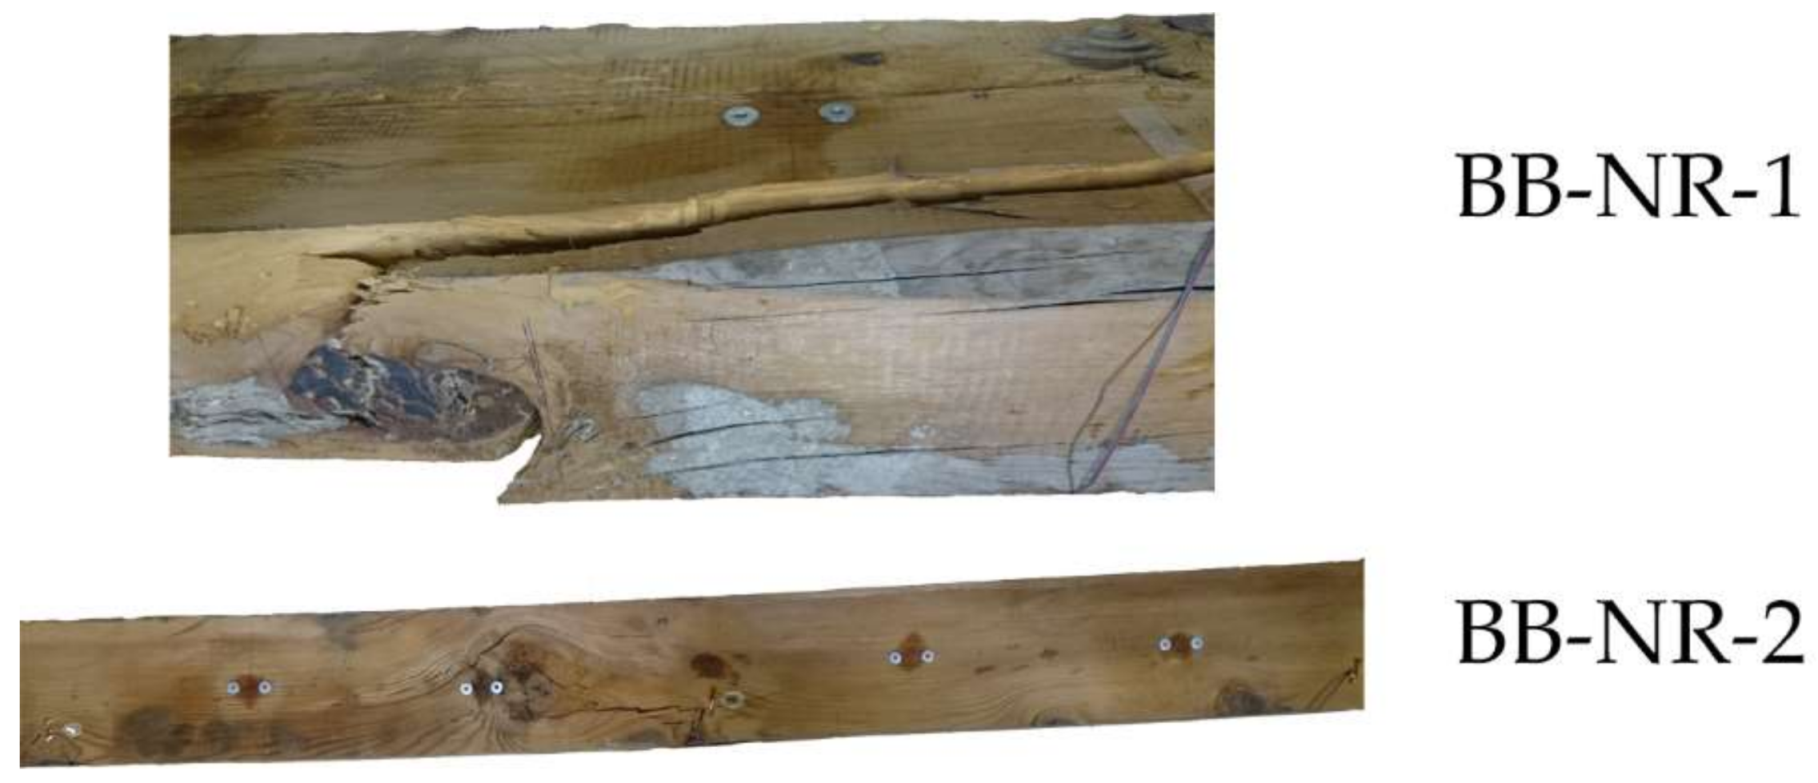
| BB-NR-1 | 17.61 | 522.52 | 18.71 | 9239.25 | 34.86 | Tension and shear |
| BB-NR-2 | 13.19 | 571.12 | 12.82 | 6384.22 | 35.43 | Tension |
| Mean BB-NR value | 15.40 | 546.82 | 15.76 | 7811.74 | 35.15 | - |
| Name | MOR (MPa) | Density (kg/m3) | Corrected MOR (MPa) | MOE (MPa) | Maximum Deflection (mm) | Type of Failure |
|---|---|---|---|---|---|---|
| BB-BR-1 | 42.88 | 468.72 | 50.78 | 16,858.18 | 59.95 | Tension and shear |
| BB-BR-2 | 38.19 | 658.11 | 32.21 | 14,131.79 | 58.91 | Tension and shear |
| Mean BB-BR value | 40.54 | 563.42 | 41.50 | 15,494.99 | 59.43 | - |
| Variation respect BB-NR (%) | 163.21 | - | 163.24 | 98.36 | 69.10 | - |
© 2018 by the authors. Licensee MDPI, Basel, Switzerland. This article is an open access article distributed under the terms and conditions of the Creative Commons Attribution (CC BY) license (http://creativecommons.org/licenses/by/4.0/).
Share and Cite
Rescalvo, F.J.; Valverde-Palacios, I.; Suarez, E.; Roldán, A.; Gallego, A. Monitoring of Carbon Fiber-Reinforced Old Timber Beams via Strain and Multiresonant Acoustic Emission Sensors. Sensors 2018, 18, 1224. https://doi.org/10.3390/s18041224
Rescalvo FJ, Valverde-Palacios I, Suarez E, Roldán A, Gallego A. Monitoring of Carbon Fiber-Reinforced Old Timber Beams via Strain and Multiresonant Acoustic Emission Sensors. Sensors. 2018; 18(4):1224. https://doi.org/10.3390/s18041224
Chicago/Turabian StyleRescalvo, Francisco J., Ignacio Valverde-Palacios, Elisabet Suarez, Andrés Roldán, and Antolino Gallego. 2018. "Monitoring of Carbon Fiber-Reinforced Old Timber Beams via Strain and Multiresonant Acoustic Emission Sensors" Sensors 18, no. 4: 1224. https://doi.org/10.3390/s18041224