Article

Temperature and Vibration Dependence of the Faraday Effect of Gd2O3 NPs-Doped Alumino-Silicate Glass Optical Fiber

1
School of Electrical Engineering and Computer Science/Advanced Photonics Research Institute, Gwangju Institute of Science and Technology, Gwangju 61005, Korea
2
Advanced Optical Lens Research Center, Korea Photonics Technology Institute, Gwangju 61007, Korea
3
Solar City Center, Korea Institute of Industrial Technology, Gwangju 61012, Korea
4
Power System Laboratory, Korea Electric Power Corporation Research Institute, Daejeon 34056, Korea
5
Department of Nano and Advanced Materials Engineering, Gyeongsang National University, Jinju 52828, Korea
*
Author to whom correspondence should be addressed.
Sensors 2018, 18(4), 988; https://doi.org/10.3390/s18040988
Submission received: 22 February 2018 / Revised: 16 March 2018 / Accepted: 22 March 2018 / Published: 27 March 2018
(This article belongs to the Special Issue Magnetic Sensors)

Abstract

:
All-optical fiber magnetic field sensor based on the Gd2O3 nano-particles (NPs)-doped alumino-silicate glass optical fiber was developed, and its temperature and vibration dependence on the Faraday Effect were investigated. Uniformly embedded Gd2O3 NPs were identified to form in the core of the fiber, and the measured absorption peaks of the fiber appearing at 377 nm, 443 nm, and 551 nm were attributed to the Gd2O3 NPs incorporated in the fiber core. The Faraday rotation angle (FRA) of the linearly polarized light was measured at 650 nm with the induced magnetic field by the solenoid. The Faraday rotation angle was found to increase linearly with the magnetic field, and it was about 18.16° ± 0.048° at 0.142 Tesla (T) at temperatures of 25 °C–120 °C, by which the estimated Verdet constant was 3.19 rad/(T∙m) ± 0.01 rad/(T∙m). The variation of the FRA with time at 0.142 T and 120 °C was negligibly small (−9.78 × 10⁻⁴ °/min). The variation of the FRA under the mechanical vibration with the acceleration below 10 g and the frequency above 50 Hz was within 0.5°.

1. Introduction

Lanthanide ions have been studied extensively owing to their unique response to various parameters such as magnetic field, optical interference, and biomedical stimuli [1,2,3,4,5,6,7]. Most of the lanthanide materials show strong magneto-optic interactions attributed to their 4f electrons [4,5,8,9,10,11,12,13,14,15]. Especially, the well-known Faraday rotation under magnetic field involves the transition 4fn to 4fn−15d of lanthanide ions [8,9,10,11,12,13,14,15]. Especially, glasses that contain lanthanide ions are suitable as strong magneto-optic media due to lower absorption in the spectral regions of interest, and their durability is an added advantage [5]. Furthermore, fiber optic devices using optical fiber incorporated with lanthanide ions are useful for all-optical applications and offer advantages of miniaturization, high sensitivity, immunity to electromagnetic interference, real-time remote sensing, and cost effectiveness. Earlier, therefore, the magneto-optic properties, in particular the Verdet constants of silicate glass optical fibers doped with lanthanide ions such as Tb3+ ions (−32.1 rad/(T·m) at 1053 nm) and Eu3+ ions (−4.6 rad/(T·m) at 660 nm), have been extensively studied [13,14]. Our group has also reported the Verdet constants of silicate glass optical fibers incorporated with Eu2+ ions (2.6 rad/(T·m) at 633 nm), as well as Cu (2.1 rad/(T·m) at 660 nm), CdSe (7.2 rad/(T·m) at 633 nm), and CdMnTe (5.1 rad/(T·m) at 660 nm) [15,16,17,18,19].
Among the lanthanides-doped optical fibers, optical fibers doped with paramagnetic dopants such as Ce3+, Pr3+, Nd3+, Eu3+, Tb3+, and Dy3+ exhibited enhanced magneto-optic properties compared to the fibers doped with diamagnetic materials such as Sm3+, Gd3+, and Yb3+. However, the paramagnetic optical fibers have larger temperature sensitivity than the diamagnetic optical fibers. This is due to the difference in the magnetization mechanisms, such that atoms possess magnetic dipole moments at the microscopic level in paramagnetic material but not in diamagnetic material. Thus, optical fibers doped with diamagnetic materials are suitable as a magneto-optic component, with its temperature insensitivity and compact size. Field applications in magneto-optic sensors often require high accuracy over a wide temperature range. In addition, mechanical perturbations should not disturb the signal in order to avoid erroneous triggering of the magneto-optic sensor system [20]. Therefore, magneto-optic devices such as microwave filters, optical isolators, and optical current sensors that use the optical fibers doped with diamagnetic materials are very attractive, because no additional temperature and vibration compensation systems are needed. Among diamagnetic lanthanides, nano-particles (NPs) of gadolinium oxide (Gd2O3) are of great interest due to the linear response of the Faraday effect, their relative stability with respect to temperature, and the large atomic magnetic momentum from seven unpaired electrons of the trivalent gadolinium ion Gd3+ [4,5,9,10,11,12].
Optical fibers doped with Gd2O3 NPs are then expected to be an attractive material for magneto-optic devices, which require excellent optical transparency, low optical loss, and high durability [5,10]. However, since magneto-optic sensitivity is known to decrease with increasing wavelength, optical fibers with short cutoff wavelengths near visible wavelength are needed for better performance. We have fabricated the Gd2O3 NPs-doped specialty optical fiber that is in single mode at 650 nm by using the modified chemical vapor deposition (MCVD) and the drawing process. We present the fabrication and the experimental results related to the Faraday effect of the alumino-silicate glass optical fiber incorporated with Gd2O3 NPs. Especially, the temperature and vibration dependence are discussed on Faraday rotation angle (FRA) under magnetic field induced by the DC solenoid.

2. Theory

Temperature Dependence of Faraday Rotation in Magnetic Materials

Although the glass optical fibers doped with diamagnetic materials exhibit weaker magneto-optic properties than the fibers doped with paramagnetic materials, these fibers have small temperature sensitivity. In paramagnetic materials, which have microscopic magnetization in the absence of an applied magnetic field, some or all of the individual atoms possess magnetic dipole moments that are randomly aligned. However, in diamagnetic materials, no microscopic or macroscopic magnetization occurs in the absence of an applied magnetic field. Therefore, Faraday effect in diamagnetic materials arises from the splitting of the upper level of an optical transition. Additionally, the temperature-dependent Verdet constant of diamagnetic materials, Vdia, is well represented by the expression as follows [1,8,21,22]:
d V d i a d T = e λ 2 m c [ d d λ ( d n d T ) ]
in which e is the electronic charge, λ is the wavelength, m is the electronic mass, c is the speed of light, n is the refractive index, and T is temperature at the measurement. The variation of the Verdet constant with temperature in diamagnetic materials is only related to the temperature dependence of refractive index from Equation (1).
In the case of the paramagnetic materials, on the other hand, the Verdet constant, Vpar, can be expressed by following expression using quantum mechanics [1,23,24,25]:
V p a r = 4 π 2 ν 2 χ p a r g β c h Σ a , b ( C a b ν 2 ν a b 2 )
in which ν is the frequency of the incident light, g is the Landé splitting factor, β is the Bohr magneton number, c is the speed of the light, h is the Planck`s constant, Cab is a transition probability, and νab is the frequency associated with the transition. Here, the paramagnetic susceptibility χpar is given by [1,8]
χ p a r = N g 2 [ J ( J + 1 ) ] μ B 2 3 k T
in which N is the number of atoms or ions per unit volume, J is the spin orbit quantum number, k is Boltzmann’s constant, μB is the Bohr magneton, and T is temperature at the measurement. Since the Verdet constant in paramagnetic materials is inversely proportional to temperature from the Equations (2) and (3), the variation of the Verdet constant with temperature in paramagnetic materials is primarily due to the temperature dependence of paramagnetic susceptibility.

3. Experiments

3.1. Preform Fabrication

An alumino-silicate glass optical fiber preform incorporated with Gd2O3 NPs in core region was fabricated by the MCVD process with the modified solution doping process. For a core part of the preform, porous silica layers were deposited onto the inner surface of a silica glass tube at temperature of about 1650 °C by the MCVD process using silicon tetrachloride (SiCl4) as a precursor. The doping was carried out by soaking the deposited porous silica glass layers with a solution containing Al and Gd prepared by dissolving 0.25 mole and 0.05 mole of reagent grade AlCl3·6H2O powder (High Purity Chemicals Co., Ltd., Sakado, Japan, 99.9%) and Gd2O3 powder (Cerac Inc., Milwaukee, WI, USA, 99.9%) in hydrochloric acid solution (Daejung Co., Ltd., Siheung-si, Korea, 35%), respectively. Note that Al was added instead of germanium(Ge) to increase the refractive index of the preform core. Moreover, the formation of Gd2O3 NPs at higher concentration is expected to be facilitated by addition of Al [26,27,28,29]. The soaked silica glass layers were dried to evaporate the residual solvent and only solutes (Al and Gd) remaining in the deposited porous layers. Then, the doped porous silica layers were sintered, and the tube was collapsed and sealed into a preform.

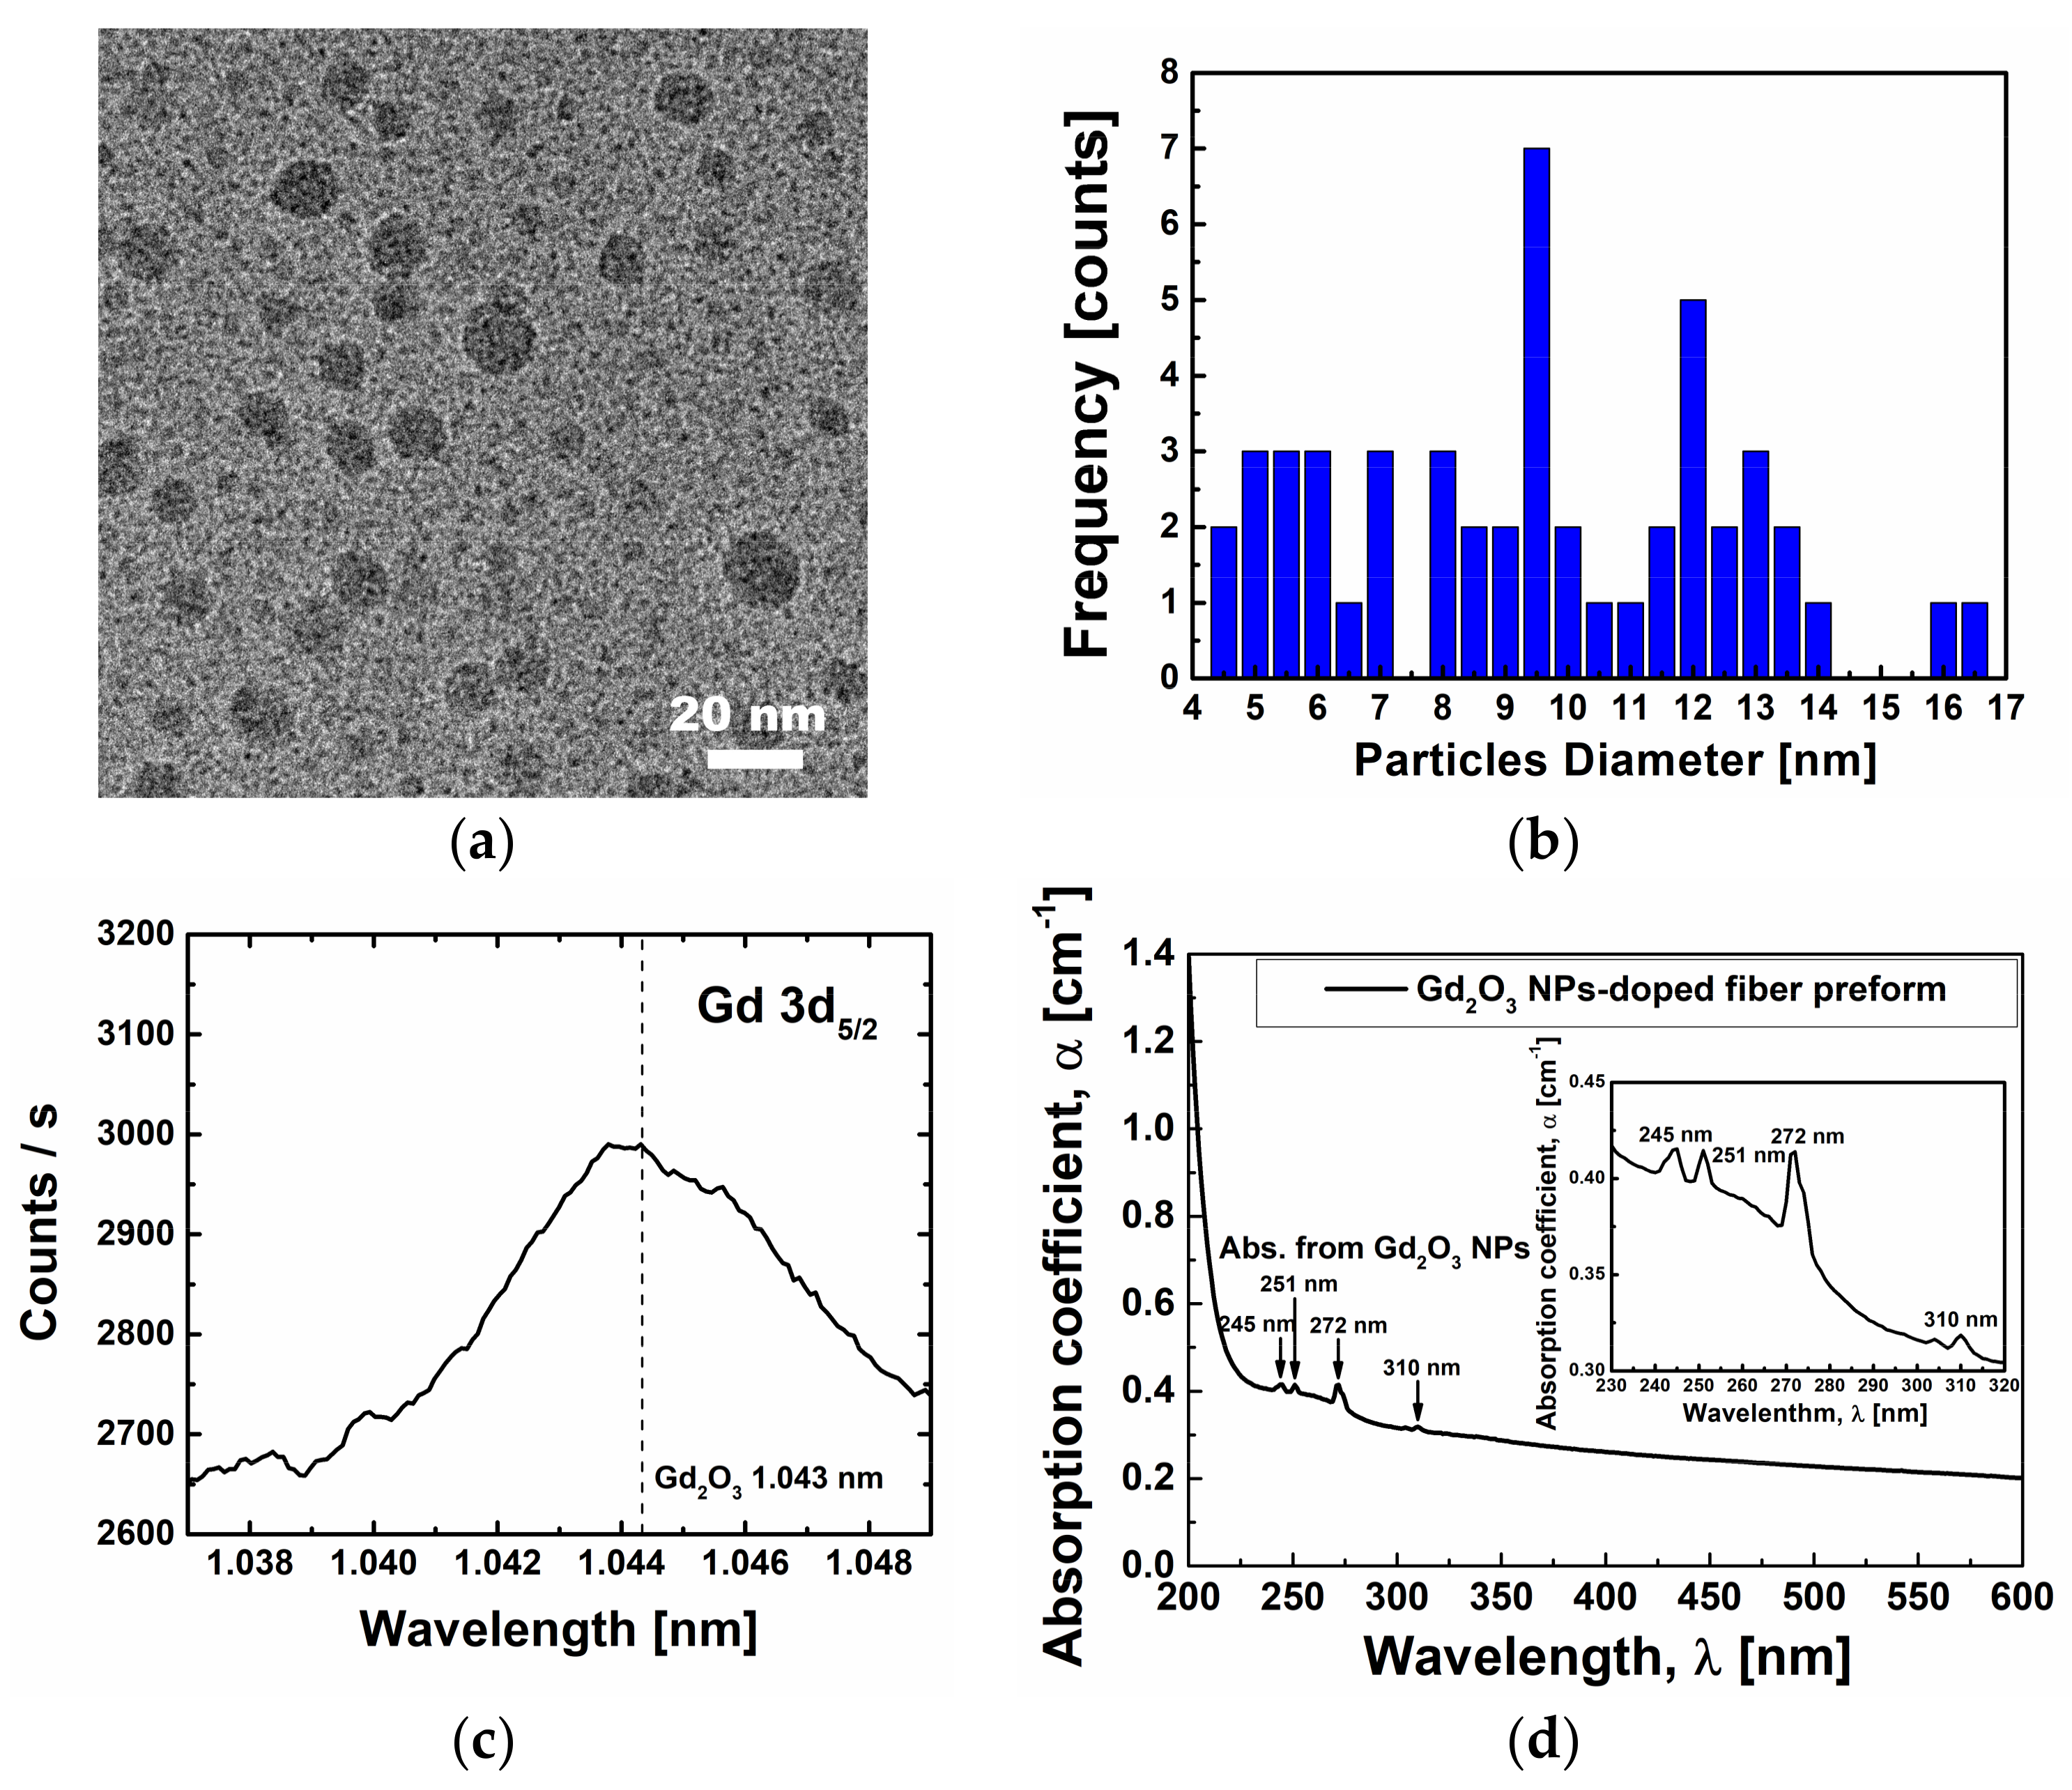
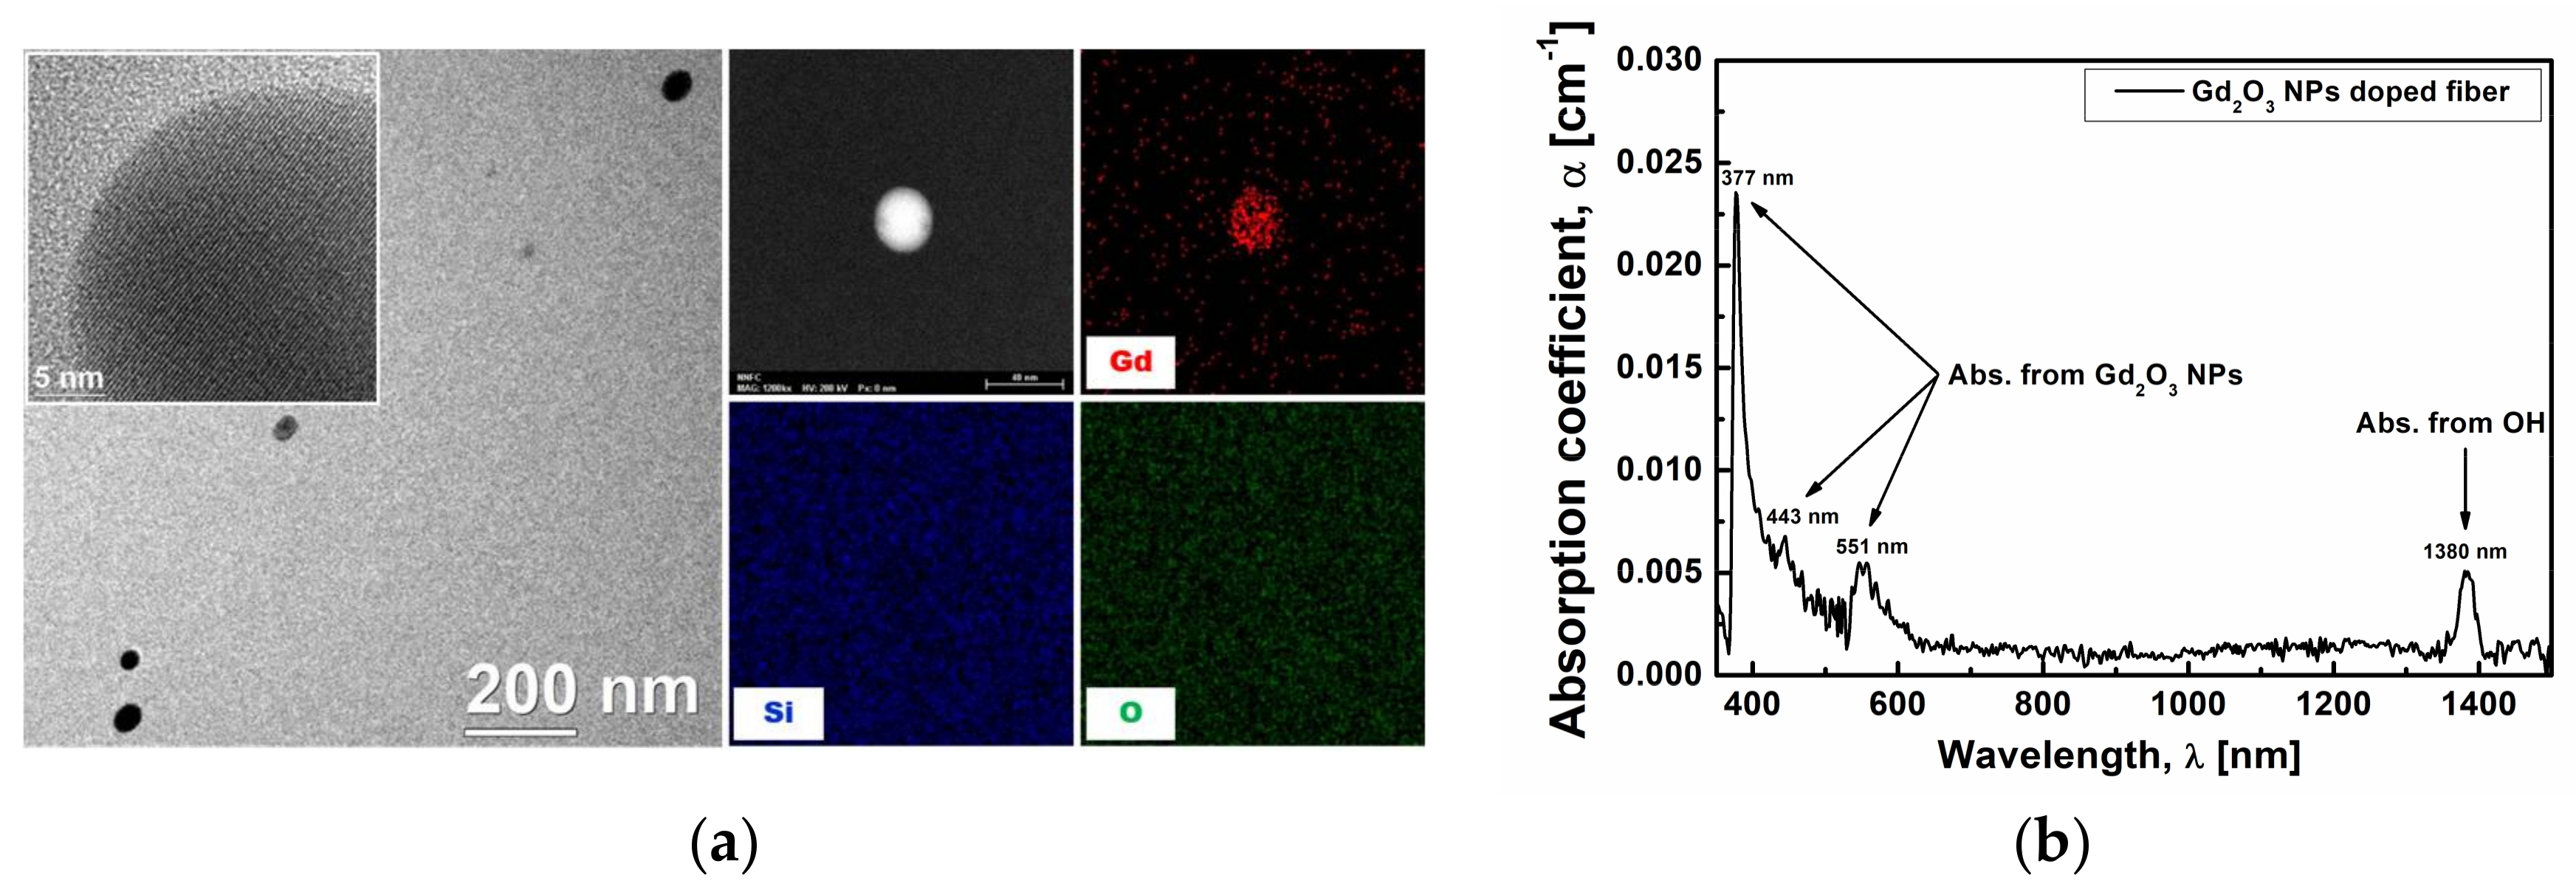
3.2. Verification of Existence of Gd2O3 Nano-Particles

To confirm the formation of Gd2O3 NPs in the core of the fiber preform, the core was examined by the transmission electron microscopy (TEM; Tecnai, Hillsboro, OR, USA, G2 S-Twin 300 KeV), the X-ray photoelectron spectrometer (XPS; Thermo Scientific™, Waltham, MA, USA, K-Alpha™), and the UV-VIS spectrophotometer (Varian, Palo Alto, CA, USA, Cary500Scan). Also, to verify the existence of Gd2O3 NPs in the core of the fiber, microstructural measurements were conducted using the Cs-corrected scanning transmission electron microscopy (STEM; JEOL, Peabody, MA, USA, JEM-ARM200F) with energy dispersive X-ray spectroscopy (EDS). The elemental compositions were determined by the STEM analysis. The results are discussed in the next section.

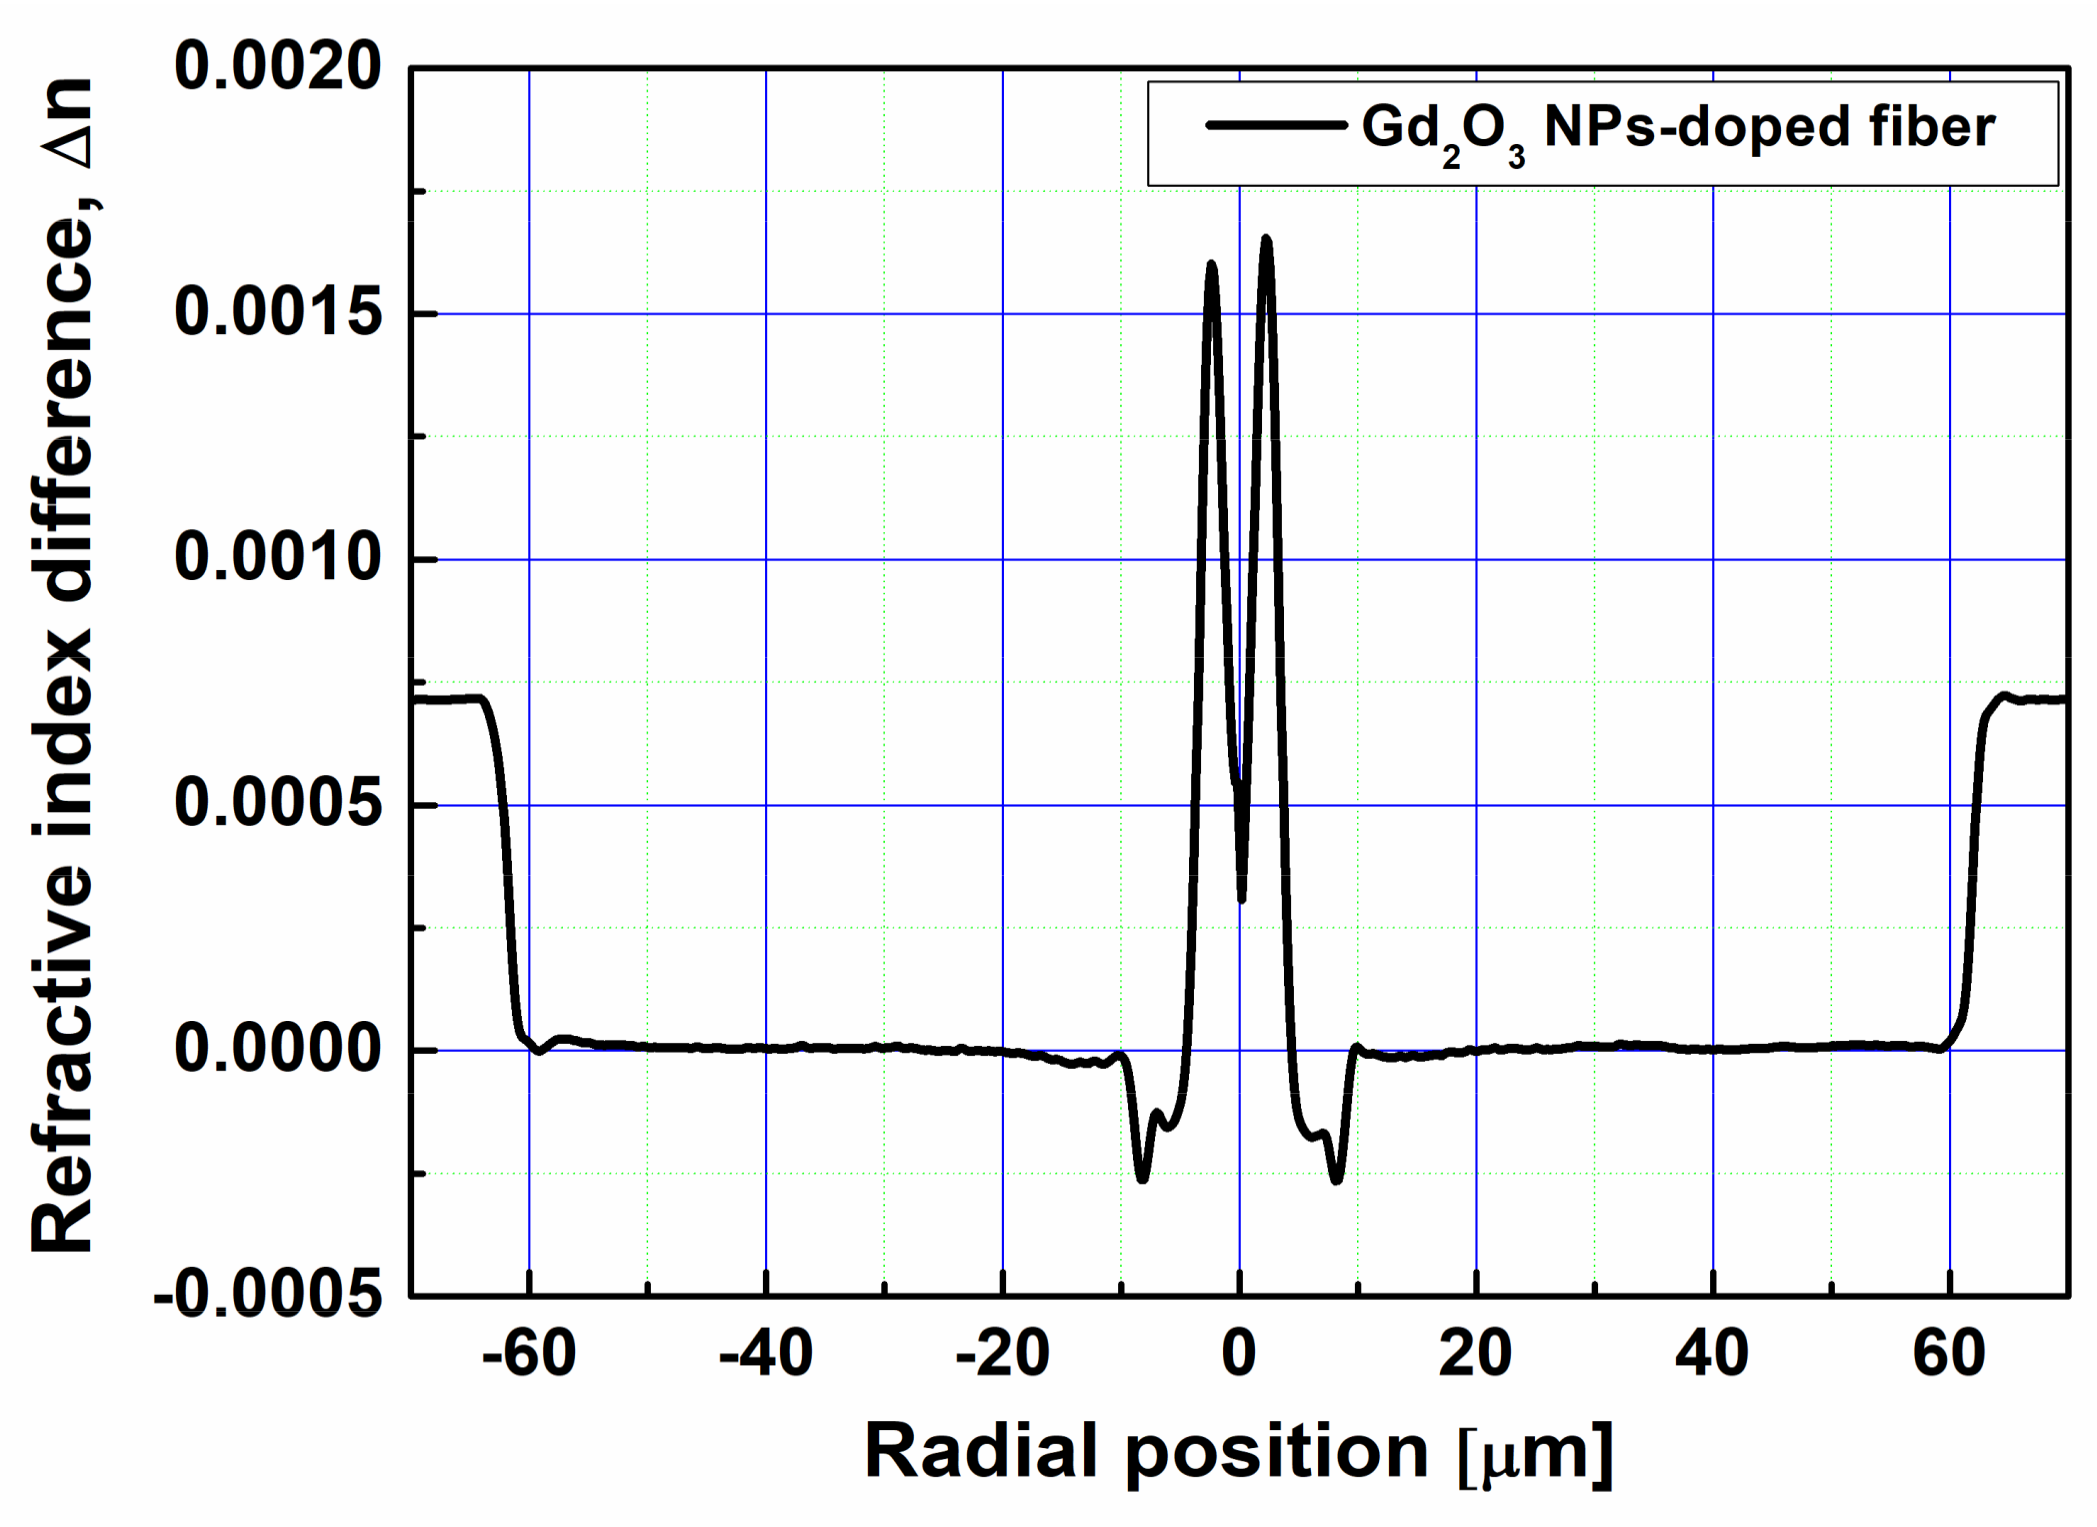
3.3. Optical Fiber Drawing and Characterization

The preform was drawn into an optical fiber using the drawing tower at 2100 °C. The refractive index profile of the optical fiber was measured by using the optical fiber analyzer (Interfiber Analysis, Sharon, MA, USA, IFA-100) and shown in Figure 1; the index difference, ∆n, between the core and cladding was 0.0016, mainly due to incorporation of Al in the fiber core. Note again that no Ge was added in the core. The concentrations of the Gd and Al ions were estimated to be 2.3 × 10²⁰ ions/cm3 and 11.6 × 10²⁰ ions/cm3, respectively. The core diameter, the outer diameter, and the cutoff wavelength of the Gd2O3 NPs-doped fiber were 7.3 µm, 125 µm, and 520 nm, respectively. Since the Faraday effect is considerably dependent on wavelength, i.e., it drastically decreases with increasing wavelength [30,31], the Faraday rotation measurement was carried out at visible wavelength, 650 nm. The refractive index profile was especially designed to have a numerical aperture of 0.0683 and a cutoff wavelength below 650 nm, over which single mode operates.
To verify the existence of Gd2O3 NPs in the core of the fiber, optical absorption spectrum of the Gd2O3 NPs-doped fiber was measured with a cut-back method using a few tens of centimeters of optical fiber length where the white light source (Ando Electric Co., Ltd., Tokyo, Japan AQ 4303B) was used for launching the input broadband light and output spectrum was measured with the optical spectrum analyzer (Ando Electric Co., Ltd., Tokyo, Japan, AQ 6315B).

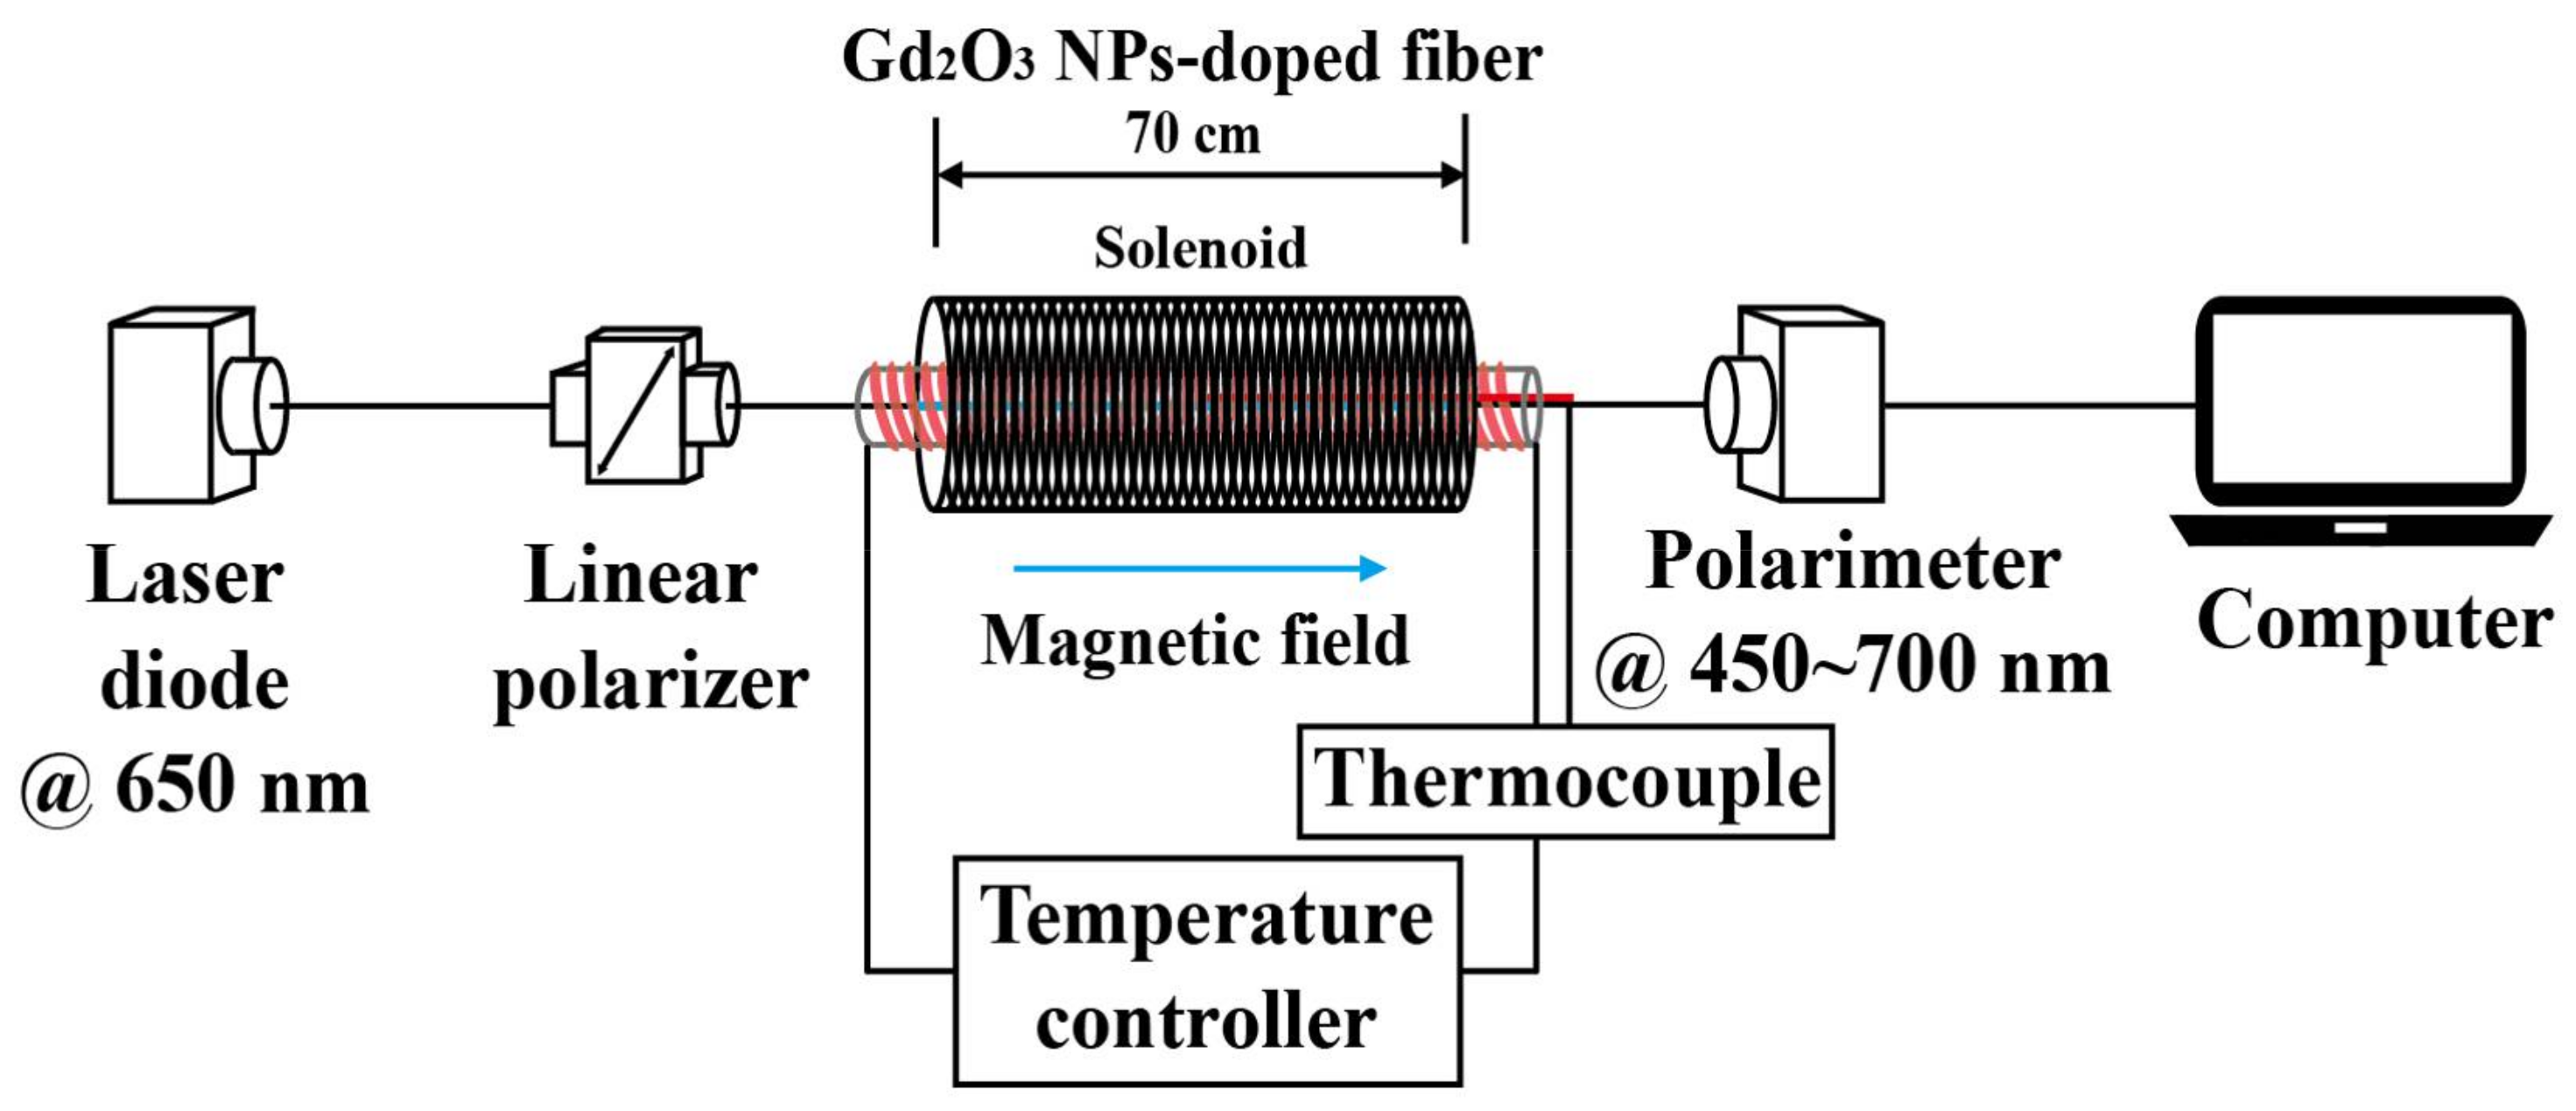
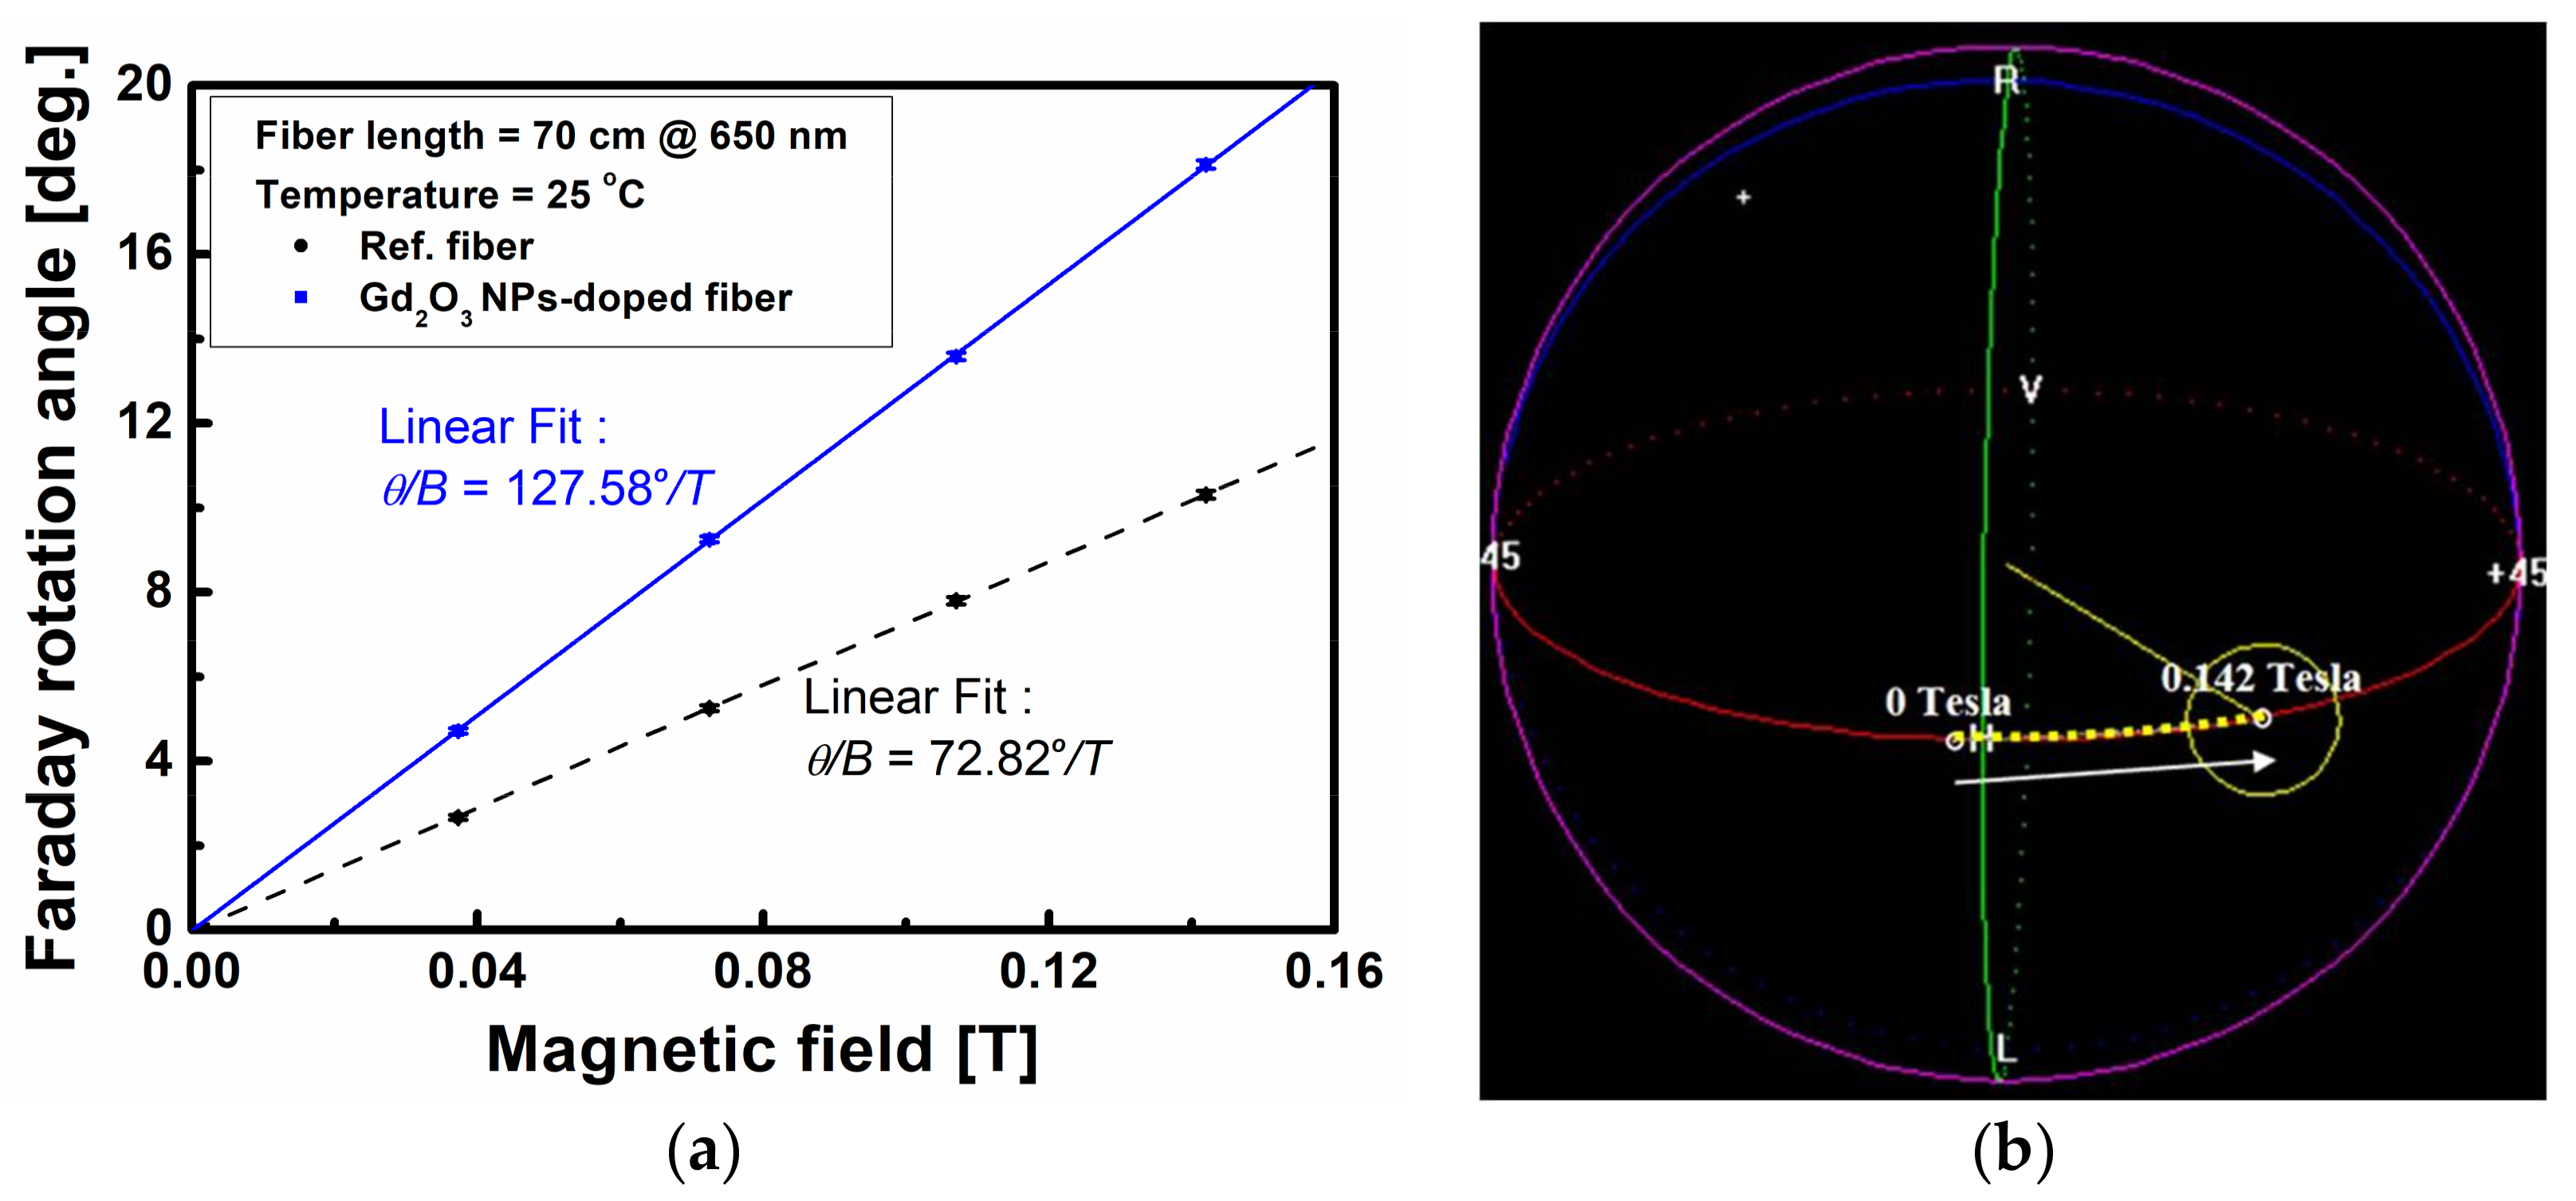
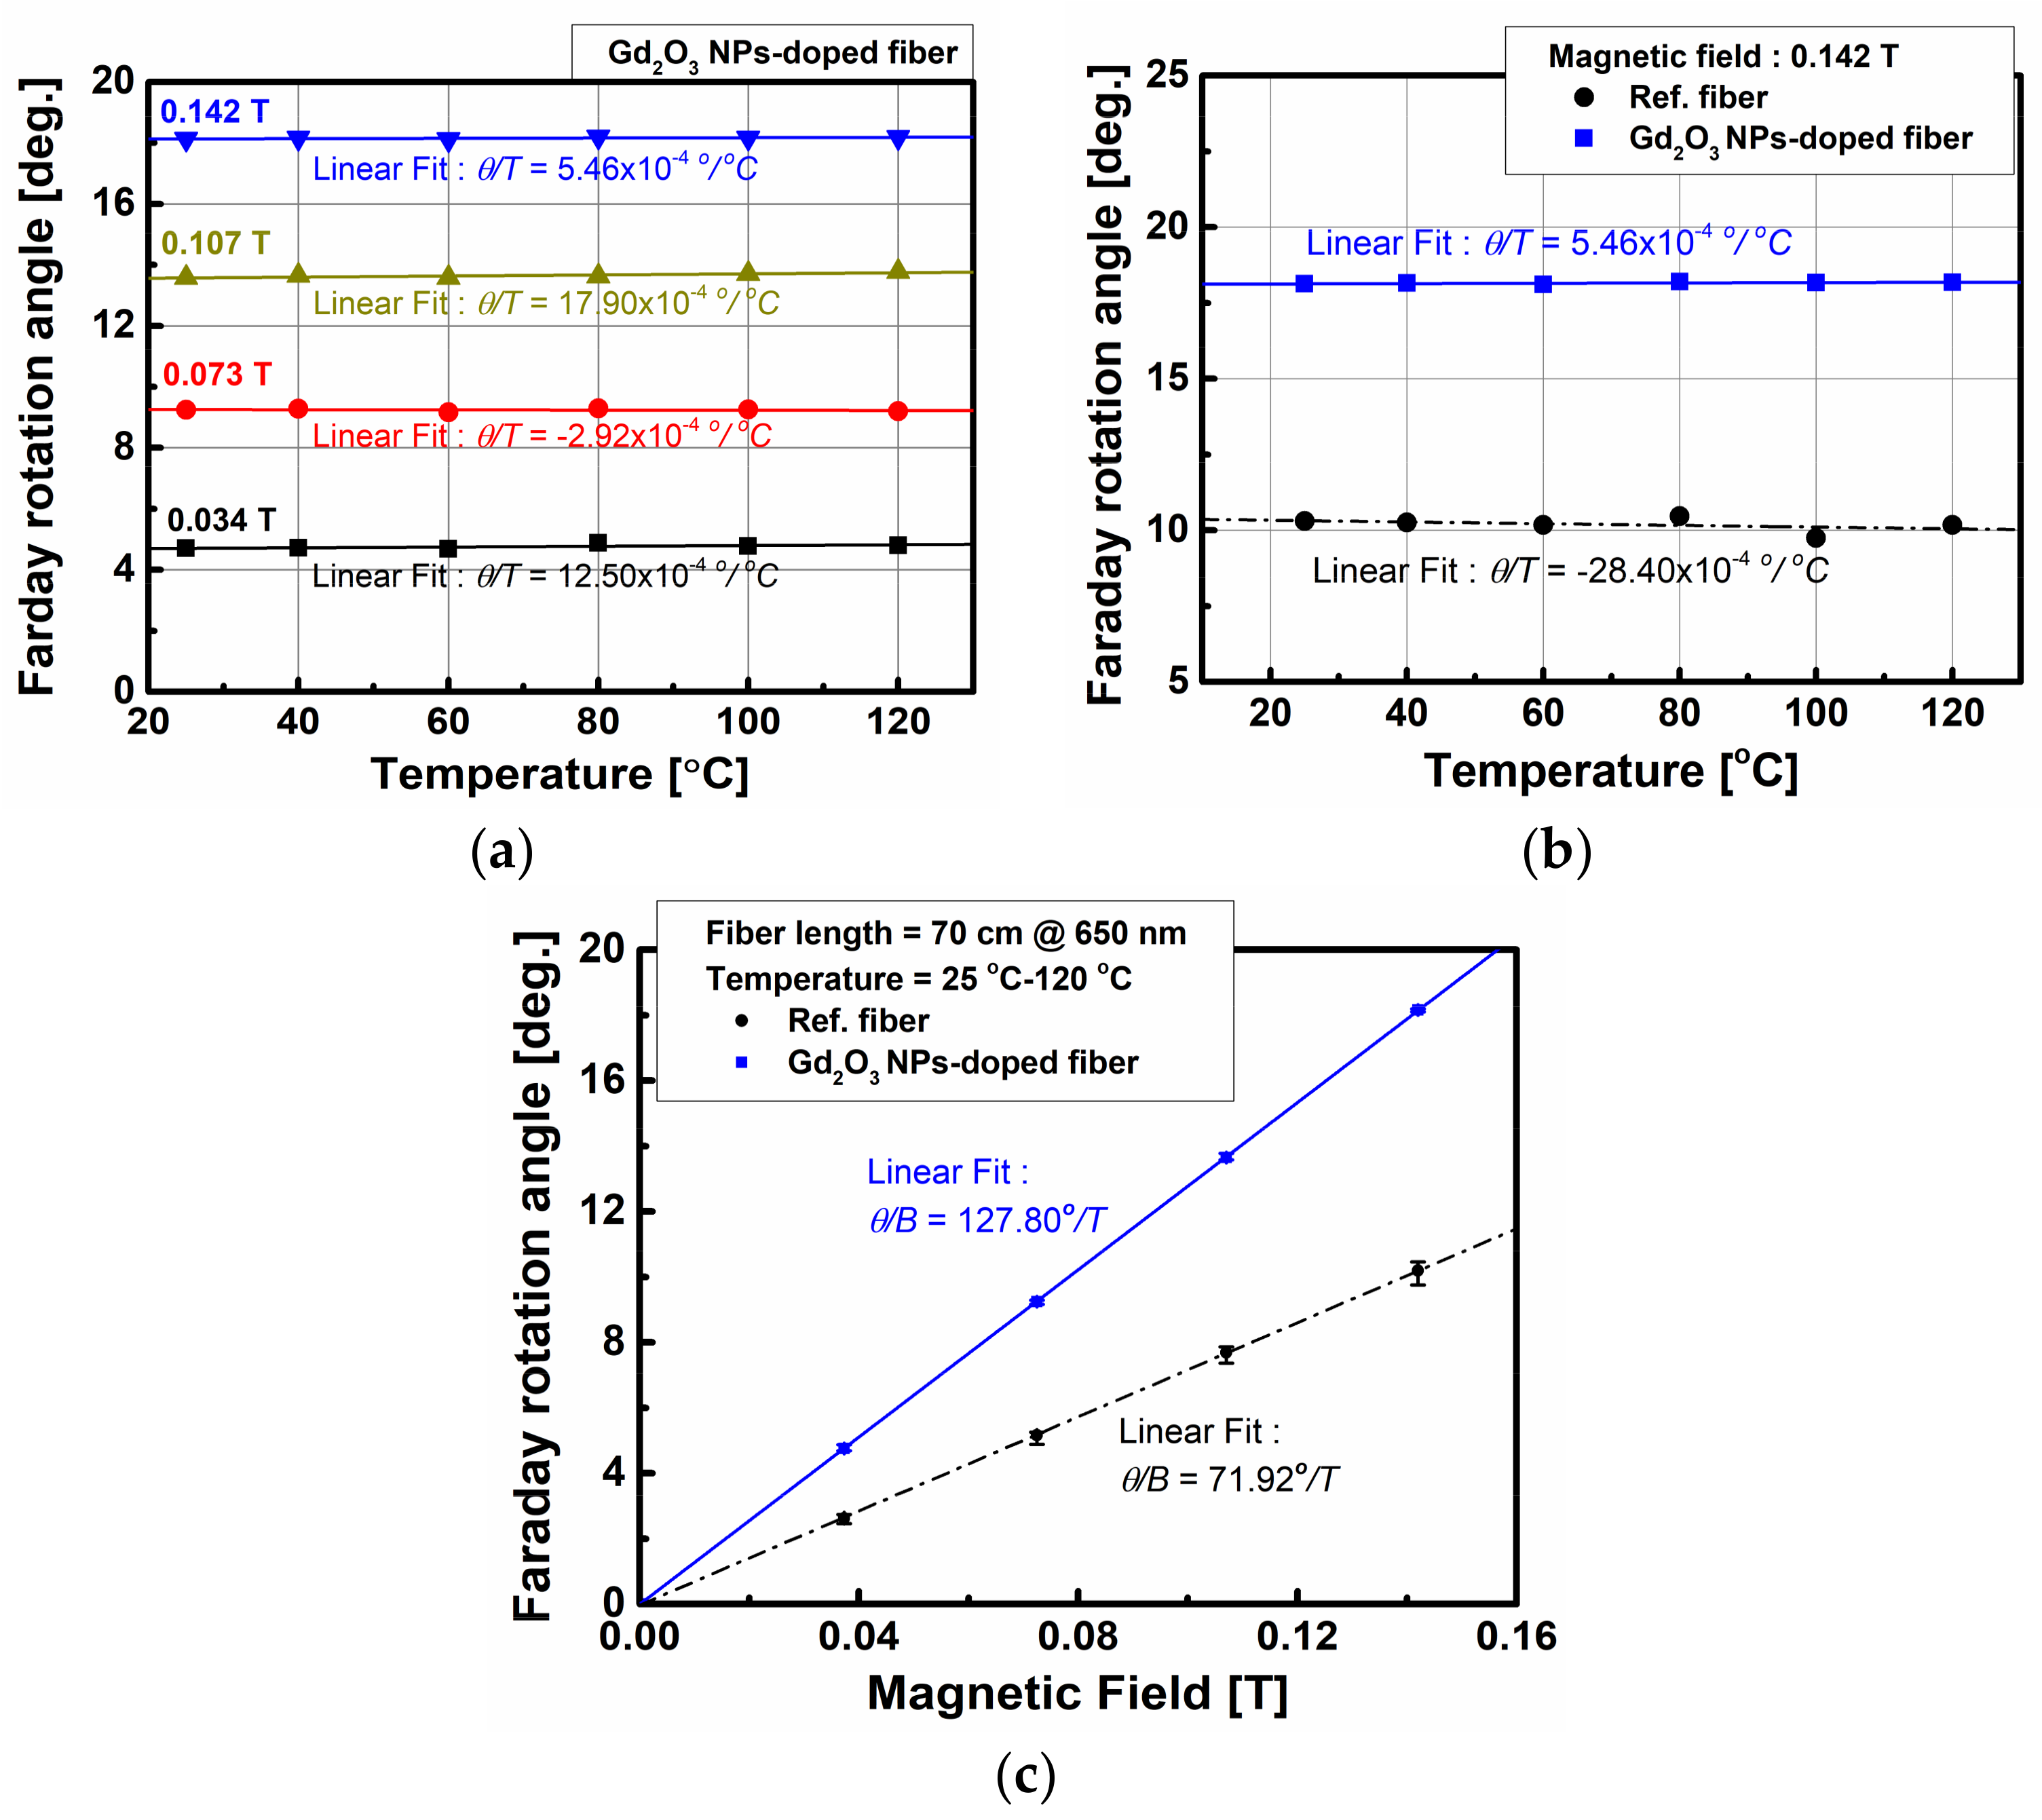
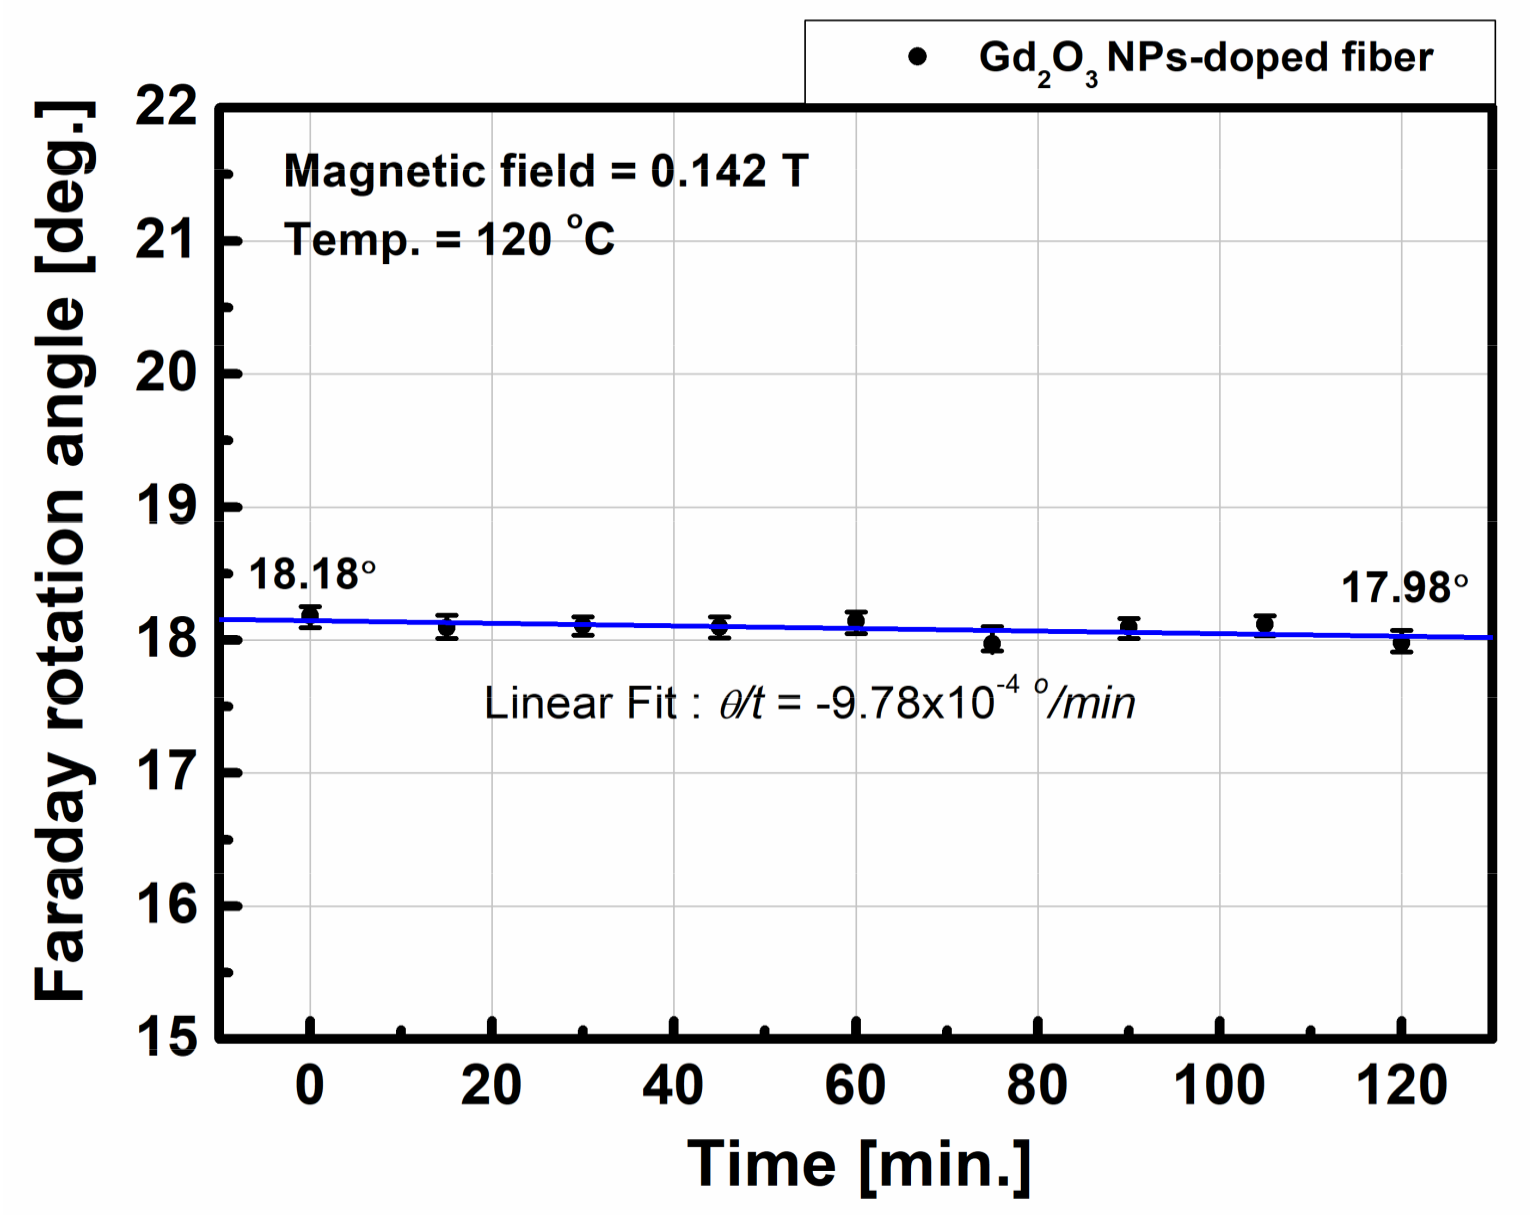
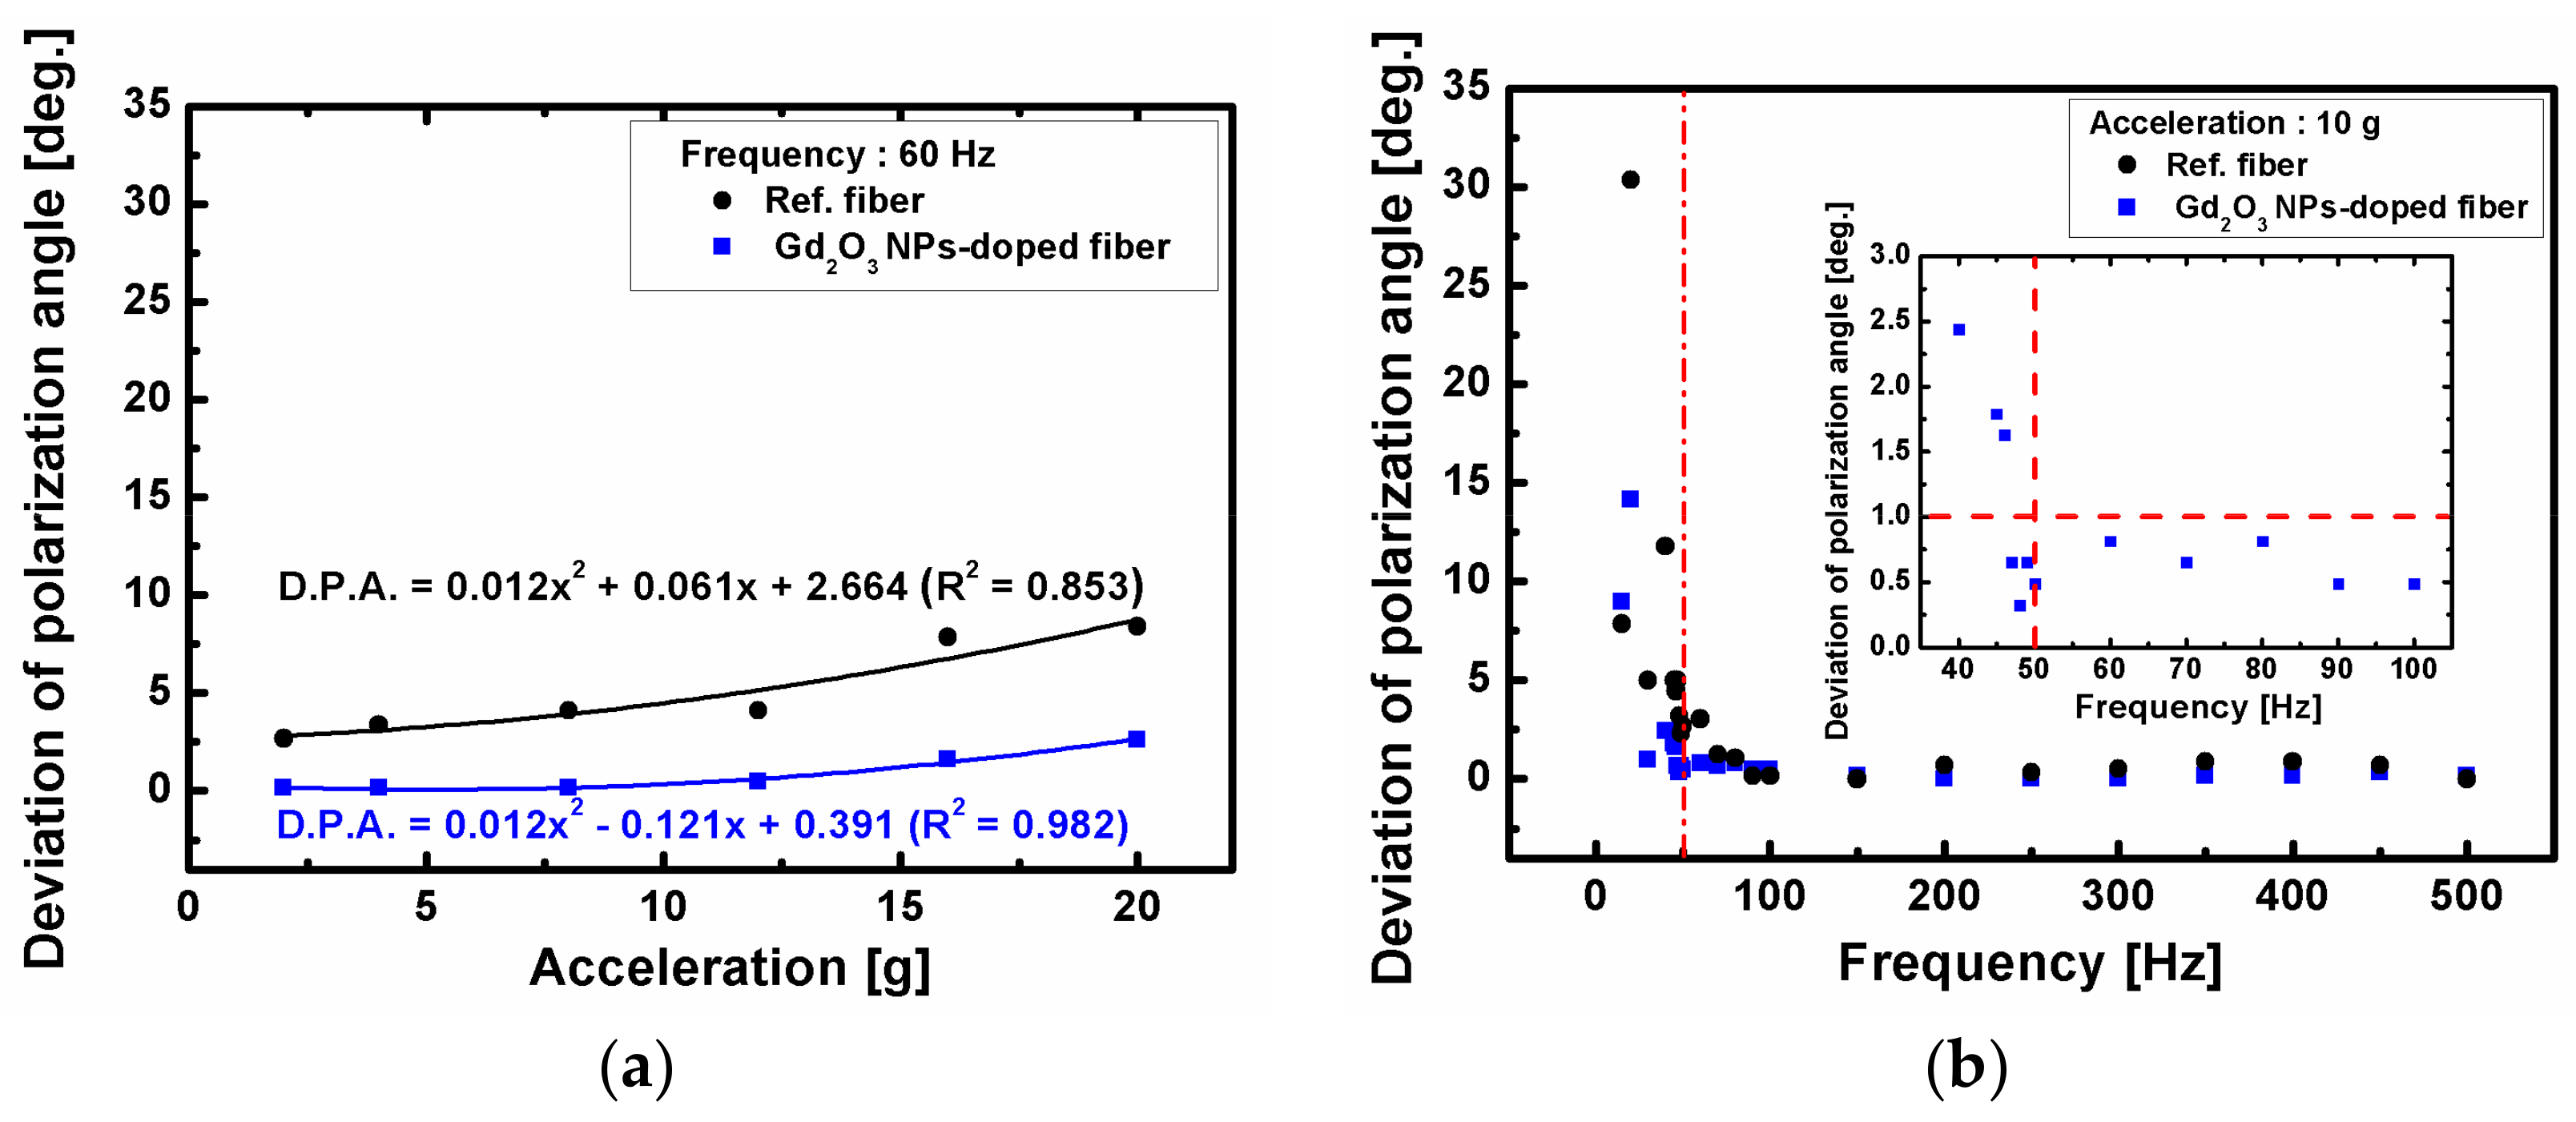
3.4. Faraday Rotation Measurement

To measure Faraday rotation angle (FRA) of the Gd2O3 NPs-doped fiber at 650 nm, a signal light from a superluminescent diode (SLD; Coset Inc., Gwangju, Korea, wavelength = 650 nm, power = 1 mW) was launched through a linear polarizer into the 70 cm long optical fiber that was under magnetic field generated by a DC solenoid with inner diameter of 76 mm (Walker scientific Inc., Worcester, MA, USA), as shown in Figure 2. In addition, to investigate temperature dependence of FRA, temperature variation was given by placing a glass tube heater inside a solenoid. The glass tube heater was made by winding a heating tape (nickel-chrome alloy wire) onto a silica glass tube with an inner diameter of 19 mm and a width of 3 mm. The fiber was aligned straight inside the glass tube under the magnetic field. The temperature was varied from 25 °C to 120 °C with a precision of 0.2 °C by an auto-tuning proportional-plus-integral-plus-derivative (PID) controller. FRA was measured by using a polarimeter (Thorlabs Inc., Newton, NJ, USA, PA510) and recorded in a Poincare sphere. The induced magnetic field obtained by the DC solenoid was varied up to 0.142 Tesla (T) at 25 °C–120 °C. The magnetic field distribution in the DC solenoid under an applied magnetic field of 0.142 T with varying temperatures from 25 °C to 120 °C was measured using the Gauss/Teslameter (Sypris Test and Measurement Inc., Orlando, FL, USA, Model 7010). No shielding effect of the magnetic field for each section along with the axial position in the DC solenoid at 25 °C–120 °C through the glass tube heater was found within uncertainty of about ±0.001 T. The Verdet constant, V, of the fiber was also estimated from the measured FRA, θ, by using the well-known Faraday equation [5,18,32]:
θ = V B d l = V B L ,
in which B is the magnetic field in Tesla (T) and L is the length of the fiber under the influence of a magnetic field.
Finally, to verify the external vibration dependence of polarization state, an orientation of the polarization on the Poincare sphere was measured in various conditions of vibration with frequency from 20 Hz to 500 Hz and acceleration from 2 g to 20 g using the vibrator (Brüel & Kjær, Nærum, Denmark, LDS V830). The fiber of 70 cm length with one loop of 12 cm radius was attached onto the upper surface of the vibrator during the test.

4. Results and Discussion

To verify the existence of nano-particles in the core of the preform after its fabrication by using the MCVD process, direct TEM measurement or indirect absorption and kinetic energy measurements can be used. For the preform, the existence of Gd2O3 NPs in the core was confirmed by the TEM, which clearly showed the morphology and size distribution of Gd2O3 NPs. The particles were spherical and uniformly dispersed without agglomeration as shown in Figure 3a,b, respectively. The average diameter of Gd2O3 NPs was measured to be about 9.4 nm with the range of 4.5 nm–16.7 nm. Note that the added Al in silica glass played the role of modifying the glass network to be alumino-silicate glass and of increasing refractive index of the core. However, most of the doped Gd is believed to become oxidized to form Gd2O3 NPs, which was confirmed by the X-ray Photoelectron Spectroscopy (XPS) and the optical absorption. Furthermore, since Al and Gd dissolved in the doping solution were infiltrated into the porous silica glass layers during the doping process, the incorporated Gd2O3 NPs were uniformly dispersed due to random distribution of Al and Gd [33,34,35,36].
Figure 3c shows the XPS spectrum of the fiber preform to confirm the chemical state of Gd in the core. The binding energy was calibrated by centering the Si 2p peak at 103.3 eV. The Gd 3d5/2 peak located at 1.043 nm clearly indicates the existence of Gd2O3 NPs [37,38]. The UV-VIS absorption spectrum of the Gd2O3 NPs-doped fiber preform is shown in Figure 3d. Several distinct absorption peaks appeared in the UV region due to reorganization of the seven 4f electrons into various multiplets of Gd ions, attributed to the existence of the Gd2O3 NPs [10,39,40,41,42,43,44,45,46]. The absorption peaks appearing at 245 nm, 251 nm, 272 nm, and 310 nm can be assigned to 8S7/2 to 6D3/2, 6D9/2, 6I5/2, and 6P7/2 transitions in Gd2O3. Note that since Gd3+ ion has [Xe] 4f7 configuration and the ground state is 8S7/2, the absorption peak in Gd2O3 around 200 nm is attributed to the transition from ground 8S7/26GJ/2 [44]. Moreover, other three lowest multiplets of 6P, 6I, and 6D above the ground 8S7/2 state remains. Energies of 14 states associated with 6P, 6I, and 6D multiplets are related to distinct absorptions from 240 nm to 320 nm [5,6,7,10,39,42,43,44]. In the case of Gd2O3 NPs, therefore, the distinct absorption peaks appeared over from 200 nm to 400 nm, corresponding to the transitions from the ground 8S7/2 to the excited 6P, 6I, and 6D multiplets [10].
To confirm the retainment of Gd2O3 NPs in the fiber after the drawing the preform at high temperature (about 2150 °C), the existence of Gd2O3 NPs in the fiber core was also verified by the TEM and the absorption spectrum analysis as shown in Figure 4. Figure 4a shows the TEM image with the corresponding EDS compositional maps of Gd2O3 NPs in the optical fiber core. As seen in the TEM image, the average diameter of Gd2O3 NPs in the fiber core increased to 48 nm (size distribution: 35 nm–56 nm) from 9.4 nm in the preform. The increase in size with longitudinal growth of Gd2O3 NPs seems to be caused by the high temperature drawing process. The growth direction of Gd2O3 NPs is the same as the fiber drawing direction. In addition, the high resolution TEM image in the magnified inset image clearly shows that the embedded Gd2O3 NPs in the SiO2 glass matrix are crystalline. In addition, the EDS mapping clearly indicates that the nanoparticles consist of Gd. Note that the population density of the Gd2O3 NPs in the fiber decreased as compared with those in the preform because of the growth of Gd2O3 NPs and the elongation of the fiber during the drawing process. Also, as shown in Figure 4b, a distinct optical absorption was found to appear peaking at 377 nm, 443 nm, and 551 nm, and these absorptions are attributed to the existence of Gd2O3 NPs in the fiber core. The absorption peaks showed a superimposing tendency as compared with our previous work [26]. The absorption peaks at 377 nm, 443 nm, and 551 nm of the fiber seemed to red-shift from the corresponding peaks 251 nm, 272 nm, and 310 nm of the preform, respectively. This red-shift may be due to the increase in the size of Gd2O3 NPs in the fiber after the drawing process at high temperature. In the previous papers, the position of absorption peaks was found to shift towards long or short wavelength with the change in the size of the Gd2O3 NPs embedded in silica glass [7,10,26,42,43]. As shown in Figure 4b, the optical absorption peaks at 377 nm, 443 nm, and 551 nm can be attributed to 8S7/2 to 6D9/2, 6I5/2, and 6P7/2 transitions in Gd2O3 NPs, respectively. The intensities of absorption peaks at 377 nm, 443 nm, and 551 nm in Gd2O3 NPs of the fiber were changed to 0.02255 cm−1, 0.00189 cm−1, and 0.00427 cm−1 from 0.01709 cm−1, 0.36852 cm−1, and 0.00835 cm−1 at the corresponding peaks 251 nm, 272 nm, and 310 nm of the preform, respectively, after baseline correction. The absorption peak at 1380 nm was because of the OH impurities [47].
FRA of the Gd2O3 NPs-doped fiber was measured at 650 nm using an SLD and a linear polarizer, based on the absorption spectrum and the availability of the fiber pigtailed optical components such that FRA viz. Verdet constant is known to increase with decreasing wavelength and especially approaching the absorption peak at 551 nm [30,31,48]. Figure 5a shows the measured FRA of the Gd2O3 NPs-doped fiber at 650 nm with the increase of the induced magnetic field at room temperature (25 °C). The change in polarization states on the Poincare sphere during the Faraday rotation measurement is indicated in Figure 5b. When the light signal from the SLD at 650 nm was passed through the linear polarizer, its polarization state (dashed yellow line) was nearly overlapped with the polarized state (red line) on the Poincare sphere. The rotation was found to be counterclockwise along the polarized state, and the rotation angle increased linearly with the increase of magnetic field. The FRA of the Gd2O3 NPs-doped fiber was about 18.13° at the magnetic field of 0.142 T. With the increment of applied magnetic field by varying DC current of the solenoid, the FRA of the fiber was found to increase linearly as shown in Figure 5a. The linear dependence was calculated to be θ/B = 127.58°/T, with the standard deviation of 0.38°/T. For a comparison, the FRA of the germano-silicate glass optical fiber but without Gd2O3 NPs as a reference fiber, which was fabricated using the same processing parameters during the MCVD and fiber drawing process to satisfy the cutoff wavelength below 650 nm, was also measured, and the linear dependence was calculated to be θ/B = 72.82°/T, with the standard deviation of 0.26°/T. The core diameter, the outer diameter, and the cutoff wavelength of the reference fiber were 8.7 µm, 125 µm, and 600 nm, respectively.
From the measured FRA and by using Equation (4), the Verdet constant of the present Gd2O3 NPs-doped fiber was estimated to be 3.18 rad/(T∙m), about 1.76 times larger than that of the reference fiber (1.81 rad/(T∙m)) at 650 nm. This increase can be explained by the fact that the 4fn → 4fn−15d transition of Gd ions becomes easier, because effect of compound ligand field on the inner 4f electron shell is very small due to shielding from the outer 5s and 5p electron shell [12]. Furthermore, a Zeeman splitting of atomic energy levels under an external magnetic field may result in magneto-optical rotation. For the Gd2O3 NPs-doped fiber, the d and f states of Gd ions contribute to the observed magneto-optic effect, because these states have not only a spin-obit interaction but also the exchange interaction between the electrons. In this regard, the large Verdet constant of the alumino-silicate glass optical fiber incorporated with Gd2O3 NPs can be attributed to the trivalent Gd3+ ions, which have seven unpaired free electrons of 4f electrons shell [4,5,12]. The magnetic response depends on the product of spin orbit interactions and the net spin polarization; d and f states in Gd3+ ions have the product term stronger than p and s conduction states. This results in the magneto-optic effect being dominated by electronic transition 4f7 → 4f65d1, while 5s → 5p transition has negligible effect [12].
Based on the measured results in Figure 5, the temperature dependence at 25 °C–120 °C of the FRA of the Gd2O3 NPs-doped fiber under induced magnetic field from 0.037 T to 0.142 T was investigated. Figure 6a shows the FRA with temperature at varied magnetic fields. With the increase of temperature, no appreciable change of FRA was found regardless of the magnetic field. Average temperature dependence, which is the slope of the line (θ/T), was 12.50 × 10⁻⁴, −2.92 × 10⁻⁴, 17.90 × 10⁻⁴, and 5.46 × 10⁻⁴ °/°C at 0.037, 0.073, 0.107, and 0.142 T, respectively. The present Gd2O3 NPs-doped fiber was almost independent of changes in temperature up to 120 °C (5.46 × 10⁻⁴ °/°C) and magnetic field up to 0.142 T. However, the temperature dependence of the reference fiber (−28.40 × 10⁻⁴ °/°C) was much larger (5.2 times) than that of the Gd2O3 NPs-doped fiber.
The FRA was also plotted with magnetic field at various temperatures as shown in Figure 6b. With the increment of applied magnetic field by varying direct current (DC) at various constant temperatures, the FRA of the fiber was found to increase linearly with magnetic field. However, no appreciable deviation of the average FRA of the Gd2O3 NPs-doped fiber was found regardless of the temperature change, but that of the reference fiber increased. The average FRA and the deviation of the Gd2O3 NPs-doped fiber and the reference fiber were about 18.16° ± 0.048° and 10.19° ± 0.439° at 0.142 T at temperatures of 25 °C–120 °C, respectively. Thus, the resultant Verdet constant of the Gd2O3 NPs-doped fiber and the reference fiber at 0.142 T at 25 °C–120 °C were estimated to be 3.19 rad/(T·m) ± 0.01 rad/(T∙m) and 1.79 rad/(T·m) ± 0.08 rad/(T∙m), respectively. The experimental results on the temperature dependence of the Verdet constant are summarized in Table 1.
To examine the variation of FRA, if any, with time, the FRA of the Gd2O3 NPs-doped fiber was measured under 0.142 T at 120 °C with time at every 15 min for 120 min. The measured FRA change with time was −9.78 × 10⁻⁴ °/min. The change of the FRA after 120 min was 0.2° (Figure 7).
To examine the vibration dependence of FRA of the fibers, the FRA was measured under the vibration with acceleration from 2 g to 20 g with an interval 4 g under the frequency of 60 Hz. Figure 8 shows the vibration dependence of the Gd2O3 NPs-doped fiber and the reference fiber as a function of and frequency from 15 Hz to 500 Hz with an interval 50 Hz under the acceleration of 10 g. The deviation of polarization angle (DPA) of the Gd2O3 NPs-doped fiber and the reference fiber was found to increase from 0.163° to 2.604° and from 2.678° to 8.392°, respectively, with the increase of acceleration from 2 g to 20 g under the frequency of 60 Hz as shown in Figure 8a. However, both fibers showed large dependence on frequency (Figure 8b). The DPA increased sharply at low frequencies and soon dropped with the increase of the frequency near 50 Hz and then maintained (0.488°) up to 500 Hz under the acceleration of 10 g. The vibration dependence of the Gd2O3 NPs-doped fiber under varied acceleration and frequency was found to be smaller than that of the reference fiber. We found that the Gd2O3 NPs-doped fiber has minor DPA change under acceleration below 10 g and frequency above 50 Hz.
From the experimental results of the excellent insensitivity of temperature and vibration on the Faraday effect of the Gd2O3 NPs-doped fiber, the fiber incorporated with Gd2O3 NPs would be a good candidate for all-optical fiber magneto-optic devices, such as optical modulators, isolators, and current sensors.

5. Conclusions

We fabricated the alumino-silicate glass optical fiber incorporated with Gd2O3 NPs by using the MCVD and the fiber drawing process, and investigated its magneto-optic sensing properties based on the Faraday effect. In particular, the temperature and vibration dependence of the Faraday effect of the fiber was measured and discussed.
Uniformly embedded Gd2O3 NPs with average diameter of 9.4 nm were identified to form in the core of the fiber preform. The average diameter of Gd2O3 NPs in the fiber core was found to increase from 9.4 nm to 48 nm due to the recrystallization and growth of Gd2O3 NPs during the high temperature fiber drawing process. The core diameter, the outer diameter, the cutoff wavelength, and the numerical aperture of the fabricated optical fiber were 7.3 µm, 125 µm, 520 nm, and 0.0683, respectively. The Gd 3d5/2 peak located at 1.043 nm and the absorption peaks appearing at 377 nm, 443 nm, and 551 nm are attributed to the Gd2O3 NPs existed in the fiber core. The FRA measured at 650 nm was found to increase linearly with the magnetic field, and the linear dependence (θ/B) was 127.58°/T at 25 °C. The Verdet constant was estimated to be 3.18 rad/(T∙m), about 1.76 times larger than that of the reference fiber, 1.81 rad/(T∙m).
As for the temperature dependence of the FRA of the Gd2O3 NPs-doped fiber, no appreciable change of FRA (θ/T = 5.46 × 10⁻⁴ °/°C at 0.142 T) was found with the increase of temperature from 25 °C to 120 °C. The variation of the FRA with time at 0.142 T and 120 °C was negligibly small (−9.78 × 10⁻⁴ °/min). The average Verdet constant of the Gd2O3 NPs-doped fiber at 0.142 T at 25 °C–120 °C was estimated 3.19 rad/(T·m) ± 0.01 rad/(T∙m). The variation of the FRA under the mechanical vibration with the acceleration below 10 g and the frequency above 50 Hz was within 0.5°.

Acknowledgments

This work was partially supported by KEPCO Research Institute (KEPRI) and managed by KESRI (Project Number: KEPRI-16-23); and ICT and Future Planning, the Sports Promotion Fund of Seoul Olympic Sports Promotion Foundation from Ministry of Culture, Sports and Tourism, Korea.

Author Contributions

S.J. and W.T.H. conceived and designed the experiments; S.J. and J.K. performed the experiments; K.K., P.R.W., and S.B. analyzed the data; S.G.K., B.H.K., Y.L., Y.H.A., and C.J.K. contributed reagents/materials/analysis tools; S.J. wrote the paper.

Conflicts of Interest

The authors declare no conflict of interest.

References

  1. Weber, M.J. CRC Handbook of Laser Science and Technology. Supplement 2: Optical Materials; CRC Press: Boca Raton, FL, USA, 1995; pp. 372–382. ISBN 0-8493-3507-8. [Google Scholar]
  2. Ainslie, B.J.; Craig, S.P.; Davey, S.T. The absorption and fluorescence spectra of rare earth ions in silica-based monomode fiber. J. Lightwave Technol. 1988, 6, 287–293. [Google Scholar] [CrossRef]
  3. Wang, G.; Peng, Q.; Li, Y. Lanthanide-doped nanocrystals: Synthesis, optical-magnetic properties, and applications. Acc. Chem. Res. 2011, 44, 322–332. [Google Scholar] [CrossRef] [PubMed]
  4. Valiev, U.V.; Zvezdin, A.K.; Krinchik, G.S.; Levitin, R.Z.; Mukimov, K.M.; Popov, A.I. Faraday effect of rare-earth iron garnets in strong magnetic fields. Sov. Phys. JETP 1983, 58, 181–189. [Google Scholar]
  5. Ballato, J.; Snitzer, E. Fabrication of fibers with high rare-earth concentrations for Faraday isolator applications. Appl. Opt. 1995, 34, 6848–6854. [Google Scholar] [CrossRef] [PubMed]
  6. Bünzli, J.-C.G.; Piguet, C. Taking advantage of luminescent lanthanide ions. Chem. Soc. Rev. 2005, 34, 1048–1077. [Google Scholar] [CrossRef] [PubMed]
  7. Armelao, L.; Quici, S.; Barigelletti, F.; Accorsi, G.; Bottaro, G.; Cavazzini, M.; Tondello, E. Design of luminescent lanthanide complexes: From molecules to highly efficient photo-emitting materials. Mater. Coordin. Chem. Rev. 2010, 254, 487–505. [Google Scholar] [CrossRef]
  8. Schmidt, M.A.; Wondraczek, L.; Lee, H.W.; Granzow, N.; Da, N.; Russell, P.S.J. Complex Faraday rotation in microstructured magneto-optical fiber waveguides. Adv. Mater. 2011, 23, 2681–2688. [Google Scholar] [CrossRef] [PubMed]
  9. Xia, X.; Hu, W.; Shao, Y. Density functional theory calculations for the structural, electronic, and magnetic properties of (Gd2O3)n0,±1 Clusters with n = 1–10. J. Phys. Chem. C 2015, 119, 8349–8356. [Google Scholar] [CrossRef]
  10. Mukherjee, S.; Dasgupta, P.; Jana, P.K. Size-dependent dielectric behaviour of magnetic Gd2O3 nanocrystals dispersed in a silica matrix. J. Phys. D Appl. Phys. 2008, 41, 215004. [Google Scholar] [CrossRef]
  11. Sharma, P.; Brown, S.C.; Walter, G.; Santra, S.; Scott, E.; Ichikawa, H.; Fukumori, Y.; Moudgil, B.M. Gd nanoparticulates: From magnetic resonance imaging to neutron capture therapy. Adv. Powder Technol. 2007, 18, 663–698. [Google Scholar] [CrossRef]
  12. Erskine, J.L.; Stern, E.A. Magneto-optic Kerr effects in gadolinium. Phys. Rev. B 1973, 8, 1239–1255. [Google Scholar] [CrossRef]
  13. Sun, L.; Jiang, S.; Marciante, J.R. Compact all-fiber optical Faraday components using 65-wt%-terbium doped fiber with a record Verdet constant of −32 rad/(Tm). Opt. Express 2010, 18, 12191–12196. [Google Scholar] [CrossRef] [PubMed]
  14. Huang, Y.; Chen, H.; Dong, W.; Pang, F.; Wen, J.; Chen, Z.; Wang, T. Fabrication of europium-doped silica optical fiber with high Verdet constant. Opt. Express 2016, 24, 18709–18717. [Google Scholar] [CrossRef] [PubMed]
  15. Kim, D.H.; Yang, H.; Kim, B.H.; Peak, U.C.; Han, W.-T. Fabrication of Eu2+ doped fiber and its Faraday rotation characteristics. In Proceedings of the 9th Optoelectronics and Communications Conference/3rd International Conference on Optical Internet, Yokohama, Japan, 12–16 July 2004; pp. 512–513. [Google Scholar]
  16. Kim, Y.; Ju, S.; Jeong, S.; Jang, M.-J.; Kim, J.-Y.; Lee, N.-H.; Jung, H.-K.; Han, W.-T. Influence of gamma-ray irradiation on Faraday effect of Cu-doped germane-silicate optical fiber. Nucl. Instr. Meth. Phys. Res. B 2015, 344, 39–43. [Google Scholar] [CrossRef]
  17. Watekar, P.R.; Yang, H.Y.; Ju, S.; Han, W.-T. Enhanced current sensitivity in the optical fiber doped with CdSe quantum dots. Opt. Express 2009, 17, 3157–3164. [Google Scholar] [CrossRef] [PubMed]
  18. Watekar, P.R.; Ju, S.; Kim, S.-A.; Jeong, S.; Kim, Y.; Han, W.-T. Development of a highly sensitive compact sized optical fiber current sensor. Opt. Express 2010, 18, 17096–17105. [Google Scholar] [CrossRef] [PubMed]
  19. Jeon, S.; Ju, S.; Jeong, S.; Kim, Y.; Han, W.-T. Fabrication and magneto-optic property of the optical fiber incorporated with Cd0.5Mn0.5Te particles. In Proceedings of the Optical Society of Korea Summer Meeting, Jeju, Korea, 27–29 August 2012. [Google Scholar]
  20. Bohnert, K.; Gabus, P.; Nehring, J.; Brändle, H. Temperature and vibration insensitive fiber-optic current sensor. J. Lightwave Technol. 2002, 20, 267–276. [Google Scholar] [CrossRef]
  21. Becquerel, H. The Faraday and Zeeman effects. C. R. Acad. Sci. 1897, 125, 679–685. [Google Scholar]
  22. Williams, P.A.; Rose, A.H.; Day, G.W.; Milner, T.E.; Deeter, M.N. Temperature dependence of the Verdet constant in several diamagnetic glasses. Appl. Opt. 1991, 30, 1176–1178. [Google Scholar] [CrossRef] [PubMed]
  23. Van Vleck, J.H.; Hebb, M.H. On the paramagnetic rotation of tysonite. Phys. Rev. 1934, 46, 17–32. [Google Scholar] [CrossRef]
  24. Van Vleck, J.H. The Theory of Electric and Magnetic Susceptibilities; Oxford University Press: New York, NY, USA, 1932; ISBN 0-1985-1243-0. [Google Scholar]
  25. Imaizumi, D.; Hayakawa, T.; Nogami, M. Faraday rotation effects of Mn2+-modified Tb2O3-B2O3 glass in pulsed magnetic field. J. Lightwave Technol. 2002, 20, 740–744. [Google Scholar] [CrossRef]
  26. Ju, S.; Linganna, K.; Kim, B.H.; Boo, S.; An, Y.H.; Han, W.-T. UV photoluminescence of alumino-germano-silicate glass optical fiber incorporated with Gd2O3 nano-particles upon illumination of Xenon-lamp. J. Nanosci. Nanotechnol. 2018, 18, 2006–2009. [Google Scholar] [CrossRef] [PubMed]
  27. Deschamps, T.; Ollier, N.; Vezin, H.; Gonnet, C. Clusters dissolution of Yb3+ in codoped SiO2-Al2O3-P2O5 glass fiber and its relevance to photodarkening. J. Chem. Phys. 2012, 136, 014503. [Google Scholar] [CrossRef] [PubMed]
  28. Barua, P.; Sekiya, E.H.; Saito, K.; Ikushima, A.J. Influences of Yb3+ ion concentration on the spectroscopic properties of silica glass. J. Non-Cryst. Solids 2008, 354, 4760–4764. [Google Scholar] [CrossRef]
  29. Monteil, A.; Chaussedent, S.; Alombert-Goget, G.; Gaumer, N.; Obriot, J.; Ribeiro, S.J.L.; Messaddeq, Y.; Chiasera, A.; Ferrari, M. Clustering of rare earth in glasses, aluminum effect: Experiments and modeling. J. Non-Cryst. Solids 2004, 348, 44–50. [Google Scholar] [CrossRef] [Green Version]
  30. Tan, C.Z.; Arndt, J. Wavelength dependence of the Faraday effect in glassy SiO2. J. Phys. Chem. Solids 1999, 60, 1689–1692. [Google Scholar] [CrossRef]
  31. Villaverde, A.B.; Vasconcellos, E.C.C. Magnetooptical dispersion of Hoya glasses: AOT-5, AOT-44B, and FR-5. Appl. Opt. 1982, 21, 1347–1348. [Google Scholar] [CrossRef] [PubMed]
  32. Yamane, M.; Asahara, Y. Glasses for Photonics; Cambridge University Press: Cambridge, UK, 2000; pp. 242–263. ISBN 0-05210-1861-7. [Google Scholar]
  33. Lin, S.-L.; Hwang, C.-S. Structures of CeO2-Al2O3-SiO2 glasses. J. Non-Cryst. Solids 1996, 202, 61–67. [Google Scholar] [CrossRef]
  34. Ganster, P.; Benoit, M.; Kob, W.; Delaye, J.-M. Structural properties of a calcium aluminosilicate glass from molecular-dynamics simulations: A finite size effects study. J. Chem. Phys. 2004, 120, 10172–10181. [Google Scholar] [CrossRef] [PubMed]
  35. Lægsgaard, J. Theory of Al2O3 incorporation in SiO2. Phys. Rev. B 2002, 65, 174104. [Google Scholar] [CrossRef] [Green Version]
  36. Bubnov, M.M.; Vechkanov, V.N.; Gur’yanov, A.N.; Zotov, K.V.; Lipatov, D.S.; Likhachev, M.E.; Yashkov, M.V. Fabrication and Optical Properties of Fibers with an Al2O3–P2O5–SiO2 Glass Core. Inorg. Mater. 2009, 45, 444–449. [Google Scholar] [CrossRef]
  37. Moulder, J.F.; Stickle, W.F.; Sobol, P.E.; Bomben, K.D. Handbook of X-ray Photoelectron Spectroscopy: A Reference Book of Standard Spectra for Identification and Interpretation of XPS Data. Physical Electronics Division; Perkin-Elmer Corporation: Eden Prairie, MN, USA, 1992; pp. 152–153. ISBN 0-9627-0262-5. [Google Scholar]
  38. Zheng, L.; Cheng, X.; Cao, D.; Zhang, D.; Wang, Z.; Xu, D.; Xia, C.; Shen, L.; Yu, Y. Al2O3–Gd2O3 double-films grown on graphene directly by H2O-assisted atomic layer deposition. RSC Adv. 2014, 4, 44296–44301. [Google Scholar] [CrossRef]
  39. Moretti, F.; Chiodini, N.; Fasoli, M.; Griguta, L.; Vedda, A. Optical absorption and emission properties of Gd3+ in silica host. J. Lumin. 2007, 126, 759–763. [Google Scholar] [CrossRef]
  40. Martino, D.D.; Chiodini, N.; Fasoli, M.; Moretti, F.; Vedda, A.; Baraldi, A.; Buffagni, E.; Capelletti, R.; Mazzera, M.; Nikl, M.; et al. Gd-incorporation and luminescence properties in sol–gel silica glasses. J. Non-Cryst. Solids 2008, 354, 3817–3823. [Google Scholar] [CrossRef]
  41. Kumar, P.A.; Rai, D.K.; Rai, S.B. Luminescence of Gd3+ ions doped in oxyfluoroborate glass. Solid State Commun. 2001, 117, 387–392. [Google Scholar] [CrossRef]
  42. Wybourne, B.G. Energy levels of trivalent gadolinium and ionic contributions to the ground-state splitting. Phys. Rev. 1966, 148, 317–327. [Google Scholar] [CrossRef]
  43. Rahman, A.T.M.A.; Vasilev, K.; Majewski, P. Ultra small Gd2O3 nanoparticles: Absorption and emission properties. J. Colloid Interface Sci. 2011, 354, 592–596. [Google Scholar] [CrossRef] [PubMed]
  44. Kirm, M.; Krupa, J.C.; Makhov, V.N.; True, M.; Vielhauer, S.; Zimmerer, G. High-resolution vacuum ultraviolet spectroscopy of 5d-4f transitions in Gd and Lu fluorides. Phys. Rev. B 2004, 70, 241101. [Google Scholar] [CrossRef]
  45. Wegh, R.T.; Donker, H.; Meijerink, A.; Lamminmäki, R.J.; Hölsä, J. Vacuum-ultraviolet spectroscopy and quantum cutting for Gd3+ in LiYF4. Phys. Rev. B 1997, 56, 13841–13848. [Google Scholar] [CrossRef]
  46. Hirai, T.; Hashimoto, S.; Sakuragi, S.; Ohno, N. 4f-5d absorption of gadolinium ions in sodium gadolinium tetrafluorides. Chem. Phys. Lett. 2007, 446, 138–141. [Google Scholar] [CrossRef]
  47. Stone, J. Reduction of OH absorption in optical fibers by OH → OD isotope exchange. Ind. Eng. Chem. Prod. Res. Dev. 1986, 25, 609–621. [Google Scholar] [CrossRef]
  48. Wunderlich, J.A.; DeShazer, L.G. Visible optical isolator using ZnSe. Appl. Opt. 1977, 16, 1584–1587. [Google Scholar] [CrossRef] [PubMed]
Figure 1. Refractive index profile of the Gd2O3 NPs-doped fiber.
Sensors 18 00988 g001
Figure 2. Experimental set-up to measure the temperature-dependent FRA of the Gd2O3 NPs-doped fiber under magnetic field induced by the DC solenoid.
Sensors 18 00988 g002
Figure 3. (a) TEM image; (b) size distribution; (c) XPS spectrum; and (d) UV-VIS spectrum of the Gd2O3 NPs-doped fiber preform.
Sensors 18 00988 g003
Figure 4. (a) TEM image with the EDS compositional maps for Gd, Si, and O and (b) absorption spectrum of the Gd2O3 NPs-doped fiber.
Sensors 18 00988 g004
Figure 5. (a) Variation of the FRA with the increase of magnetic field at room temperature and (b) change in polarization states on a Poincare sphere of the Gd2O3 NPs-doped fiber.
Sensors 18 00988 g005
Figure 6. (a) Variation of the FRA of the Gd2O3 NPs-doped fiber with temperature under varied magnetic fields and comparison of the FRA of the Gd2O3 NPs-doped fiber and the reference fiber; (b) with temperature under 0.142 T; and (c) with magnetic field under varied temperature. The lines shown in the figures were obtained by the linear regression fitting.
Sensors 18 00988 g006
Figure 7. Variation of the FRA as function of the time under 0.142 T at 120 °C.
Sensors 18 00988 g007
Figure 8. Vibration dependence of the Gd2O3 NPs-doped fiber and the reference fiber as a function of (a) acceleration under the frequency of 60 Hz and (b) frequency under the acceleration of 10 g. The inset in (b) shows the enlarged DPA of the Gd2O3 NPs-doped fiber from 45 Hz to 50 Hz with the interval of 1 Hz.
Sensors 18 00988 g008
Table 1. Verdet constants of the Gd2O3 NPs-doped fiber upon applying the magnetic fields at various constant temperatures.
Verdet Constant (rad/(T·m))
at 0.037 Tat 0.073 Tat 0.107 Tat 0.142 TAverage
Temperature (°C)253.153.183.163.183.17
403.163.193.183.193.18
603.133.153.163.183.16
803.263.203.183.193.21
1003.193.183.193.193.19
1203.203.163.213.193.19

