Thermal Energy Harvesting on the Bodily Surfaces of Arms and Legs through a Wearable Thermo-Electric Generator

 , , and
Abstract
:1. Introduction
1.1. Physiological and Environmental Aspects
1.2. Thermoelectric Generators
2. Materials and Methods
2.1. Thermoelectric Effect
2.2. Thermoelectric Generator Chosen
2.3. System for Temperature Measurements
2.4. Fabric Band for Supporting the TEG
2.5. Human Body Positions for the Placement of TEG
3. Experimental Section
3.1. Preliminary Maesurements
3.2. Execution of Human Daily Activities in a Controlled Environment
3.3. Execution of Human Daily Activities in Real Scenarios
4. Discussion
5. Conclusions
Supplementary Materials
Author Contributions
Funding
Conflicts of Interest
References
- Starner, T. Human-powered wearable computing. IBM Syst. J. 1996, 35, 618–629. [Google Scholar] [CrossRef] [Green Version]
- Merrett, G.V.; Huang, H.; White, N.M. Modeling the Effect of Orientation on Human-Powered Inertial Energy Harvesters. IEEE Sens. J. 2015, 15, 434–441. [Google Scholar] [CrossRef]
- Mitcheson, P.D.; Yeatman, E.M.; Kondala Rao, G.; Holmes, A.S.; Green, T.C. Energy harvesting from human and machine motion for wireless electronic devices. Proc. IEEE 2008, 96, 1457–1486. [Google Scholar] [CrossRef] [Green Version]
- Proto, A.; Penhaker, M.; Conforto, S.; Schmid, M. Nanogenerators for Human Body Energy Harvesting. Trends Biotechnol. 2017, 35, 610–624. [Google Scholar] [CrossRef] [PubMed]
- Paul, G.M.; Cao, F.; Torah, R.; Yang, K.; Beeby, S.; Tudor, J. A Smart Textile Based Facial EMG and EOG Computer Interface. IEEE Sens. J. 2014, 14, 393–400. [Google Scholar] [CrossRef]
- Caramia, C.; Bernabucci, I.; Conforto, S.; De Marchis, C.; Proto, A.; Schmid, M. Spatio-Temporal Gait Parameters as Estimated from Wearable Sensors Placed at Different Waist Levels. In Proceedings of the 2016 IEEE-EMBS Conference on Biomedical Engineering and Sciences (IECBES), Kuala Lampur, Malaysia, 4–8 December 2016; pp. 727–730. [Google Scholar]
- Banaee, H.; Ahmed, M.U.; Loutfi, A. Data Mining for Wearable Sensors in Health Monitoring Systems: A Review of Recent Trends and Challenges. Sensors 2013, 13, 17472–17500. [Google Scholar] [CrossRef] [PubMed] [Green Version]
- De Mulatier, S.; Nasreldin, M.; Delattre, R.; Ramuz, M.; Djenizian, T. Electronic Circuits Integration in Textiles for Data Processing in Wearable Technologies. Adv. Mater. Technol. 2018, 3, 1700320. [Google Scholar] [CrossRef]
- Lee, J.; Kim, D.; Ryoo, H.Y.; Shin, B.S. Sustainable wearables: Wearable technology for enhancing the quality of human life. Sustainability 2016, 8, 466. [Google Scholar] [CrossRef]
- Starner, T. How Wearables Worked their Way into the Mainstream. IEEE Pervasive Comput. 2014, 13, 10–15. [Google Scholar] [CrossRef]
- Lee, Y.G.; Kim, J.; Kang, M.S.; Baek, S.H.; Kim, S.K.; Lee, S.M.; Lee, J.; Hyun, D.B.; Ju, B.K.; Moon, S.E.; et al. Design and Experimental Investigation of Thermoelectric Generators for Wearable Applications. Adv. Mater. Technol. 2017, 2, 1600292. [Google Scholar] [CrossRef]
- Yang, Y.; Liu, J. Evaluation of the power-generation capacity of wearable thermoelectric power generator. Front. Energy Power Eng. China 2010, 4, 346–357. [Google Scholar] [CrossRef]
- Pennes, H.H. Analysis of tissue and arterial blood temperatures in the resting human forearm. J. Appl. Physiol. 1998, 85, 5–34. [Google Scholar] [CrossRef] [PubMed]
- Charny, C.K. Mathematical models of bioheat transfer. Adv. Heat Transf. 1992, 22, 19–155. [Google Scholar] [CrossRef]
- Quesada, J.I.P.; Carpes, F.P.; Bini, R.R.; Palmer, R.S.; Perez-Soriano, P.; de Anda, R.M.C.O. Relationship between skin temperature and muscle activation during incremental cycle exercise. J. Therm. Biol. 2015, 48, 28–35. [Google Scholar] [CrossRef] [PubMed]
- Yang, J.H.; Cho, H.S.; Park, S.H.; Lee, J.H. A study on skin temperature distribution of the human body as fundamental data for developing heat energy harvesting clothing. Korean Soc. Emot. Sensib. 2011, 14, 435–444. [Google Scholar]
- Zaproudina, N.; Varmavuo, V.; Airaksinen, O.; Narhi, M. Reproducibility of infrared thermography measurements in healthy individuals. Physiol. Meas. 2008, 29, 515–524. [Google Scholar] [CrossRef] [PubMed]
- Webb, P. Temperatures of skin, subcutaneous tissue, muscle and core in resting men in cold, comfortable and hot conditions. Eur. J. Appl. Physiol. Occup. Physiol. 1992, 64, 471–476. [Google Scholar] [CrossRef] [PubMed]
- Zhou, M.; Al-Furjan, M.S.H.; Zou, J.; Liu, W.T. A review on heat and mechanical energy harvesting from human—Principles, prototypes and perspectives. Renew. Sustain. Energy Rev. 2018, 82, 3582–3609. [Google Scholar] [CrossRef]
- Suarez, F.; Nozariasbmarz, A.; Vashaee, D.; Öztürk, M.C. Designing thermoelectric generators for self-powered wearable electronics. Energy Environ. Sci. 2016, 9, 2099–2113. [Google Scholar] [CrossRef]
- Seebeck, T.J. Magnetic Polarization of Metals and Minerals by Temperature Differences. Treatises R. Acad. Sci. 1822, 265, 1822–1823. [Google Scholar]
- Vedernikov, M.V.; Iordanishvili, E.K.A.F. Ioffe and origin of modern semiconductor thermoelectric energy conversion. In Proceedings of the XVII International Conference on Thermoelectrics (ICT), Nagoya, Japan, 28 May 1998; pp. 37–42. [Google Scholar] [CrossRef]
- Kishi, M.; Nemoto, H.; Hamao, T.; Yamamoto, M.; Sudou, S.; Mandai, M.; Yamamoto, S. Micro thermoelectric modules and their application to wristwatches as an energy source. In Proceedings of the XVIII International Conference on Thermoelectrics (ICT), Baltimore, MD, USA, 29 August–2 September 1999. [Google Scholar] [CrossRef]
- Leonov, V.; Fiorini, P.; Sedky, S.; Torfs, T.; Van Hoof, C. Thermoelectric MEMS generators as a power supply for a body area network. In Proceedings of the 13th International Conference on Solid-State Sensors, Actuators and Microsystems. Digest of Technical Papers (TRANSDUCERS‘05), Seoul, Korea, 5–9 June 2005; pp. 291–294. [Google Scholar] [CrossRef]
- Torfs, T.; Leonov, V.; Van Hoof, C.; Gyselinckx, B. Body-heat powered autonomous pulse oximeter. In Proceedings of the 2006 Conference on Sensors, Daegu, Korea, 22–25 October 2006. [Google Scholar] [CrossRef]
- Leonov, V.; Gyselinckx, B.; Van Hoof, C.; Torfs, T.; Yazicioglu, R.F.; Vullers, R.J.M.; Fiorini, P. Wearable self-powered wireless devices with thermoelectric energy scavengers. In Proceedings of the 2nd European Conference & Exhibition on Integration Issues of Miniaturized Systems—MOMS, MOEMS, ICS and Electronic Components (SSI), Barcelona, Spain, 9–10 April 2008. [Google Scholar]
- Leonov, V.; Vullers, R.J.M. Wearable electronics self-powered by using human body heat: The state of the art and the perspective. J. Renew. Sustain. Energy 2009, 1, 062701. [Google Scholar] [CrossRef]
- Leonov, V.; Van Hoof, C.; Vullers, R.J.M. Thermoelectric and Hybrid Generators in Wearable Devices and Clothes. In Proceedings of the 6th International Workshop on Wearable and Implantable Body Sensor Networks, Berkeley, CA, USA, 3–5 June 2009; p. 195. [Google Scholar] [CrossRef]
- Lossec, M.; Multon, B.; Ben Ahmed, H.; Goupil, C. Thermoelectric generator placed on the human body: System modeling and energy conversion improvements. Eur. Phys. J. Appl. Phys. 2010, 52. [Google Scholar] [CrossRef]
- Voss, T.J.; Subbian, V.; Beyette, F.R. Feasibility of Energy Harvesting Techniques for Wearable Medical Devices. In Proceedings of the 36th Annual International Conference of the IEEE-Engineering-in-Medicine-and-Biology-Society (EMBC), Chicago, IL, USA, 26–30 August 2014; pp. 626–629. [Google Scholar] [CrossRef]
- Lossec, M.; Multon, B.; Ben Ahmed, H. Sizing optimization of a thermoelectric generator set with heatsink for harvesting human body heat. Energy Convers. Manag. 2013, 68, 260–265. [Google Scholar] [CrossRef]
- Snyder, G.J.; Toberer, E.S. Complex thermoelectric materials. Nat. Mater. 2008, 7, 105–114. [Google Scholar] [CrossRef] [PubMed]
- Zebarjadi, M.; Esfarjani, K.; Dresselhaus, M.S.; Ren, Z.F.; Chen, G. Perspectives on thermoelectrics: From fundamentals to device applications. Energy Environ. Sci. 2012, 5, 5147–5162. [Google Scholar] [CrossRef]
- DiSalvo, F.J. Thermoelectric cooling and power generation. Science 1999, 285, 703–706. [Google Scholar] [CrossRef] [PubMed]
- Carmo, J.P.; Antunes, J.; Silva, M.F.; Ribeiro, J.F.; Goncalves, L.M.; Correia, J.H. Characterization of thermoelectric generators by measuring the load-dependence behavior. Measurement 2011, 44, 2194–2199. [Google Scholar] [CrossRef]
- Attivissimo, F.; Carducci, C.G.C.; Lanzolla, A.M.L.; Spadavecchia, M. An Extensive Unified Thermo-Electric Module Characterization Method. Sensors 2016, 16, 2114. [Google Scholar] [CrossRef] [PubMed]
- Montecucco, A.; Siviter, J.; Knox, A.R. The effect of temperature mismatch on thermoelectric generators electrically connected in series and parallel. Appl. Energy 2014, 123, 47–54. [Google Scholar] [CrossRef]
- Bandyopadhyay, S.; Chandrakasan, A.P. Platform architecture for solar, thermal, and vibration energy combining with MPPT and single inductor. IEEE J. Solid-State Circuits 2012, 47, 2199–2215. [Google Scholar] [CrossRef]
- Vullers, R.J.M.; van Schaijk, R.; Doms, I.; Van Hoof, C.; Mertens, R. Micropower energy harvesting. Solid State Electron. 2009, 53, 684–693. [Google Scholar] [CrossRef]
- Sanchez, A.; Blanc, S.; Yuste, P.; Perles, A.; Serrano, J.J. An Ultra-Low Power and Flexible Acoustic Modem Design to Develop Energy-Efficient Underwater Sensor Networks. Sensors 2012, 12, 6837–6856. [Google Scholar] [CrossRef] [PubMed] [Green Version]
- Lallart, M.; Phung, L.V.; Massot, B. Transformer-Free, Off-the-Shelf Electrical Interface for Low-Voltage DC Energy Harvesting. IEEE Trans. Ind. Electron. 2018, 65, 5580–5589. [Google Scholar] [CrossRef]
- Hyland, M.; Hunter, H.; Liu, J.; Veety, E.; Vashaee, D. Wearable thermoelectric generators for human body heat harvesting. Appl. Energy 2016, 182, 518–524. [Google Scholar] [CrossRef] [Green Version]
- Wahbah, M.; Alhawari, M.; Mohammad, B.; Saleh, H.; Ismail, M. Characterization of human body-based thermal and vibration energy harvesting for wearable devices. IEEE J. Emerg. Sel. Top. Circuits Syst. 2014, 4, 354–363. [Google Scholar] [CrossRef]
- Francioso, L.; De Pascali, C.; Sglavo, V.; Grazioli, A.; Masieri, M.; Siciliano, P. Modelling, fabrication and experimental testing of an heat sink free wearable thermoelectric generator. Energy Convers. Manag. 2017, 145, 204–213. [Google Scholar] [CrossRef]
- Cho, H.K.; Kim, D.H.; Sin, H.S.; Cho, C.H.; Han, S. Flexible Thermoelectric Device Using Thick Films for Energy Harvesting from the Human Body. J. Korean Ceram. Soc. 2017, 54, 518–524. [Google Scholar] [CrossRef] [Green Version]
- Wang, Y.C.; Shi, Y.G.; Mei, D.Q.; Chen, Z.C. Wearable thermoelectric generator for harvesting heat on the curved human wrist. Appl. Energy 2017, 205, 710–719. [Google Scholar] [CrossRef]
- Trung, N.H.; Toan, N.V.; Ono, T. Flexible thermoelectric power generator with Y-type structure using electrochemical deposition process. Appl. Energy 2018, 210, 467–476. [Google Scholar] [CrossRef]
- Siddique, A.M.; Rabari, R.; Mahmud, S.; Van Heyst, B. Thermal energy harvesting from the human body using flexible thermoelectric generator (FTEG) fabricated by a dispenser printing technique. Energy 2016, 115, 1081–1091. [Google Scholar] [CrossRef]
- Lu, Z.S.; Zhang, H.H.; Mao, C.P.; Li, C.M. Silk fabric-based wearable thermoelectric generator for energy harvesting from the human body. Appl. Energy 2016, 164, 57–63. [Google Scholar] [CrossRef]
- Deng, F.; Qiu, H.B.; Chen, J.; Wang, L.; Wang, B. Wearable Thermoelectric Power Generators Combined With Flexible Supercapacitor for Low-Power Human Diagnosis Devices. IEEE Trans. Ind. Electron. 2017, 64, 1477–1485. [Google Scholar] [CrossRef]
- Khalifa, S.; Lan, G.; Hassan, M.; Seneviratne, A.; Das, S.K. HARKE: Human Activity Recognition from Kinetic Energy Harvesting Data in Wearable Devices. Trans. Mob. Comput. 2018, 17, 1353–1368. [Google Scholar] [CrossRef]


| Body Positions | Yang et al. [16] (Tair = 17 °C) | Zaproudina et al. [17] (Tair = 23.5 °C) | Webb [18] (Tair = 27 °C) |
|---|---|---|---|
| Forehead | 29.5 °C | 34.1 °C | 35.2 °C |
| Neck | 31.1 °C | 33.2 °C | 35.1 °C |
| Back | 30.6 °C | 32.5 °C | 34.4 °C |
| Chest | 30.3 °C | 32.3 °C | 34.4 °C |
| Arm anterior | 30.3 °C | 31.7 °C | 33.2 °C |
| Forearm | 29.5 °C | 31.5 °C | 34.0 °C |
| Thigh | 28.3 °C | 30.8 °C | 33.0 °C |
| Calf | 29.4 °C | 31.3 °C | 31.6 °C |
| Foot dorsal | 27.1 °C | 28.6 °C | 30.4 °C |
| Property | Value |
|---|---|
| Dimension, (l × w × t) | 30 mm × 30 mm × 3.2 mm |
| Weight | 0.015 g |
| Ceramic substrate material | Aluminum oxide (Al2O3) |
| Metal conductors material | Copper (Cu) |
| Number of p-n couples | 127 |
| p- and n-type elements | Bismuth telluride (Bi2Te3) |
| Electrical conductivity, σ | 800–13,501/(cm·Ω) |
| Thermal conductivity, | 0.016–0.02 W/(cm·K) |
| Seebeck coefficient, α | 160–200 µV/K |
| Coefficient of merit, | 0.002695–0.0031/K |
| Time-Interval (s) | Gastrocnemius Values (μW) | Biceps Brachii Values (μW) | ||||
|---|---|---|---|---|---|---|
| 25th | Median | 75th | 25th | Median | 75th | |
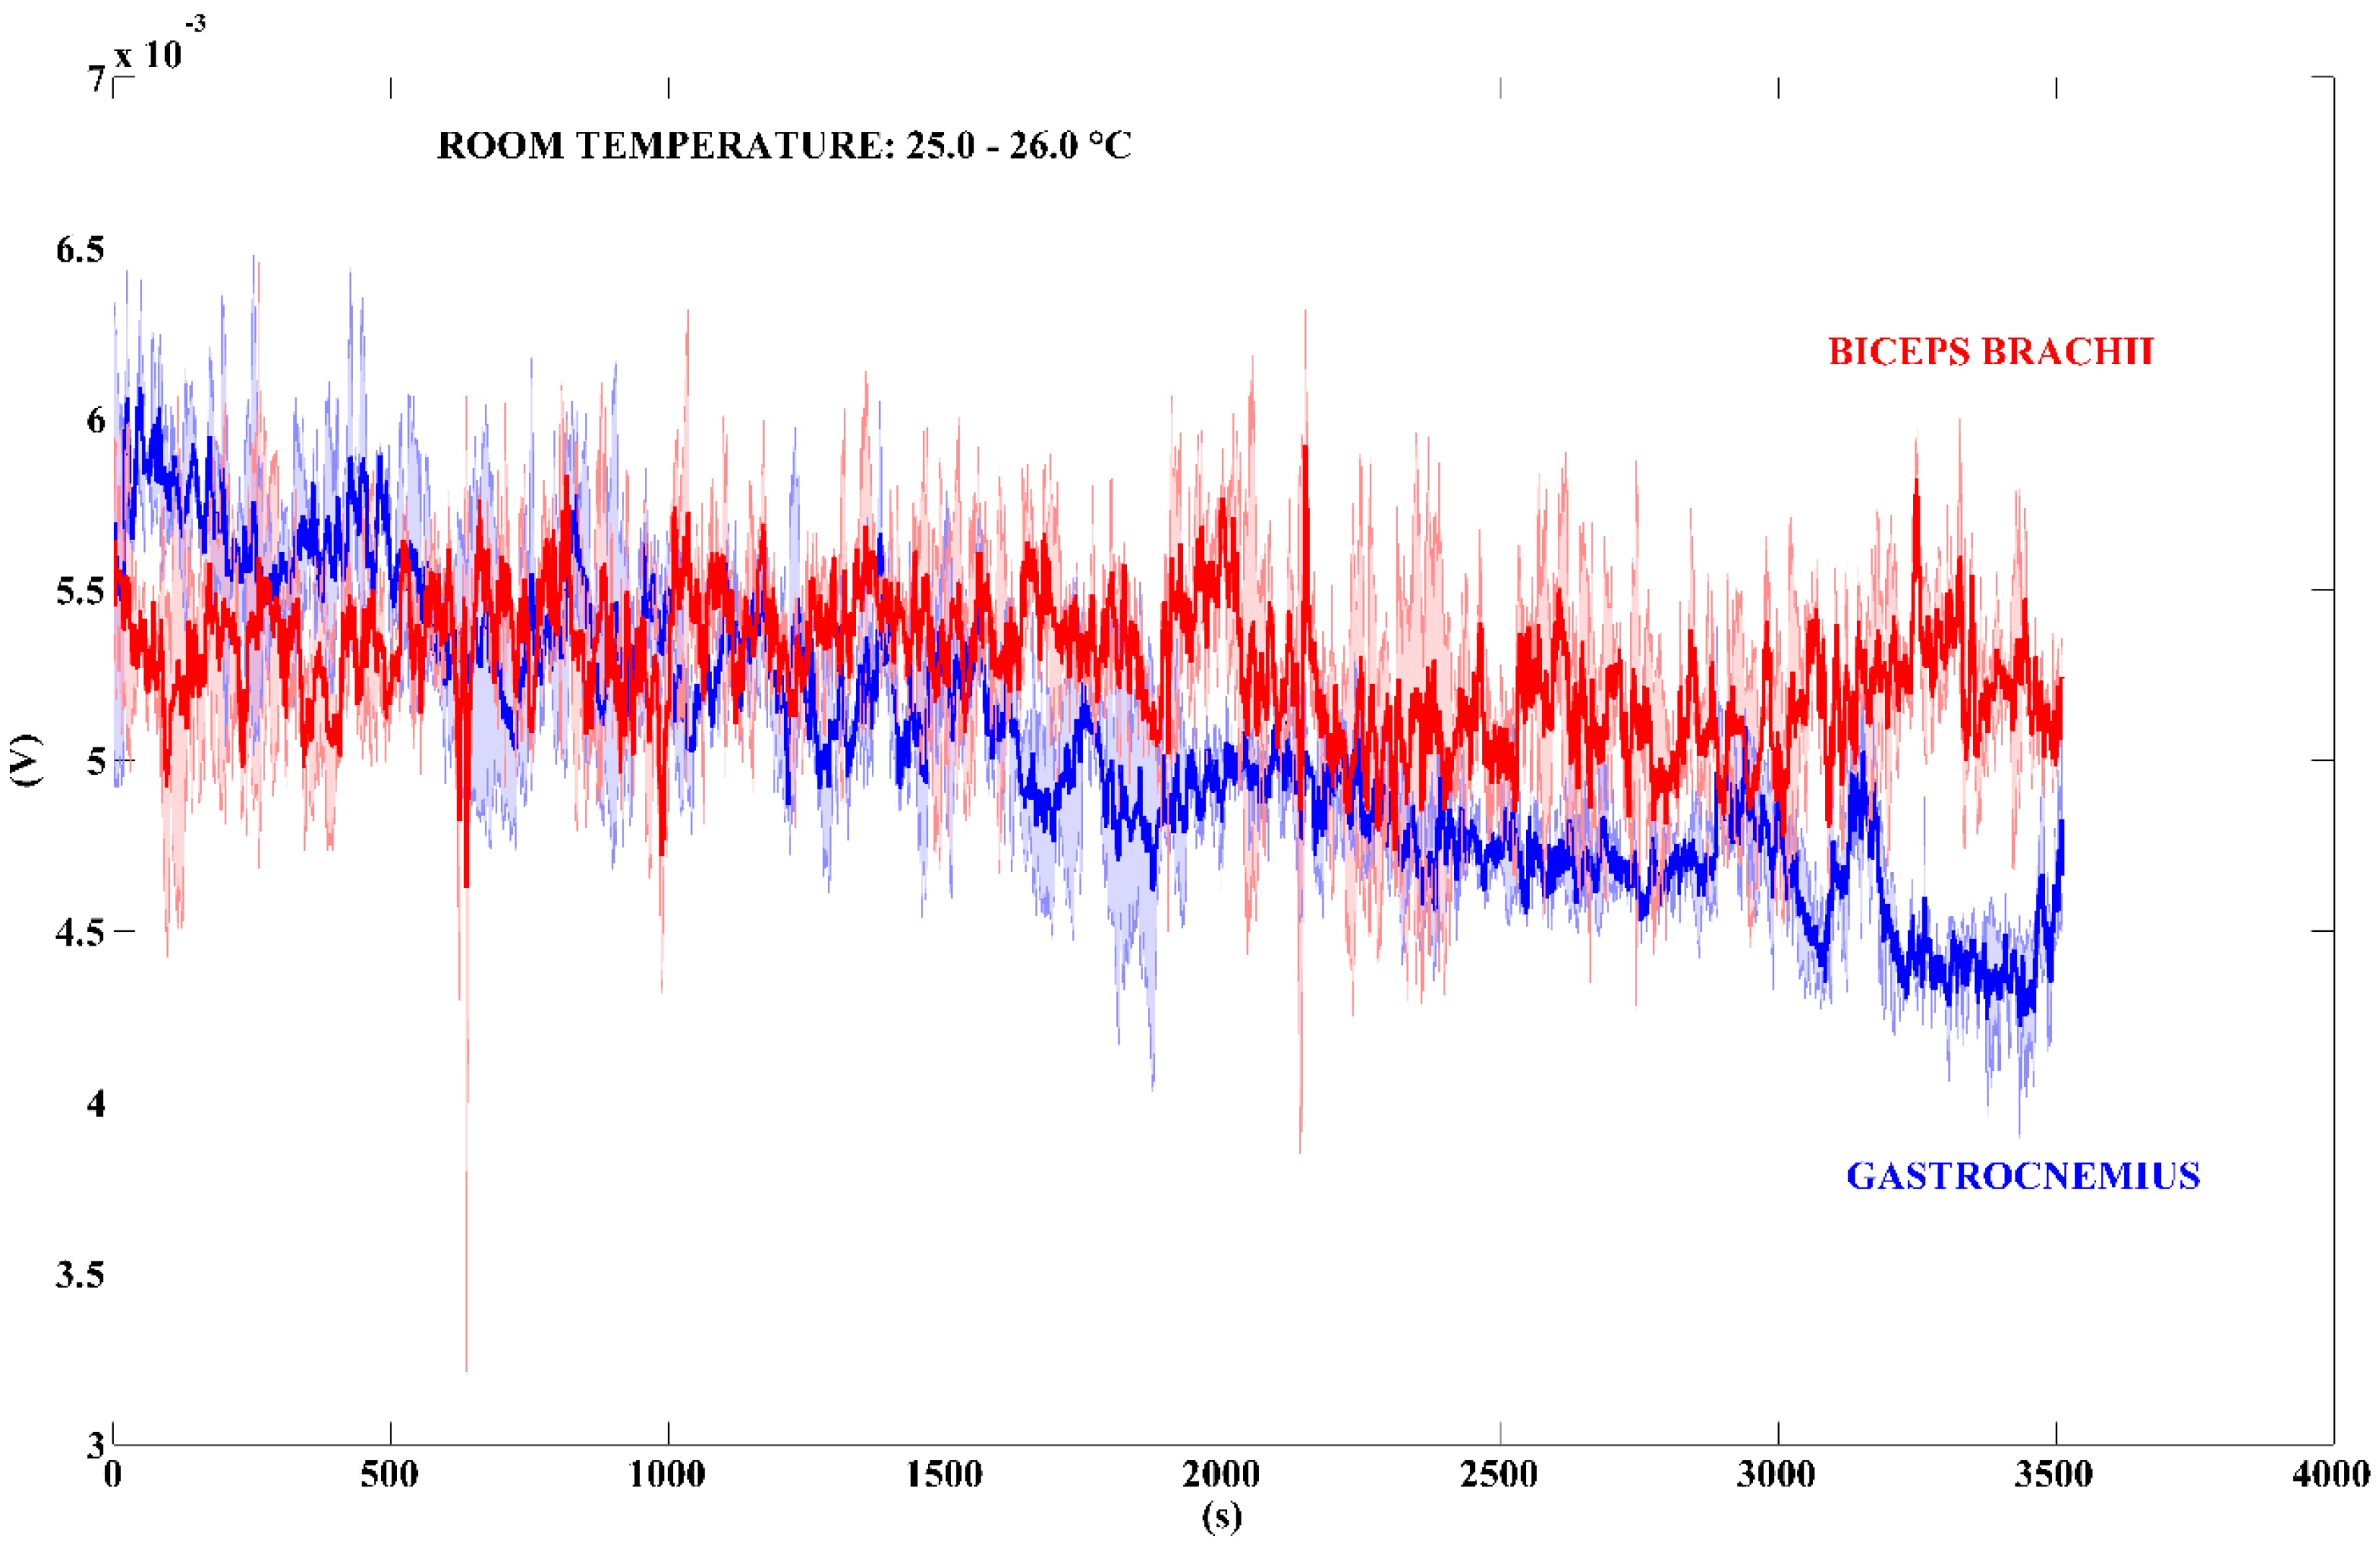
| 1350 | 5.86 ± 0.92 | 6.18 ± 0.97 | 6.65 ± 1.04 | 3.44 ± 0.76 | 3.92 ± 1.09 | 4.47 ± 1.47 |
| 3500 | 3.52 ± 0.24 | 4.01 ± 0.26 | 4.67 ± 0.34 | 4.24 ± 0.18 | 4.65 ± 0.13 | 5.03 ± 0.24 |
| Time-Interval (s) | Gastrocnemius Values (μW) | ||
|---|---|---|---|
| 25th | Median | 75th | |
| 2650 | 27.77 ± 1.20 | 37.07 ± 0.40 | 51.79 ± 1.42 |
© 2018 by the authors. Licensee MDPI, Basel, Switzerland. This article is an open access article distributed under the terms and conditions of the Creative Commons Attribution (CC BY) license (http://creativecommons.org/licenses/by/4.0/).
Share and Cite
Proto, A.; Bibbo, D.; Cerny, M.; Vala, D.; Kasik, V.; Peter, L.; Conforto, S.; Schmid, M.; Penhaker, M. Thermal Energy Harvesting on the Bodily Surfaces of Arms and Legs through a Wearable Thermo-Electric Generator. Sensors 2018, 18, 1927. https://doi.org/10.3390/s18061927
Proto A, Bibbo D, Cerny M, Vala D, Kasik V, Peter L, Conforto S, Schmid M, Penhaker M. Thermal Energy Harvesting on the Bodily Surfaces of Arms and Legs through a Wearable Thermo-Electric Generator. Sensors. 2018; 18(6):1927. https://doi.org/10.3390/s18061927
Chicago/Turabian StyleProto, Antonino, Daniele Bibbo, Martin Cerny, David Vala, Vladimir Kasik, Lukas Peter, Silvia Conforto, Maurizio Schmid, and Marek Penhaker. 2018. "Thermal Energy Harvesting on the Bodily Surfaces of Arms and Legs through a Wearable Thermo-Electric Generator" Sensors 18, no. 6: 1927. https://doi.org/10.3390/s18061927