Rapid Airplane Detection in Remote Sensing Images Based on Multilayer Feature Fusion in Fully Convolutional Neural Networks

Abstract
:1. Introduction
2. Multilayer Feature Fusion
2.1. Classical Object Detection Network and Limitations
2.1.1. Network Structure and Characteristics
2.1.2. Network Limitations
2.2. Shallow and Deep Layer Feature Fusion for Convolutional Neural Networks
3. Methodology
3.1. Overall Boxwork and Technical Details of the Detection Network
- (1)
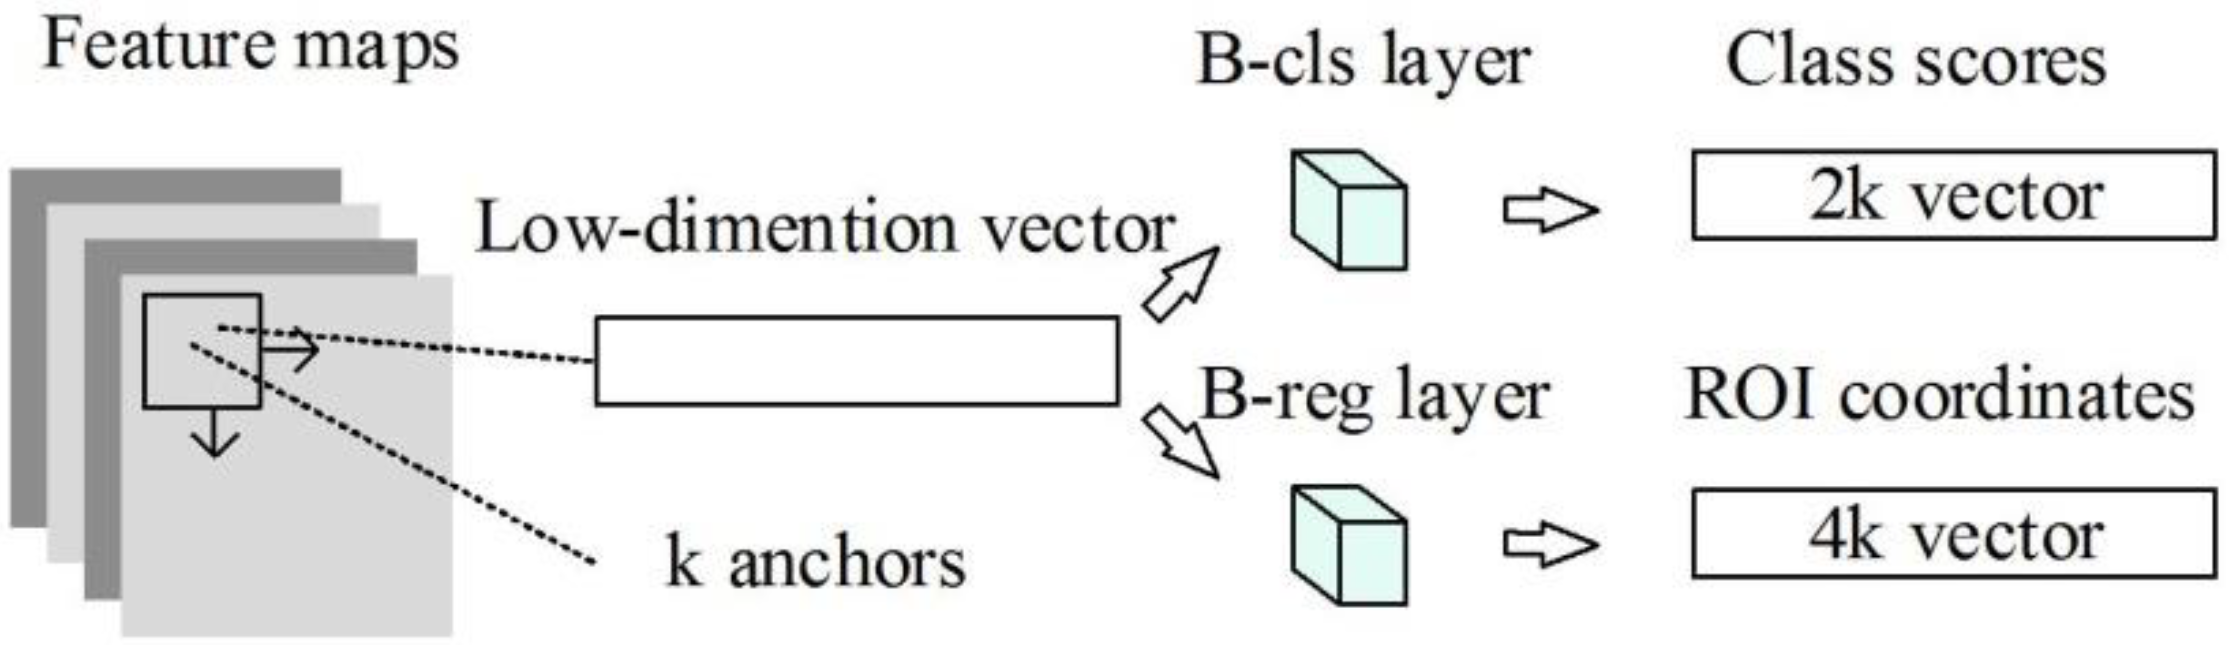
- Since the size of an airplane in an image is usually small and its shape is mostly square, three relatively small sizes and three aspect ratios were selected for a total of nine candidate region generation parameter sets. The choices are summarized in Table 1.
- (2)
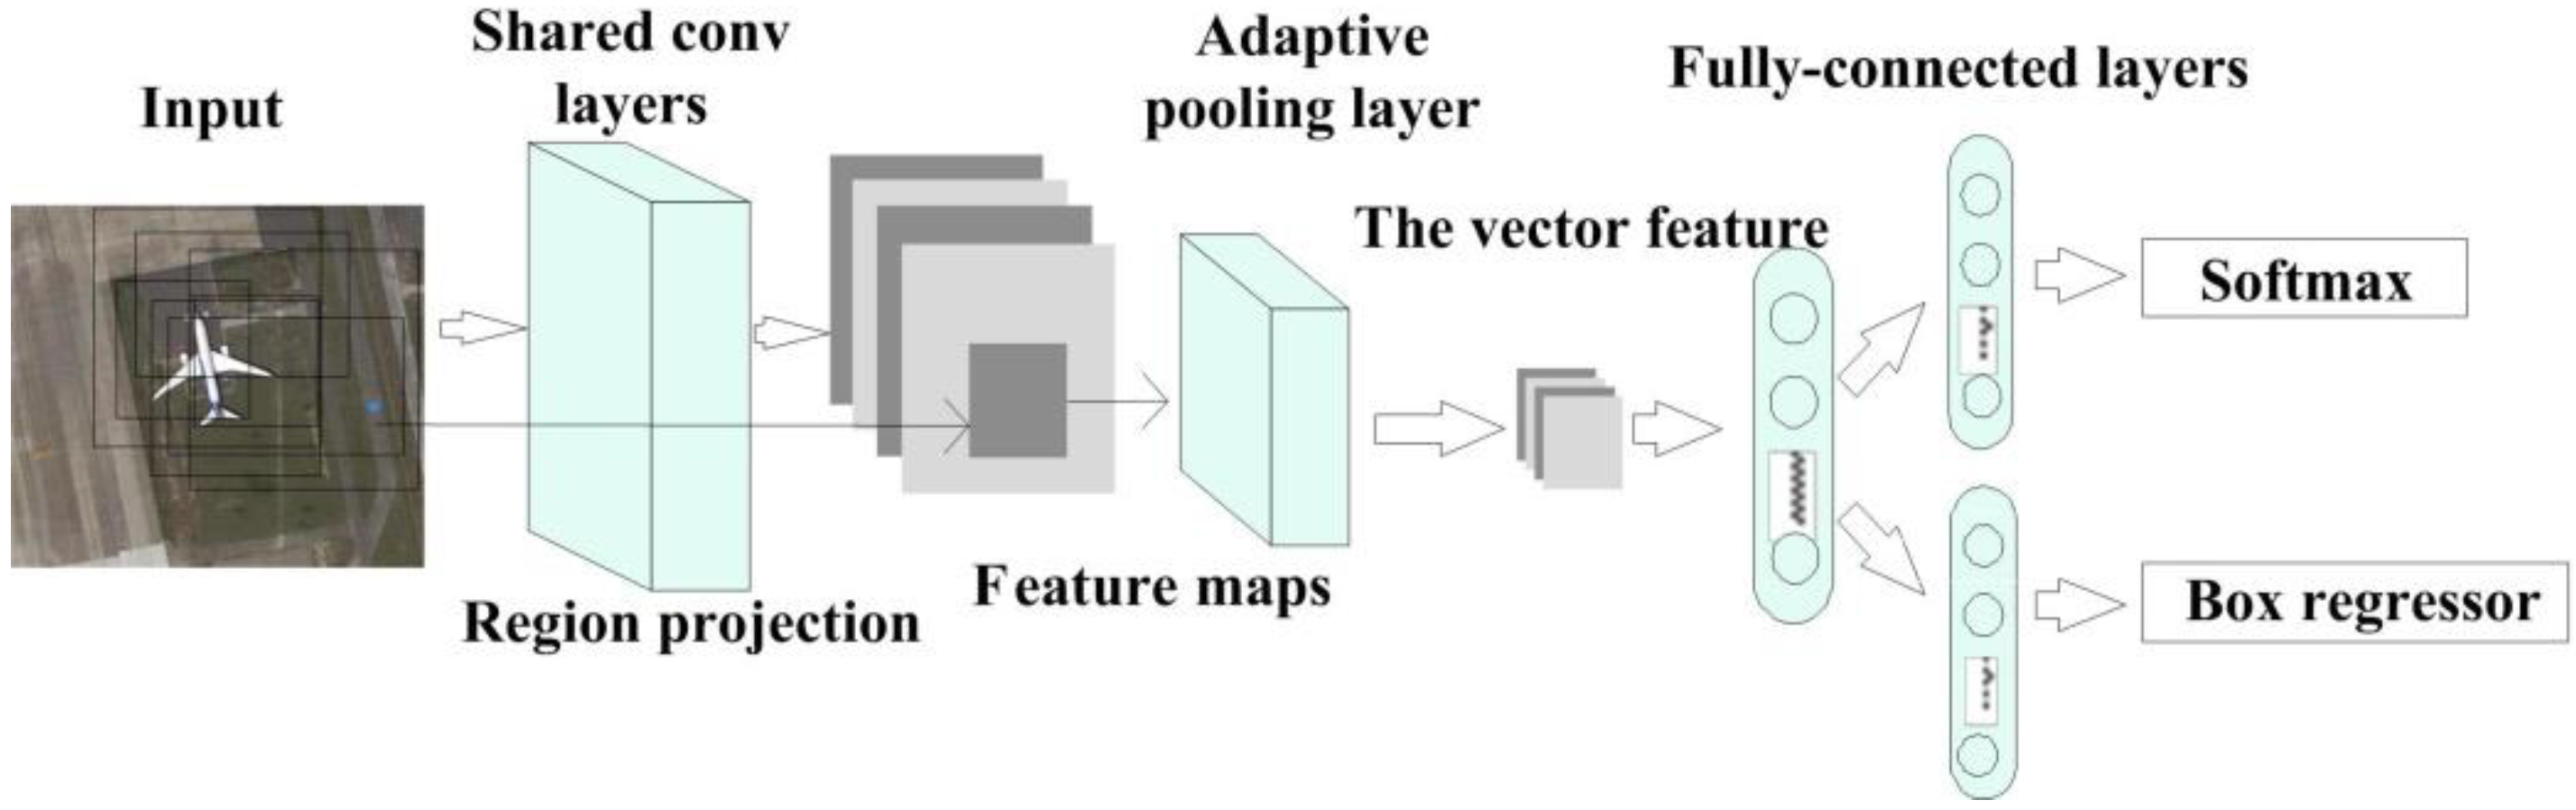
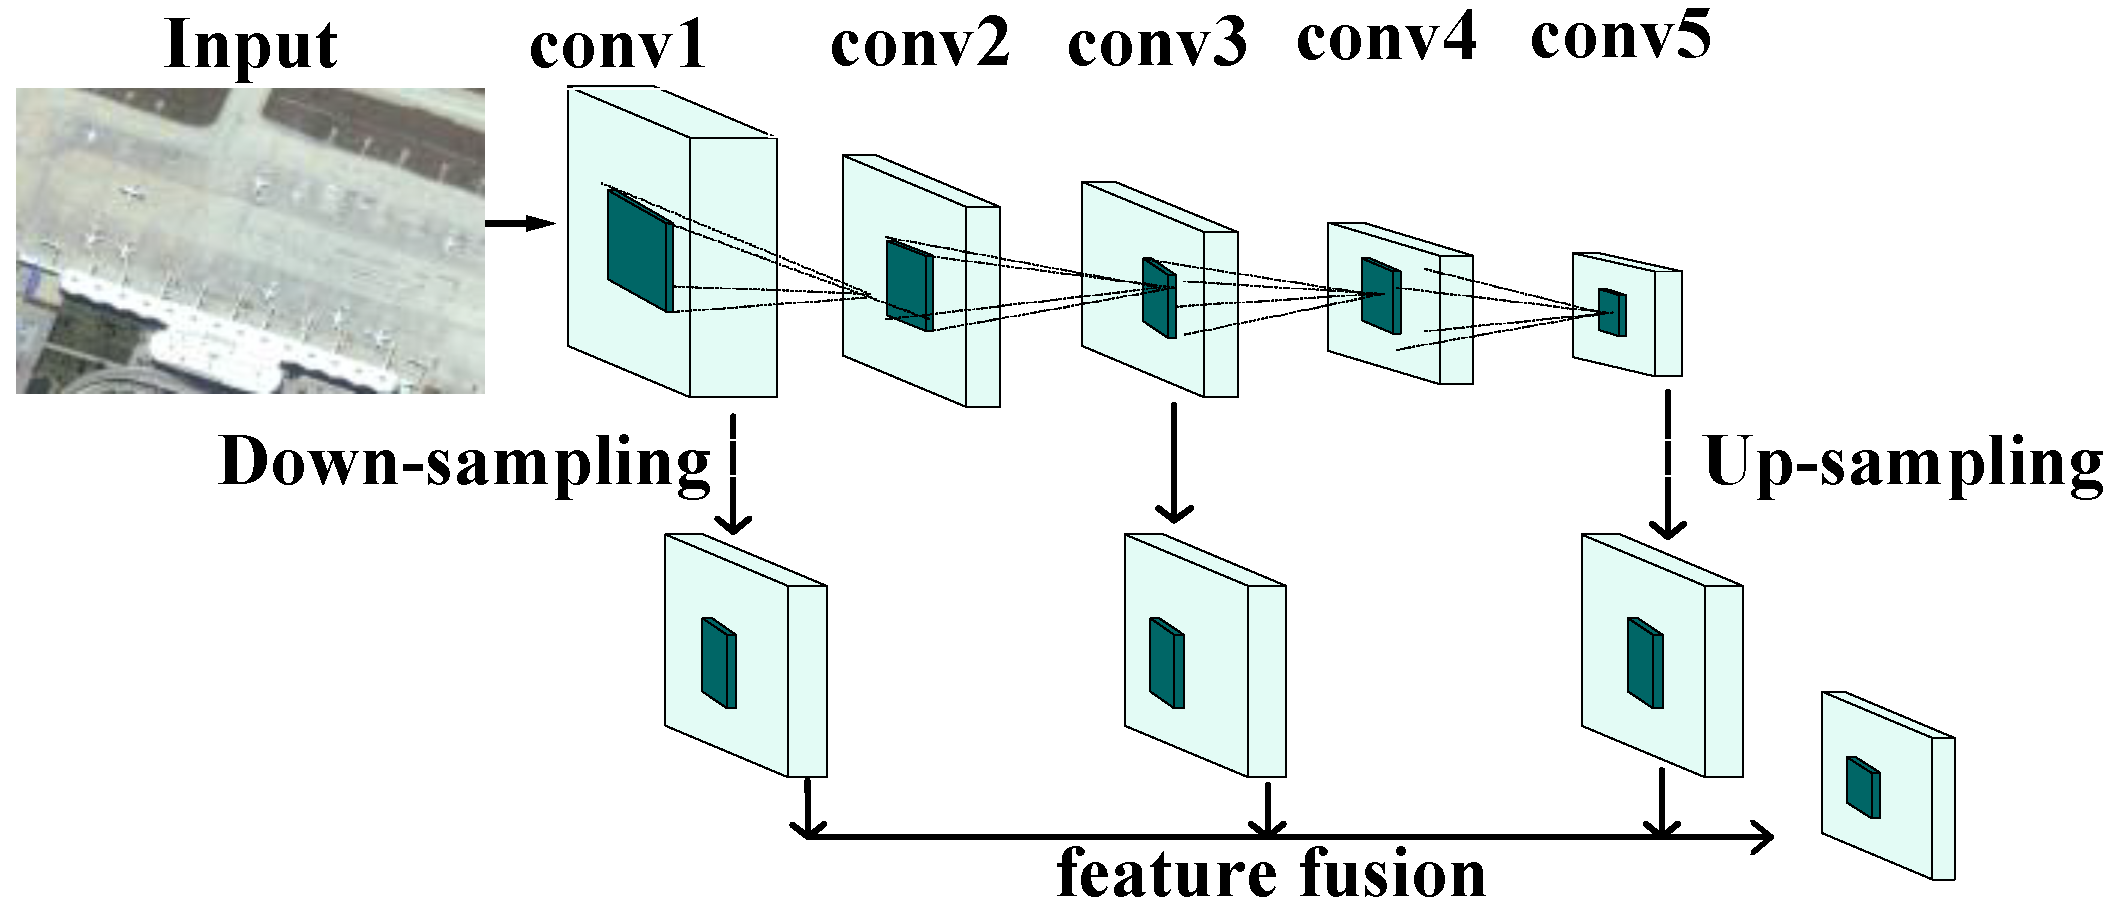
- To handle input images with different sizes, the scale of the network was reduced. All fully connected layers were replaced by the corresponding convolutional layers. To fuse multi-level feature maps at the same resolution, different sampling methods were used for different layers. We added a maximum pooling layer on the lower layer to perform down-sampling. For higher layers, we added a deconvolutional operation to conduct up-sampling. The feature maps of different layers were subjected to a convolutional layer integral before fusion. Then, the feature maps were adjusted to the same size and the semantic features were simultaneously enhanced.
- (3)
- Multilayer features fusion decreases the speed of the entire detection system. To increase the speed, a convolutional layer was inserted into the multilayer fusion feature map before generating a candidate region to reduce the dimensionality of the feature maps. This process reduced the time needed to generate the regions. However, the direct use of a reduced-dimensionality feature map for detection leads to a slight decrease in accuracy. Therefore, the feature map that was used during the detection process should be used before the convolution operation.
- (4)
- In the training stage, an RPN generates tens of thousands of candidate regions, of which many are redundant or similar. To increase the candidate region quality, a non-maximal inhibition method [23] was used to filter the candidate region set. Approximately 1000 high-quality candidate regions are kept, and the first 200–300 regions were used as a training set. For the positioning accuracy of the bounding box, we used the intersection-over-union (IoU) formula. The IoU indicates the degree of overlap between bounding box A and the ground truth B, as shown in Equation (1):
- (5)
- A previous study indicated that multitask loss joint training can result in supplementing information among tasks, which improves common feature extraction. Therefore, the multi-task loss in the literature [13] was used to jointly train the classification and boundary box regression tasks. We define the loss function as:where i is the index of a candidate region during training and pi is the probability that region i contains an object. If the sample is positive, then pi* = 1, and for a negative sample, pi* = 0. ti is a vector representing the four parameterized coordinates of the predicted boundary box and ti* is associated the ground-truth box, which is associated with a positive sample. The outputs of the classification layer and boundary box regression layer are {pi} and {ti}, respectively. Ncls and Nreg are normalization factors. Typically, Ncls is the number of small batch samples (i.e., Ncls = 256) and Nreg is the number of candidate regions (i.e., Nreg ≈ 2400). To roughly equally weight the two terms in Equation (2) after normalization, we set λ = 10.
- (6)
- The training of the detection network is based on the region extracted by the RPN. Therefore, these two networks cannot be simultaneously trained. Instead, the training occurs in sequence. For multiplex use of a feature extracted from a convolutional layer by the two networks, the cross-optimized training strategy proposed in a previous study [14] was used. The training steps are as follows.
3.2. Network Model Selection and Initialisation
4. Simulation Experiment and Analysis
4.1. Simulation Platform
4.2. Data
4.3. Simulation Experiment with Training and Testing
4.4. Comparison with Other Methods
5. Conclusions
Author Contributions
Conflicts of Interest
References
- Yildiz, C.; Polat, E. Detection of stationary aircrafts from satelitte images. In Proceedings of the 2011 IEEE 19th Signal Processing and Communications Applications Conference (SIU), Antalya, Turkey, 20–22 April 2010. [Google Scholar]
- Liu, G.; Sun, X.; Fu, K. Aircraft recognition in high-resolution satellite images using coarse-to-fine shape prior. IEEE Geosci. Remote Sens. Lett. 2013, 10, 573–577. [Google Scholar] [CrossRef]
- Li, W.; Xiang, S.; Wang, H. Robust airplane detection in satellite images. In Proceedings of the 2011 18th IEEE International Conference on Image Processing, Brussels, Belgium, 11–14 September 2011. [Google Scholar]
- Tan, Y.; Li, Q.; Li, Y.; Tian, J. Aircraft detection in high-resolution SAR images based on a gradient textural saliency map. Sensors 2015, 15, 23071–23094. [Google Scholar] [CrossRef] [PubMed]
- Wang, W.; Nie, T.; Fu, T.; Ren, J.; Jin, L. A novel method of aircraft detection based on high-resolution panchromatic optical remote sensing images. Sensors 2017, 17, 1047. [Google Scholar] [CrossRef] [PubMed]
- Wu, H.; Zhang, H.; Zhang, J. Fast aircraft detection in satellite images based on convolutional neural networks. In Proceedings of the 2015 IEEE International Conference on Image Processing (ICIP), Quebec City, QC, Canada, 27–30 September 2015. [Google Scholar]
- Chen, X.; Xiang, S.; Liu, C.L. Aircraft detection by deep belief nets. In Proceedings of the 2013 2nd IAPR Asian Conference on Pattern Recognition, Naha, Japan, 5–8 November 2013. [Google Scholar]
- Zhang, F.; Du, B.; Zhang, L. Weakly supervised learning based on coupled convolutional neural networks for aircraft detection. IEEE Trans. Geosci. Remote Sens. 2016, 54, 5553–5563. [Google Scholar] [CrossRef]
- Zhong, J.; Lei, T.; Yao, G.; Jiang, P. Robust Aircraft Detection with a Simple and Efficient Model. Information 2018, 9, 74. [Google Scholar] [CrossRef]
- Li, Y.; Fu, K.; Sun, H.; Sun, X. An aircraft detection boxwork based on reinforcement learning and convolutional neural networks in remote sensing images. Remote Sens. 2018, 10, 243. [Google Scholar] [CrossRef]
- Zhang, W.; Sun, X.; Fu, K.; Wang, C.; Wang, H. Object detection in high-resolution remote sensing images using rotation invariant parts based model. IEEE Trans. Geosci. Remote Sens. 2014, 11, 74–78. [Google Scholar] [CrossRef]
- Wang, G.; Wang, X.; Fan, B.; Pan, C. Feature Extraction by Rotation-Invariant Matrix Representation for Object Detection in Aerial Image. IEEE Trans. Geosci. Remote Sens. 2017, 14, 851–855. [Google Scholar] [CrossRef]
- Girshick, R. Fast R-CNN. In Proceedings of the 2015 IEEE International Conference on Computer Vision (ICCV), Santiago, Chile, 7–13 December 2015. [Google Scholar]
- Ren, S.; He, K.; Girshick, R. Faster R-CNN: Towards real-time object detection with region proposal networks. In Proceedings of the Neural Information Processing Systems 28 (NIPS 2015), Montreal, QC, Canada, 7–10 December 2015. [Google Scholar]
- Long, J.; Shelhamer, E.; Darrell, T. Fully convolutional networks for semantic segmentation. In Proceedings of the 2015 IEEE Conference on Computer Vision and Pattern Recognition (CVPR), Boston, MA, USA, 7–12 June 2015. [Google Scholar]
- Xu, T.B.; Cheng, G.L.; Yang, J. Fast Aircraft Detection Using End-to-End Fully Convolutional Network. In Proceedings of the 2016 IEEE International Conference on Digital Signal Processing (DSP), Beijing, China, 16–18 October 2016. [Google Scholar]
- Yang, B.; Yan, J.; Lei, Z. CRAFT Objects from Images. In Proceedings of the 29th IEEE Conference Computer Vision and Pattern Recognition, Las Vegas, NV, USA, 26–30 June 2016. [Google Scholar]
- He, K.; Zhang, X.; Ren, S. Spatial pyramid pooling in deep convolutional networks for visual recognition. IEEE Trans. Pattern Anal. Mach. Intell. 2015, 37, 1904–1916. [Google Scholar] [CrossRef] [PubMed]
- Ren, S.; He, K.; Girshick, R.B. Object Detection Networks on Convolutional Feature Maps. IEEE Trans. Pattern Anal. Mach. Intell. 2017, 39, 1476–1481. [Google Scholar] [CrossRef] [PubMed]
- Girshick, R.; Donahue, J.; Darrell, T. Rich feature hierarchies for accurate object detection and semantic segmentation. In Proceedings of the 27th IEEE Conference on Computer Vision and Pattern Recognition (CVPR), Columbus, OH, USA, 24–27 June 2014. [Google Scholar]
- Bell, S.; Zitnick, C.L.; Bala, K. Inside-Outside Net: Detecting Objects in Context with Skip Pooling and Recurrent Neural Networks. In Proceedings of the 29th IEEE Conference on Computer Vision and Pattern Recognition (CVPR), Las Vegas, NV, USA, 26–30 June 2016. [Google Scholar]
- Kong, T.; Yao, A.; Chen, Y. Hypernet: Towards accurate region proposal generation and joint object detection. In Proceedings of the 29th IEEE Conference on Computer Vision and Pattern Recognition (CVPR), Las Vegas, NV, USA, 26–30 June 2016. [Google Scholar]
- Rothe, R.; Guillaumin, M.; Van Gool, L. Non-Maximum Suppression for Object Detection by Passing Messages between Windows. In Proceedings of the 12th Asian Conference on Computer Vision (ACCV), Singapore, 1–5 November 2014. [Google Scholar]
- Pan, S.J.; Yang, Q. A survey on transfer learning. IEEE Trans. Knowl. Data Eng. 2010, 22, 1345–1359. [Google Scholar] [CrossRef]
- Xiao, Z.F.; Gong, Y.P.; Long, Y. Airport Detection Based on a Multiscale Fusion Feature for Optical Remote Sensing Images. IEEE Geosci. Remote Sens. Lett. 2017, 14, 1469–1473. [Google Scholar] [CrossRef]
- Deng, J.; Dong, W.; Socher, R. Imagenet: A large-scale hierarchical image database. In Proceedings of the 2009 IEEE Conference on Computer Vision and Pattern Recognition, Miami, FL, USA, 20–25 June 2009. [Google Scholar]
- Zeiler, M.D.; Fergus, R. Visualizing and understanding convolutional networks. In Proceedings of the 13th European Conference Computer Vision, Zürich, Switzerland, 6–12 September 2014. [Google Scholar]


| Set | 302, 1:1 | 602, 1:1 | 1102, 1:1 | 302, 4:5 | 602, 4:5 | 1102, 4:5 | 302, 5:4 | 602, 5:4 | 1102, 5:4 |
| Size | 30 × 30 | 60 × 60 | 110 × 110 | 27 × 33 | 53 × 67 | 98 × 122 | 33 × 27 | 67 × 53 | 122 × 98 |
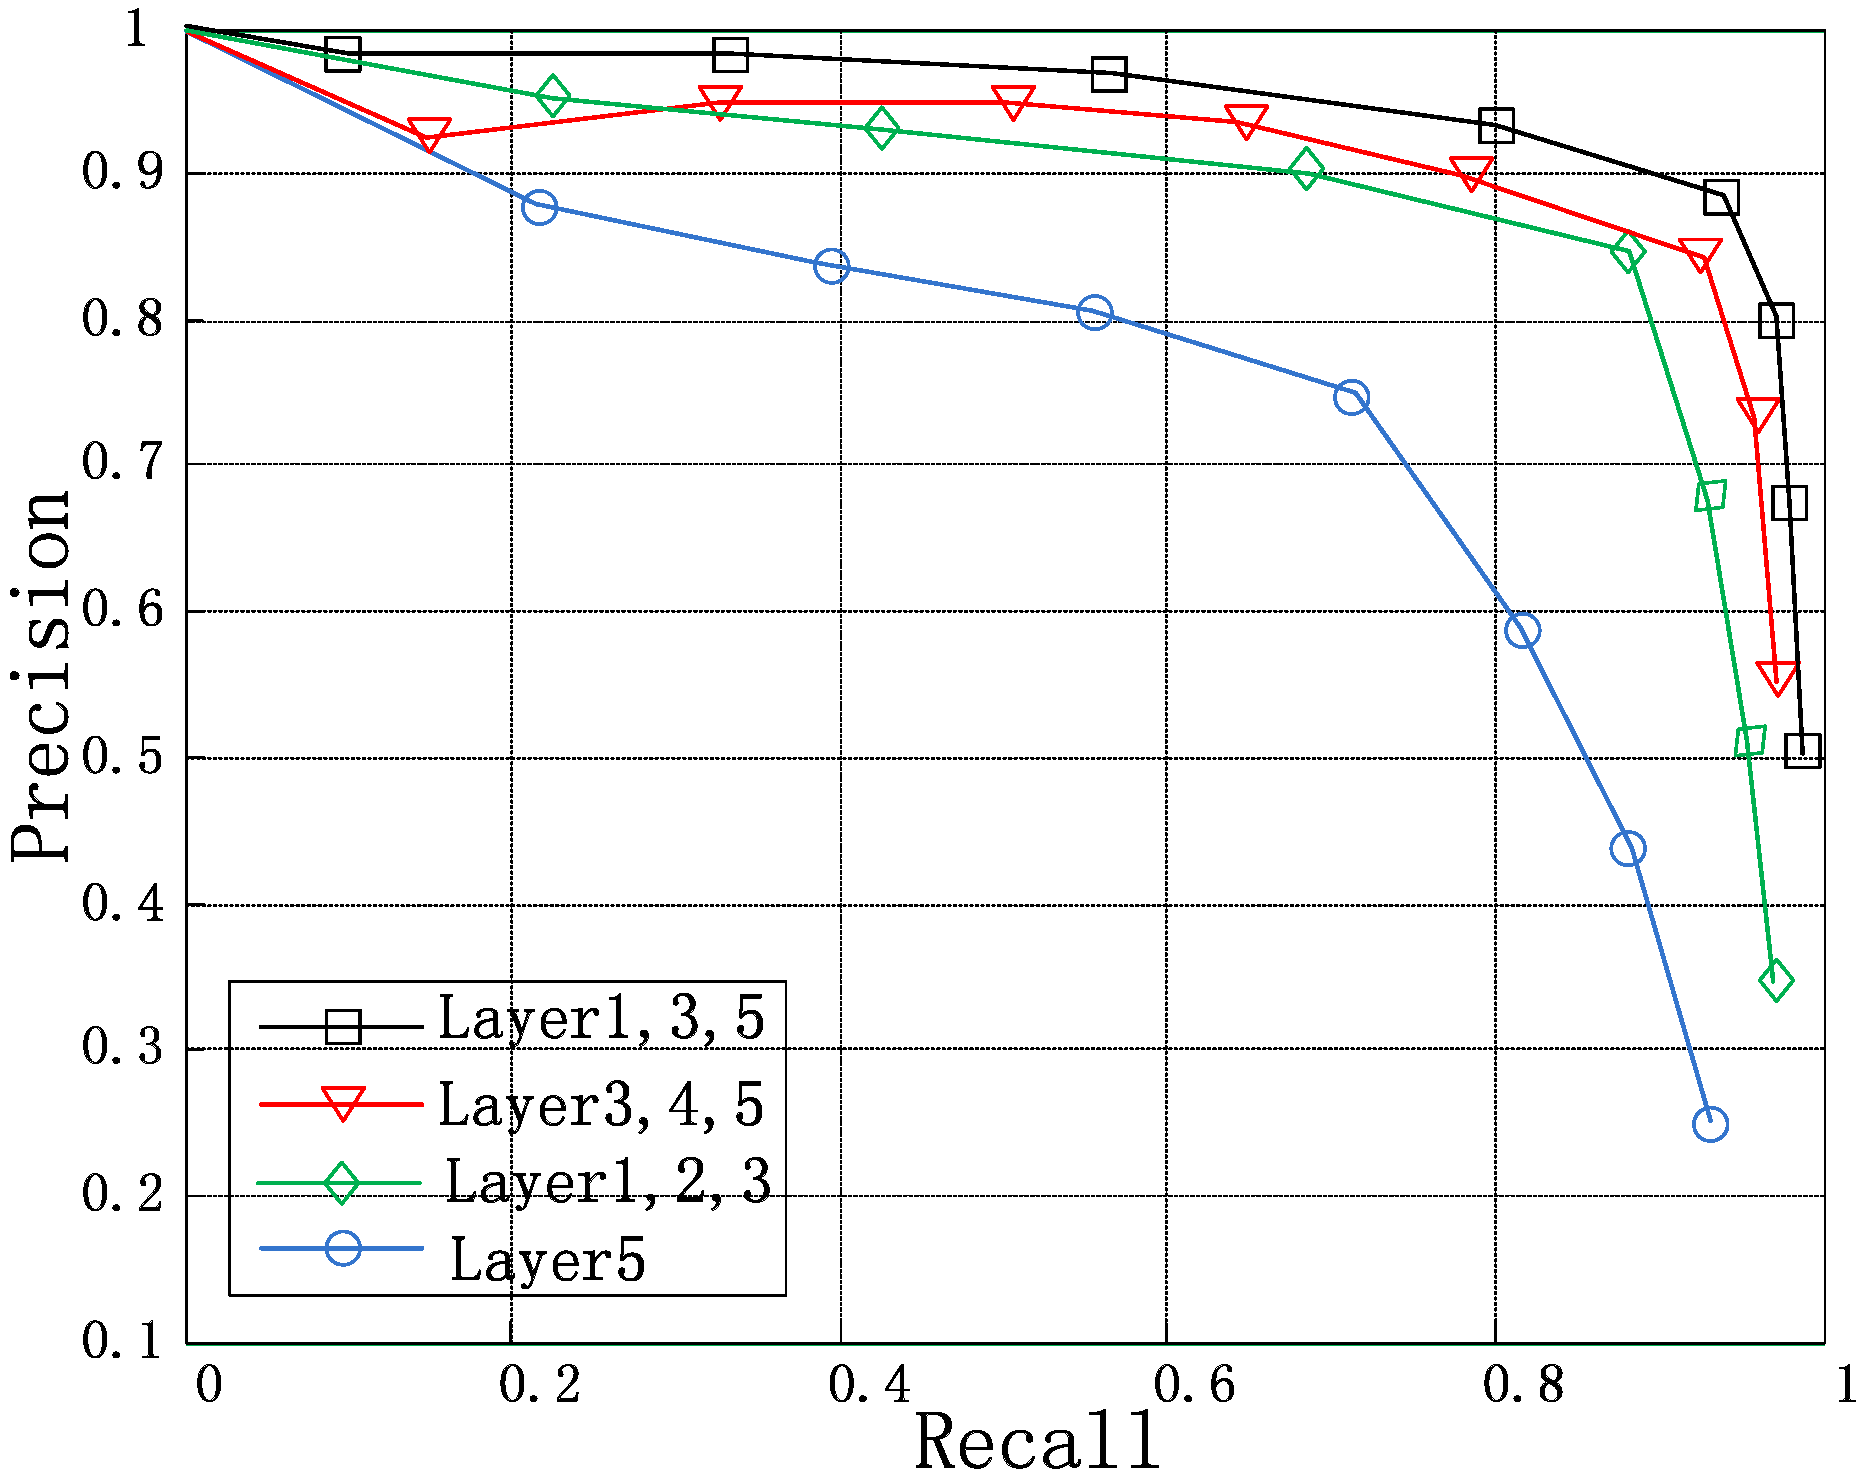
| Layer(s) | 5 | 1 + 2 + 3 | 1 + 3 + 5 | 3 + 4 + 5 |
|---|---|---|---|---|
| Precision | 79.7% | 89.3% | 95.5% | 92.1% |
| Recall | 75.4% | 86.4% | 90.1% | 88.6% |
| Method | Location-DBN | BING-CNN | Fast RCNN | Faster RCNN | Our Method |
|---|---|---|---|---|---|
| Detection rate (%) | 83.5 | 85.4 | 81.2 | 82.7 | 95.5 |
| False alarm rate (%) Average time (s) | 36.5 >100 | 20.4 6.1 | 22.5 2.9 | 23.5 0.2 | 7.5 0.3 |
© 2018 by the authors. Licensee MDPI, Basel, Switzerland. This article is an open access article distributed under the terms and conditions of the Creative Commons Attribution (CC BY) license (http://creativecommons.org/licenses/by/4.0/).
Share and Cite
Xu, Y.; Zhu, M.; Xin, P.; Li, S.; Qi, M.; Ma, S. Rapid Airplane Detection in Remote Sensing Images Based on Multilayer Feature Fusion in Fully Convolutional Neural Networks. Sensors 2018, 18, 2335. https://doi.org/10.3390/s18072335
Xu Y, Zhu M, Xin P, Li S, Qi M, Ma S. Rapid Airplane Detection in Remote Sensing Images Based on Multilayer Feature Fusion in Fully Convolutional Neural Networks. Sensors. 2018; 18(7):2335. https://doi.org/10.3390/s18072335
Chicago/Turabian StyleXu, Yuelei, Mingming Zhu, Peng Xin, Shuai Li, Min Qi, and Shiping Ma. 2018. "Rapid Airplane Detection in Remote Sensing Images Based on Multilayer Feature Fusion in Fully Convolutional Neural Networks" Sensors 18, no. 7: 2335. https://doi.org/10.3390/s18072335
APA StyleXu, Y., Zhu, M., Xin, P., Li, S., Qi, M., & Ma, S. (2018). Rapid Airplane Detection in Remote Sensing Images Based on Multilayer Feature Fusion in Fully Convolutional Neural Networks. Sensors, 18(7), 2335. https://doi.org/10.3390/s18072335