Improvement of Noise Uncertainty and Signal-To-Noise Ratio Wall in Spectrum Sensing Based on Optimal Stochastic Resonance


1
Shanghai Key Laboratory of Navigation and Location-Based Services, Shanghai Jiao Tong University, Shanghai 200240, China
2
Department of Electronic Engineering, Shanghai Jiao Tong University, Shanghai 200240, China
3
Shanghai Key Laboratory of Intelligent Sensing and Recognition, Shanghai Jiao Tong University, Shanghai 200240, China
*
Author to whom correspondence should be addressed.
Sensors 2019, 19(4), 841; https://doi.org/10.3390/s19040841
Submission received: 19 December 2018
/
Revised: 15 February 2019
/
Accepted: 15 February 2019
/
Published: 18 February 2019
(This article belongs to the Special Issue Resonant Sensors)
Abstract
:Noise uncertainty and signal-to-noise ratio (SNR) wall are two very serious problems in spectrum sensing of cognitive radio (CR) networks, which restrict the applications of some conventional spectrum sensing methods especially under low SNR circumstances. In this study, an optimal dynamic stochastic resonance (SR) processing method is introduced to improve the SNR of the receiving signal under certain conditions. By using the proposed method, the SNR wall can be enhanced and the sampling complexity can be reduced, accordingly the noise uncertainty of the received signal can also be decreased. Based on the well-studied overdamped bistable SR system, the theoretical analyses and the computer simulations verify the effectiveness of the proposed approach. It can extend the application scenes of the conventional energy detection especially under some serious wireless conditions especially low SNR circumstances such as deep wireless signal fading, signal shadowing and multipath fading.
1. Introduction
In the last decade, owing to the rapid development of wireless communications, such as the rapid deployment of the 3G and 4G mobile communication systems around the world, some old spectrum resource transferring through the market auction in many countries, the amount of information transmitted will exceed the carrying capacity of the existing radio spectrum, the spectrum resource has become very limited, which restricts the progress of high speed wireless communications seriously. Simultaneously, the allocated spectrum has not been utilized effectively, which leads to many spectrum holes in the licensed frequency bands frequently. To enhance the spectrum utility, cognitive radio (CR) networks were proposed to allow the secondary users (SUs) access to the licensed users or primary users’ (PUs) spectrum for transmission [1]. In the CR networks, generally there exists two kinds of spectrum sharing modes, the overlay mode and the underlay mode, while in the overlay mode the CR has some knowledge about existing transmission and may support PU in transmission utilizing the channel for its purposes as well; and in the underlay mode it permits the SUs to transmit even if the channel has been occupied by the PUs already, as long as the interference temperature is under a regulatory limit [2]. In this study, we will focus on the overlay mode.
In the overlay mode, to motivate the SU transmission without interrupting the PU transmission, it will decide the existence of the PU signal in the SU’s receiver end first, say the spectrum sensing, which is a very important task in CR networks. Based on previous studies, it can be found that the spectrum sensing can be realized by non-cooperative sensing methods and cooperative sensing methods [3,4,5,6,7], while the cooperative methods are usually used to overcome the problem of shadow fading in wireless communications. Generally, the non-cooperative sensing methods are still the basis of the cooperative sensing methods. Within various kinds of non-cooperative sensing methods, the energy detection [4], feature detection [5], and matched-filter detection [6] are the most studied methods, in which energy detection attracts a lot of research interest because it is easy to use and no a prior knowledge of PU signal is required in the sensing process. However, at the same time, the signal-to-noise ratio (SNR) wall problem [8] seriously restricts the application of the traditional energy detection, which implies that the number of samples at the receiver may increase rapidly to reach a certain high threshold to fulfill a higher detection probability under a constant false alarm rate (CFAR), if there exists noise uncertainty in the SU’s receiver in the sensing process. The SNR wall problem degrades the performance of energy detection especially under low SNR, which always appears in wireless communications.
Besides the above studies and research, the survey in [9] briefly described the ways for obtaining energy-efficiency in cooperative sensing, and it also summarized the algorithms leading to relative energy saving while assuring high sensing performance in terms of the global probability of detection or the global probability of false alarm. In [10], several topics and open problems worth mentioning in spectrum sensing for CR were also proposed, such as quick detection, adaptive sensing and learning, joint spectrum sensing and efficient resource utilization. While for the SNR wall problem, the detection performance of generalized energy detector was studied in [11] under different distributions of noise uncertainty and the problem of opportunistic spectrum access using full-duplex radios in the presence of unknown PU channel statistics was studied in [12]. In [13] the recent advances in the spectrum sensing framework as the main enabling technology for the interweaving cognitive radio model is provided. References [14,15] derived the closed form expressions for the critical frame length that equalizes the energy consumption and energy efficiency in CR schemes, which has been validated by the simulation results.
To overcome the SNR wall problem stated above, a novel non-cooperative spectrum sensing approach based on the combination of the dynamic analysis method of stochastic resonance (SR) and the traditional energy detection is proposed in this study. It utilizes the special property of the SR system that can improve the SNR of the SR system especially under certain conditions [16,17,18,19]. By introducing an optimal SR system as the pre-processor of the traditional energy detector, the SNR wall can be improved and the number of samples at the receiver can be reduced effectively, which results in the improvement of detection performance in CR networks. The optimal driving parameters of the SR system can also be found through the optimization process. Theoretical analyses verify the effectiveness of the proposed approach. The computer simulations also show that the SNR wall problem can be solved effectively especially under low SNR circumstances.
The remaining part of this paper is arranged as follows: Section 2 explains the traditional non-cooperative energy detection method and corresponding SNR wall problem briefly. In Section 3, the SR-based energy detection approach is proposed and discussed together with its optimization process. The theoretical performance improvement analyses are given in Section 4 in details based on a well-known overdamped bistable SR system. Computer simulation results are given in Section 5 to verify the effectiveness of the proposed approach, and the comparison results with the traditional spectrum sensing method are also presented. Finally the concluding remarks are summarized in Section 6.
2. Traditional Detection Methods and the Signal-To-Noise ratio Wall Problem
Within many different non-cooperative spectrum sensing methods, such as cyclostationary detection, the covariance-based detection, the matched-filter detection etc. [4,5,6], energy detection has the lowest computational cost and is the easiest to be used. Simultaneously, most detection methods should know a prior knowledge of the PU signal except the energy detection, which also guarantees that energy detection is a good property that can be applied in real applications.
Generally speaking, a spectrum sensing task can be abstracted as the following two-hypotheses testing problem
where r(k) is the received real signal at the SU’s receiver, s(k) is the PU signal, n(k) is the additive channel noise, and h(k) is the time-varying fading factor under wireless transmission circumstances. To simplify the analyses in this this study, it can always be assumed that s(k) obeys a certain distribution with mean 0 and variance ; n(k) obeys Gaussian distribution with mean 0 and variance , which is independent of s(k) and can be regarded as a sum of additive channel noise, thermal noise, co-channel multi-user interference and so on. h(k) obeys Rayleigh distribution with mean and variance , which is independent of s(k) and n(k). Because the time period of spectrum sensing frame is relatively shorter than the time period of transmission, it can be assumed that is a constant in the theoretical analyses and computer simulations thereafter.
In the traditional detection method, the SU’s receiver calculates the power A(r) of the received signal r(k) as follows
where K is the total number of samples at the SU’s receiver. Then by comparing the statistic A(r) with a fixed threshold value γED, one can decide whether the PU signal exists or not, which can be expressed as
The threshold γED is often chosen to guarantee the CFAR property of the traditional detector. So the detection probability Pd(ED) and the false alarm rate Pfa(ED) of the traditional detection method can be calculated by the following two equations, respectively
where is the probability of the event.
From (2), it can be derived that
where and are the mean and variance functions, respectively. Therefore, (4) and (5) can also be rewritten as
where is the right-tail probability of the central chi-squared probability density function (pdf) under K degrees of freedom. To guarantee the detection performance under a certain CFAR, the threshold γED can be determined by
where is the inverse function of . In real applications, the parameters , and in (9) can be replaced by corresponding estimates , and , respectively. In the following analyses, for simplicity, we assume that both and are known or can be estimated unbiasedly at the SU’s receiver, so the performance is only determined by the noise variance estimate .
According to the Central Limit Theorem [3], when the total number of samples K at the SU’s receiver is big enough, (7) and (8) can be approximated by
where is the standard Gaussian complementary cumulative distribution function (CDF) whose definition can be found in [16].
Due to the uncertainty of the wireless channel in CR networks, there may exist some difference between and , or there may be a distributional uncertainty of the noise power within the following interval [8]
where is a positive parameter which defines the size of the noise uncertainty [8]. Then the sampling complexity of the conventional detection method NED is [8].
where SNRi is the SNR of r(k) under H1 in (1), which can be theoretically calculated by
From (13) it can be found that when SNRi is reducing and approaching gradually, the sampling complexity NED will approach infinity, which implies that the spectrum sensing performance of Pd(ED) under certain Pfa(ED) cannot be guaranteed even if the number of samples is big enough. So it is also called an SNR wall as
In other words, when SNRi is lower than the SNR wall defined above, it is impossible for the conventional detector to reach the certain spectrum sensing performance. However, the low SNR condition is a very common circumstance in wireless CR networks, so it is a very serious problem which restricts the application of the conventional detection method.
3. Optimal Stochastic-Resonance-Based Detection Approach under Low Signal-To-Noise Ratio
To overcome the SNR wall problem mentioned in the last Section, a novel spectrum sensing approach based on the optimal SR technique and the conventional detection method was proposed, especially for the application under low SNR.
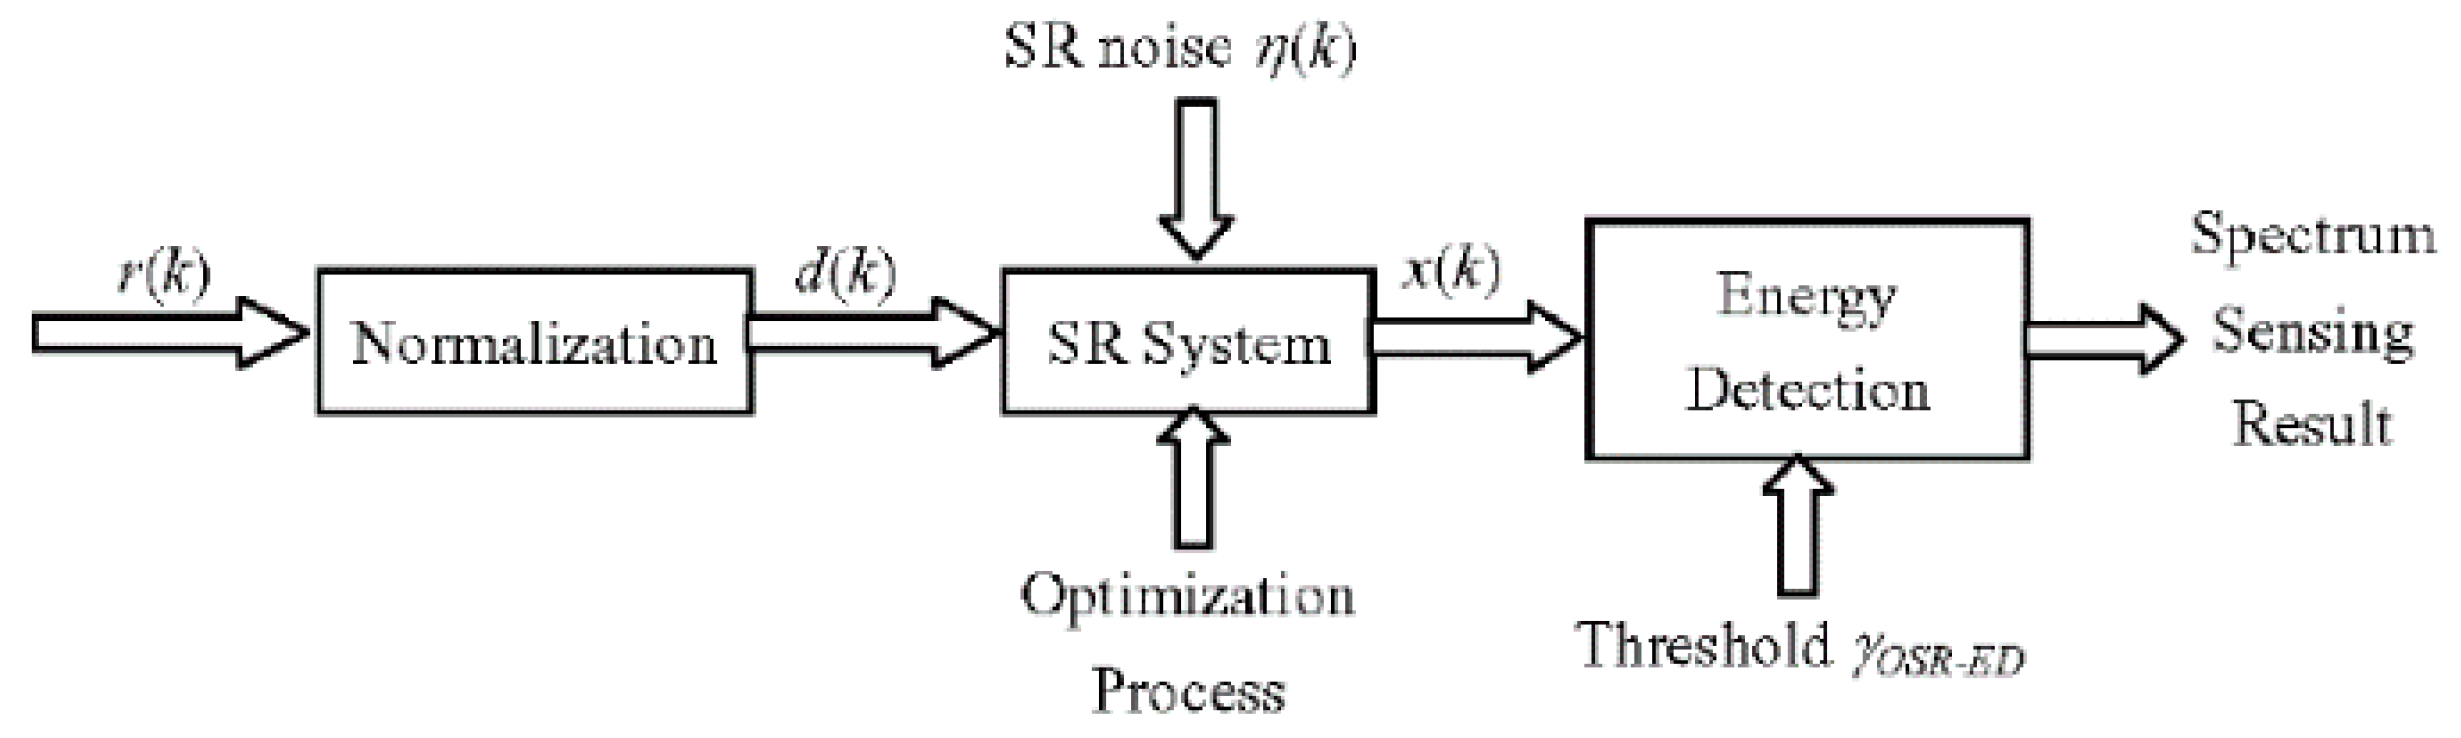
Firstly, to give an intuitive explanation, we give the block diagram of the proposed optimal SR-based detector in Figure 1. The received signal r(k) is first normalized to fulfill the input signal requirement of the SR system, that is
where d(k) is the normalization of the signal r(k).
Use d(k) as one of the driving inputs to the SR system, and introduces a pseudo random noise η(k) with mean 0 and variance as another driving input to the SR system, which is independent of d(k) as shown in Figure 1, then the dynamic equation of the SR system can be expressed by
where is the nonlinear dynamic function of the SR system; x(k) is the state variable of the SR system; and P(k) is the parameter vector of the selected SR system .
As is known, SR is a kind of nontrivial behavior in nonlinear systems with the influence of noise. It reveals the phenomena that the ordered response of a dynamic system with weak input signals can be significantly increased by appropriately tuning the noise intensity to an optimal but nonvanishing value [16]. By utilizing this special property of an SR system, it has been widely used in various application areas, such as sequential detectors [20], feed-forward neural network [21], sigma-delta modulators [22], and so on [23].
Mathematically, according to the Linear Response Theory (LRT) of an SR system, when both d(k) and η(k) are introduced into the SR system as two independent additive components, and if we set the mean value of the unperturbed state variable [9], we have
where and are the steady state and asymptotic limit of the random process, dSR(k) and ηSR(k) is the independent SR system responses to the driving signals d(k) and η(k), respectively.
So when the PU signal exists in the sensing channel (under H1), (18) can also be written as
where sSR(k) and nSR(k) are the system responses to s(k) and n(k), respectively. If the PU signal does not exist (under H0), it becomes
Without loss of generality and to simplify the analyses thereafter, we can set the mean value of under both hypotheses to be zero, that is
Simultaneously, the power of both driving signals may be changed according to the Spectrum Power Amplification (SPA) property of the SR system [16], that is
where λs, λn, λη are the SPAs of s(k), n(k) and η(k), respectively; , , are the variances of sSR(k), nSR(k) and ηSR(k), respectively.
Then the SNR of the asymptotic limit of x(k), say SNRo, can be calculated by
By introducing the above state variable x(k) of the SR system into the conventional detector as shown in Figure 1, and by normalizing the output signal y(k) to a variable with unit variance, we have
According to the Central Limit Theorem [3], when the number of samples K is large enough, y(k) under both hypotheses can be approximated by the standard Gaussian distributions with a unit variance but different mean values.
Thus, the conditions in [24] to improve the CR networks spectrum sensing by using the optimal SR can be fulfilled, especially under a low SNR circumstance. Here we also give the corresponding Theorem as follows:
Theorem 1.
(also appearing in [24], Theorem 6) For the weak signal-detection problem, if the test statistics under both hypotheses can be well approximated by some Gaussian distributions with the same variance, then the optimum detection performance can be obtained by adding a constant SR noise to the observed data and adjusting the detector threshold.
In other words, we can carry out the optimization process as
where is the optimal SR system, and are the corresponding optimal SR noise and optimal system parameter vector of .
According to Theorem 1, and under the condition of (27), we can get
or a SNR gain can be achieved as
Calculate the mean value of y(k) and compare it with a fixed threshold γOSR-ED to achieve a CFAR as shown in Figure 1, the spectrum sensing decision can then be made by
If there exists a noise uncertainty ρ as in (12), the sampling complexity of the proposed optimal SR-based detection method NOSR-ED is
Compared with the conventional detector under the same CFAR and detection probability, it can be found obviously based on (13), (29) and (31) that
which implies that the sampling complexity can be reduced effectively based on the proposed approach. Meanwhile, according to the definition of the SNR wall, it can be defined that the SNR wall of the proposed optimal SR-based detection approach is
and we have
So the SNR wall of the proposed approach can also be improved accordingly.
Simultaneously, if we define the size of the noise uncertainty after the optimal SR-based detection as ρ(OSR-ED), we have
and it can also be deduced from (34) and (35) that
which indicates that the noise uncertainty of the received signal after the proposed optimal SR-based detection processing can also be reduced. This can accordingly relieve the SNR wall problem and improve the real application conditions of the conventional energy detection method especially under low SNR.
4. Performance Improvement Analyses
In the following Section, we give a more detailed theoretical performance improvement analyses based on the mostly studied overdamped bistable SR system model [16]. Because the performance of the proposed SR-based detection approach and the conventional energy detector had close relationships with the power of the signal, and to simplify the analyses, we first assumed that the PU signal was an M-PSK modulated signal as follows
where AP, ωP and are the amplitude, angular frequency and phase of the PU signal, respectively; and T is the sampling time period. The channel noise n(k) in (1), is assumed to be an additive white Gaussian noise with mean 0.
By introducing the normalized received signal d(k) and an SR noise η(k) into the overdamped bistable SR system, the dynamic equation of the SR system can be written as [16]
where a and b are the system parameters, p1 and p2 are the driving parameters corresponding to the driving signals d(k) and η(k), respectively.
Due to the independency within x(k), n(k) and η(k) under H1, (38) can be rewritten as
To reach the optimal SR performance, it is required that the SR noise should be symmetric [24], and in (39) it is obvious that both η(k) and n(k) play the role of SR noise simultaneously, so η(k) can also be chosen as a white Gaussian noise which is independent to n(k). Under the above assumptions, (39) can be simplified to the following equation
where we have
and λ(k) is a standard Gaussian noise with mean 0 and variance 1.
In this case, the SNR of the received signal at the CR networks SU’s receiver is
and the SNR of the output of the SR system, say SNRo of x(k), can be calculated by
where and are fixed constants corresponding to the SR system parameters a and b.
Based on (43) and (44), and to guarantee the SNR improvement through the optimal SR system, it requires SNRo > SNRi, that is
and it can be deduced that
When SNRi is low enough, such as less than −10 dB, (46) can be simplified to
It can be observed, obviously that is the maximal point of the right side expression of (47) when U0 and is fixed, so if the following condition can be fulfilled
the SNR improvement, say SNRo > SNRi, can be guaranteed effectively.
At the same time, to get the maximum SNRo of the SR system, we can take (44) as an optimization objective function and suppose that p3 is a constant, and let
Then we can find out that the optimal parameter fulfills the following cubic equation
Or in other words, the optimal parameter p4 is the solution of the above cubic equation.
By calculating the discriminant Δ of (50), we can get
Then the optimization result can be achieved by the power or the amplitude of the driving PU signal, that is:
(a) When , , the only real solution of (50) is
(b) When , , the real triple solution of (50) is
(c) When , , the corresponding three real solutions of (51) are
In the two cases (a) and (b) above, p4 has only one optimal solution; and in the last case (c), we can substitute the three solutions p4(1), p4(2) and p4(3) back into (44), and then find out the optimal one which reaches the maximal value of SNRo. Because p3 should satisfy (48), to make the optimization process easier in real applications, we can choose a relatively big value of p3 to ensure , so that the optimization result of p4 in (52) can be realized.
Substituting the optimal results of p3 and p4, which can be expressed by and , back into (41) and (42), the optimal driving parameters and in (38) can finally be calculated, which correspond to the driving parameters of the normalized receiving signal d(k) and the additive SR noise η(k), respectively.
Simultaneously, by taking and into (44), the optimal output SNR of the SR system can be calculated by
According to (33), (43) and (57), the SNR wall of the proposed optimal SR-based detection approach under the size of noise uncertainty ρ is
and the size of the noise uncertainty after the optimal SR-based detection ρ(OSR-ED) can be calculated by solving the following equation
So when the optimal SR is realized, the corresponding sampling complexity of the proposed optimal SR-based detection approach NOSR-ED under selected Pfa(ED) and Pd(ED) is
Although the above performance improvement analyses and the corresponding derivations in this Section were based on the assumption that the PU signal was an M-PSK signal, it can be discovered very clearly that the total analyses process from Equation (37) to (60) is only related to the signal amplitude AP, and is not related to the signal angular frequency ωP and signal phase φP of the PU signal at all. So according to this interesting phenomenon, we can get a more general conclusion that the proposed optimal SR-based signal detection approach in CR networks is suitable for any kind of PU signal whose modulation scheme is not related to amplitude modulation. In other words, many classic and typical signals such as the frequency modulation (FM) signal, phase modulation (PM) signal, and orthogonal frequency division multiplexing (OFDM), which is generally used in 4G and 5G mobile communication systems are all suitable for this kind of proposed approach, which also indicates that the proposed approach may have a wide range of application areas.
5. Computer Simulations
In this Section, some computer simulations are given to evaluate the performances of the proposed optimal SR-based detection approach and the conventional energy detection method.
In the simulations, a QPSK signal is chosen as the PU signal with M = 4 and . The amplitude and angular frequency of the QPSK signal are set as AP = 1 and in (37). The signal amplitude AP can also be set to some other constant value, but it will not influence the performance of the proposed approach, and the reason for selecting AP = 1 here lies in that it may simplify the signal normalization and the noise variance estimation process at the receiver as shown in the following Equation (61) to (64). The fading factor is chosen as . The sampling time period is T = 0.0195. In the overdamped bistable SR system, the parameters are chosen as a = 2 and b = 1 in (38). The parameters chosen for T, a and b here can guarantee the overdamped bistable SR system could possess the best SR performance including SNR improvement and signal power amplification compared with other parameter values [16].
The maximum likelihood estimation (MLE) method in [6] is used to estimate the amplitude AP of the PU signal at the input angular frequency ωP especially under low SNR, that is
where we have
and the noise variance of the received signal can be estimated by [20]
By taking the estimates of in (61) and in (64) to substitute AP and in the last Section, the optimization process can then be followed.
Figure 2 shows the SNRo performance of the overdamped bistable SR system with parameters a = 2 and b = 1 under SNRi = −30 dB. It can be found that a maximal SNRo can be reached when p2 approaches the optimal value, and SNRo has almost no relationship with p1 when it fulfills the SNR improvement requirement. The optimal performance can be observed much clearly in Figure 3 where p1 is fixed and is the corresponding optimal value of p2. Figure 4 and Figure 5 give the same evaluations under SNRi = −25 dB, which indicates that the proposed optimal SR-based detection approach is efficient even under low SNR, and it can overcome the shortcoming of the conventional energy detection method well.
To give a more convincing explanation of the SNR improvement of the proposed optimal SR-based approach, Figure 6 and Figure 7 give the optimal SNR improvement performance of the overdamped bistable SR system with parameters a = 2 and b = 1. It can be seen that the positive SNR gain can be obtained within a wide range of SNRi including very low SNR circumstances.
Figure 8 and Figure 9 compares the SNR walls of the conventional energy detector and the proposed optimal SR-based detector under SNRi = −30 dB and SNRi = −25 dB, respectively. It can be found that 9.1424 dB SNR gain under SNRi = −30 dB and 10.3117 dB SNR gain under SNRi = −25 dB are obtained by using the proposed approach, which can improve the corresponding spectrum sensing performance of the CR networks importantly. Besides, the SNR wall comparisons between the energy detector and the proposed optimal SR-based detector under different noise uncertainty ρ = 1 dB, ρ = 0.1 dB and ρ = 0.01 dB are plotted in Figure 10. It can be observed that the SNR walls of the proposed approach is much lower than the corresponding SNR walls of the conventional energy detection method under the same noise uncertainty. At the same time, under the same SNRi and noise uncertainty ρ, the sampling complexity can be reduced significantly by using the proposed approach, which can improve the spectrum sensing performance of the energy detector seriously. Or in other words, if we compare the noise uncertainties of both approaches under the same sampling complexity, it can be found that the noise uncertainty of the proposed approach can also be reduced compared with the conventional energy detection method.
Finally, to evaluate the validity of the proposed approach based on the SR technique, especially the application in some scenario and implementation in the CR networks, we carried out a computer simulation as follows. A QPSK signal was still selected as the PU signal with M = 4 and . The SNR was set at −15 dB. A fixed detection threshold was set to maintain the CFAR of PU signal detection. The receiver operating characteristic (ROC) curves of the proposed SR-based detection approach and the traditional energy detector under SNR = −15 dB and ρ = 0.01 dB is given in Figure 11. As can be found in Figure 11, the detection probabilities of the proposed SR-based detection approach were higher than those of the traditional energy detector, particularly within the range of Pfa value from 0.1 to 0.5, which means that the PU signal can be more easily detected under the fixed threshold by using the proposed approach than the conventional method. In other words, due to the reason that the SNR wall is reduced based on the proposed approach, the PU signal can then be detected with much higher detection probabilities in this condition, while for the conventional energy detection method it still cannot work reliably with much lower detection probabilities. Therefore, it also reveals the real applicability of the proposed approach.
6. Conclusions
In this paper, a non-cooperative SR-based detection approach used in CR networks is proposed, and it can relieve the SNR wall and corresponding noise uncertainty problems in traditional energy detectors especially under low SNR circumstances. By introducing the normalized received signal and an independent SR noise into the dynamic SR system as the driving signals, and by optimizing their driving parameters, the SNR of the received signal can be improved and then the SNR wall can be reduced accordingly. Theoretical analyses and computer simulation results verify the effectiveness of the proposed approach. It can enhance the applicability of the traditional energy detectors in real wireless CR networks circumstances efficiently, especially under low SNR circumstances such as deep wireless signal fading, signal shadowing and multipath fading.
Author Contributions
Conceptualization and Methodology, D.H.; Investigation, X.C.; Validation, L.P. and L.J.; Writing-Review & Editing, W.Y.
Funding
This research work is supported by the Important National Science and Technology Specific Project of China under Grant Nos. 2016ZX03001022-006 and 2018ZX03001020-005, the National Natural Science Foundation of China under Grant No. 61771308, the Shanghai Science and Technology Committee under Grant No. 16DZ1100402, and the open research fund of National Mobile Communications Research Laboratory of Southeast University under Grant No. 2017D11.
Conflicts of Interest
The authors declare no conflict of interest.
References
- Haykin, S. Cognitive radio: Brain-empowered wireless communications. IEEE J. Sel. Areas Commun. 2005, 23, 201–220. [Google Scholar] [CrossRef]
- IAkyildiz, F.; Lee, W.Y.; Vuran, M.C.; Mohanty, S. NeXt generation/dynamic spectrum access/cognitive radio wireless networks: A survey. Comput. Netw. 2006, 50, 2127–2159. [Google Scholar] [CrossRef] [Green Version]
- Ma, J.; Li, G.Y.; Juang, B.H. Signal processing in cognitive radio. Proc. IEEE 2009, 97, 805–823. [Google Scholar]
- Digham, F.F.; Alouini, M.S.; Simon, M.K. On the energy detection of unknown signals over fading channels. IEEE Trans. Commun. 2007, 55, 21–24. [Google Scholar] [CrossRef]
- Dandawate, A.V.; Giannakis, G.B. Statistical tests for presence of cyclostationarity. IEEE Trans. Signal Process. 1994, 42, 2355–2369. [Google Scholar] [CrossRef]
- Kay, S.M. Fundamentals of Statistical Signal Processing, Volume II: Detection Theory; Prentice Hall: Englewood, NJ, USA, 1998. [Google Scholar]
- Peh, E.C.Y.; Liang, Y.C.; Guan, Y.L.; Zeng, Y.H. Optimization of cooperative sensing in cognitive radio networks: A sensing-throughput tradeoff view. IEEE Trans. Veh. Technol. 2009, 58, 5294–5299. [Google Scholar] [CrossRef]
- Tandra, R.; Sahai, A. SNR walls for signal detection. IEEE J. Sel. Top. Signal Process. 2008, 2, 4–17. [Google Scholar] [CrossRef]
- Cichoń, K.; Kliks, A.; Bogucka, H. Energy-efficient cooperative spectrum sensing: A survey. IEEE Commun. Surv. Tutor. 2016, 18, 1861–1886. [Google Scholar]
- Axell, E.; Leus, G.; Larsson, E.G.; Poor, H.V. Spectrum sensing for cognitive radio: State-of-the-art and recent advances. IEEE Signal Process. Mag. 2012, 29, 101–116. [Google Scholar] [CrossRef]
- Kalamkar, S.S.; Banerjee, A.; Gupta, A.K. SNR wall for generalized energy detection under noise uncertainty in cognitive radio. In Proceedings of the 2013 19th IEEE Asia-Pacific Conference on Communications (APCC), Denpasar, Indonesia, 29–31 August 2013; pp. 375–380. [Google Scholar]
- Hammouda, M.; Zheng, R.; Davidson, T.N. Full-duplex spectrum sensing and access in cognitive radio networks with unknown primary user activities. In Proceedings of the 2016 IEEE International Conference on Communications (ICC), Kuala Lumpur, Malaysia, 22–27 May 2015; pp. 1–6. [Google Scholar]
- Ali, A.; Hamouda, W. Advances on spectrum sensing for cognitive radio networks: Theory and applications. IEEE Commun. Surv. Tutor. 2017, 19, 1277–1304. [Google Scholar] [CrossRef]
- Saud, A.; Granelli, F. Energy efficiency analysis of soft and hard cooperative spectrum sensing schemes in cognitive radio networks. In Proceedings of the 2014 IEEE 79th Vehicular Technology Conference (VTC Spring), Seoul, Korea, 18–21 May 2014; pp. 1–5. [Google Scholar]
- Saud, A.; di Renzo, M.; Granelli, F. Towards energy-efficient cooperative spectrum sensing for cognitive radio networks: An overview. Telecommun. Syst. 2015, 59, 77–91. [Google Scholar]
- Anishchenko, V.S.; Astakhov, V.V.; Neiman, A.B.; Vadivasova, T.E.; Schimansky-Geier, L. Nonlinear Dynamics of Chaotic and Stochastic Systems: Tutorial and Modern Developments; Spring: Berlin/Heidelberg, Germany, 2002. [Google Scholar]
- Mitaim, S.; Kosko, B. Adaptive stochastic resonance. Proc. IEEE 1998, 86, 2152–2183. [Google Scholar] [CrossRef]
- McNamara, B.; Wilesenfeld, K. Theory of stochastic resonance. Phys. Rev. A 1989, 39, 4854–4869. [Google Scholar] [CrossRef]
- Harmer, G.P.; Davis, B.R.; Abbott, D. A review of stochastic resonance: Circuits and measurement. IEEE Trans. Instrum. Meas. 2002, 51, 299–309. [Google Scholar] [CrossRef]
- Guerriero, M.; Marano, S.; Matta, V.; Willett, P. Stochastic resonance in sequential detectors. IEEE Trans. Signal Process. 2009, 57, 2–15. [Google Scholar] [CrossRef]
- Mtetwa, N.; Smith, L.S. Precision constrained stochastic resonance in a feed forward neural network. IEEE Trans. Neural Netw. 2005, 16, 250–262. [Google Scholar] [CrossRef] [PubMed]
- Oliaei, O. Stochastic resonance in sigma-delta modulators. Electron. Lett. 2003, 39, 173–174. [Google Scholar] [CrossRef]
- Chen, H.; Varshney, P.K.; Kay, S.M.; Michels, J.H. Theory of the stochastic resonance effect in signal detection: Part I—Fixed detectors. IEEE Trans. Signal Process. 2007, 55, 3172–3184. [Google Scholar] [CrossRef]
- Chen, H.; Varshney, P.K. Theory of the stochastic resonance effect in signal detection: Part II—Variable detectors. IEEE Trans. Signal Process. 2008, 56, 5031–5041. [Google Scholar] [CrossRef]
Figure 1.
Block diagram of the proposed optimal stochastic resonance-based detector.

Figure 2.
SNRo performance of the overdamped bistable SR system with a = 2 and b = 1 under SNRi = −30 dB.
Figure 2.
SNRo performance of the overdamped bistable SR system with a = 2 and b = 1 under SNRi = −30 dB.

Figure 3.
Optimal parameter under SNRi = −30 dB.

Figure 4.
SNRo performance of the overdamped bistable SR system with a = 2 and b = 1 under SNRi = −25 dB.
Figure 4.
SNRo performance of the overdamped bistable SR system with a = 2 and b = 1 under SNRi = −25 dB.

Figure 5.
Optimal parameter under SNRi = −25 dB.

Figure 6.
SNRo vs. SNRi by using the proposed optimal SR-based detection approach.

Figure 7.
SNR improvement by using the proposed optimal SR approach.

Figure 8.
SNR walls comparison under SNRi = −30 dB.

Figure 9.
SNR walls comparison under SNRi = −25 dB.

Figure 10.
SNR wall comparisons between the energy detector and the optimal SR-based detector under different noise uncertainties.
Figure 10.
SNR wall comparisons between the energy detector and the optimal SR-based detector under different noise uncertainties.

Figure 11.
ROC curves of the proposed SR-based detection approach and the traditional energy detector under SNR = −15 dB and ρ = 0.01 dB.
Figure 11.
ROC curves of the proposed SR-based detection approach and the traditional energy detector under SNR = −15 dB and ρ = 0.01 dB.

© 2019 by the authors. Licensee MDPI, Basel, Switzerland. This article is an open access article distributed under the terms and conditions of the Creative Commons Attribution (CC BY) license (http://creativecommons.org/licenses/by/4.0/).
Share and Cite
MDPI and ACS Style
He, D.; Chen, X.; Pei, L.; Jiang, L.; Yu, W. Improvement of Noise Uncertainty and Signal-To-Noise Ratio Wall in Spectrum Sensing Based on Optimal Stochastic Resonance. Sensors 2019, 19, 841. https://doi.org/10.3390/s19040841
AMA Style
He D, Chen X, Pei L, Jiang L, Yu W. Improvement of Noise Uncertainty and Signal-To-Noise Ratio Wall in Spectrum Sensing Based on Optimal Stochastic Resonance. Sensors. 2019; 19(4):841. https://doi.org/10.3390/s19040841
Chicago/Turabian StyleHe, Di, Xin Chen, Ling Pei, Lingge Jiang, and Wenxian Yu. 2019. "Improvement of Noise Uncertainty and Signal-To-Noise Ratio Wall in Spectrum Sensing Based on Optimal Stochastic Resonance" Sensors 19, no. 4: 841. https://doi.org/10.3390/s19040841
Note that from the first issue of 2016, this journal uses article numbers instead of page numbers. See further details here.