Noninvasive Electromagnetic Wave Sensing of Glucose
by
 , ,
, ,
Ruochong Zhang
1 ,
,
Siyu Liu
1,
Haoran Jin
1,
Yunqi Luo
1,
Zesheng Zheng
1,
Fei Gao
2,* and
Yuanjin Zheng
1,* 1
School of Electrical and Electronic Engineering, Nanyang Technological University, Singapore 639798, Singapore
2
School of Information Science and Technology, ShanghaiTech University, Shanghai 201210, China
*
Authors to whom correspondence should be addressed.
Sensors 2019, 19(5), 1151; https://doi.org/10.3390/s19051151
Submission received: 8 January 2019
/
Revised: 1 February 2019
/
Accepted: 10 February 2019
/
Published: 7 March 2019
(This article belongs to the Special Issue Electromagnetic Medical Sensing)
Abstract
:Diabetic patients need long-term and frequent glucose monitoring to assist in insulin intake. The current finger-prick devices are painful and costly, which places noninvasive glucose sensors in high demand. In this review paper, we list several advanced electromagnetic (EM)-wave-based technologies for noninvasive glucose measurement, including infrared (IR) spectroscopy, photoacoustic (PA) spectroscopy, Raman spectroscopy, fluorescence, optical coherence tomography (OCT), Terahertz (THz) spectroscopy, and microwave sensing. The development of each method is discussed regarding the fundamental principle, system setup, and experimental results. Despite the promising achievements that have been previously reported, no established product has obtained FDA approval or survived a marketing test. The limitations of, and prospects for, these techniques are presented at the end of this review.
1. Introduction
Blood glucose level is one of the most important physiological parameters that is associated with the metabolic and homeostatic mechanism in the human body. Diabetes mellitus is a prolonged metabolic disorder due to insufficient insulin production or an improper cell response to insulin [1]. The diabetic population was projected to be 552 million by 2030, as reported by David R. Whiting et al. [2], based on data sources for 80 countries. Diabetes imposes a heavy economic burden on patients and their families. According to the American Diabetes Association, the total cost associated with diabetes in the U.S. was $327 billion in 2017 [3]. Diabetes can be classified into three main categories: Type I, Type II, and gestational diabetes [4]. The first one is usually called “juvenile diabetes”, which is mainly diagnosed in children and results from a lack of insulin produced by beta-cells [5,6,7]. Only 5~10% of diabetic patients have this form. The second one is the most prevalent among diabetic patients, accounting for more than 90% [8], and is primarily caused by an unhealthy lifestyle and genes [9]. It is characterized by insulin resistance and sometimes combines with reduced insulin secretion [4,10,11,12]. The last category usually occurs among pregnant women and will either disappear or develop to Type II diabetes after delivery [4,13,14]. Long-term abnormal levels of glucose (hyperglycemia when the glucose level is >200 mg/dL [15] and hypoglycemia when the glucose level is <70 mg/dL [16]) often lead to complications, including accelerated atherosclerosis [17], stroke [18], neuropathy [19], nephropathy [20], and retinopathy [21]. In addition, it has been reported that diabetes also significantly increases the risk of cause-specific death [18,22,23]. Since there is no specific cure for diabetes [24], daily glycemic measures need to be carried out together with active treatments (insulin injection or bariatric surgery) to improve diabetic patients’ quality of life. Since 1962, when Clark and Lyons proposed the electrochemical method [25], glucose oxidase (GOx) has been widely applied for glucose determination. The well-established glucose meters are mainly based on electro-enzymatic reactions, which require a finger-prick device to obtain a drop of blood (~1 μL) and apply it onto a disposable testing strip [26,27]. Although the accuracy of this kind of invasive device has been proved and is accepted, physical pain and infection can be easily caused [28,29] with a discrete readout only. Moreover, the annual cost of testing strips is estimated to be $750 per patient [30]. Therefore, semi-invasive or minimally invasive devices have been developed with the aim of replacing those finger-prick devices and achieving continuous blood glucose monitoring (CBGM). They usually measure the glucose concentration in interstitial fluid (ISF) by implanting a tiny and relatively painless subcutaneous sensor. Nevertheless, the sensitivity gradually degrades as the protein builds up on the surface of the sensor, and hence frequent calibration is required [31,32]. Much effort has been devoted to the development of truly noninvasive glucose sensors that employ various emerging technologies. Among those methods, electromagnetic (EM) wave sensing has drawn much attention due to its rich interactions, including absorption, scattering, and transmission, with particular compounds inside the body. As shown in Figure 1, EM waves can be classified as radio waves, microwaves, terahertz (THz) waves, visible/infrared (IR) light, ultraviolet, X-rays, and gamma rays [33] based on different frequencies or wavelengths. EM waves with higher frequencies carry higher photon energy, which can damage tissues and organs by ionizing radiation. In contrast, non-ionizing radiation is relatively safe and suitable for noninvasive biomedical sensing and imaging. The boundary between ionizing and non-ionizing radiation falls in the UV region with a photon energy between 10 eV and 33 eV, which is not well-defined. Herein, we will mainly discuss the utilization of non-ionizing radiation, including vis/IR, T-ray, and microwaves, regarding the application of a noninvasive glucose measurement. A molecule’s characterization is realized by its specific vibrational frequencies. Fundamental vibrations can be excited by the mid-infrared (MIR) light, known as the “fingerprint region” of many molecules, including glucose. Overtones and combinational bands usually fall into the near-infrared (NIR) region, while T-waves and microwaves can be used to detect tissue permittivity variations caused by glucose fluctuations. Several review articles for minimally invasive/noninvasive glucose monitoring have been published previously. The authors in [32] focused more on noninvasive glucose monitoring devices as commercial products and briefly introduced those related techniques. The authors in [34] emphasized NIR spectroscopy with comprehensive descriptions, while the other techniques were just mentioned in brief. The authors in [35] and [36] presented recent developments in minimally invasive CBGM biosensors for body fluids testing. In this article, we will review the EM-based noninvasive glucose sensing techniques; more specifically, optical methods, photoacoustic spectroscopy, THz spectroscopy, and microwave sensing. We will focus more on the theoretical basis for these techniques, implementation details from scientific and engineering points of view, and updating the reader on recent achievements from different groups to tackle this challenging issue. Various EM-based technologies are listed and compared in Section 3. Section 4 contains a discussion on, and the outlook for, noninvasive glucose sensing.
2. Performance Evaluation
To evaluate the performance of noninvasive techniques and devices, the obtained data are usually calibrated and paired with references measured by invasive blood glucose meters at the same time point. Several indicators are often adopted to quantitatively assess the performance from a statistical and clinical point of view. Firstly, the coefficient of correlation R can be used to show the degree of correlation between two data sets. Its value always varies within ±1, where a positive value indicates the same variation trend while a negative one represents the opposite trend. Another indicator, the R-squared (R2) value, is known as the coefficient of determination, which measures the goodness of a linear regression. Besides these, the root-mean-square error (RMSE), the mean absolute error (MAE), and the mean absolute percentage error (MAPE) [37] are used to evaluate the deviation of predicted values compared to references. The limit of detection (LOD) defines the minimum amount of target sample that can be measured. It reflects the system sensitivity and noise performance. In 1986, J. M. Bland and D. G. Altman claimed that using a correlation is misleading and they suggested a new statistical approach to assess degree of agreement: the Bland–Altman plot [38,39], as shown in Figure 2a. It can be used to show the difference between measured values and references, where the solid black line represents their mean difference () and the two dotted lines are “limits of agreement” whose values are calculated as (SD is the standard deviation of the differences). Apart from the abovementioned statistical accuracy evaluation methods, W. L. Clarke proposed the use of a scatterplot to describe the clinical accuracy of glucose meters, which has become the “gold standard” [40]. As shown in Figure 2b, the Clarke Error Grid (CEG) is divided into five regions, where A contains values within a ±20% deviation from the reference, and B contains predictions with >20% error but not leading to an inappropriate treatment. Data in these two regions are regarded as clinically acceptable. On the contrary, predictions falling into region C will lead to overcorrection of normal glucose levels and D represents a failure to detect abnormal glucose levels for prompt treatment. Data falling into region E will result in an erroneous and a dangerous treatment. Measurement results in these three regions (C, D, and E) are not beneficial in patients’ daily care.
3. Methodologies for Noninvasive Glucose Sensing Utilizing Electromagnetic Waves
In this section, various EM-wave-based noninvasive glucose monitoring techniques are reviewed in detail, including the basic theories, system instrumentation, and laboratory tests.
3.1. Infrared (IR) Spectroscopy
There are several kinds of interactions between light and biological tissues depending on the properties of target tissues and the characteristics of illuminating sources. The interactions can be mainly categorized into absorption, transmission, emission, reflection, and scattering. Among those, absorbance information is by far the most widely used. Molecules with vibrational and rotational motions tend to absorb light at matched frequencies or wavelengths due to resonance. More specifically, chemical bonds can move in the form of bending, symmetrical stretching, asymmetrical stretching, et al. [41]. The quantum vibrational energy bands usually fall into the infrared (IR) region [42]. Thus, IR spectroscopy has been widely applied in analytical chemistry for characterizing samples in various states such as gases, liquids and solids. Based on different excitation sources, it can be classified into near-infrared (NIR) spectroscopy [43], mid-infrared (MIR) spectroscopy [44], and far-infrared (FIR) spectroscopy [45]. In Section 3.1, we will discuss NIR and MIR, and separately discuss THz in Section 3.6, which overlaps with the FIR region.
3.1.1. Near-Infrared (NIR) Spectroscopy
NIR radiation was discovered by Sir William Herschel in 1800 [46], and the first NIR spectrum was obtained in 1881 by Abney and Festing in the range of 1000–1200 nm [47]. Nowadays, NIR spectroscopy utilizes an EM wave in the range of 700–2500 nm [34,43,48,49], which covers several optical windows where photons have less interactions with interfering tissue compounds, such as water, hemoglobin, and lipids, so that the penetration depth can achieve several millimeters [32,50], where capillary beds locate [51,52,53]. The absorption in this wavelength range corresponds to a combination, the first overtone, the second overtone, or a higher-order overtone of a fundamental molecule’s stretching and bending [43,54,55]. Glucose is a kind of monosaccharide with the molecular formula C6H12O6 in the form of pyranose. It has several absorption peaks in the NIR region, which are listed in Table 1.
The attenuated light simply due to the absorption of analytes after they pass through tissue is governed by the Beer–Lambert Law, which is expressed as
where μa is the absorption coefficient and l is the effective optical path length. μa is proportional to εC cm−1, where ε represents the molar extinction coefficient and C is the molar concentration of the analyte [56,61,62]. μa may increase with an elevated glucose level due to its intrinsic absorption or decrease due to a water displacement effect. The latter is less specific as changes of other components can also result in the same effect [56].
The basic instrumentation of NIR spectroscopy consists of a light source, such as a tungsten halogen lamp, and an IR detector. Then, the analog signal is filtered and amplified before being digitized by an analog-to-digital converter (ADC). Given the complexity of interfering component matrices, various signal-processing techniques are adopted to extract glucose-related information, including principle component regression (PCR)-, partial least-square regression (PLSR)-, and artificial neural network (ANN)-based analysis [63,64,65,66,67].
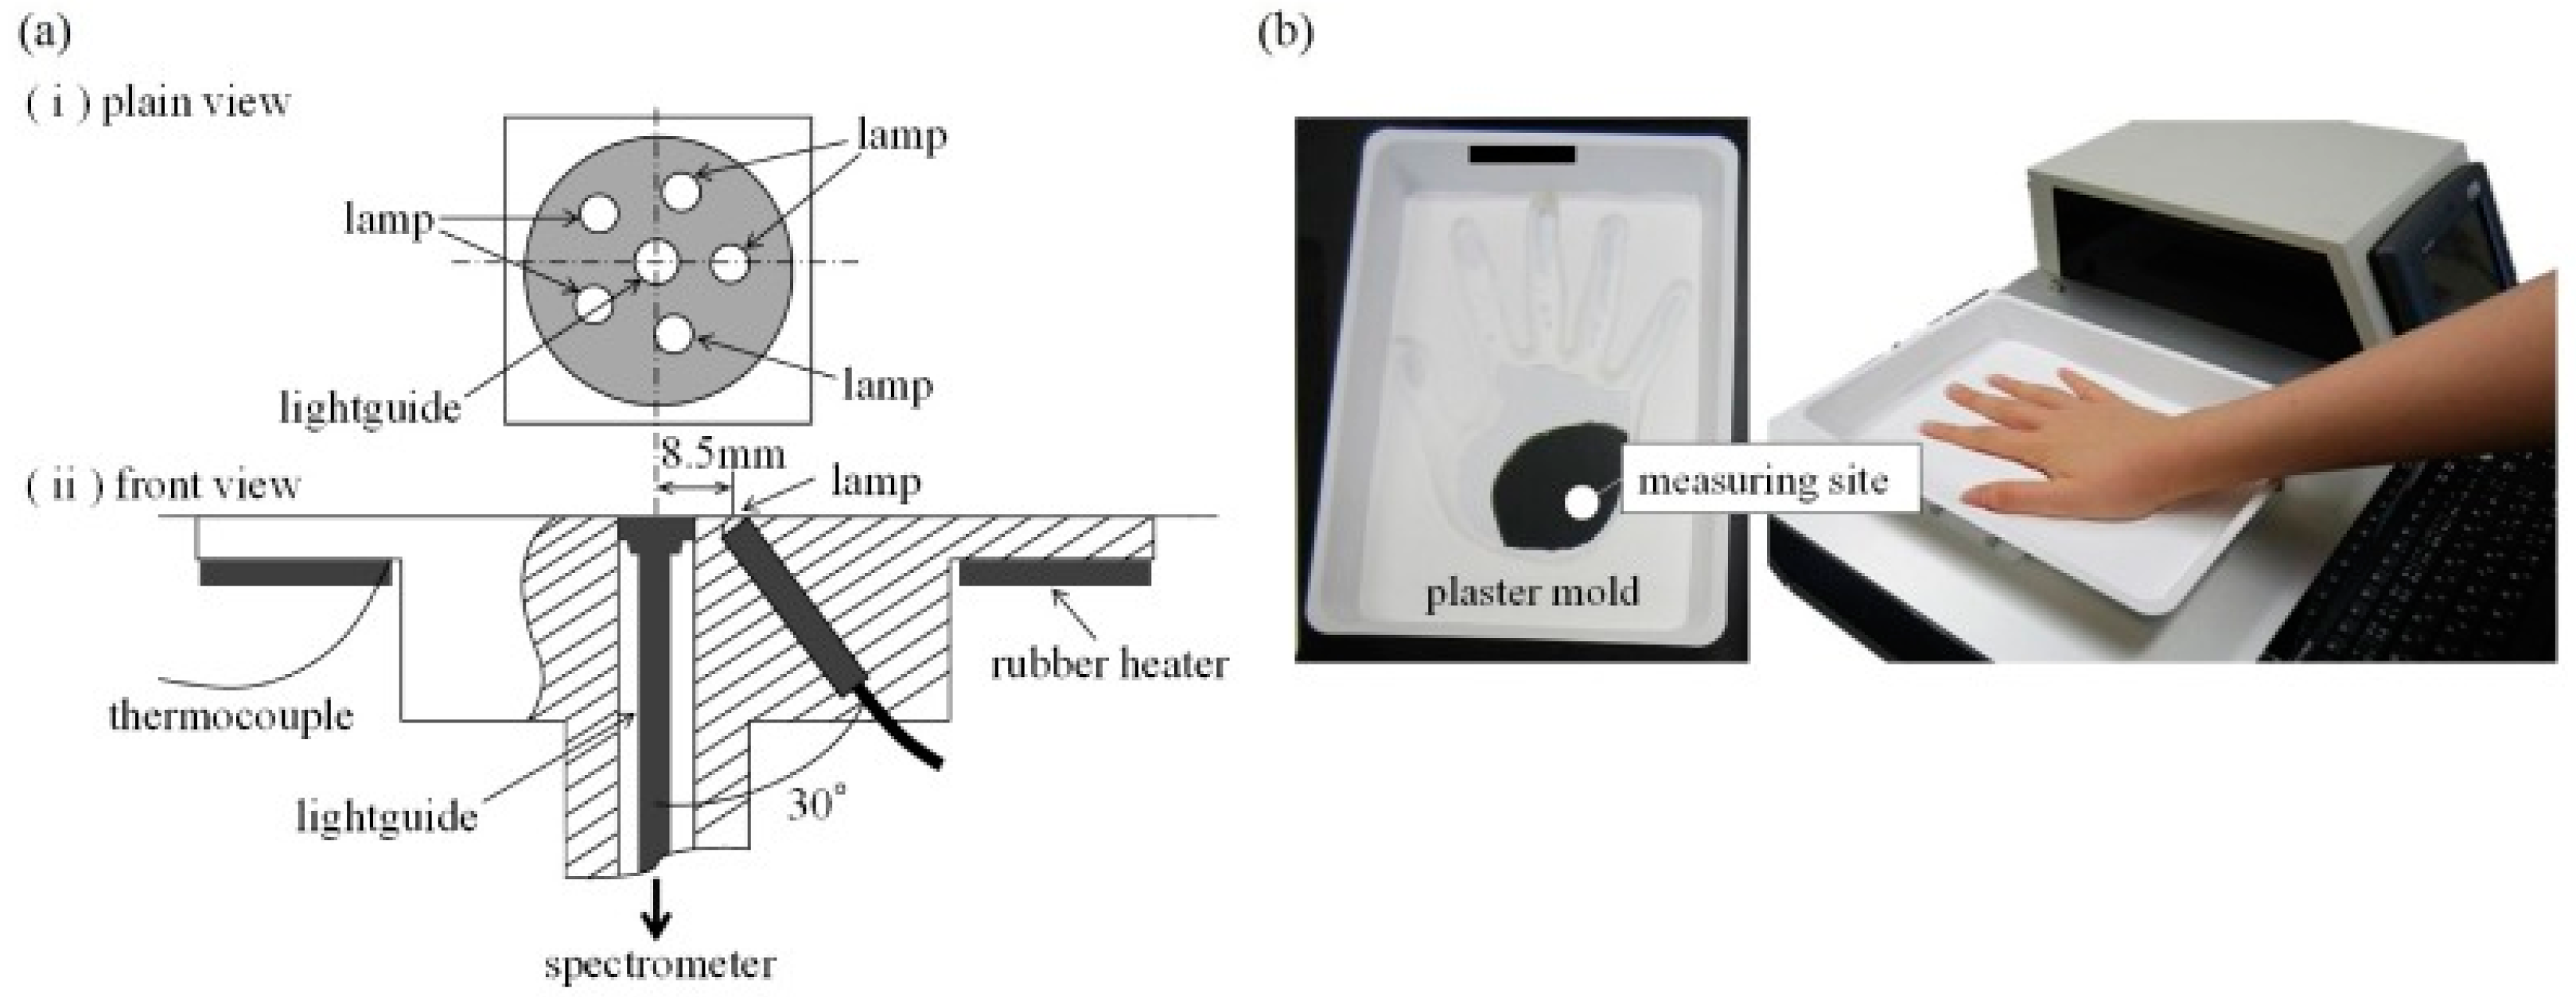
Uwadaira et al. identified the informative bands in the NIR region by 391 data sets from 34 participants’ 2-h carbohydrate tolerance tests [68]. Five tungsten halogen lamps at 1 W placed in a circle were used as an illuminating source and the diffusely reflected light was collected by the guide of a spectrometer. Patients’ hands were fixed by plaster molds. The detailed setup is shown in Figure 3. Wavelengths were scanned from 700 to 1050 nm at a step size of 1 nm. They suggested some characteristic bands (1018 nm, 1030 nm, and 1042 nm) for noninvasive glucose measurement, although the correct assignment and relation to glucose are hard to explain. Xue et al. compared linear and nonlinear regression methods by using PLS and ANN on living rats [69]. Besides this, different combinations of pretreatment methods, including first derivative, second derivative, and vector normalization, were also investigated. In their study, PLS achieved a better performance than ANN did with a lower RMSE and a higher R. Yang and co-workers investigated the informative bands in shortwave and first overtone regions [57] by a homemade NIR Fourier transform spectrometer. All-reflective optics with an Offner relay lens were employed to reduce axial chromatic and magnification chromatic aberrations. They reported that the characteristic peaks of glucose solution are 938 nm, 1040 nm, and 1295 nm caused by glucose variations in the short waveband. They also found a prominent absorption peak at 1639 nm in the first overtone band. Transmission spectra from the middle fingers of seven volunteers were obtained by performing an oral glucose tolerance test (OGTT), and characteristic peaks were only observed in the shortwave band due to the low signal-to-noise ratio (SNR) in the first overtone band.
NIR spectroscopy allows for deep tissue (>1 mm) measurement with high sensitivity. The instrumentation is simple and relatively low-cost. However, glucose absorption peaks are broad in this region and may overlap with other interferences, such as water and lipids. Besides this, temperature, humidity, and other environmental factors may also affect the measurement results.
3.1.2. Mid-Infrared (MIR) Spectroscopy
Unlike NIR spectroscopy, MIR spectroscopy employs a longer wavelength that ranges from 2500 to 10,000 nm [70] where the well-known “fingerprint region” of glucose locates. The featured absorption peaks in this region are sharper and provide better specificity than NIR spectroscopy does. The maxima of glucose absorption in the MIR region are listed in Table 2.
Despite the relatively good specificity or selectivity, penetration depth is severely limited due to the strong absorption of water and lipids [79]. Thus, MIR light can only pass through the first layer of skin—stratum corneum—with a thickness of 10–20 μm [80] and detect glucose of ISF found in the stratum spinosum layer [74,81]. It was proved that ISF in epidermis has a strong correlation with blood glucose in spite of several minutes’ delay [82,83,84,85]. Thanks to the recent development of Quantum Cascade lasers (QCLs) with high power, several groups have reported in vivo applications of MIR spectroscopy [76,86,87,88,89,90]. Liakat et al. proposed a system with an external cavity QCL (EC-QCL) and a hollow core fiber to deliver light to the human palm. Then, backscattered light was collected by a fiber bundle and a mercury cadmium telluride (MCT) detector. PLSR and second derivative spectroscopy were applied for prediction in three human subjects. All data points fell in Region A and B of the CEG, which shows that the maximum error in the prediction results was within 20%. One-hour continuous measurement was also conducted, which showed the general trend of glucose variation successfully. Their group recently improved the system by adding an integrating sphere to enhance the collection efficiency of backscattered light [90]. Kino et al. adopted attenuated total reflection (ATR) spectroscopy and utilized the evanescent wave generated when total internal reflection occurs to penetrate into the sample. The absorption of the evanescent wave by the sample can be measured by an MCT detector to infer the glucose concentration. Their hollow optical-fiber-based spectroscopy system is equipped with a trapezoidal ATR prism that allows for multiple reflections to enhance the sensitivity [76]. Inner lip mucosa were selected as the measurement site owing to the relatively thin stratum corneum and the lack of a keratinized layer, which makes the ISF accessible to the evanescent wave. They found that an absorption peak at 1155 cm−1 was most relevant to glucose, and originated from its pyranose ring structure. An in-vivo experiment was conducted. The R2 value of 0.75 was achieved, and the all of the data points were in Region A of the CEG.
The selectivity of MIR spectroscopy is better than that of NIR spectroscopy as it covers glucose’s “fingerprint region”. The major drawback of this method is that the penetration depth is limited to several microns and only ISF can be reached. Besides this, the illuminating source, such as a QCL, is bulky and expensive.
3.2. Photoacoustic Spectroscopy
The photoacoustic (PA) effect refers to a phenomenon where an object absorbs heat from light and undergoes thermal expansion followed by the generation of an acoustic wave. Combining the high contrast of an EM wave with the deep penetration of an acoustic wave in biological tissue, the PA technique is able to achieve prominent performance in bio-sensing and bio-imaging applications. Although, theoretically, any kind of EM wave can generate a PA signal, vis/IR lasers are the most frequently reported due to the wide availability of sources, the convenience of manipulation, and the rich functionality. Compared to IR spectroscopic methods for glucose detection, PA spectroscopy collects acoustic waves, which are more immune to tissue scattering and directly related to the laser energy deposited in skin, yielding deeper penetration and better sensitivity. Besides pure optical properties, such as absorption, a PA signal also contains information about the mechanical or acoustic properties of the tissue [91,92], which could be related to glucose concentration. The received PA signal by an ultrasound transducer at position z can be expressed by a one-dimensional wave equation along the z-direction [93] and solved by Green’s function [94] as follows:
where β is the thermal expansion coefficient, v is the sound velocity, Cp is the heat capacity at constant pressure, η represents the optic-heat conversion efficiency, and F represents the laser fluence. μa and v vary with glucose concentration, which can be utilized in prediction [95,96,97]. Similar to optical spectroscopy, laser wavelengths ranging from NIR to MIR have been adopted in various studies [74,98,99,100,101].
Sim et al. combined an MIR PA sensor with a raster scan to investigate the microscopic structure of skin and reduce skin condition variation during measurement [100]. The system consists of an external cavity QCL (950–1240 cm−1) as the illuminating source and a photoacoustic cell, whose resonance frequency was designed to match the laser repetition rate. The PA signal was collected by a microphone, amplified by a pre-amplifier, and then sent to a lock-in amplifier. The index finger was in direct contact with the PA cell, and the resolution achieved was 90 μm. They suggested that the dark area between the friction ridges of a finger was non-secreting and immune to sebum and sweat, so better prediction results could be achieved there. The experimental setup and acquired images are shown in Figure 4.
Zhang and co-workers proposed to utilize both PA signal amplitude and time information to enhance prediction accuracy by data fusion, without increasing apparatus and system complexity [101]. They employed an NIR laser at ~1600 nm, which is one of the broad glucose absorption peaks. Glucose solutions at both high and low concentrations were tested, and the prediction accuracy was significantly enhanced by data fusion compared to single-parameter-based prediction. The prediction results on a glucose solution with a concentration in the physiological range (0–400 mg/dL) were evaluated by a CEG and are shown in Figure 5. They also proposed a “guide-star”-assisted indirect method to enhance the sensitivity by combining [102] the fundamental principle of transmission NIR spectroscopy with that of PA spectroscopy. The modified expression of PA pressure generated by the “guide star” is
where l is the adjustable optical path length used to amplify the signal difference caused by glucose variation. To verify the method, 1-mm- and 2-mm-thick quartz cuvettes were used. The latter showed better sensitivity and accuracy as expected. This method provides an alternative solution to the noninvasive PA measurement of glucose by detecting a transmitted signal passing through the target tissue with a certain thickness (the optical path length).
Photoacoustic technology detects a laser-induced pressure change by an acoustic transducer with good sensitivity. The acoustic wave is less-scattered in tissue, resulting in a better penetration depth. Nevertheless, the measurement is sensitive to ambient pressure, temperature, and humidity.
3.3. Fluorescence Spectroscopy
Fluorescence refers to a phenomenon in which substances emit light (usually at a longer wavelength) when they absorb EM radiation. Fluorescence spectroscopy is useful in medical and biochemical analysis of chemical groups. The excitation source usually falls in the ultraviolet (UV) region with high photon energy. Fluorescence has the advantage of high sensitivity, which even allows for single molecule detection [103]. In addition, the characteristic emission of a certain fluorophore also guarantees high specificity. Fluorescent methods for glucose measurement can be based on intrinsic skin fluorescence spectroscopy (SFS) or specially designed molecule reporters. For the design of extrinsic fluorophores, several factors, including quantum yield, photostability, absorption, and wavelength, have to be considered [104]. Both fluorescence intensity and lifetime can be evaluated to provide sufficient information.
VeraLight, Inc. announced an SFS-based product, SCOUT DS, which has obtained market approval in several countries. It aims to alert adults who are at risk of diabetes by identifying advanced glycosylation end products (AGEs). Glucosense, developed by Prof. Jose’s group from the University of Leeds, utilizes ion-doped silica glass, whose fluorescent lifetime depends on the glucose concentration. They claimed that blood glucose can be measured by simply placing a finger on the glass. Tiangco and co-workers fabricated a non-enzymatic fiber optic sensor based on a glucose binding protein (GBP), aiming to detect a tiny amount of passively diffused glucose though the skin [105]. The system consists of a fiber with a GBP at the tip, a mini-fluorimeter, and other electronics, including a driver, lock-in photodetectors, and a controller as shown in Figure 6. The target was excited at 405 nm and fluorescence at 540 nm was collected. An in-vitro experiment verified the linearity of the sensor from 4 to 20 μM with a sensitivity of 0.1296 μM−1. A phantom experiment was conducted with porcine skin and a static Franz cell to demonstrate passive diffusion. Because of the thickness of 700 μm, the measurement could only be realized when the glucose in the bottom reservoir is >8 mM.
Su et al. designed a sensor based on glucose oxidation by indirectly sensing oxygen consumption [106]:
Glucose oxidase was attached on an oxygen-sensing film, and the fluorescence intensity was correlated with the glucose concentration. The used excitation wavelength was 380 nm, and a 650-nm emission was received. The sensing specificity and reversibility were well-proved by a seven-day in-vitro test, suggesting its potential to be used as a tear glucose sensor.
Fluorescence-based methods have excellent sensitivity. However, the excitation source, which falls in the UV region, suffers from strong scattering and it usually measures body fluids, such as tears and sweat, which have relatively poor correlation with blood glucose.
3.4. Raman Spectroscopy
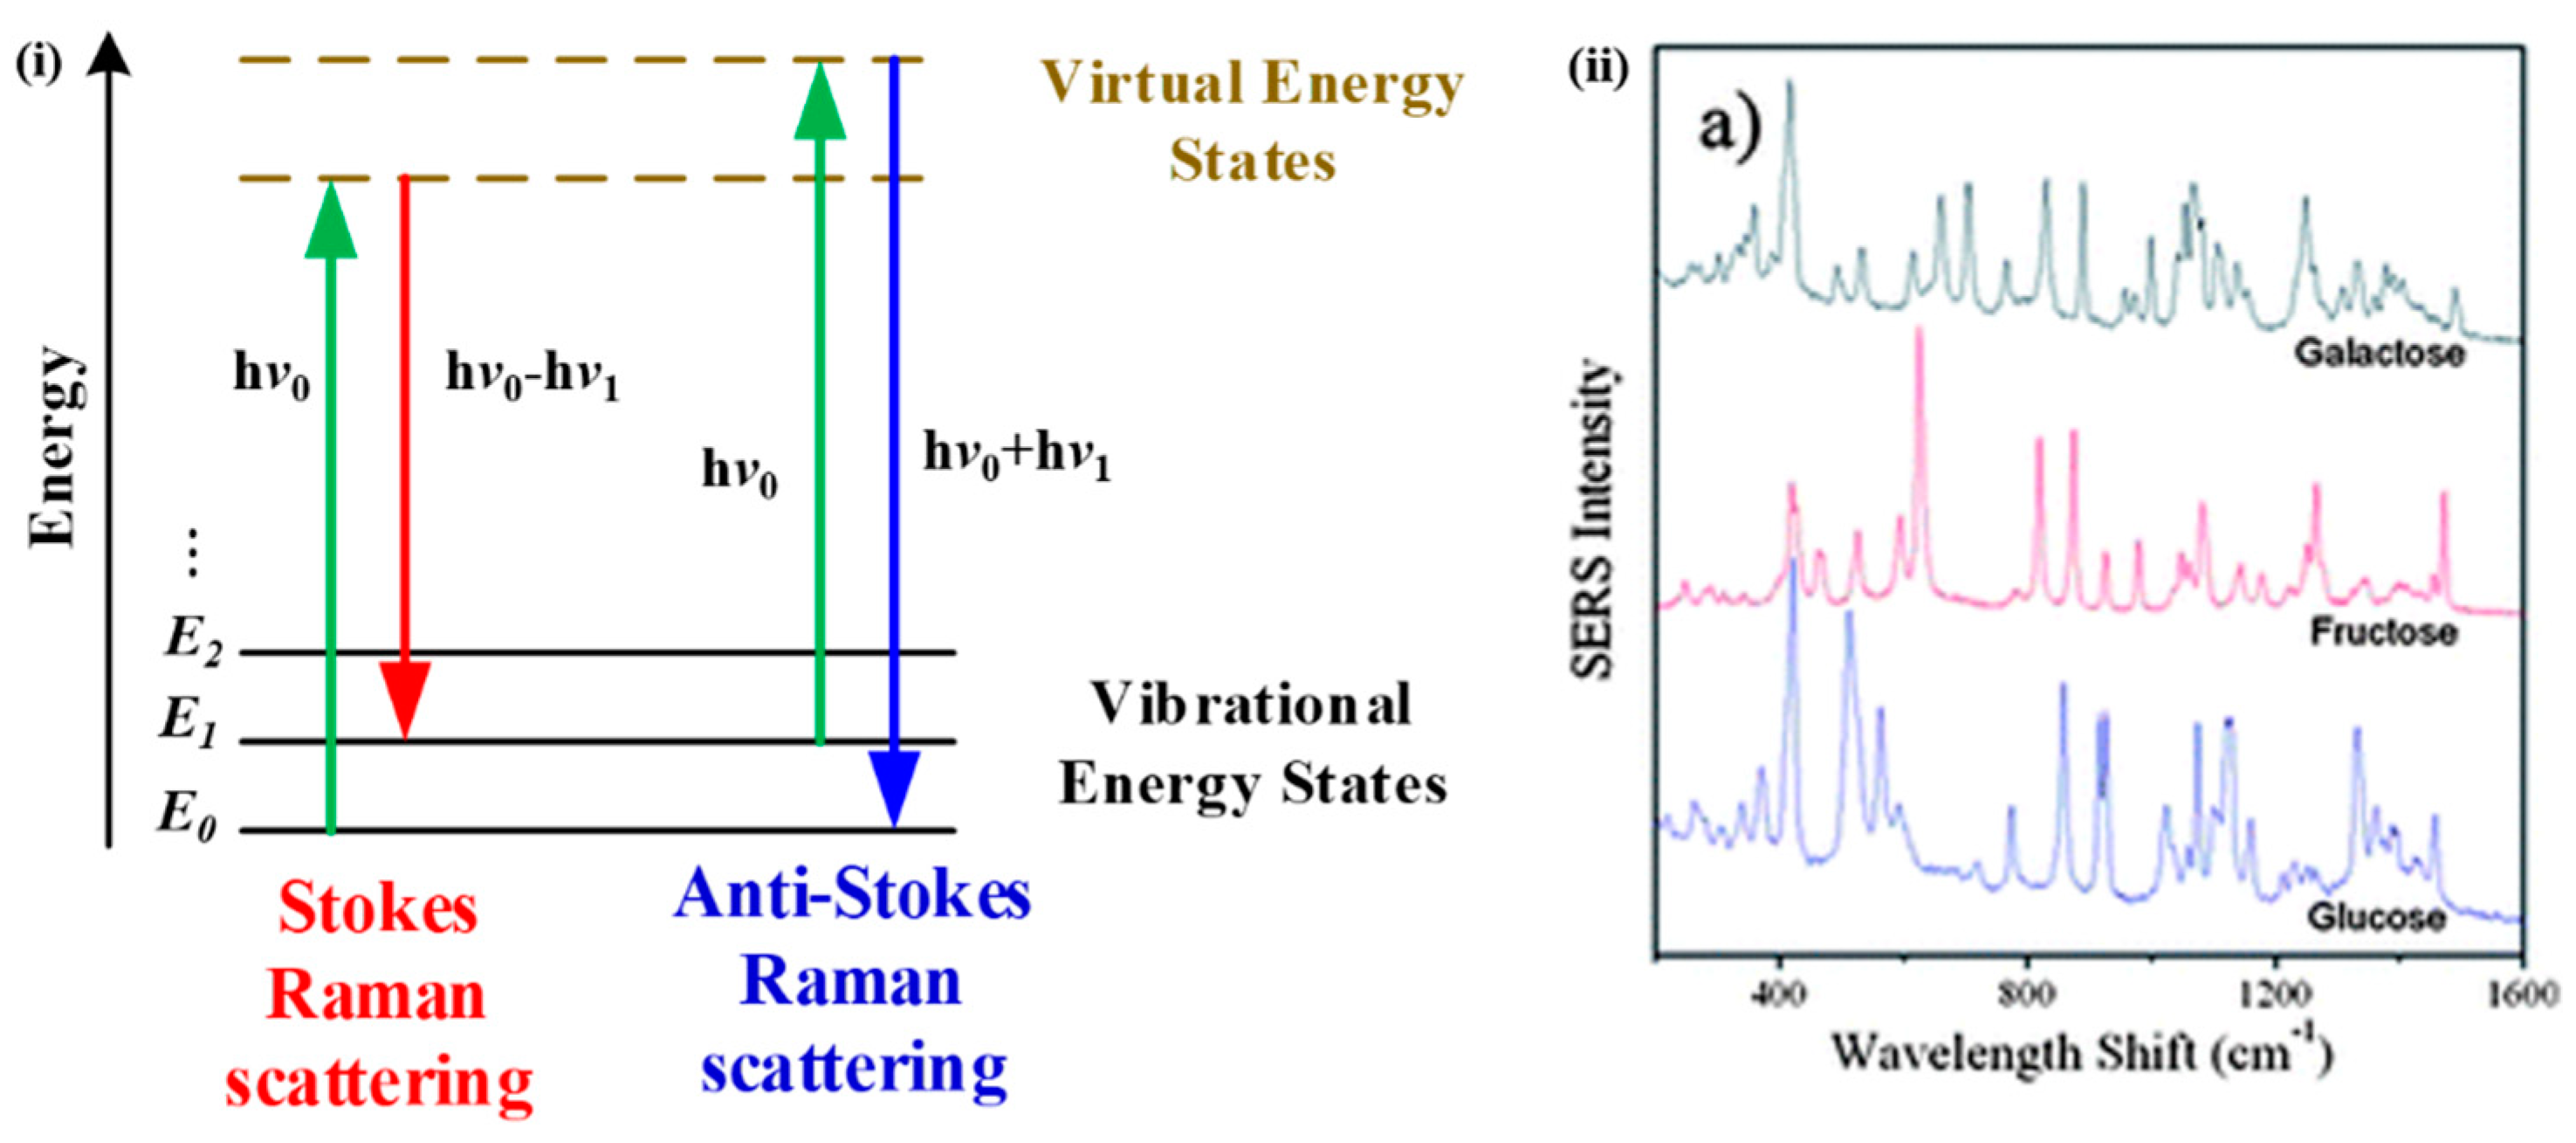
Raman spectroscopy relies on the inelastic scattering of photons, named after C.V. Raman [107], to identify different molecules. There are two types of Raman scattering: stokes scattering, in which incident photons transfer energy to molecules, resulting in scattered photons with lower energy; and anti-Stokes scattering, which leads to increased photon energy when molecules transfer energy to incident photons, as illustrated in Figure 7i. A Raman spectroscopy system consists of a coherent and monochromatic light source, a grating to disperse the light, filters, and a photodetector to obtain Raman spectra. Several advanced Raman techniques have been developed, such as surface-enhanced Raman spectroscopy (SERS), resonance Raman spectroscopy (RRS), tip-enhanced Raman spectroscopy (TERS), and their combinations. Glucose has characteristic scattering features in the range of 400–1500 cm−1 as shown in Figure 7ii [108].
Enejder and co-workers successfully demonstrated the first application of Raman spectroscopy for noninvasive glucose monitoring [109] on 17 volunteers. Four hundred and sixty-one spectra were collected and compared with a reference glucose level. A good correlation (R2 = 0.87) was obtained, and the average prediction error was 7.7%. Zheng et al. developed a miniaturized wearable Raman spectroscopy system [110]. The main body consists of a miniature Raman spectrometer, a 785-nm laser diode as an illuminating source, lenses, a Czerny–Turner optical system, and a linear array charge coupled device (CCD). The sensor probe was made of a wearable fiber with a thallium-doped grin lens for interaction and collection. The signal peak area was evaluated with a nonlinearized PLS model to predict the glucose level. Raman spectra were examined from 300 to 3000 cm−1. Ten volunteers were tested, and the mean R2 value was found to be 0.844, suggesting the feasibility of this system for clinical application.
Owing to the sharp and distinct peaks, Raman spectroscopy has excellent selectivity. However, the long acquisition time makes it sensitive to laser intensity fluctuation, and the signal is weak.
3.5. Optical Coherence Tomography (OCT)
OCT is able to provide depth-resolved information on skin layers by detecting coherently backscattered photons. It was developed by Huang et al. in 1991 [111]. The system usually consists of a two-beam interferometer and a photodiode. An envelope of an interferometric signal can be used to reconstruct a cross-sectional, two-dimensional (2D) image and the light attenuation information can be calculated thereafter. Noninvasive glucose measurement by OCT is based on the fact that glucose variation in extracellular fluid (ECF) will induce a refractive index mismatch change between ECF and cellular components. Thus, the scattering coefficient will change, which is reflected by the backscattered signal strength. The effect of the refractive index mismatch induced by glucose is higher than that of other body osmolytes [112].
Pretto and co-workers presented a method based on both spatial information on light’s total attenuation coefficient and a temporal analysis of the speckle decorrelation time to predict glucose level [113]. The former is due to a refractive index mismatch and the latter is because of a viscosity change caused by glucose fluctuation. A mouse blood sample with a glucose concentration from 160 to 310 mg/dL at a step size of 50 mg/dL was tested. An increase in signal attenuation was shown with increasing glucose concentration, which resulted from an osmotic shock of red blood cells (RBCs) that only occurred in vitro. The data were well-fitted by a linear model with an R2 of 0.98. Besides this, they also suggested that the decorrelation time of the Brownian motion is proportional to viscosity. An autocorrelation analysis was performed, and the apparent linear trend between glucose concentration and average decorrelation time was shown. Lan et al. applied OCT to diabetic patients and showed that the monitoring results were better than those of healthy subjects [114] based on R values (0.91 for diabetic patients and 0.78 for healthy volunteers).
OCT provides good resolution; however, it is similar to the scattering method for noninvasive glucose sensing. The obtained value can be affected by the presence of other interfering components, which results in poor selectivity.
3.6. Terahertz Spectroscopy
EM waves with frequencies ranging from 0.3 to 3 THz are named terahertz waves, which fall between far-infrared and microwaves. They are sensitive to not only the molecule itself but also intra- and inter-molecular rotational and vibrational transitions [115]. The excitation sources include, but are not limited, to QCLs, Gunn and tunnel transit-time (TUNNETT) diodes, solid-state electronic devices, such as uni-travelling-carrier photodiodes (UTC-PDs), and optical rectification. Photoconductive antenna, Schottky barrier diodes (SBDs), and bolometers have been widely used as terahertz detectors [116]. Moreover, electro-optic (EO) techniques can be also employed with nonlinear crystal [117]. Terahertz time-domain spectroscopy (THz-TDs) was developed for the characterization of chemical compounds and medical imaging by non-ionizing radiation. Both amplitude and phase information can be obtained in the time domain. Although many nonmetallic or nonpolar materials are transparent to T-rays, the penetration depth is limited to hundreds of micron in biological tissues, due to the strong water absorption [118,119]. Hence, transmission spectroscopy can be only applied to ex vivo sample testing [120] and is not suitable for in-vivo applications. Similar to MIR spectroscopy, reflectance spectroscopy is usually considered for ISF testing.
Cherkasova et al. adopted an ATR optical scheme with a silicon prism to obtain THz spectra of human skin [121]. The T-wave was emitted by a femtosecond laser and a low temperature grown gallium arsenide (LT-GaAs) surface, and the reflected wave was detected by a 1-mm-thick EO crystal. A 0.1–2.5 THz frequency range was used. Six volunteers were measured for 90 min with OGTT. They explained the dielectric permittivity change in the solution by a Debye model, which involves the dielectric constant and the relaxation time. When water molecules are bound to glucose molecules, the relaxation time of the bound water will change and affect the spectra shape. However, only qualitative trends were observed and explained in the article. Chen and co-workers quantified blood glucose level through ex-vivo experiments using THz-TDs [120]. A 0.2–0.9 THz wave was generated by an indium arsenide (InAs) wafer and an 800-nm femtosecond laser. The system was arranged in transmission mode. Twenty fresh blood samples from diabetic patients were measured and compared with a glucose meter. A linear correlation was obtained and the relative error was less than 15%, which verified the capability of THz-TDs to quantify glucose level.
THz is sensitive to molecules and intra/inter-molecule transitions. Nevertheless, it requires a dedicated excitation source and suffers from poor penetration depth, which means that a T-wave can only reach ISF with a reflection setup.
3.7. Microwave Sensing
A microwave is an EM wave that ranges from 1 mm to 1 m, which corresponds to frequencies between 300 GHz and 300 MHz. Microwaves can easily penetrate homogeneous tissue with a thickness of millimeters, especially in a low-frequency range [122], which remains a challenge for most of the optical-based methods. Besides this, the cost of microwave sensors is usually low and fabrication is relatively easy. The reflection, transmission, and absorption of a millimeter wave are closely related to the dielectric property or relative permittivity of skin [123,124], which varies with glucose fluctuations [125,126,127]. The complex permittivity varies with frequency, and can be expressed by the Cole–Cole equation [128]:
where and are dielectric constants at infinite and static frequencies, respectively, and is a relaxation time constant. These three parameters are related to glucose concentration [129]. is a value between 0 and 1. Scattering or S parameters describing the two-port networks are usually investigated to infer glucose change. In-vitro (with a tiny sensing volume (~nL)) as well as in-vivo applications utilizing a microwave for glucose measurement have been studied recently [130,131,132,133,134,135,136,137,138,139], and we will mainly focus on noninvasive detection here.
Xiao and Li proposed an ultra-wide band (UWB) microwave-based method using a pair of planar antennas applied to an earlobe [133]. A tissue-mimicking phantom with fat, blood, and skin layers was made to model the earlobe. A short-time Fourier Transform (STFT) was applied for the time-frequency analysis. A glucose concentration from 0 to 400 mg/dL with a step size of 50 mg/dL was tested. The regularity of forward gain S21 verified the sensor function at 6.5 GHz. Similarly, Saha and co-workers presented microstrip antennas operating at 60 GHz and measured S21 to predict glucose levels [137]. They demonstrated the sensor’s performance by in vitro and in vivo OGTT. The detection limit for aqueous glucose solution was found to be 1.33 mmol/L (1 mmol/L = 18 mg/dL), which is far below the physiological range. Apart from the amplitude of S-parameters, other characteristics of an equivalent radio frequency (RF) circuit can also be utilized to reflect permittivity change due to glucose fluctuation. Choi et al. designed a split-ring resonator that aimed to eliminate the temperature effect for noninvasive and continuous glucose monitoring [137,139]. The ring nearest to the measurement site is responsible for interacting with tissue, whereas the ring that is furthest away acts as a reference resonator. The two rings are made of silver-coated copper wire and exhibit similar temperatures. OGTT was carried out, and the 3-dB bandwidth changes in the resonance peaks were measured and correlated with a reference glucose concentration. One hundred percent of data points fell within Zone A and B of the CEG.
Microwave-based glucose sensors are low-cost and can be easily miniaturized. The penetration depth is also appreciated, especially at a low-frequency range. However, it lacks selectivity as the dielectric constant is strongly affected by other blood components as well.
4. Discussion and Conclusions
Researchers have not stopped pursuing the ultimate solution for noninvasive blood or ISF glucose monitoring, driven by the tremendous academic and market values. EM-wave-based methods are the most attractive ones owing to their wide spectral region and being information-rich. We listed several representative techniques herein and the corresponding achievements to date. Although a number of groups have demonstrated in-vitro and in-vivo applications, there is no well-recognized method that has conquered the great difficulty so far. Global challenges include sensitivity, specificity, system stability, and calibration. For example, IR and PA spectroscopy often rely on a powerful light source with a wide wavelength range as well as advanced calibration methods, such as PCR and ANN, to achieve specificity. Moreover, the penetration depth is also limited due to the strong tissue absorption in this region. Microwaves can reach deeper tissue, but there is no specific absorption for glucose. In other words, they lack specificity. Raman spectroscopy possesses favorable specificity. Nevertheless, its sensitivity is poor and it is sensitive to laser stability. Fluorescence-based methods have prominent sensitivity and specificity; however, most of them require exogenous markers and are not truly noninvasive or measure such body fluids as tears. To summarize, Table 3 that briefly compares different EM-wave-based methods is presented below.
A quantitative performance comparison is listed in Table 4, where the parameters representing each technology were extracted from the literature discussed in Section 3.
For clinical application and device development, environmental factors, such as temperature, humidity, pressure, and movement, have to be taken into account during measurement. Besides this, effort should also be devoted to miniaturization and cost reduction of the instrumentation to convert these technologies into commercial products, since portability and price are the major concerns of end-users, which determine the potential market shares. Based on the above considerations, NIR spectroscopy, PA spectroscopy, fluorescence, Raman spectroscopy, and microwave sensing have great potential to be turned into affordable products and used in daily healthcare. There are several tentative products employing the abovementioned technologies, such as Glucotrack, Glucosense, Aprise, and SugarTrac. Despite that, researchers are continuing to explore unknown areas and promising results have been reported. The requirements have yet to be met, and there is still a long way to go for these novel approaches to replace the current finger-prick glucose meters.
Author Contributions
Conceptualization, R.Z.; writing—original draft preparation, R.Z.; resources, S.L. and H.J.; writing—review and editing, Y.L. and Z.Z.; supervision, F.G. and Y.Z.; project administration, Y.Z.
Funding
This research received no external funding.
Conflicts of Interest
The authors declare no conflict of interest.
References
- Gardner, D.G.; Shoback, D.; Greenspan, F.S. Greenspan’s Basic & Clinical Endocrinology; McGraw-Hill Medical: New York, NY, USA, 2007. [Google Scholar]
- Whiting, D.R.; Guariguata, L.; Weil, C.; Shaw, J. Idf Diabetes Atlas: Global Estimates of the Prevalence of Diabetes for 2011 and 2030. Diabetes Res. Clin. Pract. 2011, 94, 311–321. [Google Scholar] [CrossRef] [PubMed]
- National Diabetes Statistics Report. 2017. Available online: https://www.cdc.gov/features/diabetes-statistic-report/index.html (accessed on 8 February 2019).
- American Diabetes Association. Standards of Medical Care in Diabetes. Diabetes Care 2007, 30, S74–S76. [Google Scholar]
- Concannon, P.; Rich, S.S.; Nepom, G.T. Genetics of Type 1a Diabetes. New Engl. J. Med. 2009, 360, 1646–1654. [Google Scholar] [CrossRef] [PubMed]
- Daneman, D. Type 1 Diabetes. The Lancet 2006, 367, 847–858. [Google Scholar] [CrossRef]
- Atkinson, M.A.; Eisenbarth, G.S.; Michels, A.W. Type 1 Diabetes. The Lancet 2014, 383, 69–82. [Google Scholar] [CrossRef]
- International Diabetes Federation. IDF Diabetes Atlas, 7th ed.; International Diabetes Federation: Brussels, Belgium, 2015. [Google Scholar]
- Risérus, U.; Willett, W.C.; Hu, F.B. Dietary Fats and Prevention of Type 2 Diabetes. Prog. Lipid Res. 2009, 48, 44–51. [Google Scholar] [CrossRef] [PubMed]
- Weyer, C.; Funahashi, T.; Tanaka, S.; Hotta, K.; Matsuzawa, Y.; Pratley, R.E.; Tataranni, P.A. Hypoadiponectinemia in Obesity and Type 2 Diabetes: Close Association with Insulin Resistance and Hyperinsulinemia. J. Clin. Endocrinol. Metab. 2001, 86, 1930–1935. [Google Scholar] [CrossRef] [PubMed] [Green Version]
- Vijan, S. Type 2 Diabetes. Annals Int. Med. 2010, 152, ITC3-1-1. [Google Scholar] [CrossRef] [PubMed]
- Chatterjee, S.; Khunti, K.; Davies, M.J. Type 2 Diabetes. The Lancet 2017, 389, 2239–2251. [Google Scholar] [CrossRef]
- Kim, C.; Newton, K.M.; Knopp, R.H. Gestational Diabetes and the Incidence of Type 2 Diabetes: A Systematic Review. Diabetes Care 2002, 25, 1862–1868. [Google Scholar] [CrossRef] [PubMed]
- American Diabetes Association. Gestational Diabetes Mellitus. Diabetes Care 2004, 27, S88. [Google Scholar] [CrossRef]
- Umpierrez, G.E.; Isaacs, S.D.; Bazargan, N.; You, X.; Thaler, L.M.; Kitabchi, A.E. Hyperglycemia: An Independent Marker of in-Hospital Mortality in Patients with Undiagnosed Diabetes. J. Clin. Endocrinol. Metab. 2002, 87, 978–982. [Google Scholar] [CrossRef] [PubMed]
- Cryer, P.E. Hypoglycemia, Functional Brain Failure, and Brain Death. J. Clin. Invest. 2007, 117, 868–870. [Google Scholar] [CrossRef] [PubMed]
- Bonora, E.; Formentini, G.; Calcaterra, F.; Lombardi, S.; Marini, F.; Zenari, L.; Saggiani, F.; Poli, M.; Perbellini, S.; Raffaelli, A. Homa-Estimated Insulin Resistance Is an Independent Predictor of Cardiovascular Disease in Type 2 Diabetic Subjects: Prospective Data from the Verona Diabetes Complications Study. Diabetes Care 2002, 25, 1135–1141. [Google Scholar] [CrossRef] [PubMed]
- Morrish, N.J.; Wang, S.L.; Stevens, L.K.; Fuller, J.H.; Keen, H.; WHO Multinational Study Group. Mortality and Causes of Death in the Who Multinational Study of Vascular Disease in Diabetes. Diabetologia 2001, 44, S14. [Google Scholar] [CrossRef] [PubMed]
- Dyck, P.J.; Kratz, K.M.; Karnes, J.L.; Litchy, W.J.; Klein, R.; Pach, J.M.; Wilson, D.M.; O’brien, P.C.; Melton, L., Jr. The Prevalence by Staged Severity of Various Types of Diabetic Neuropathy, Retinopathy, and Nephropathy in a Population-Based Cohort the Rochester Diabetic Neuropathy Study. Neurology 1993, 43, 817–824. [Google Scholar] [CrossRef] [PubMed]
- Gross, J.L.; De Azevedo, M.J.; Silveiro, S.P.; Canani, L.H.; Caramori, M.L.; Zelmanovitz, T. Diabetic Nephropathy: Diagnosis, Prevention, and Treatment. Diabetes Care 2005, 28, 164–176. [Google Scholar] [CrossRef] [PubMed]
- Klein, R.; Klein, B.E.K.; Moss, S.E.; Davis, M.D.; DeMets, D.L. The Wisconsin Epidemiologic Study of Diabetic Retinopathy: Ii. Prevalence and Risk of Diabetic Retinopathy When Age at Diagnosis Is Less Than 30 Years. Arch. Ophthalmol. 1984, 102, 520–526. [Google Scholar] [CrossRef] [PubMed]
- Baena-Díez, J.M.; Peñafiel, J.; Subirana, I.; Ramos, R.; Elosua, R.; Marín-Ibañez, A.; Guembe, M.J.; Rigo, F.; Tormo-Díaz, M.J.; Moreno-Iribas, C. Risk of Cause-Specific Death in Individuals with Diabetes: A Competing Risks Analysis. Diabetes Care 2016, 39, 1987–1995. [Google Scholar] [CrossRef] [PubMed]
- McEwen, L.N.; Kim, C.; Karter, A.J.; Haan, M.N.; Ghosh, D.; Lantz, P.M.; Mangione, C.M.; Thompson, T.J.; Herman, W.H. Risk Factors for Mortality among Patients with Diabetes: The Translating Research into Action for Diabetes (Triad) Study. Diabetes Care 2007, 30, 1736–1741. [Google Scholar] [CrossRef] [PubMed]
- Buse, J.B.; Caprio, S.; Cefalu, W.T.; Ceriello, A.; Del Prato, S.; Inzucchi, S.E.; McLaughlin, S.; Phillips, G.L.; Robertson, R.P.; Rubino, F. How Do We Define Cure of Diabetes? Diabetes Care 2009, 32, 2133–2135. [Google Scholar] [CrossRef] [PubMed] [Green Version]
- Clark, L.C.; Lyons, C. Electrode Systems for Continuous Monitoring in Cardiovascular Surgery. Ann. N. Y. Acad. Sci. 1962, 102, 29–45. [Google Scholar] [CrossRef] [PubMed]
- Andreea, C.; Hernández, C.; Simó, R. Non-Invasive Methods of Glucose Measurement: Current Status and Future Perspectives. Curr. Diabetes Rev. 2012, 8, 48–54. [Google Scholar]
- Tonyushkina, K.; Nichols, J.H. Glucose Meters: A Review of Technical Challenges to Obtaining Accurate Results. J. Diabetes Sci. Technol. 2009, 3, 971–980. [Google Scholar] [CrossRef] [PubMed] [Green Version]
- Sharon, M.G. Infection Transmission Associated with Point of Care Testing and the Laboratory’s Role in Risk Reduction. EJIFCC 2014, 25, 188–194. [Google Scholar] [PubMed]
- Inayat, F.; Rai, A.B.S. Acute Hepatitis C Virus Infection Related to Capillary Blood Glucose Meter. Saudi Med. J. 2016, 37, 93–95. [Google Scholar] [CrossRef] [PubMed]
- Yeaw, J.; Lee, W.C.; Aagren, M.; Christensen, T. Cost of Self-Monitoring of Blood Glucose in the United States among Patients on an Insulin Regimen for Diabetes. J. Manag. Care Pharm. 2012, 18, 21–32. [Google Scholar] [CrossRef] [PubMed]
- Smith, J.L. The Pursuit of Noninvasive Glucose: Hunting the Deceitful Turkey. Available online: https://www.researchgate.net/profile/John_Smith155/publication/215519631_The_Pursuit_of_Noninvasive_Glucose_Hunting_the_Deceitful_Turkey/links/047f0180f0cf2751e6eee084/The-Pursuit-of-Noninvasive-Glucose-Hunting-the-Deceitful-Turkey.pdf (accessed on 8 February 2019).
- Vashist, S.K. Non-Invasive Glucose Monitoring Technology in Diabetes Management: A Review. Analytica Chim. Acta 2012, 750, 16–27. [Google Scholar] [CrossRef] [PubMed]
- Ishimaru, A. Electromagnetic Wave Propagation, Radiation, and Scattering: From Fundamentals to Applications; John Wiley & Sons: Hoboken, NJ, USA, 2017. [Google Scholar]
- Yadav, J.; Rani, A.; Singh, V.; Murari, B.M. Prospects and Limitations of Non-Invasive Blood Glucose Monitoring Using near-Infrared Spectroscopy. Biomed. Sign. Process. Cont. 2015, 18, 214–227. [Google Scholar] [CrossRef]
- Chen, C.; Zhao, X.; Li, Z.; Zhu, Z.; Qian, S.; Flewitt, A.J. Current and Emerging Technology for Continuous Glucose Monitoring. Sensors 2017, 17, 182. [Google Scholar] [CrossRef] [PubMed]
- Bruen, D.; Delaney, C.; Florea, L.; Diamond, D. Glucose Sensing for Diabetes Monitoring: Recent Developments. Sensors 2017, 17, 1866. [Google Scholar] [CrossRef] [PubMed]
- Kovatchev, B.P.; King, C.; Breton, M.; Anderson, S.; Clarke, W. Clinical Assessment and Mathematical Modeling of the Accuracy of Continuous Glucose Sensors (Cgs). In Proceedings of the 28th Annual International Conference of Engineering in Medicine and Biology Society, New York, NY, USA, 30 August–3 September 2006. [Google Scholar]
- Bland, J.M.; Altman, D.G. Statistical Methods for Assessing Agreement between Two Methods of Clinical Measurement. The Lancet 1986, 327, 307–310. [Google Scholar] [CrossRef]
- Bland, J.M.; Altman, D.G. Comparing Methods of Measurement: Why Plotting Difference against Standard Method Is Misleading. The Lancet 1995, 346, 1085–1087. [Google Scholar] [CrossRef]
- Clarke, W.L.; Cox, D.; Gonder-Frederick, L.A.; Carter, W.; Pohl, S.L. Evaluating Clinical Accuracy of Systems for Self-Monitoring of Blood Glucose. Diabetes Care 1987, 10, 622–628. [Google Scholar] [CrossRef] [PubMed]
- Stuart, B. Infrared Spectroscopy; Wiley Online Library: Hoboken, NJ, USA, 2005. [Google Scholar]
- Wilson, E.B.; Decius, J.C.; Cross, P.C. Molecular Vibrations: The Theory of Infrared and Raman Vibrational Spectra; Courier Corporation: North Chelmsford, MA, USA, 1955. [Google Scholar]
- Siesler, H.W.; Ozaki, Y.; Kawata, S.; Heise, H.M. Near-Infrared Spectroscopy: Principles, Instruments, Applications; John Wiley & Sons: Hoboken, NJ, USA, 2008. [Google Scholar]
- Seddon, A.B.; Napier, B.; Lindsay, I.; Lamrini, S.; Moselund, P.M.; Stone, N.; Bang, O. Mid-Infrared Spectroscopy/Bioimaging: Moving toward Mir Optical Biopsy. Laser Focus World 2016, 52, 50–53. [Google Scholar]
- Griffiths, P.R.; Homes, C.C. Instrumentation for Far-Infrared Spectroscopy. In Handbook of Vibrational Spectroscopy; John Wiley & Sons: Hoboken, NJ, USA, 2006. [Google Scholar] [Green Version]
- Herschel, W. Xiii. Investigation of the Powers of the Prismatic Colours to Heat and Illuminate Objects; with Remarks, that Prove the Different Refrangibility of Radiant Heat. To Which Is Added, an Inquiry into the Method of Viewing the Sun Advantageously, with Telescopes of Large Apertures and High Magnifying Powers. Philos. Trans. R. Soc. London 1800, 90, 255–283. [Google Scholar]
- Abney, W.; Festing, E.R. Near Infrared Spectral of Organic Liquids. Philos. Trans. R. Soc. 1881, 172, 887. [Google Scholar]
- Ozaki, Y. Near-Infrared Spectroscopy—Its Versatility in Analytical Chemistry. Analyt. Sci. 2012, 28, 545–563. [Google Scholar] [CrossRef]
- Burns, D.A.; Ciurczak, E.W. Handbook of near-Infrared Analysis; CRC Press: Boca Raton, FL, USA, 2007. [Google Scholar]
- Perrey, S. Non-Invasive Nir Spectroscopy of Human Brain Function During Exercise. Methods 2008, 45, 289–299. [Google Scholar] [CrossRef] [PubMed]
- Braverman, I.M. The Cutaneous Microcirculation: Ultrastructure and Microanatomical Organization. Microcirculation 1997, 4, 329–340. [Google Scholar] [CrossRef] [PubMed]
- Shore, A.C. Capillaroscopy and the Measurement of Capillary Pressure. Br. J. Clin. Pharmacol. 2000, 50, 501–513. [Google Scholar] [CrossRef] [PubMed]
- McCall, R.E.; Tankersley, C.M. Phlebotomy Essentials; Lippincott Williams & Wilkins: Philadelphia, PA, USA, 2008. [Google Scholar]
- McClure, W.F. Near-Infrared Spectroscopy the Giant Is Running Strong. Analyt. Chem. 1994, 66, 42A–53A. [Google Scholar] [CrossRef]
- Weyer, L.; Workman, J., Jr. Practical Guide to Interpretive near-Infrared Spectroscopy; CRC Press: Boca Raton, FL, USA, 2007. [Google Scholar]
- Khalil, O.S. Spectroscopic and Clinical Aspects of Noninvasive Glucose Measurements. Clin. Chem. 1999, 45, 165–177. [Google Scholar] [PubMed]
- Yang, W.; Liao, N.; Cheng, H.; Li, Y.; Bai, X.; Deng, C. Determination of Nir Informative Wavebands for Transmission Non-Invasive Blood Glucose Measurement Using a Fourier Transform Spectrometer. AIP Adv. 2018, 8, 035216. [Google Scholar] [CrossRef]
- Golic, M.; Walsh, K.; Lawson, P. Short-Wavelength near-Infrared Spectra of Sucrose, Glucose, and Fructose with Respect to Sugar Concentration and Temperature. Appl. Spectrosc. 2003, 57, 139–145. [Google Scholar] [CrossRef] [PubMed]
- Osborne, B.G.; Fearn, T.; Hindle, P.H. Practical Nir Spectroscopy with Applications in Food and Beverage Analysis; Longman Scientific and Technical: Harlow, UK, 1993. [Google Scholar]
- Šašić, S.; Ozaki, Y. Short-Wave near-Infrared Spectroscopy of Biological Fluids. 1. Quantitative Analysis of Fat, Protein, and Lactose in Raw Milk by Partial Least-Squares Regression and Band Assignment. Analyt. Chem. 2001, 73, 64–71. [Google Scholar] [CrossRef]
- Swinehart, D.F. The Beer-Lambert Law. J. Chem. Edu. 1962, 39, 333. [Google Scholar] [CrossRef]
- Kocsis, L.; Herman, P.; Eke, A. The Modified Beer–Lambert Law Revisited. Phys. Med. Biology 2006, 51, N91. [Google Scholar] [CrossRef] [PubMed]
- Cirovic, D.A. Feed-Forward Artificial Neural Networks: Applications to Spectroscopy. TrAC Trends Analyt. Chem. 1997, 16, 148–155. [Google Scholar] [CrossRef]
- Jagemann, K.; Fischbacher, C.; Danzer, K.; Mueller, U.A.; Mertes, B. Application of near-Infrared Spectroscopy for Non-Invasive Determination of Blood/Tissue Glucose Using Neural Networks. Zeitschrift für Physikalische Chemie 1995, 191, 179–190. [Google Scholar] [CrossRef]
- Fischbacher, C.; Jagemann, K.U.; Danzer, K.; Müller, U.A.; Papenkordt, L.; Schüler, J. Enhancing Calibration Models for Non-Invasive near-Infrared Spectroscopical Blood Glucose Determination. Fresenius’ J. Analyt. Chem. 1997, 359, 78–82. [Google Scholar] [CrossRef]
- Mouazen, A.M.; Kuang, B.; De Baerdemaeker, J.; Ramon, H. Comparison among Principal Component, Partial Least Squares and Back Propagation Neural Network Analyses for Accuracy of Measurement of Selected Soil Properties with Visible and near Infrared Spectroscopy. Geoderma 2010, 158, 23–31. [Google Scholar] [CrossRef]
- Bhandare, P.; Mendelson, Y.; Peura, R.A.; Janatsch, G.; Kruse-Jarres, J.D.; Marbach, R.; Heise, H.M. Multivariate Determination of Glucose in Whole Blood Using Partial Least-Squares and Artificial Neural Networks Based on Mid-Infrared Spectroscopy. Appl. Spectrosc. 1993, 47, 1214–1221. [Google Scholar] [CrossRef]
- Uwadaira, Y.; Ikehata, A.; Momose, A.; Miura, M. Identification of Informative Bands in the Short-Wavelength Nir Region for Non-Invasive Blood Glucose Measurement. Biomedical Opt. express 2016, 7, 2729–2737. [Google Scholar] [CrossRef] [PubMed]
- Jintao, X.; Ye, L.; Liu, Y.; Li, C.; Chen, H. Noninvasive and Fast Measurement of Blood Glucose in Vivo by near Infrared (Nir) Spectroscopy. Spectrochim. Acta Part A: Mol. Biomol. Spectrosc. 2017, 179, 250–254. [Google Scholar] [CrossRef] [PubMed]
- Khalil, O.S. Non-Invasive Glucose Measurement Technologies: An Update from 1999 to the Dawn of the New Millennium. Diabetes Technol. Therapeut. 2004, 6, 660–697. [Google Scholar] [CrossRef] [PubMed]
- Vasko, P.D.; Blackwell, J.; Koenig, J.L. Infrared and Raman Spectroscopy of Carbohydrates: Part I: Identification of O-H and C-H-Related Vibrational Modes for D-Glucose, Maltose, Cellobiose, and Dextran by Deuterium-Substitution Methods. Carbohydr. Res. 1971, 19, 297–310. [Google Scholar] [CrossRef]
- Vasko, P.D.; Blackwell, J.; Koenig, J.L. Infrared and Raman Spectroscopy of Carbohydrates: Part II: Normal Coordinate Analysis of A-D-Glucose. Carbohydr. Res. 1972, 23, 407–416. [Google Scholar] [CrossRef]
- Tuchin, V.V. Handbook of Optical Sensing of Glucose in Biological Fluids and Tissues; CRC Press: Boca Raton, FL, USA, 2008. [Google Scholar]
- Pleitez, M.A.; Lieblein, T.; Bauer, A.; Hertzberg, O.; von Lilienfeld-Toal, H.; Mäntele, W. In Vivo Noninvasive Monitoring of Glucose Concentration in Human Epidermis by Mid-Infrared Pulsed Photoacoustic Spectroscopy. Analyt. Chem. 2012, 85, 1013–1020. [Google Scholar] [CrossRef] [PubMed]
- Ibrahim, M.; Alaam, M.; El-Haes, H.; Jalbout, A.F.; de Leon, A. Analysis of the Structure and Vibrational Spectra of Glucose and Fructose. Ecletica Quim. 2006, 31, 15–21. [Google Scholar] [CrossRef]
- Kino, S.; Omori, S.; Katagiri, T.; Matsuura, Y. Hollow Optical-Fiber Based Infrared Spectroscopy for Measurement of Blood Glucose Level by Using Multi-Reflection Prism. Biomed. Opt. Express 2016, 7, 701–708. [Google Scholar] [CrossRef] [PubMed]
- Pleitez, M.; von Lilienfeld-Toal, H.; Mäntele, W. Infrared Spectroscopic Analysis of Human Interstitial Fluid in Vitro and in Vivo Using Ft-Ir Spectroscopy and Pulsed Quantum Cascade Lasers (Qcl): Establishing a New Approach to Non Invasive Glucose Measurement. Spectrochim. Acta Part A: Mol. Biomol. Spectrosc. 2012, 85, 61–65. [Google Scholar] [CrossRef] [PubMed]
- Petibois, C.; Rigalleau, V.; Melin, A.; Perromat, A.; Cazorla, G.; Gin, H.; Déléris, G. Determination of Glucose in Dried Serum Samples by Fourier-Transform Infrared Spectroscopy. Clin. Chem. 1999, 45, 1530–1535. [Google Scholar] [PubMed]
- Waynant, R.W.; Chenault, V.M. Overview of Non-Invasive Fluid Glucose Measurement Using Optical Techniques to Maintain Glucose Control in Diabetes Mellitus. LEOS Newslett. 1998, 12, 3–6. [Google Scholar]
- Elsner, P. Skin Bioengineering: Techniques and Applications in Dermatology and Cosmetology; Karger Medical and Scientific Publishers: Basel, Switzerland, 1998. [Google Scholar]
- Von Lilienfeld-Toal, H.; Weidenmüller, M.; Xhelaj, A.; Mäntele, W. A Novel Approach to Non-Invasive Glucose Measurement by Mid-Infrared Spectroscopy: The Combination of Quantum Cascade Lasers (Qcl) and Photoacoustic Detection. Vib. Spectrosc. 2005, 38, 209–215. [Google Scholar] [CrossRef]
- Pfohl, M.; Pfeiffer, A.; Schaltz, H. Spot Glucose Measurement in Epidermal Interstitial Fluid—an Alternative to Capillary Blood Glucose Estimation? Exp. Clin. Endocrinol. Diabetes 2000, 108, 1–4. [Google Scholar] [CrossRef] [PubMed]
- O’brien, P.C.; Wise, S.D.; Ness, S.; LeBlanc, S.M. Dermal Interstitial Glucose as an Indicator of Ambient Glycemia. Diabetes Care 1997, 20, 1426–1429. [Google Scholar]
- Gebhart, S.; Faupel, M.; Fowler, R.; Kapsner, C.; Lincoln, D.; McGee, V.; Pasqua, J.; Steed, L.; Wangsness, M.; Xu, F. Glucose Sensing in Transdermal Body Fluid Collected under Continuous Vacuum Pressure Via Micropores in the Stratum Corneum. Diabetes Technol. Therapeut. 2003, 5, 159–166. [Google Scholar] [CrossRef] [PubMed]
- Thennadil, S.N.; Rennert, J.L.; Wenzel, B.J.; Hazen, K.H.; Ruchti, T.L.; Block, M.B. Comparison of Glucose Concentration in Interstitial Fluid, and Capillary and Venous Blood During Rapid Changes in Blood Glucose Levels. Diabetes Technol. Therapeut. 2001, 3, 357–365. [Google Scholar] [CrossRef] [PubMed]
- Liakat, S.; Bors, K.A.; Xu, L.; Woods, C.M.; Doyle, J.; Gmachl, C.F. Noninvasive in Vivo Glucose Sensing on Human Subjects Using Mid-Infrared Light. Biomed. Opt. Express 2014, 5, 2397–2404. [Google Scholar] [CrossRef] [PubMed]
- Kasahara, R.; Kino, S.; Soyama, S.; Matsuura, Y. Noninvasive Glucose Monitoring Using Mid-Infrared Absorption Spectroscopy Based on a Few Wavenumbers. Biomed. Opt. Express 2018, 9, 289–302. [Google Scholar] [CrossRef] [PubMed]
- Liakat, S.; Bors, K.A.; Xu, L.; Woods, C.M.; Doyle, J.; Gmachl, C.F. Mid-Infrared Noninvasive in Vivo Glucose Detection in Healthy Human Subjects. In Proceedings of the 2014 Conference on Lasers and Electro-Optics (CLEO) - Laser Science to Photonic Applications, San Jose, CA, USA, 8–13 June 2014. [Google Scholar]
- Liakat, S. Development of a Noninvasive in Vivo Glucose Sensor Based on Mid-Infrared Quantum Cascade Laser Spectroscopy; Princeton University: Princeton, NJ, USA, 2015. [Google Scholar]
- Werth, A.; Liakat, S.; Dong, A.; Woods, C.M.; Gmachl, C.F. Implementation of an Integrating Sphere for the Enhancement of Noninvasive Glucose Detection Using Quantum Cascade Laser Spectroscopy. Appl. Phys. B 2018, 124, 75. [Google Scholar] [CrossRef]
- Gao, F.; Feng, X.; Zheng, Y.; Ohl, C.D. Photoacoustic Resonance Spectroscopy for Biological Tissue Characterization. J. Biomed. Opt. 2014, 19, 067006. [Google Scholar] [CrossRef] [PubMed]
- Zhang, R.; Gao, F.; Feng, X.; Liu, S.; Ding, R.; Zheng, Y. Photoacoustic Resonance Imaging. IEEE J. Sel. Top. Quantum Electron. 2019, 25, 1–7. [Google Scholar] [CrossRef]
- Wang, L.V. Tutorial on Photoacoustic Microscopy and Computed Tomography. IEEE J. Sel. Top. Quantum Electron. 2018, 24, 171–179. [Google Scholar] [CrossRef]
- Diebold, G.J.; Sun, T. Properties of Photoacoustic Waves in One, Two, and Three Dimensions. Acta Acustica United Acustica 1994, 80, 339–351. [Google Scholar]
- Zhao, S.; Tao, W.; He, Q.; Zhao, H.; Cao, W. A Non-Invasive Photoacoustic and Ultrasonic Method for the Measurement of Glucose Solution Concentration. AIP Adv. 2017, 7, 035313. [Google Scholar] [CrossRef]
- Zhao, Z. Pulsed Photoacoustic Techniques and Glucose Determination in Human Blood and Tissue; University of Oulu Finland: Oulu, Finland, 2002. [Google Scholar]
- Harman-Boehm, I.; Gal, A.; Raykhman, A.M.; Zahn, J.D.; Naidis, E.; Mayzel, Y. Noninvasive Glucose Monitoring: A Novel Approach. J. Diabetes Sci. Technol. 2009, 3, 253–260. [Google Scholar] [CrossRef] [PubMed] [Green Version]
- Kottmann, J.; Rey, J.M.; Luginbühl, J.; Reichmann, E.; Sigrist, M.W. Glucose Sensing in Human Epidermis Using Mid-Infrared Photoacoustic Detection. Biomed. Opt. Express 2012, 3, 667–680. [Google Scholar] [CrossRef] [PubMed]
- Pai, P.P.; Sanki, P.K.; Banerjee, S. A Photoacoustics Based Continuous Non-Invasive Blood Glucose Monitoring System. In Proceedings of the 2015 IEEE International Symposium on Medical Measurements and Applications (MeMeA), Torino, Italy, 7–9 May 2015. [Google Scholar]
- Sim, J.Y.; Ahn, C.-G.; Jeong, E.-J.; Kim, B.K. In Vivo Microscopic Photoacoustic Spectroscopy for Non-Invasive Glucose Monitoring Invulnerable to Skin Secretion Products. Sci. Rep. 2018, 8, 1059. [Google Scholar] [CrossRef] [PubMed]
- Zhang, R.; Gao, F.; Feng, X.; Liu, S.; Kishor, R.; Luo, Y.; Zheng, Y. Noninvasive Photoacoustic Measurement of Glucose by Data Fusion. Analyst 2017, 142, 2892–2896. [Google Scholar] [CrossRef] [PubMed]
- Zhang, R.; Gao, F.; Feng, X.; Jin, H.; Zhang, S.; Liu, S.; Luo, Y.; Xing, B.; Zheng, Y. “Guide Star” Assisted Noninvasive Photoacoustic Measurement of Glucose. ACS Sensors 2018, 3, 2550–2557. [Google Scholar] [CrossRef] [PubMed]
- Weiss, S. Fluorescence Spectroscopy of Single Biomolecules. Science 1999, 283, 1676–1683. [Google Scholar] [CrossRef] [PubMed]
- Barone, P.W.; Parker, R.S.; Strano, M.S. In Vivo Fluorescence Detection of Glucose Using a Single-Walled Carbon Nanotube Optical Sensor: Design, Fluorophore Properties, Advantages, and Disadvantages. Anal. Chem. 2005, 77, 7556–7562. [Google Scholar] [CrossRef] [PubMed]
- Tiangco, C.; Fon, D.; Sardesai, N.; Kostov, Y.; Sevilla, F., III; Rao, G.; Tolosa, L. Fiber Optic Biosensor for Transdermal Glucose Based on the Glucose Binding Protein. Sensors Actuat. B: Chem. 2017, 242, 569–576. [Google Scholar] [CrossRef]
- Su, F.; Zhang, L.; Kong, X.; Lee, F.; Tian, Y.; Meldrum, D.R. Ratiometric Glucose Sensing Based on Fluorescent Oxygen Films and Glucose Oxidase. Sensing Bio-Sensing Res. 2017, 14, 1–6. [Google Scholar] [CrossRef]
- Raman, C.V.; Krishnan, K.S. A New Type of Secondary Radiation. Nature 1928, 121, 501. [Google Scholar] [CrossRef]
- Dong, J.; Tao, Q.; Guo, M.; Yan, T.; Qian, W. Glucose-Responsive Multifunctional Acupuncture Needle: A Universal Sers Detection Strategy of Small Biomolecules in Vivo. Analyt. Methods 2012, 4, 3879–3883. [Google Scholar] [CrossRef]
- Enejder, A.M.K.; Scecina, T.G.; Oh, J.; Hunter, M.; Shih, W.; Sasic, S.; Horowitz, G.L.; Feld, M.S. Raman Spectroscopy for Noninvasive Glucose Measurements. J. Biomed. Opt. 2005, 10, 031114. [Google Scholar] [CrossRef] [PubMed]
- Zheng, Y.; Zhu, X.; Wang, Z.; Hou, Z.; Gao, F.; Nie, R.; Cui, X.; She, J.; Peng, B. Noninvasive Blood Glucose Detection Using a Miniature Wearable Raman Spectroscopy System. Chin. Opt. Lett. 2017, 15, 083001. [Google Scholar] [CrossRef]
- Huang, D.; Swanson, E.A.; Lin, C.P.; Schuman, J.S.; Stinson, W.G.; Chang, W.; Hee, M.R.; Flotte, T.; Gregory, K.; Puliafito, C.A. Optical Coherence Tomography. Science 1991, 254, 1178–1181. [Google Scholar] [CrossRef] [PubMed]
- Larin, K.V.; Motamedi, M.; Ashitkov, T.V.; Esenaliev, R.O. Specificity of Noninvasive Blood Glucose Sensing Using Optical Coherence Tomography Technique: A Pilot Study. Phys. Med. Biol. 2003, 48, 1371. [Google Scholar] [CrossRef] [PubMed]
- De Pretto, L.R.; Yoshimura, T.M.; Ribeiro, M.S.; de Freitas, A.Z. Optical Coherence Tomography for Blood Glucose Monitoring in Vitro through Spatial and Temporal Approaches. J. Biomed. Opt. 2016, 21, 086007. [Google Scholar] [CrossRef] [PubMed]
- Lan, Y.T.; Kuang, Y.P.; Zhou, L.P.; Wu, G.Y.; Gu, P.C.; Wei, H.J.; Chen, K. Noninvasive Monitoring of Blood Glucose Concentration in Diabetic Patients with Optical Coherence Tomography. Laser Phys. Lett. 2017, 14, 035603. [Google Scholar] [CrossRef]
- Siegel, P.H. Terahertz Technology. IEEE Trans. Microwave Theor. Tech. 2002, 50, 910–928. [Google Scholar] [CrossRef]
- Tonouchi, M. Cutting-Edge Terahertz Technology. Nature Phot. 2007, 1, 97. [Google Scholar] [CrossRef]
- Gallot, G.; Grischkowsky, D. Electro-Optic Detection of Terahertz Radiation. JOSA B 1999, 16, 1204–1212. [Google Scholar] [CrossRef]
- Pickwell, E.; Wallace, V.P. Biomedical Applications of Terahertz Technology. J. Phys. D Appl. Phys. 2006, 39, R301. [Google Scholar] [CrossRef]
- Oh, S.J.; Kim, S.-H.; Jeong, K.; Park, Y.; Huh, Y.-M.; Son, J.-H.; Suh, J.-S. Measurement Depth Enhancement in Terahertz Imaging of Biological Tissues. Opt. Express 2013, 21, 21299–21305. [Google Scholar] [CrossRef] [PubMed]
- Chen, H.; Chen, X.; Ma, S.; Wu, X.; Yang, W.; Zhang, W.; Li, X. Quantify Glucose Level in Freshly Diabetic’s Blood by Terahertz Time-Domain Spectroscopy. J. Infrared Millimeter Terahertz Waves 2018, 39, 399–408. [Google Scholar] [CrossRef]
- Cherkasova, O.; Nazarov, M.; Shkurinov, A. Noninvasive Blood Glucose Monitoring in the Terahertz Frequency Range. Opt. Quantum Electron. 2016, 48, 217. [Google Scholar] [CrossRef]
- Fuchs, J.; Herrling, T.; Groth, N. Detection of Free Radicals in Skin: A Review of the Literature and New Developments. In Oxidants and Antioxidants in Cutaneous Biology; Karger Publisher: Basel, Switzerland, 2001. [Google Scholar]
- Zhadobov, M.; Chahat, N.; Sauleau, R.; Quement, C.L.; Drean, Y.L. Millimeter-Wave Interactions with the Human Body: State of Knowledge and Recent Advances. Int. J. Microwave Wirel. Technol. 2011, 3, 237–247. [Google Scholar] [CrossRef]
- Alekseev, S.I.; Ziskin, M.C. Human Skin Permittivity Determined by Millimeter Wave Reflection Measurements. Bioelectromagn. J.Bioelectromagn Soc. Soc. Phys. Regul. Biol. Med Eur. Bioelectromagn. Assoc. 2007, 28, 331–339. [Google Scholar] [CrossRef] [PubMed]
- Park, J.-H.; Kim, C.-S.; Choi, B.-C.; Ham, K.-Y. The Correlation of the Complex Dielectric Constant and Blood Glucose at Low Frequency. Biosens. Bioelectron. 2003, 19, 321–324. [Google Scholar] [CrossRef]
- Caduff, A.; Hirt, E.; Feldman, Y.; Ali, Z.; Heinemann, L. First Human Experiments with a Novel Non-Invasive, Non-Optical Continuous Glucose Monitoring System. Biosens. Bioelectron. 2003, 19, 209–217. [Google Scholar] [CrossRef]
- Hayashi, Y.; Livshits, L.; Caduff, A.; Feldman, Y. Dielectric Spectroscopy Study of Specific Glucose Influence on Human Erythrocyte Membranes. J. Phys. D Appl. Phys. 2003, 36, 369. [Google Scholar] [CrossRef]
- Cole, K.S.; Cole, R.H. Dispersion and Absorption in Dielectrics I. Alternating Current Characteristics. J. Chem. Phys. 1941, 9, 341–351. [Google Scholar] [CrossRef]
- Turgul, V.; Kale, I. Characterization of the Complex Permittivity of Glucose/Water Solutions for Noninvasive Rf/Microwave Blood Glucose Sensing. In Proceedings of the 2016 IEEE International Instrumentation and Measurement Technology Conference Proceedings (I2MTC), Taipei, Taiwan, 23–26 May 2016. [Google Scholar]
- Buford, R.J.; Green, E.C.; McClung, M.J. A Microwave Frequency Sensor for Non-Invasive Blood-Glucose Measurement. In Proceedings of the 2008 Sensors Applications Symposium, Atlanta, GA, USA, 12–14 February 2008. [Google Scholar]
- Chien, J.; Yeh, E.-C.; Lee, L.P.; Anwar, M.; Niknejad, A.M. A Microwave Reconfigurable Dielectric-Based Glucose Sensor with 20 Mg/Dl Sensitivity at Sub-Nl Sensing Volume in Cmos. In Proceedings of the 2015 IEEE MTT-S International Microwave Symposium, Phoenix, AZ, USA, 17–22 May 2015. [Google Scholar]
- Bababjanyan, A.; Melikyan, H.; Kim, S.; Kim, J.; Lee, K.; Friedman, B. Real-Time Noninvasive Measurement of Glucose Concentration Using a Microwave Biosensor. J. Sens. 2010, 2010, 452163. [Google Scholar] [CrossRef]
- Xiao, X.; Li, Q. A Non-Invasive Measurement of Blood Glucose Concentration by Uwb Microwave Spectrum. IEEE Antennas Wirel. Propag. Lett. 2017, 16, 1040–1043. [Google Scholar] [CrossRef]
- Kim, J.; Babajanyan, A.; Hovsepyan, A.; Lee, K.; Friedman, B. Microwave Dielectric Resonator Biosensor for Aqueous Glucose Solution. Rev. Sci. Instrum. 2008, 79, 086107. [Google Scholar] [CrossRef] [PubMed]
- Zhang, R.; Qu, Z.; Jin, H.; Liu, S.; Luo, Y.; Zheng, Y. Noninvasive Glucose Measurement by Microwave Biosensor with Accuracy Enhancement. In Proceedings of the 2018 IEEE International Symposium on Circuits and Systems (ISCAS), Florence, Italy, 27–30 May 2018. [Google Scholar]
- Abedeen, Z.; Agarwal, P. Microwave Sensing Technique Based Label-Free and Real-Time Planar Glucose Analyzer Fabricated on Fr4. Sens. Actuators A Phys. 2018, 279, 132–139. [Google Scholar] [CrossRef]
- Choi, H.; Naylon, J.; Luzio, S.; Beutler, J.; Birchall, J.; Martin, C.; Porch, A. Design and in Vitro Interference Test of Microwave Noninvasive Blood Glucose Monitoring Sensor. System 2015, 19, 20. [Google Scholar] [CrossRef] [PubMed]
- Saha, S.; Cano-Garcia, H.; Sotiriou, I.; Lipscombe, O.; Gouzouasis, I.; Koutsoupidou, M.; Palikaras, G.; Mackenzie, R.; Reeve, T.; Kosmas, P. A Glucose Sensing System Based on Transmission Measurements at Millimetre Waves Using Micro Strip Patch Antennas. Sci. Rep. 2017, 7, 6855. [Google Scholar] [CrossRef] [PubMed]
- Choi, H.; Nylon, J.; Luzio, S.; Beutler, J.; Porch, A. Design of Continuous Non-Invasive Blood Glucose Monitoring Sensor Based on a Microwave Split Ring Resonator. In Proceedings of the 2014 IEEE MTT-S International Microwave Workshop Series on RF and Wireless Technologies for Biomedical and Healthcare Applications (IMWS-Bio2014), London, UK, 8–10 December 2014. [Google Scholar]
Figure 1.
A diagram of the electromagnetic (EM) spectrum and its relevance to glucose. NIR, near-infrared; MIR, mid-infrared; FIR, far-infrared.
Figure 1.
A diagram of the electromagnetic (EM) spectrum and its relevance to glucose. NIR, near-infrared; MIR, mid-infrared; FIR, far-infrared.

Figure 2.
Examples of (a) a Bland–Altman plot and (b) a Clarke Error Grid (CEG) Analysis.
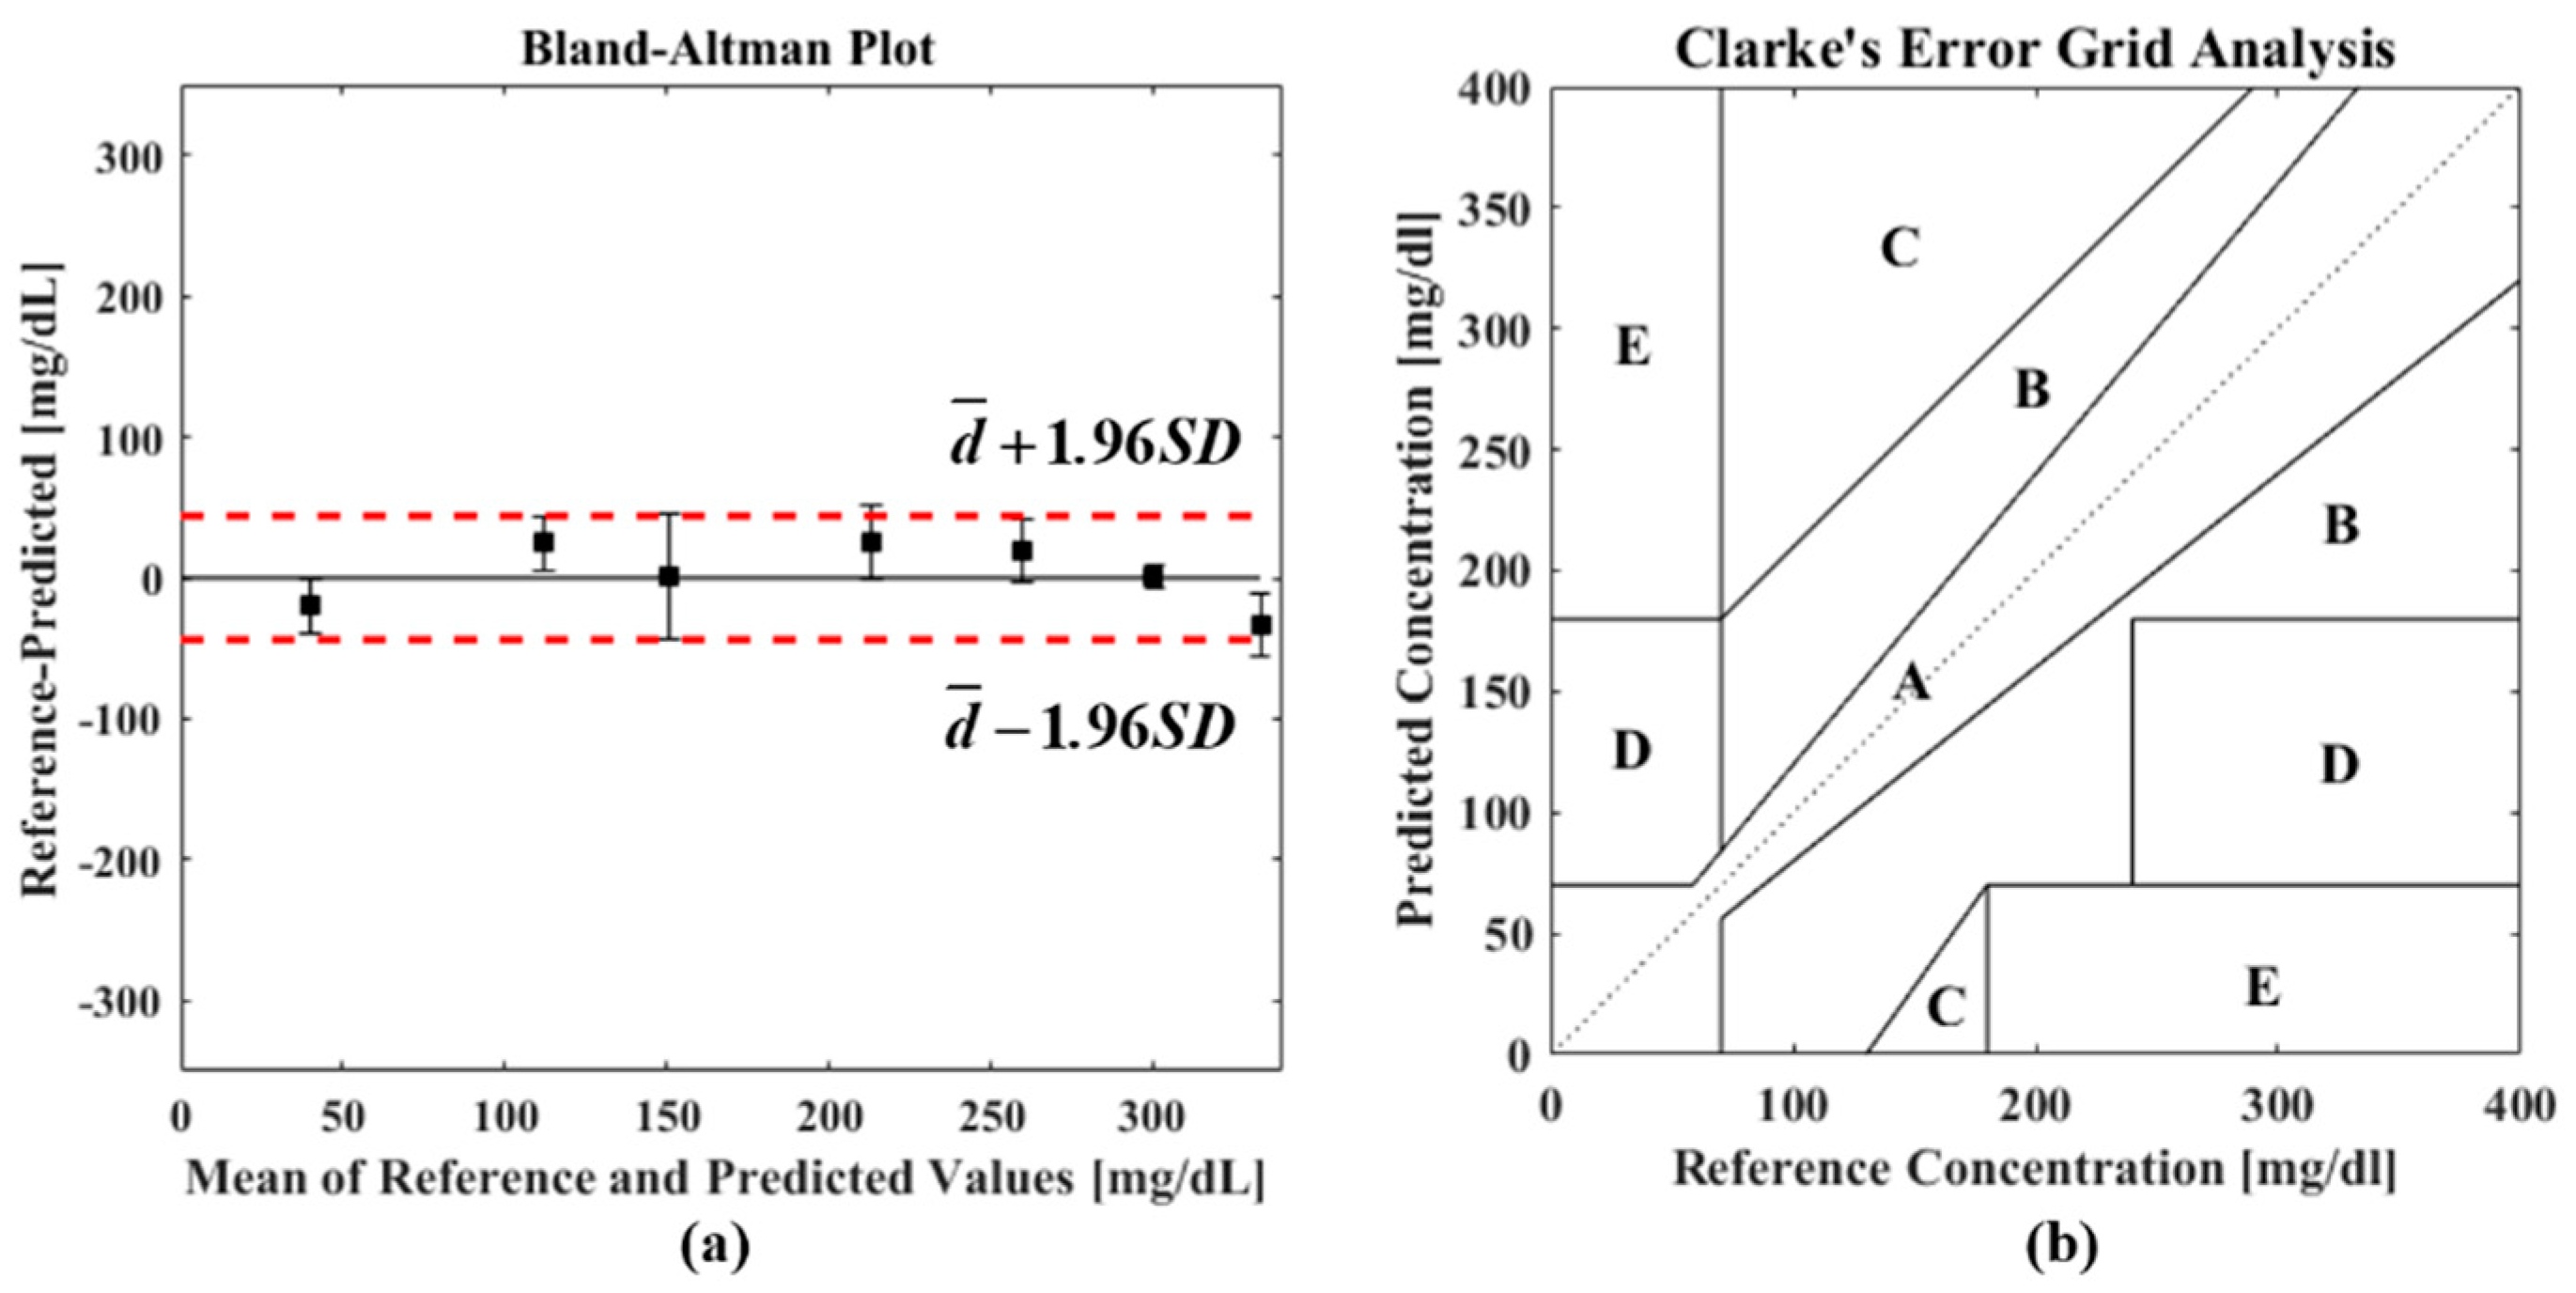
Figure 3.
(a) Setup details. (b) A plaster mold to restrain a patient’s hand. Reprinted with permission from [68].
Figure 3.
(a) Setup details. (b) A plaster mold to restrain a patient’s hand. Reprinted with permission from [68].

Figure 4.
(i) (a) A schematic of the position scanning photoacoustic (PA) microscopy system and (b) system resolution evaluation by SU-8 (a kind of photoresist structure). (ii) PA images (a,b) and corresponding micrographs (c,d) of two fingertip regions. Reprinted with permission from [100]. PC, personal computer; QCL, Quantum Cascade Laser; DAQ, data acquisition.

Figure 5.
Correlations between references and predicted glucose concentrations shown in CEGs by using (a) the PA amplitude, (b) the time delay, and (c) a data fusion. Reprinted with permission from [101].
Figure 5.
Correlations between references and predicted glucose concentrations shown in CEGs by using (a) the PA amplitude, (b) the time delay, and (c) a data fusion. Reprinted with permission from [101].

Figure 6.
(a) A schematic of the fiber optic sensor system. (b) In vitro experimental setup. Reprinted with permission from [105].
Figure 6.
(a) A schematic of the fiber optic sensor system. (b) In vitro experimental setup. Reprinted with permission from [105].
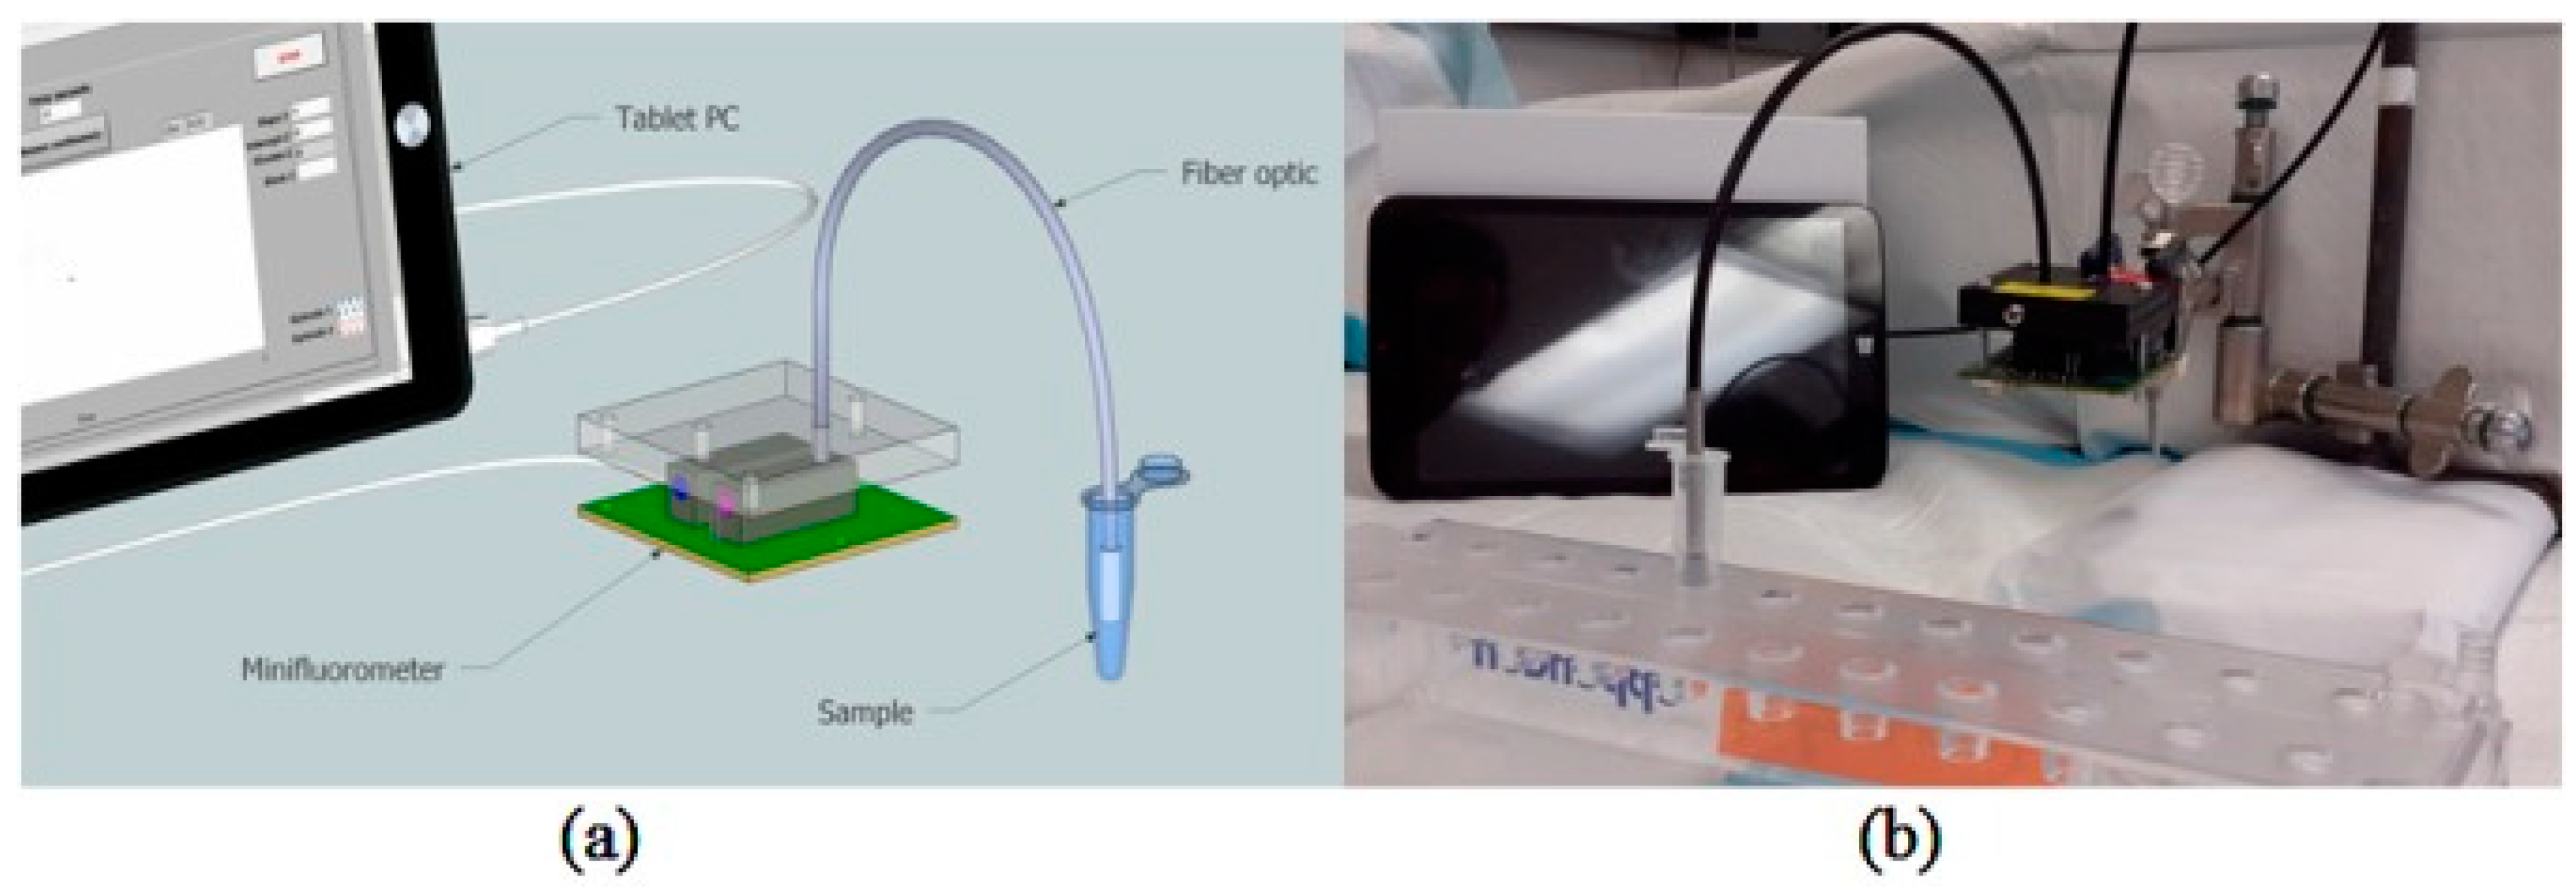
Figure 7.
(i) An energy diagram of Raman scatterings. (ii) Examples of Raman spectra of different sugars. Reprinted with permission from [108]. SERS, surface-enhanced Raman spectroscopy.
Figure 7.
(i) An energy diagram of Raman scatterings. (ii) Examples of Raman spectra of different sugars. Reprinted with permission from [108]. SERS, surface-enhanced Raman spectroscopy.

Table 1.
Absorption peaks of glucose in the NIR region and the corresponding functional groups.
| No. | Wavelength (nm) | Functional Group |
|---|---|---|
| 1 | 2273 | Combination of O-H/C-O stretching [55] |
| 2 | 2261 | νCH + νCCH [56] |
| 3 | 1688 | 2νCH [56] |
| 4 | 1638 | First overtone [57] |
| 5 | 1536 | νOH + νCH [56] |
| 6 | 1408 | 2νOH [56] |
| 7 | 1126 | 3νCH [56] |
| 8 | 1042 | Combination of νCH [58,59] |
| 9 | 1018 | Combination of νCH [60] |
| 10 | 939 | 3νOH [56] |
| 11 | 930 | 3νCH2 [58] |
| 12 | 910 | 4νCH [58,59] |
Table 2.
Absorption peaks of glucose in the MIR region and the corresponding functional groups.
| No. | Wavelength (nm) | Functional Group |
|---|---|---|
| 1 | 8000 | C-H bending vibrations [70,71,72,73] |
| 2 | 8244 | [74] |
| 3 | 8658 | Pyranose ring [75,76] |
| 4 | 8680 | [77] |
| 5 | 9290 | C-H bending vibrations [70,71,72,73,74,77] |
| 6 | 9551 | C-H bending vibrations [70,71,72,73] |
| 7 | 9680 | ν(C–O–H) or ν(C–O–C) vibration [72,73,74,77,78] |
| 8 | 9746 | C–O–H bending vibration [70,72,73] |
Table 3.
Comparison of different EM-wave-based methods.
| Technology | Penetration | Target | Sensitivity | Selectivity | System Size | Cost |
|---|---|---|---|---|---|---|
| NIR | >1 mm | ISF, blood | High | Good | Portable | Low |
| MIR | Several μm | ISF | High | Good, better than NIR spectroscopy | Large | High |
| PA | Better than IR spectroscopy | ISF, blood | High | Good | Portable | Low |
| Fluorescence | <1 mm | Tear, ISF, blood | High | Excellent | Portable | Low |
| Raman | <1 mm | ISF, tears | Low | Excellent | Portable | Medium |
| OCT | <1 mm | ISF | High | Poor | Portable | Medium |
| THz | ~100 μm | ISF | High | Good | Large | High |
| Microwave | >1 mm | Blood, ISF | High | Poor | Portable/wearable | Very Low |
ISF, interstitial fluid; OCT, Optical Coherence Tomography.
Table 4.
Performance comparison of different technologies.
| Technology | Experiment | Number of Points | CEG | Sensitivity | R2 | MAE | LOD | |||
|---|---|---|---|---|---|---|---|---|---|---|
| A | B | C | D | |||||||
| NIR [68] | In vivo | 2737 | 94.2% | 5.7% | 0% | 0.1% | - | - | 0.65 mM | - |
| MIR [76] | In vivo | 14 | 100% | 0% | 0% | 0% | - | - | 0.67 mM | - |
| PA [100] | In vivo | 76 | 70% | 30% | 0% | 0% | - | - | 1.03 mM | - |
| Fluorescence [105] | In vitro | 8 | - | - | - | - | 0.1296 μM−1 | 0.99 | - | 2 μM |
| Raman [110] | In vivo | 34 | - | - | - | - | - | 0.84 | 0.37 mM | - |
| OCT [114] | In vivo | 81 | - | - | - | - | 5.78% mM−1 | 0.91 | - | - |
| THz [120] | Ex vivo | 20 | - | - | - | - | - | 0.97 | 0.25 mM | - |
| Microwave [138] | In vivo | 89 | - | - | - | - | 0.0235 dB*mM−1 | - | - | 1.33 mM |
MAE, mean absolute error; LOD, limit of detection.
© 2019 by the authors. Licensee MDPI, Basel, Switzerland. This article is an open access article distributed under the terms and conditions of the Creative Commons Attribution (CC BY) license (http://creativecommons.org/licenses/by/4.0/).
Share and Cite
MDPI and ACS Style
Zhang, R.; Liu, S.; Jin, H.; Luo, Y.; Zheng, Z.; Gao, F.; Zheng, Y. Noninvasive Electromagnetic Wave Sensing of Glucose. Sensors 2019, 19, 1151. https://doi.org/10.3390/s19051151
AMA Style
Zhang R, Liu S, Jin H, Luo Y, Zheng Z, Gao F, Zheng Y. Noninvasive Electromagnetic Wave Sensing of Glucose. Sensors. 2019; 19(5):1151. https://doi.org/10.3390/s19051151
Chicago/Turabian StyleZhang, Ruochong, Siyu Liu, Haoran Jin, Yunqi Luo, Zesheng Zheng, Fei Gao, and Yuanjin Zheng. 2019. "Noninvasive Electromagnetic Wave Sensing of Glucose" Sensors 19, no. 5: 1151. https://doi.org/10.3390/s19051151
Note that from the first issue of 2016, this journal uses article numbers instead of page numbers. See further details here.