Performance Degradations of MISFET-Based Hydrogen Sensors with a Pd-Ta2O5-SiO2-Si Structure During Long-Term Operation

1
Micro- and nanoelectronics Department, National Research Nuclear University MEPhI (Moscow Engineering Physics Institute), 115409 Moscow, Russia
2
Induko Ltd., 32/2 Seslavinskaia str., 121309 Moscow, Russia
*
Author to whom correspondence should be addressed.
Sensors 2019, 19(8), 1855; https://doi.org/10.3390/s19081855
Submission received: 28 March 2019
/
Revised: 12 April 2019
/
Accepted: 15 April 2019
/
Published: 18 April 2019
(This article belongs to the Special Issue Field-Effect Transistors for Chemical Sensors)
Abstract
:We present the generalized experimental results of performance degradation of hydrogen sensors based on metal-insulator-semiconductor field effect transistor (MISFET)with the structure Pd-Ta2O5-SiO2-Si. The n-channel MISFET elements were fabricated on silicon single chips together with temperature sensors and heater-resistors by means of conventional -technology. Two hundred cycles of responses to different hydrogen concentrations were measured during eight weeks using special measuring and temperature stabilization circuitries with a feedback loop based on the chip’s thermo-sensor and heater. We show how the response parameters change during long-term tests of sensors under repeated hydrogen impacts. There were two stages of time-dependent response instability, the degradation of which depends on operating conditions, hydrogen concentrations, and time. To interpret results, we proposed the models, parameters of which were calculated using experimental data. These models can be used to predict performances of MISFET-based gas analysis devices for long-term operation.
1. Introduction
There are a lot of hydrogen sensors commercially available or in development: mechanical, acoustic, optical, catalytic, electrochemical, thermal conductivity-, resistance- and work function-based [1]. The hydrogen sensors are being used in devices to detect the places of hydrogen leakage in hydrogen engines, as well as for monitoring of hydrogen concentrations at nuclear power plants and in storage of electric energy batteries to ensure explosion safety. Besides, gas sensors can also be used in devices to monitor oil and gas deposits, as well as to forecast seismic activity and earthquakes by measuring the concentration of hydrogen and methane emitted from the earth. The capacitor and transistor elements based on metal–insulator–semiconductor (MIS) structures possess the best compatibility with the integrated circuit elements. Therefore, such sensitive elements seem promising to develop integrated hydrogen sensors and gas analysis microsystems-on-chip.
The gas sensors based on MIS-capacitors and field-effect transistors (MISFETs) have been studied by many investigators (e.g., [2,3,4,5,6,7,8,9,10,11,12,13,14,15,16,17]). A great contribution to the developments of gas-sensitive MIS devices has been made by the researchers at Linköping University since their first work in 1975 [2]. Their works [3,4,5,7,12,14] described the gas sensitivity mechanisms, kinetic modeling of hydrogen adsorption/absorption in thin films of catalytic metals and formation of hydrogen atom dipoles in metal–SiO2 interfaces of MIS sensors. MIS sensors with different gate materials (palladium, platinum and iridium), with dielectric films SiO2, Si3N4–SiO2, TiO2–SiO2 and Ta2O5–SiO2 have been investigated. The semiconductors Si [2,3,4,5,6,7,8,11,12], GaAs [9] and SiC [14] were used in MIS gas sensors to detect low concentrations of the gases H2 [2,3,4], NH3 [5], H2S [12] and CO [14]. The studies have shown that performance characteristics of MISFET-based hydrogen sensors depend on technological parameters [6], electrical modes [15], chip temperature [17] and external factors (other gases, irradiation [16]).
The researchers of two laboratories at National Research Nuclear University MEPhI (Moscow Engineering Physics Institute) have developed and investigated the number of discrete sensors (MIS-capacitors, Pd- and Pt-resistors) and two types of integrated gas sensors with the structures Pd (or Pt)–SiO2–Si, Pd/Ti–SiO2–Si and Pd (or Pt)–Ta2O5–SiO2–Si. Both types of integrated sensors contained four elements. In one case, these elements were a capacitor and a MISFET with Pd-gate, thermo-sensitive diode element and the test MISFET with an Al-gate (sensor was called as IHS-1). In another case, these elements are the gas sensitive Pd (or Pt)-resistor and MISFET with a Pd (or Pt) gate, heater-resistor and temperature sensor (sensor was called as IHS-2). Work in this area has been going on for about 25 years. The results of studies of the influence of technological factors (types and thicknesses of dielectrics and metal films, methods of their fabrication) on the metrological characteristics of different types of sensors took a long time (2–4 years for each sensor type). The results of the research were published mainly (80 %) in sources of information that are inaccessible to a wide range of researchers (scientific reports, dissertations and diploma projects). Most of the articles are published in Russian journals and conference proceedings. Numerous experiments have demonstrated that with the same technological parameters, MISFETs have the best performance compared to MIS capacitors in IHS-1 and resistors in IHS-2. In addition, the integrated sensors of the second type (IHS-2), containing MISFETs with a Pd–Ta2O5–SiO2–Si-structure, possess the best stability and reproducibility of characteristics [6,11]. Therefore, in recent years we have investigated the characteristics of this MISFET. The performance characteristics of these sensors and effects of chip temperature, electrical mode and irradiation were studied in our previous works [16,17,18,19,20].
In most of these works, sensor characteristics were studied by measurement of a single or a few (3–5) short-term responses to different hydrogen concentrations. However, previous studies have shown that under long-term hydrogen action, the metrological characteristics of the sensors are subject to change [11]. Performance characteristics (sensitivity, speed, errors and stability) are determined by sensor response parameters, the repeatability of which becomes an important characteristic for long-term operation of gas analytical devices. The question arises: how does long-term hydrogen exposure affect response parameters? To answer this question, we have researched the long-term hydrogen effects on MISFET sensors.
The aims of this paper are to generalize data on research of response parameter changes (performance degradation) of MISFET-based sensors on Pd–Ta2O5–SiO2–Si structures for long-term operation and to propose models, taking in to account the performance degradation.
2. Materials and Methods
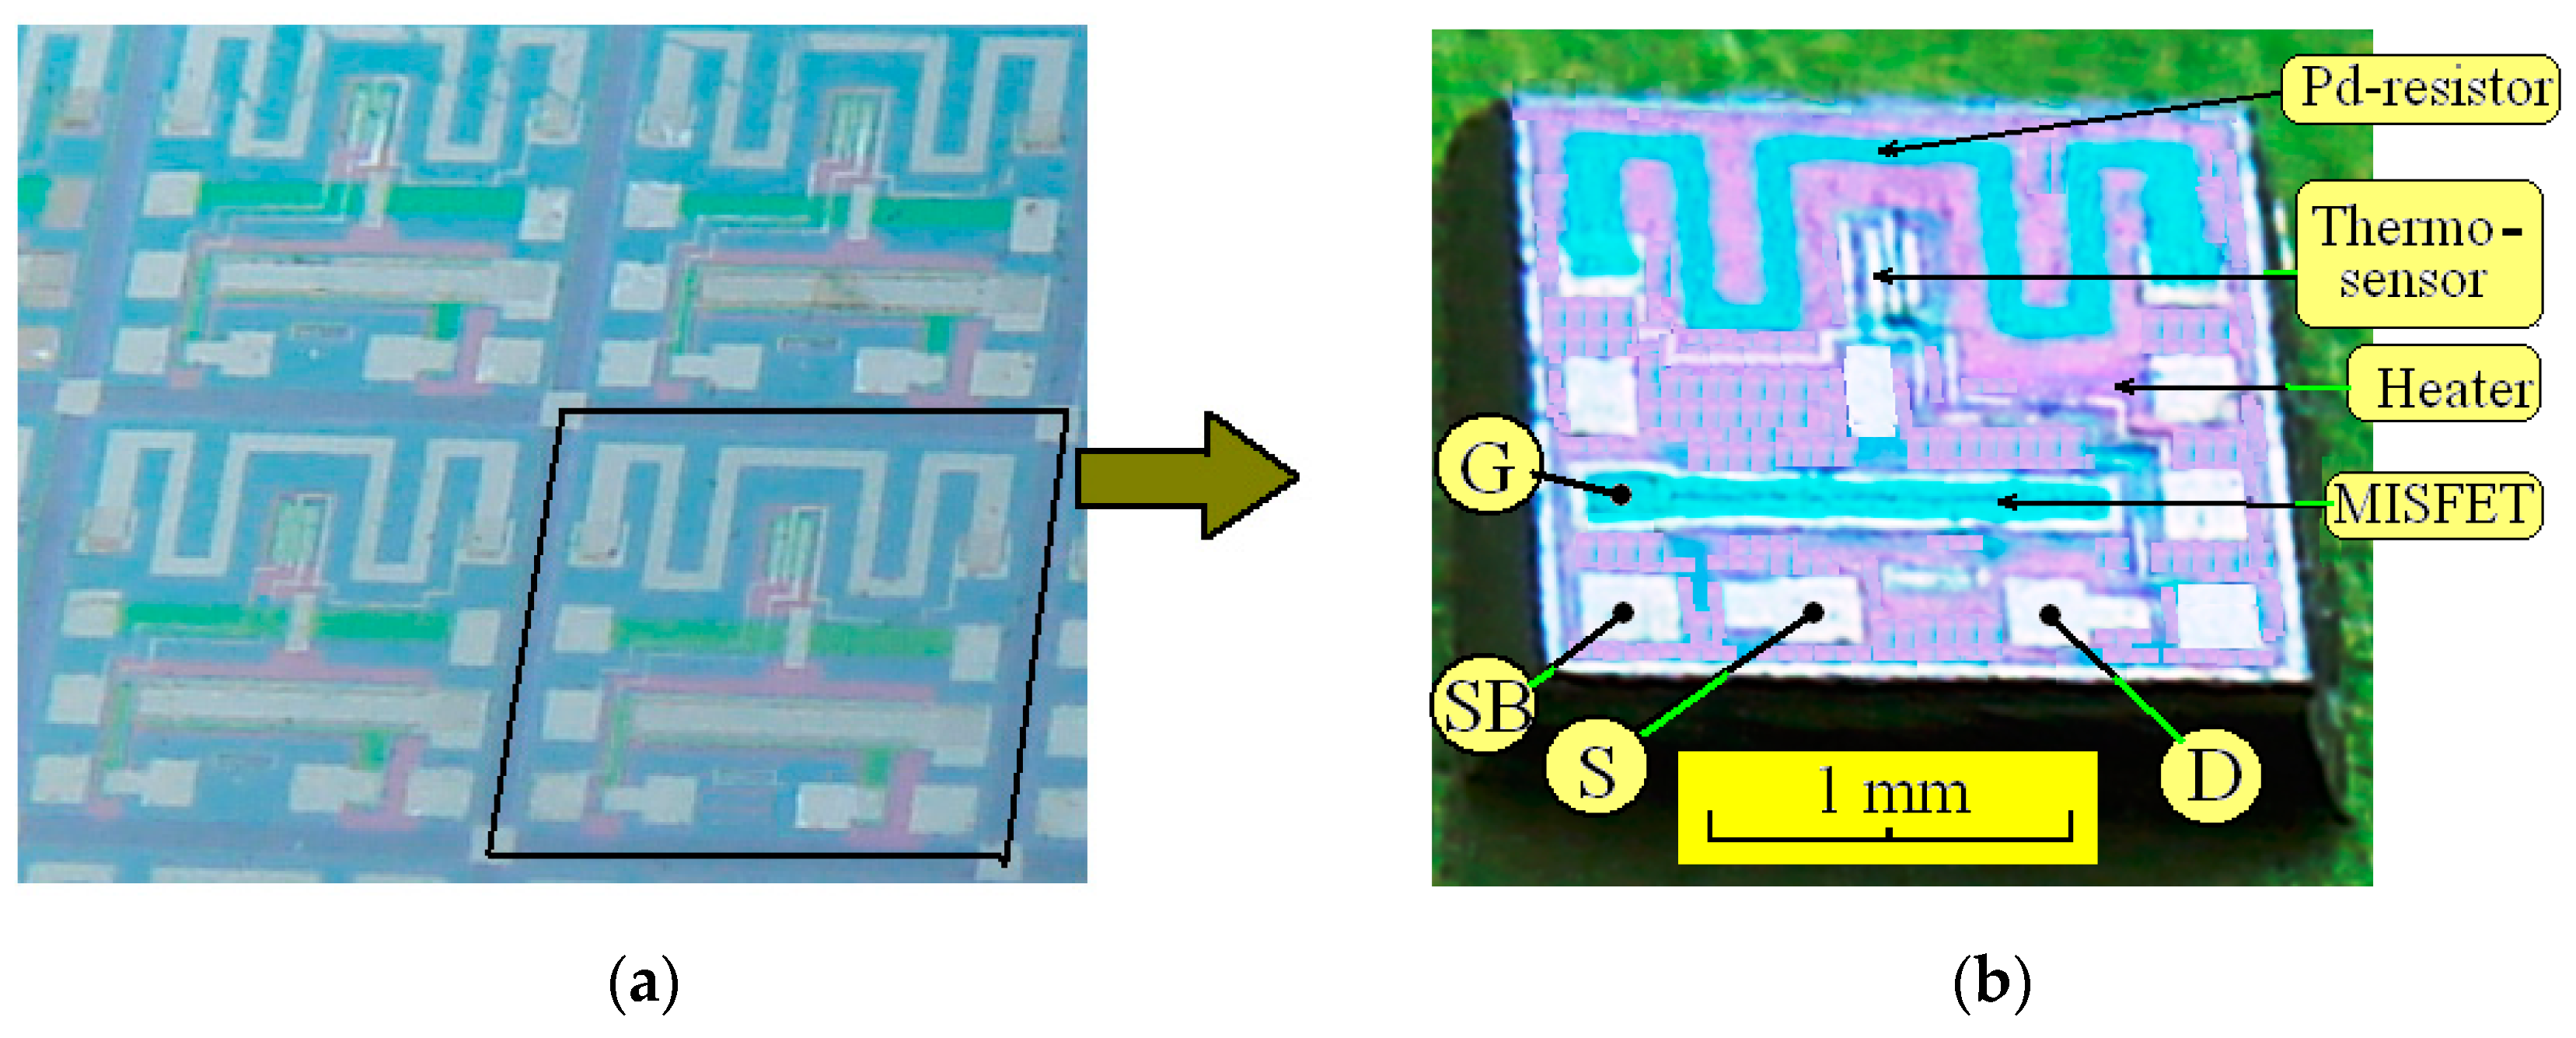
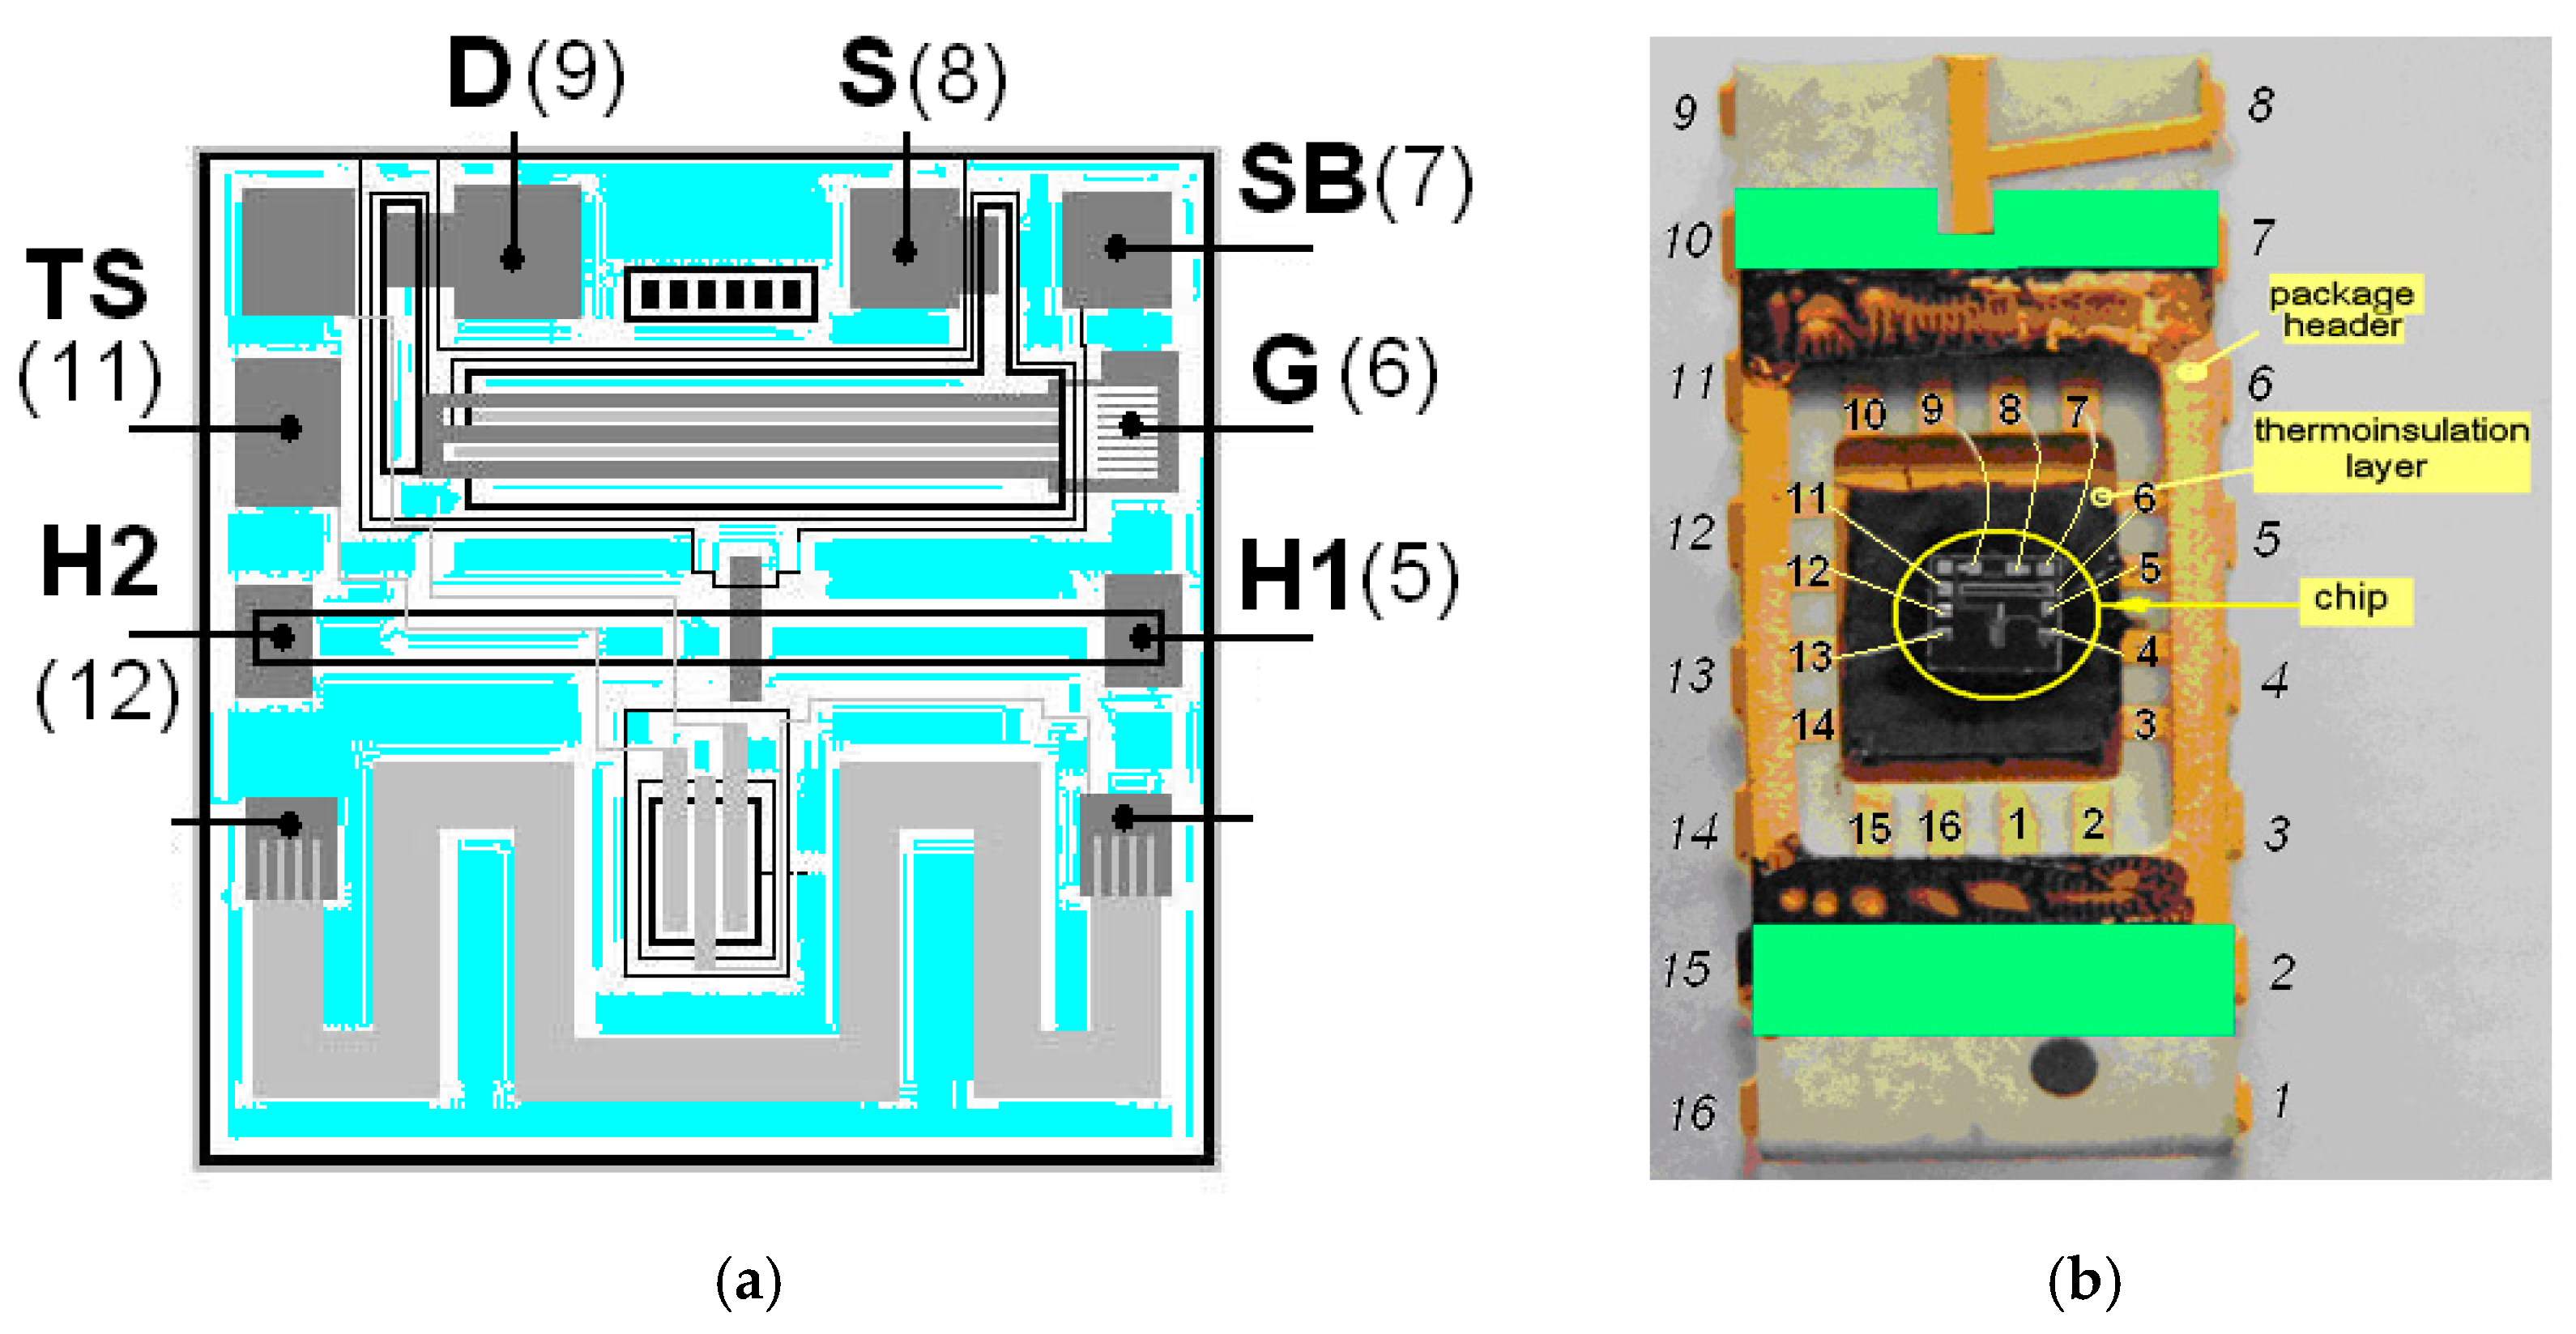
The testing n-channel MISFET element based on a Pd–Ta2O5–SiO2–Si structure was fabricated on a single chip (2 × 2 mm2) together with a (p–n)-junction temperature sensor and heater-resistor by means of conventional n-MOS-technology using laser evaporation Pd-films. Technological processes are presented in detail in [11,17]. Photos of the fragment of the silicon wafer undivided into chips and the separate chip are shown in Figure 1. The structure of the sensor chip and its position in the package is presented in Figure 2. The source p–n-junction of the Al-gate MISFET was used as the temperature sensor element. The resistor heating element was used to maintain the operating chip temperature. In this paper, the Pd-resistor was not investigated because it was previously shown that it has worse characteristics than MISFET.
To measure the hydrogen concentration by MISFET, the transistor is embedded in the device’s measuring circuits (signal conditioning circuits). Typically, gas-sensitive MISFETs are applied in analogue signal conditioning circuits. The informative parameter of the volt-metric analogue circuits is the output voltage, V. The informative parameter of the MISFET is threshold voltage, VT. There are three basic electrical modes for those circuits [19]: (1) the measurand V is drain bias VD vs. drain current ID (VT) at the constant gate bias VG; (2) the measurand V is VG vs. VT at the constant ID and VD; 3) the measurand V is VD vs. VT at the constant ID and VG.
The general hydrogen sensitivity can be presented as S = |dV/dC| being equal to |SC × ST|, where the circuit’s sensitivity SC is |dV/dVT|, and ST = dVT/dC is threshold voltage’s hydrogen sensitivity of the MISFET. The third type of electrical mode can be realized only if value VD is less than (VG − VT); herewith the circuit sensitivity SC is always less than 0.3, while for the first and second modes, sensitivities SC ≥ 1.0. Besides, to realize the third type of mode, we need to use the high stability current source, complicating the circuit. That is why in practice, we use either the first mode, when the parameters of the MISFET conversion function are already known, and we can set the optimal gate bias, or the second mode, when we need to investigate the characteristics of new types of MISFET sensors. Therefore, in this work, we used the second mode, in which the change ΔV is equal to the change of the threshold voltage ΔVT.
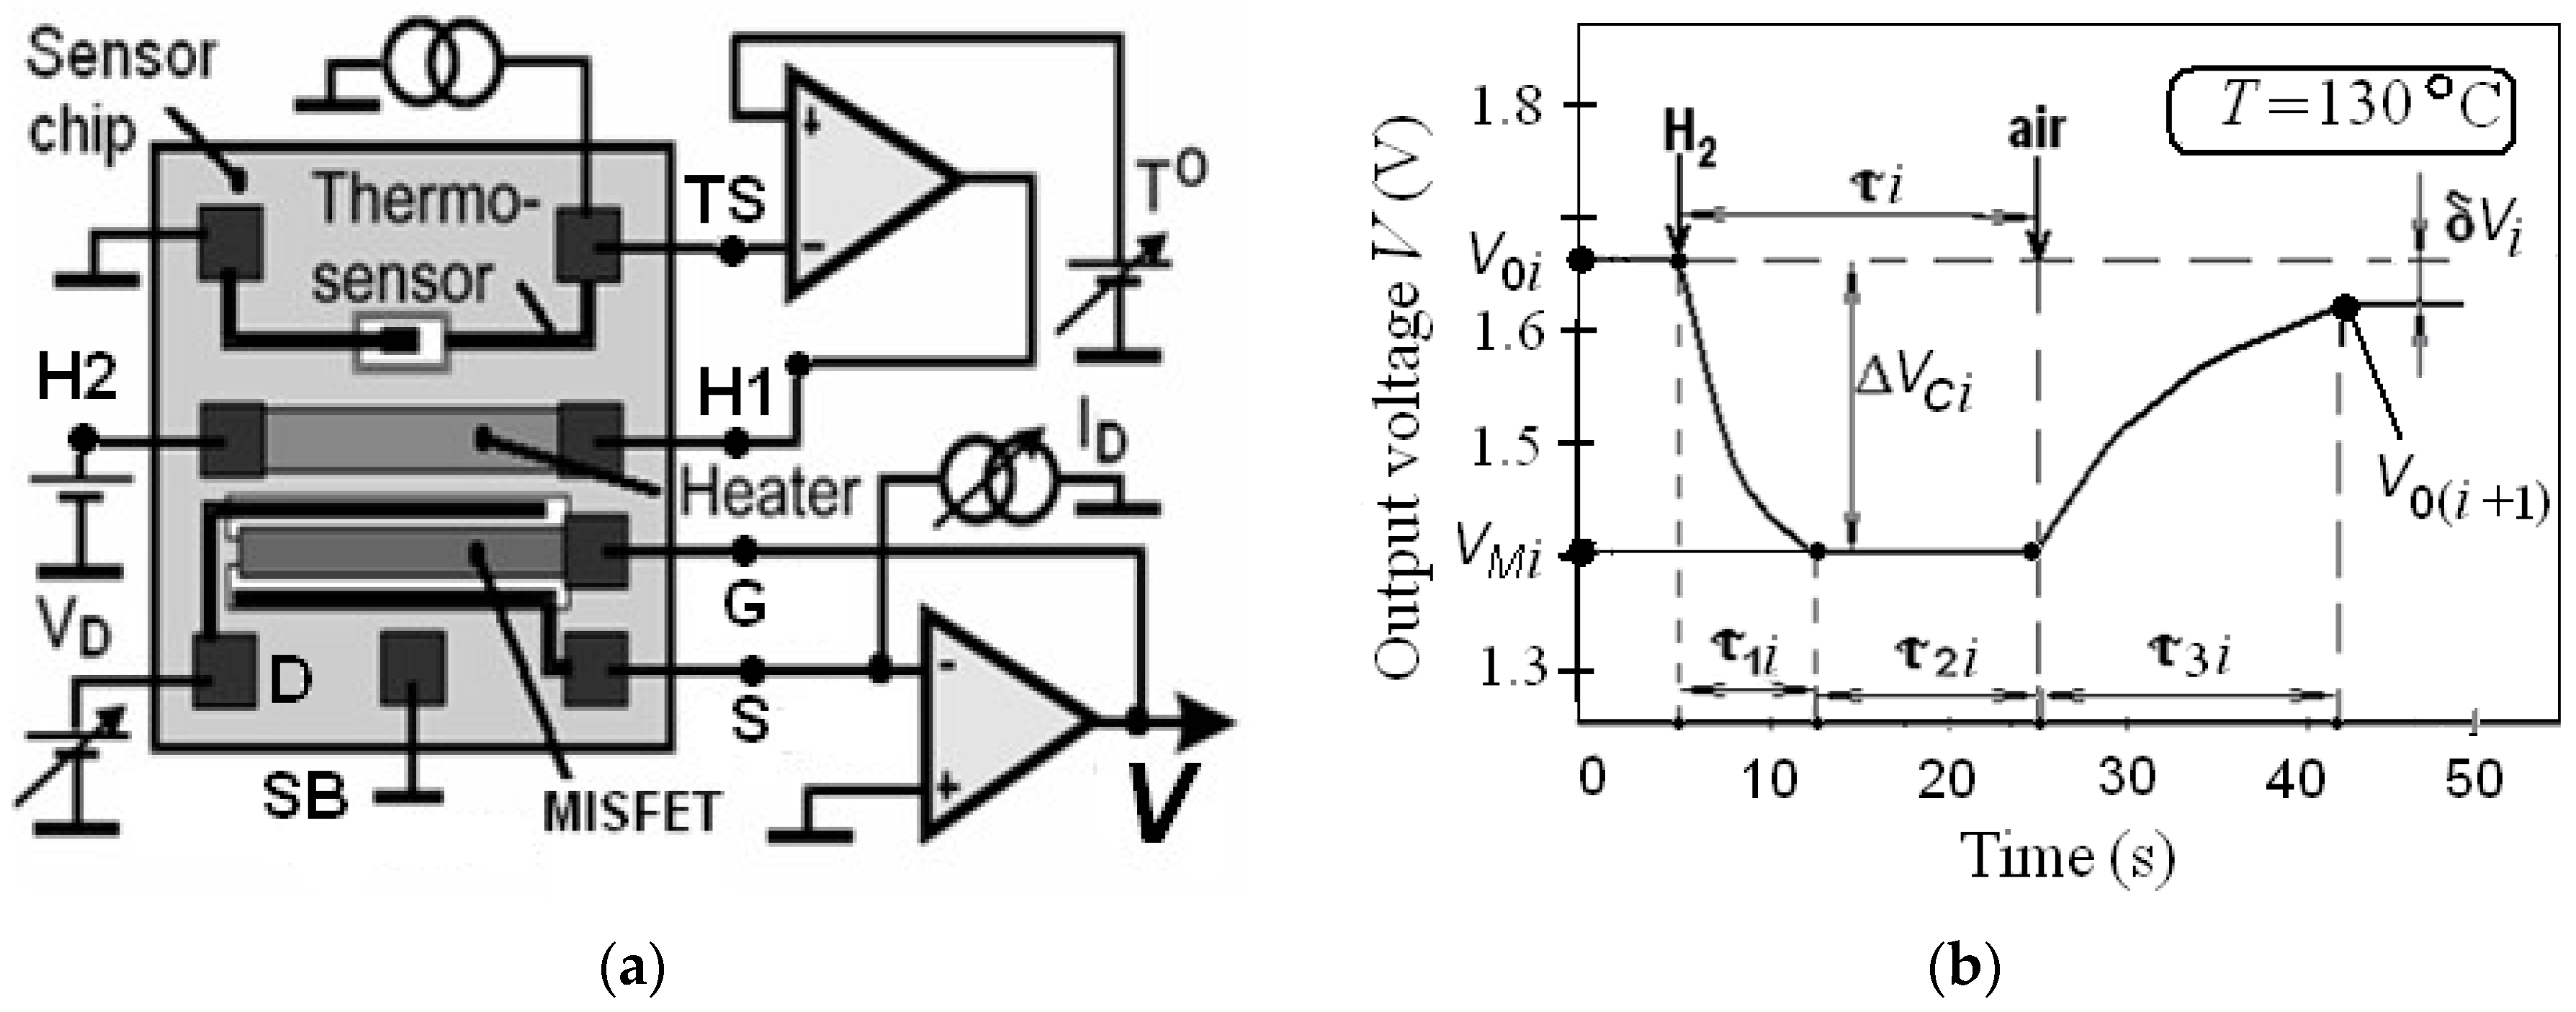
To measure the sensor’s hydrogen responses, we used the special circuitry shown in Figure 3a. The circuit provides the constant drain current ID = 0.1 mA and source-drain voltage VD = 0.2 V. In this circuitry, the voltage V is equal to the gate voltage VG. The constant chip temperature T being equal to 130 ± 2 °C was supported by the temperature stabilization circuitry with feedback loop using the on-chip thermo-sensor and heater [17]. The parameters of each i-response are demonstrated in Figure 3b. The initial data of the MISFET parameters and used models are presented in Table 1.
3. Results
3.1. Experimental Technique
After placing the chip into the sensor housing and connecting the pads to terminals, each sensor was inserted into the circuit. Then, at room temperature, the initial output voltage and response amplitude were measured by a short-term pulse of hydrogen at a concentration of about 1% vol. to estimate the hydrogen sensitivity of each sensor. Five samples with similar characteristics were selected for the experiments (dispersion is not more than 10%).
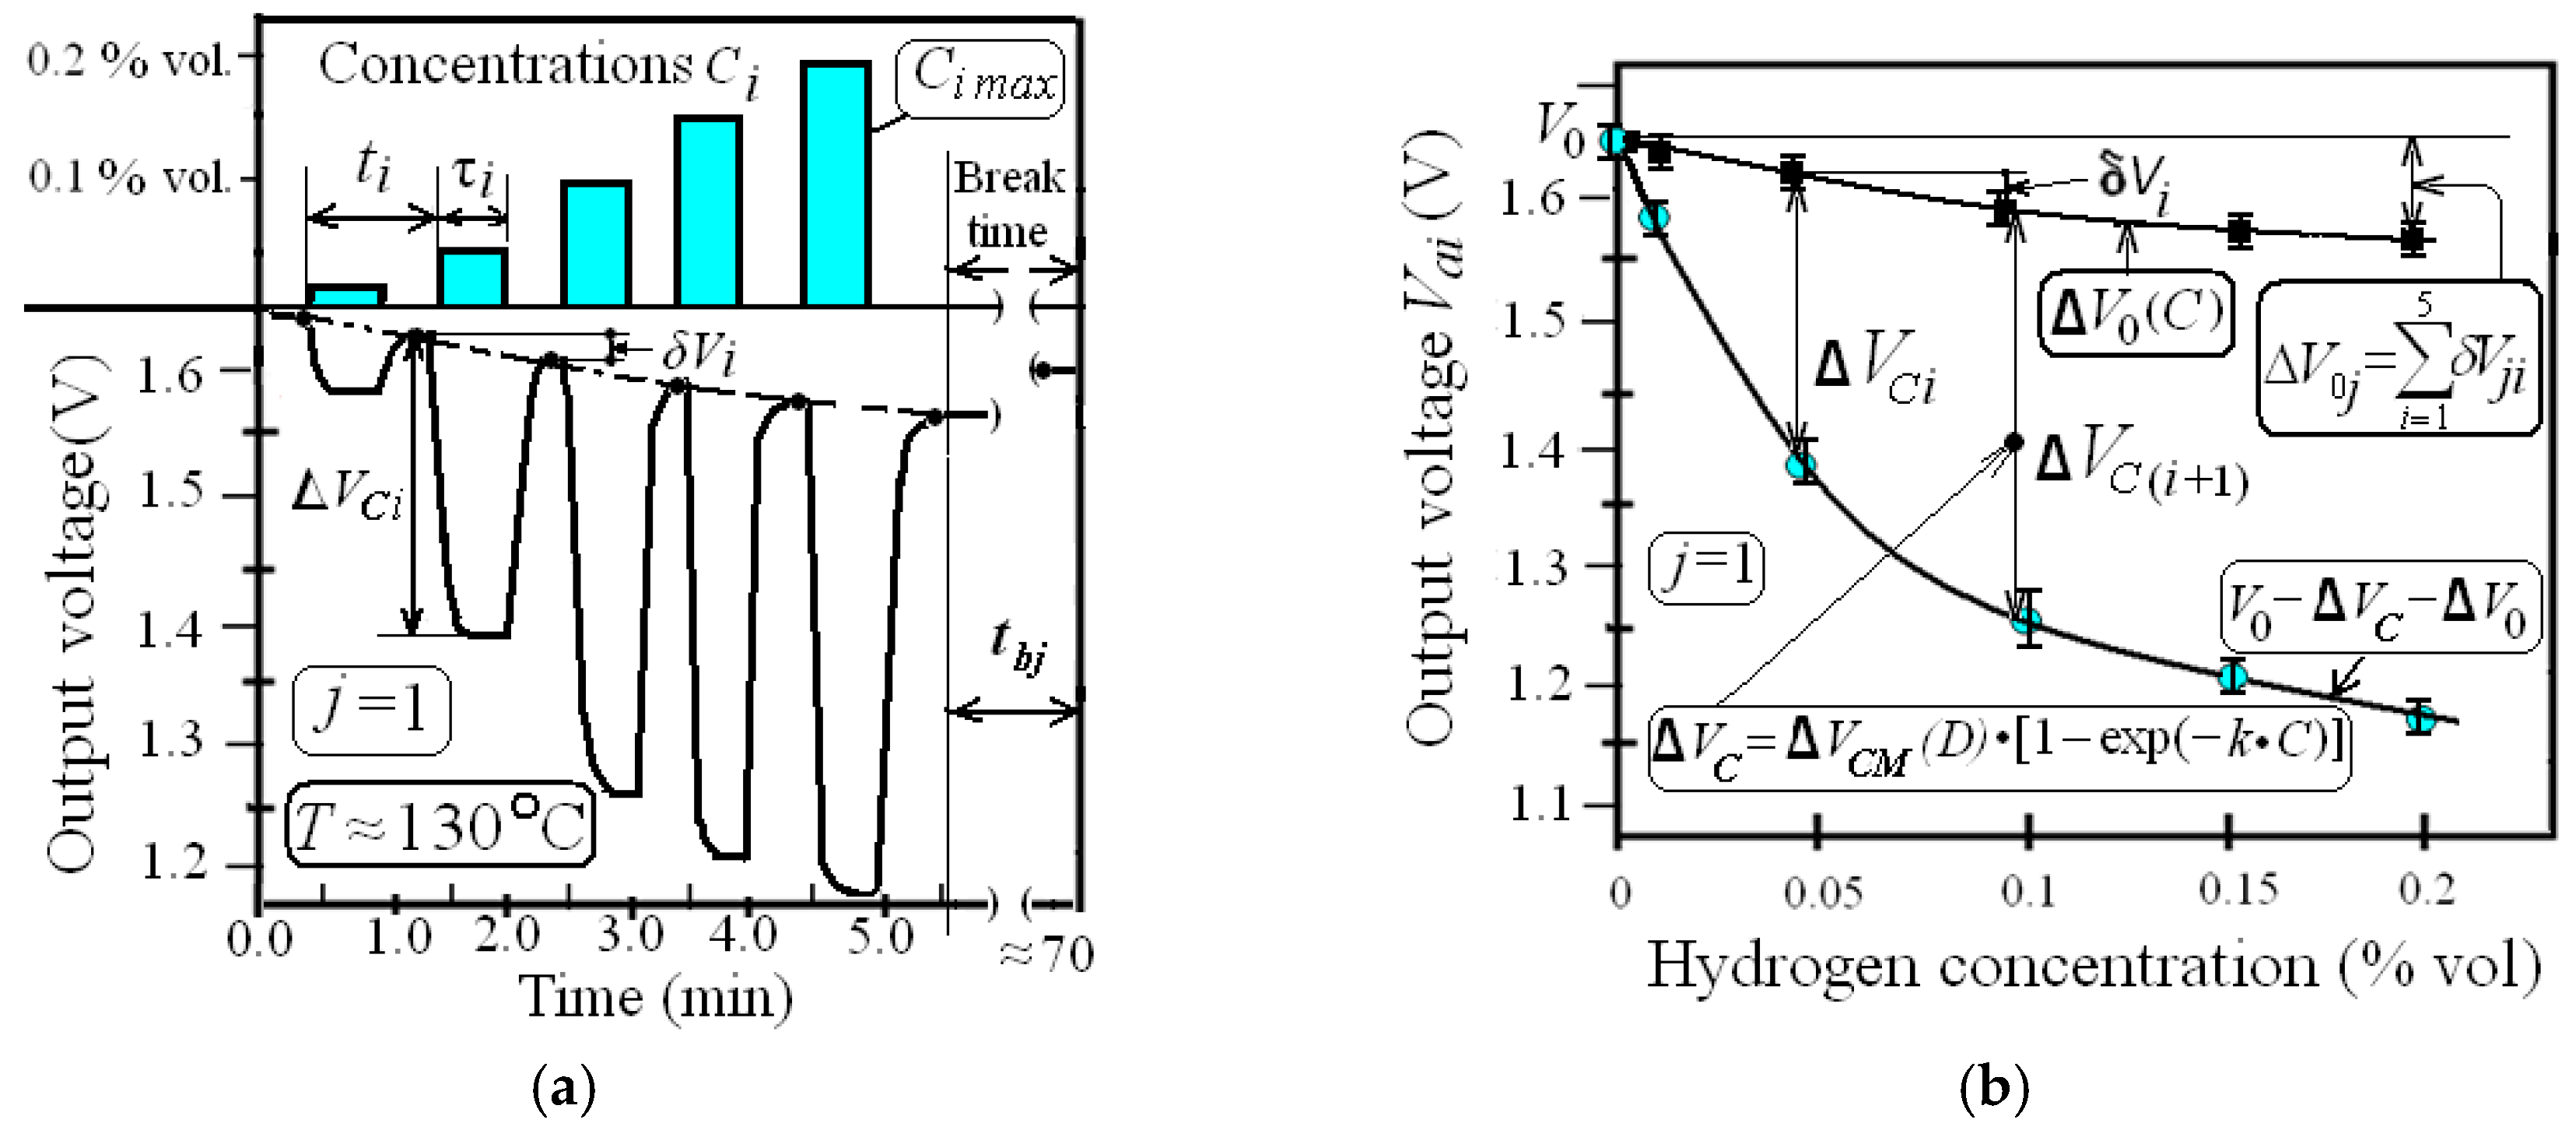
Then we tested sensors for eight weeks (five days a week in a row with two-day breaks) by exposure to five repeated hydrogen impacts (j-ordinary cycles) per day. In j-cycles, each sensor was consecutively exposed to five hydrogen pulses of different concentrations Ci during τi(about 30 s) with period ti about 1 min and a break time tbj of about 60 min (Figure 4a). The indices i, j, k and l are serial numbers: of responses, of ordinary, day and week cycles, respectively. We measured the parameters of each i-response of 200j-ordinary cycles at hydrogen concentrations of 0.02% vol, 0.05% vol, 0.1% vol, 0.15% vol and 0.2% vol.
Note that each experimental j-cycle contains information about the amplitude and time parameters of the ordinary i-responses, and also gives the opportunity to calculate the parameters of the conversion function ΔVC (C) and the drift of the initial values of the output voltage ΔV0 (C), so-called “zero-line drift” (ZLD) (Figure 4b). The average values of output voltages Vai(Ci)and dispersion variation indices ρVi were calculated as:
where indices n and N are respectively serial numbers and quantity of sensors.
Response parameters and their designations are presented in Table 2.
To collect the experimental data, an automated measuring system was used, which measured the voltage V(t) every second and stored the data in the computer’s memory. The absolute measurement error was 1 mV. The interface board was connected to the data acquisition unit and computer. The hardware and software of the measurement system allows for setting the time steps and range of voltages V before each experimental cycle. It is also possible to store experimental data in the form of tables or graphs that can be displayed.
Hydrogen responses were measured approximately five minutes after the sensor was placed in the test chamber and the measurement system was put into operation. The portions of pure hydrogen corresponding to its specified concentrations were injected through a rubber insert in the test chamber lid with a medical syringe. The time of the hydrogen injections did not exceed one second.
3.2. Experimental Results
The average values of initial voltage V0i, residual values δVi, response amplitudes ΔVCi, summary values δVi (designated as ΔV0) at different hydrogen concentrations for the first j-cycle are demonstrated in Figure 4b. The dependences ΔV0(C) and output voltage V(C) are represented by the approximation curves. The same figure shows the analytic models of dependences V(C) and ΔVC(C). The average values of parameters of response amplitudes ΔVCi and sensitivities Si at different Ci for first and fiftieth j-cycles are presented in Table A1.
The main characteristic that determines the hydrogen sensitivity of the sensor is the conversion function ΔVC(C), the parameters of which are values of ΔVCM, k, Si and Sd (Table 2). The speed of the sensor is determined by the time response parameters τ1i and τ3i (Figure 3b). The repeatability of response parameters (sensor stability) is determined by the parameters ΔV0S (summary ZLD in Table 2). We have just investigated the changes of these parameters for the long-term operation of MISFETs. Knowing the changes of the parameter Y from time t, it is possible to estimate the rate vY and degree of degradation δY:
where t and Y0 are time and primary value of the parameter Y, respectively. If the Y parameter depends on the total hydrogen dose D = ∫C(t)dt, the value t should be replaced by D. The average values of the responses and the model parameters of conversion function ΔVC(C) for lkj-cycles, as well as rates and degree of degradation are demonstrated in Table A2.
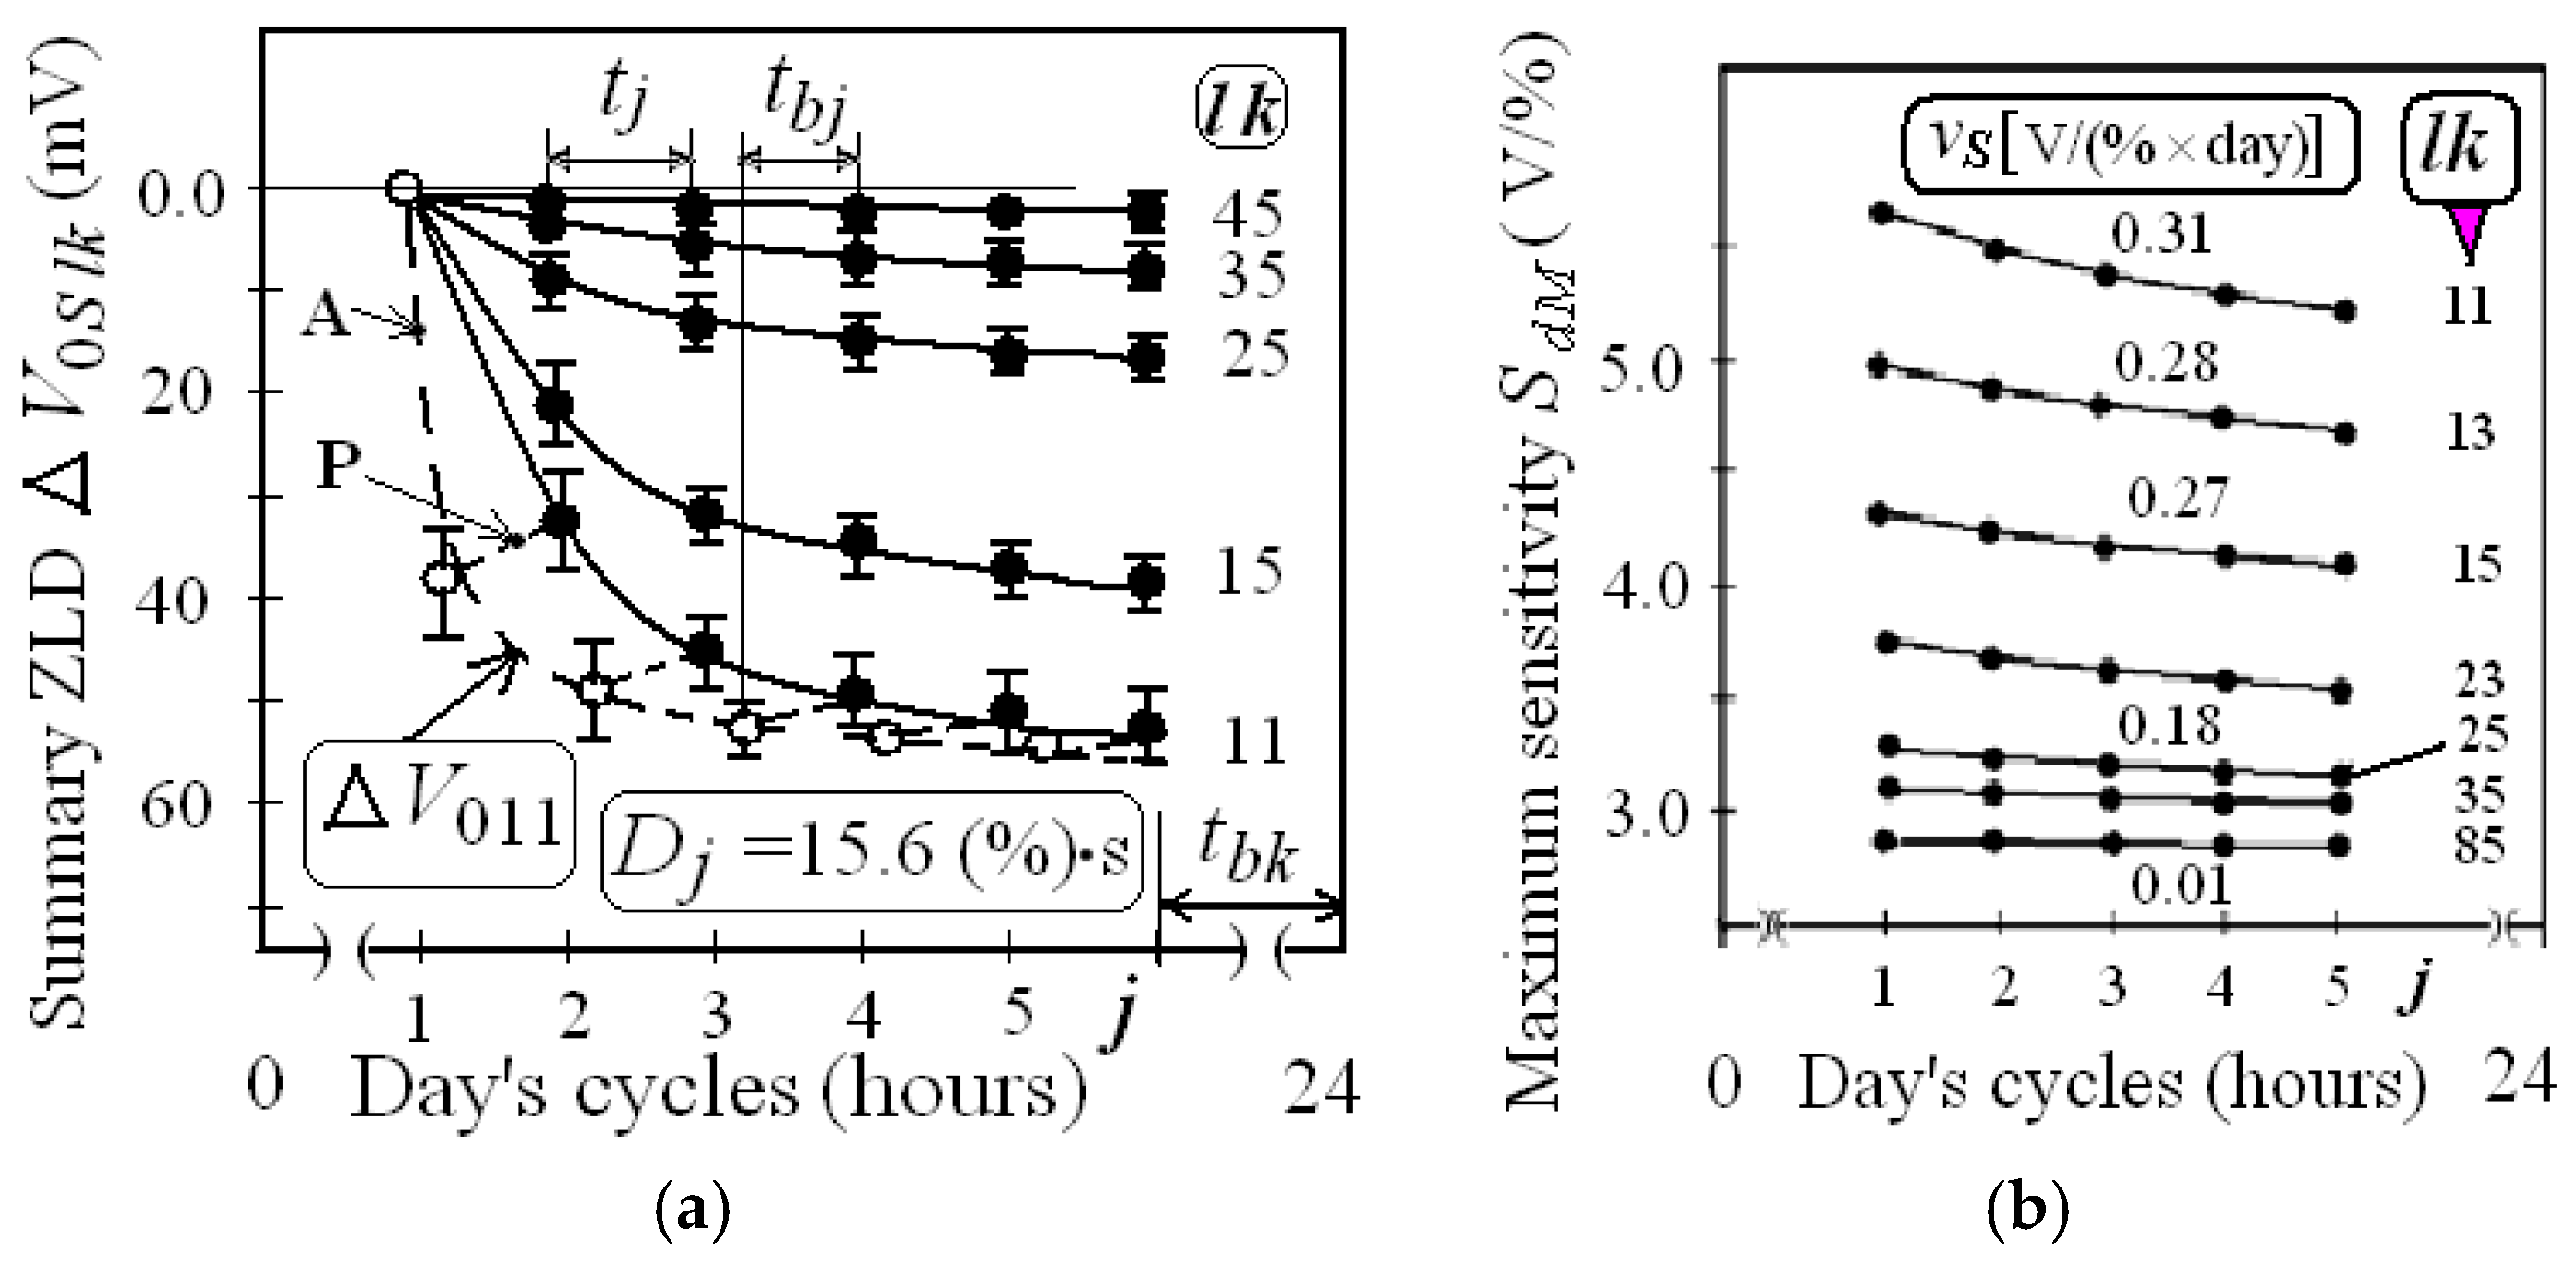
Note that in each j-cycle, hydrogen sensitivity is determined by the integral sensitivity Si and differential Sd, the values of which are at the maximum at low concentrations and decrease with increasing concentration Ci. The changes of summary ZLD and of maximum sensitivities SdM during lk-cycles on different days are presented in Figure 5a,b.
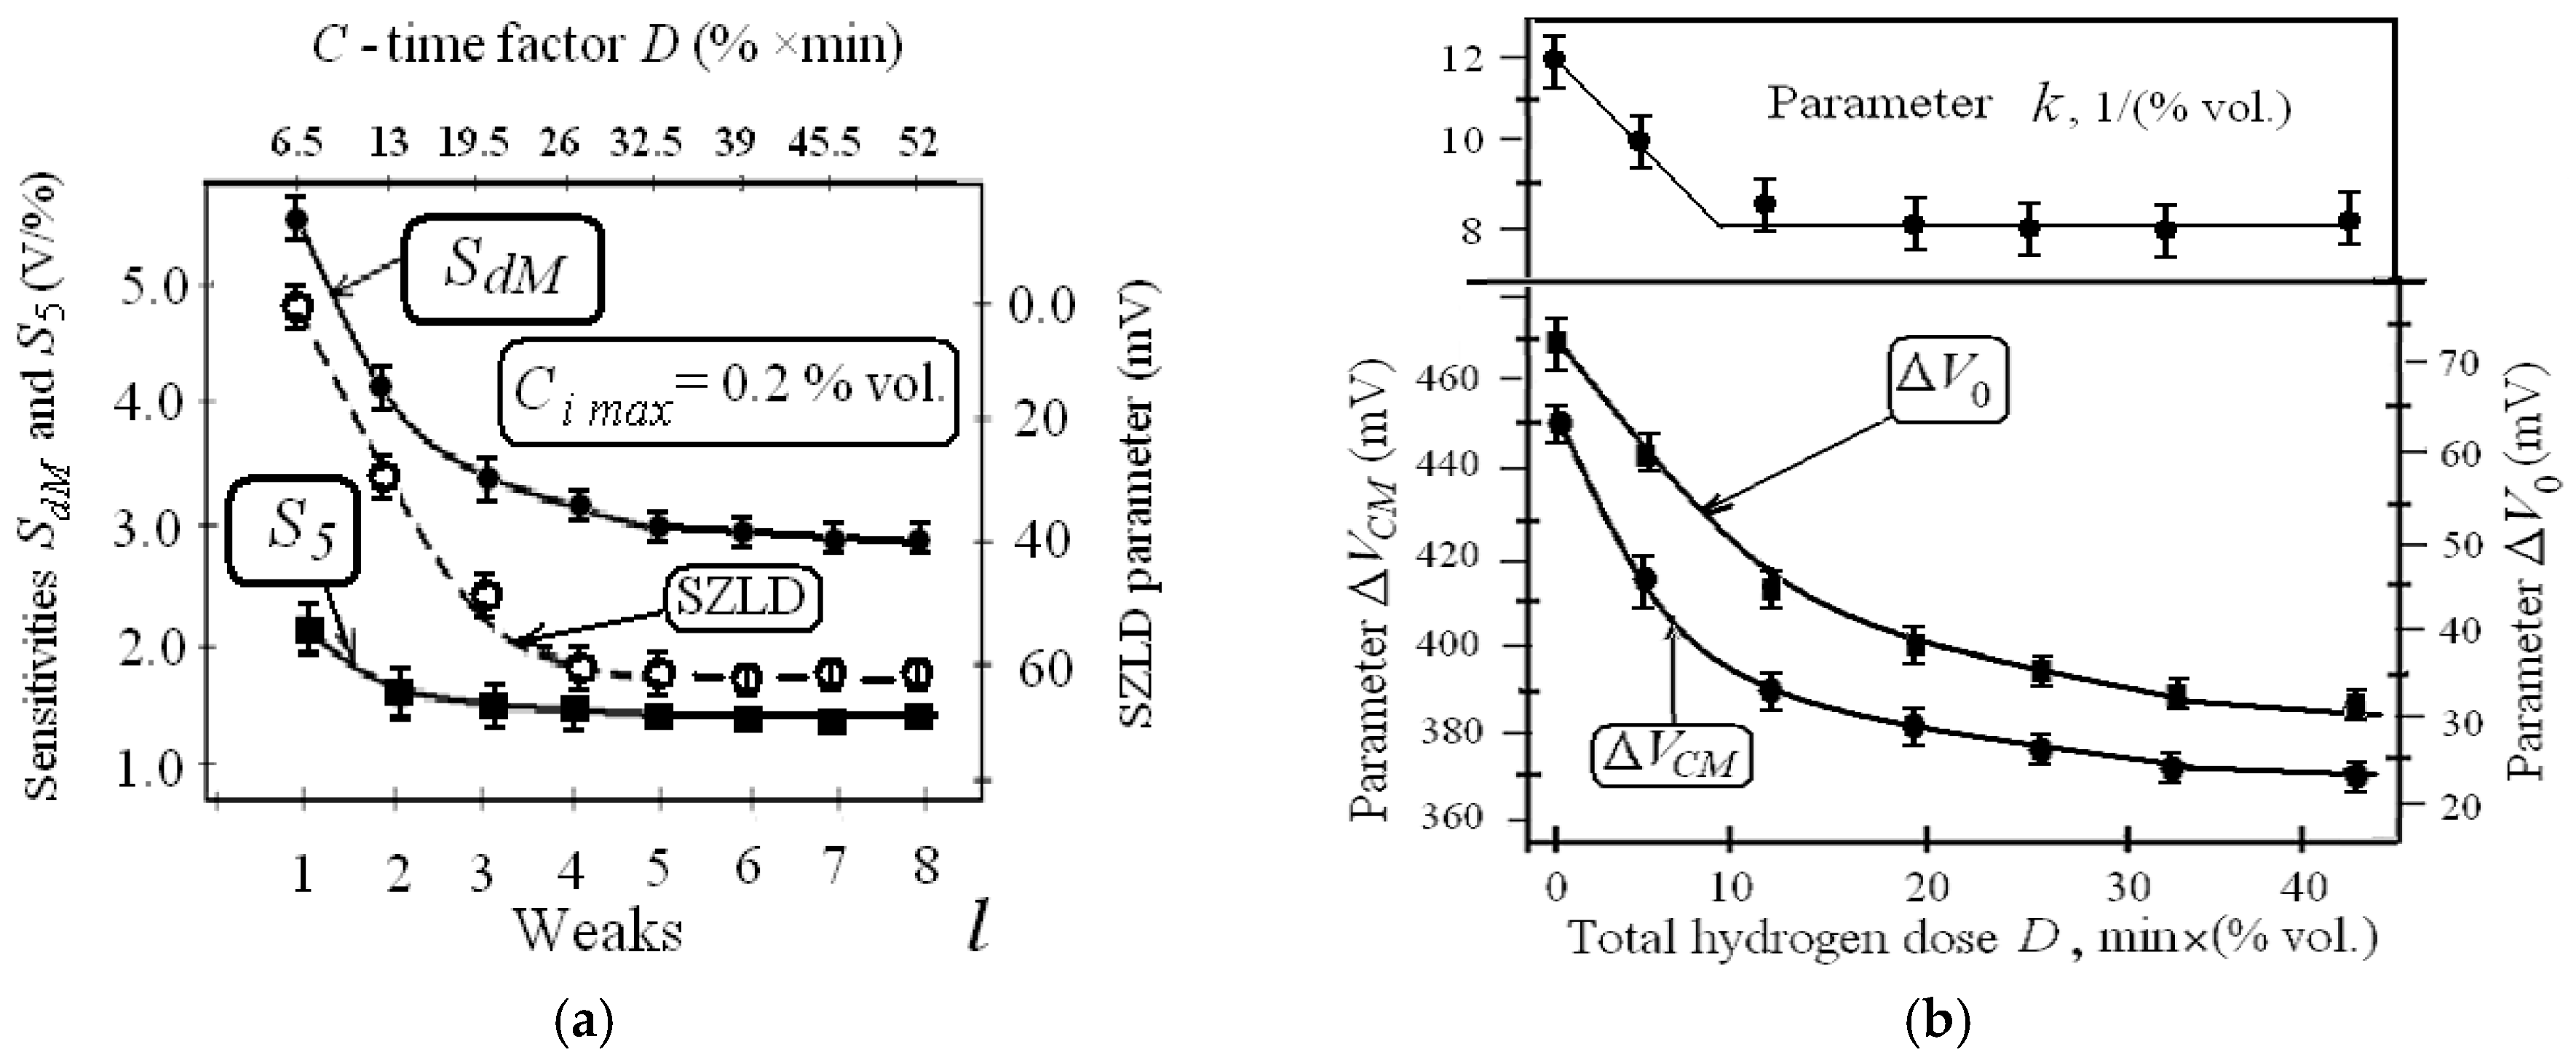
The changes of SZLD, sensitivities SdM and S5, parameters ΔVCM and ΔV0 during the eight week cycles are presented in Figure 6a,b.
The analysis of the experimental data (Figure 5 and Figure 6, Table A2) allows us to draw the following conclusions:
- All parameters of hydrogen responses change as a result of long-term periodic impacts of hydrogen pulses of different concentrations.
- Immediately after the turning sensors in the operating mode values of output voltage V decrease monotonically, reaching a saturation value V0 being equal to (V00 − ΔV0tM) after 3–4 min. The average value of ΔV0tM was equal to about 40 mV. Each hydrogen exposition j-cycle started five minutes after the turning sensors in the operating modes (ID = 0.1 mA, VD = 0.2 V and T = 130 °C). The value of ΔV0tM changed in the next j-cycles within ±5 mV. Such drift of the zero line in time did not depend on the previous hydrogen exposures. The initial values of V0 of the first responses were equal to about 1.66 V.
- The changes of initial response voltage of each i-response V0i determined by the parameter δV0i decreases with increasing concentration Ci in each j-cycle. Then, during the 60 min break time, value V0 increases by about half of its total change ΔV0j after hydrogen injections in each j-cycle (Figure 4). The relative changes parameter δVi being equal to (100% × δV0i/ΔVCi) decreased with increasing Ci within the j-cycle. Average values of δVi vary in the first j-cycle from 25% to 5%, and in the fiftieth j-cycle from 15% to 3%.
- These changes of voltage V0i were called “zero-line drift” (ZLD). The parameters ΔV0S (summary ZLD) have positive signs and after repeated actions of hydrogen within four weeks, they are reduced from 50 mV to values less than 5 mV (Figure 5a).
- The amplitude parameters of the responses ΔVCi and maximum amplitude ΔVCM decrease by 20–40%. The hydrogen sensitivities Si and Sdj reduced when hydrogen exposition time tC and dose D increase (Table A2).
- Maximum changes of response parameters (approximately 80%) are manifested in the first stages of hydrogen expositions at C-time factor D less than 25% vol. × min (see Figure 6).
- The time parameters of responses decrease slightly by 1–2 s (Table A2).
4. Modeling and Discussion
The following model of voltage V (C,t,tC) was used to interpret the experimental results:
V (C,t,tC) = V0 (D,t) − ΔVC(D,C), V0 (D,t) = V00 − ΔV0t(t) − ΔV0S(D);
ΔV0t(t) = ΔV0tM · [1 − exp(−t/τ0)] = 0.04 · [1 − exp(−t/70)] V, [t] is second;
ΔV0 (D) = ΔV0S(D) = ΔV0SM · [1 − exp(−D/D0)] = 0.03 + 0.045 · [exp(−D/15)] V; [D] is (% vol.) × min;
ΔVC (D,C) = ΔVCM (D) · {1 − exp[− k(D) × C)], VCM = 0.37 + 0.08 · [exp(−D/9)]V;
k = (12 − 0.4 · D) 1/(% vol.) at D < 12 (% vol.) × min, k = 8.0 (1/(% vol.)) at D ≥ 12 (% vol.) × min.
The value V00 is a primary voltage of about 1.7 V (at T ≈ 130 °C). Formulas (3)–(5) are respectively a general view of the model and the values of the components of the model in general and numerical forms. The values of model parameters ΔV0tM, τ0, ΔV0SM, D0, ΔVCM and k were determined as parameters of the approximating function of the form ΔY(x) = ΔYM · (1 − exp(−νx)) using experimental data. The parameter ΔYM was determined by the maximum value of Y by extrapolating the dependence ΔY(x) at large x, and the parameter ν was calculated as:
where values of x are t, D or C; values of ΔYM are ΔV0tM, ΔV0SM or C; values of ν are (1/τ0) or (1/D0) or k, respectively.
ν = ln {ΔYM/[ΔYM − Y(x)]}/x,
The first component V0 (D, t) of model (3) determines the initial value of voltage V. In the measuring circuit (Figure 3a), the voltage V is equal to the gate voltage VG, which depends on the technological and physical parameters of the MISFET specified in Table 1:
where φs is the surface potential, which depends on the drain current ID; Qte and Qss are values of effective charge densities in the dielectric and at the interface SiO2–Si. According to (4):
where Qte0 and Qss0 are initial values of effective charge densities in the dielectric and at the interface SiO2–Si.
V = VG = φms + φs + a{φs + φTexp[(φs − 2φs0)/φT]}0.5 − [Qte + Qss]/C0,
V0 (D,t) = V00 − ΔV0t(t) − ΔV0S(D),
V00 = φms0 + φs + a{φs + φTexp[(φs − 2φs0)/φT]}0.5 − [Qte0 + Qss0 (φs,φs0)]/C0 ≈ 1.7 V
According to Model (7), the initial transition process ΔV0t (t) after switching the transistor to the operating mode can be explained by the inertia of the chip heating and by the recharge time of the charges Qte and Qss. In previous works [11,17] it is shown that the value of ΔV0t (t) depends on the operating temperature and electrical mode of the MISFET. The dependence of ΔV0t on the current ID is due to the dependence of the surface potential φs(ID) on the current, and the temperature dependence ΔV0t is determined by the temperature dependence of the parameters φT(T) and φs0(T) (Table 1). The maximum variation of ΔV0t (t) can range from ±10 mV to ±50 mV, and the value of ΔV0tM is achieved in 2–4 min. The initial time drift of ΔV0t(t) is the first type of ZLD.
The second type of ZLD is the change of ΔV0S(D) according to Model (4) associated with the total hydrogen dose D being equal to ∫C(t)dt, which occurs due to operation of the sensor in a hydrogen environment. Each j-cycle has two stages: active (during hydrogen injections; about five minutes) and passive (during break time tbj ≈ 60 min). In active stage of the j-cycle, residual values δVi decrease and ZLD parameter ΔV0 increases with increasing Ci, reaching the value ΔV0j (Figure 4b). Summary ZLD (ΔV0Slkj) increases during the day’s cycles; herewith, the rate of increasing vSZLD being equal to d(ΔV0S)/dtC decreases if hydrogen exposition time tC and hydrogen dose D are rising (Figure 5a). During the passive stages of each j-cycle, the values of SZLD decrease, and initial voltage becomes equal to V0 (j+1). After the fourth week (total number of j-cycles exceeds 100), the SZLD reaches its maximum value ΔV0SM and remains virtually unchanged. According to (4), the parameters of component ΔV0S are ΔV0SM ≈ 45 mV and D0 ≈ 15% vol. × min.
The observed changes of the initial response voltages V0i and the phenomenon of ZLD change saturation can be explained by the presence of reversible and irreversible effects in the MIS structure under the hydrogen impacts (in particular, the irreversible formation of stable compounds Pd–H, Pd–O, mechanical stresses and Pd swelling).
Note that the values of ΔV0t(t) and ΔV0S (D) determine the additive errors of “zero” (basic line drift) which do not affect the hydrogen sensitivity and can be compensated for by calibrating the sensor prior to each measurement of the hydrogen concentration.
The second component ΔVC (D,C) of Model (3) can be presented as:
where the values of Δφms and ΔQhe0 arethe changes of the Pd–Si work function difference potential φms and of effective charge densities Qhe0 at the Pd–Ta2 O5 interface and in the Ta2 O5 under the action of hydrogen. The component ΔVC (D,C) determines the hydrogen sensitivities Si and Sd:
where maximum differential sensitivity SdM = k(D) × ΔVCM(D). The dependencies S5(D) and SdM(D) are shown in Figure 6.
ΔVC (D,C) = Δφms (D) − ΔQhe(D)/C0,
Si = ΔVCM (Ci,D) · [1 − exp(−k × Ci)]/Ci and Sd = SdM · exp(−k × C),
Detailed studies [3,4,6,7,8,11,12,15] have demonstrated that the MISFET hydrogen sensitivity depends on several effects which occur in regions of the gas–metal–dielectric structure. Firstly, the hydrogen molecules adsorb on the surface of Pd films and then dissociate into atoms. This dissociation occurs in competition with the adsorption of other ambient molecules, in particular O2. In addition to this process, the chemical reactions occur at the (hydrogen + air)–Pd interface (e.g., forming PdO). There is a back reaction between adsorbed hydrogen atoms and adsorbed oxygen atoms, resulting in the formation of water molecules that desorb from Pd at operational temperatures. The hydrogen atom concentration in Pd is proportional to the concentration of adsorbed hydrogen molecules on the surface of Pd and the hydrogen concentration in air. In turn, the concentration of adsorbed hydrogen molecules depends on Pd temperature and the concentrations of other molecules.
Secondly, there is the diffusion of hydrogen atoms through the Pd film to the interface Pd–Ta2O5, forming a polarized dipole layer of hydrogen atoms. Some hydrogen atoms form the compound Pd–H. The third effect is diffusion and drift of protons in Ta2O5. All this leads to a change in the effective charge ΔQhe in Model (9). The equilibrium between the hydrogen concentration at the Pd surface and the hydrogen concentration at the Pd–insulator interface is reached in a few seconds. Besides, there are changes in the palladium structure under the influence of hydrogen and oxygen (formation of Pd–H, Pd–O, mechanical stresses and swelling). So, the density and electrical conductivity of Pd may be changed, as well as the electron work function of Pd, which leads to a change of the parameter Δφms in Model (9). Thus, the hydrogen sensitivity of MIS devices depends on many factors. Simultaneously taking into account all these factors is very difficult or not possible at all.
The parameters ΔVCM, k, SdM and Si decrease if total hydrogen dose D is rising; herewith, the degradation rates vY for the all parameters decrease (Figure 5a and Figure 6, Table A1, Table A2). Such changes can also be explained by the existence of irreversible effects in the (hydrogen + air)–Pd–Ta2O5 structure that tends to saturation.
It was found that the time parameters of responses depend on hydrogen concentrations; if hydrogen concentration increases, the response times τ1 and τ3 decrease. For τ1, this effect can be explained by increasing the diffusion rate of hydrogen atoms moving from the palladium surface to the Pd–Ta2O5 interface, where the polarized dipole layer is formed. The diffusion rate increases due to an increase in the concentration gradient of hydrogen atoms in Pd being proportional to the concentration of adsorbed H2 molecules on the palladium surface, which is proportional to C. The relaxation time τ3 is partly determined by the reverse diffusion of hydrogen atoms through the Pd film to the Pd–air interface, the diffusion rate of which is proportional to the concentration of hydrogen atoms in Pd, and accordingly to the concentration of hydrogen molecules C in air. As a result of long-term cyclic hydrogen impacts, the time parameters of the responses decrease slightly (by 1–2 s) (Table A2).
It should be noted that the stability and reproducibility requirements of the sensors depend on their application. If the gas sensor is used to detect the presence of gas in the environment, the effects of ZLD and the reduction of hydrogen sensitivity do not affect its operation. In this case, it is enough that the sensor has palpable hydrogen sensitivity. In devices for short-term measurements of gas concentrations, degradation of the amplitude parameters of the responses should be taken into account. Therefore, such devices need to be calibrated before each measurement. This applies to devices used for assessing the degree of fire in mines, one-time measurements of gas concentrations in the environment and medical diagnosis. In devices for long-term measurements of gas concentrations in the environment, it is also necessary to take into account degradation processes. Therefore, after the first calibration, you must periodically calibrate the device or replace the sensors. Such modes of operation relate to fire hazard detectors and devices for environmental monitoring.
Presented in the general and numerical form, the above models can be used to predict the degradation characteristics of sensors based other types of electrical circuits, including circuits with several MISFET sensing elements. In electrical models of other circuits, the informative parameter can be the threshold voltage of the transistor VT, which for the MISFET studied in this paper, is associated with the output voltage V as VT = (V − 0.35) V. Devices based on other circuits may have a higher sensitivity and linearity of the conversion function. However, the degree and rate of degradation of metrological characteristics are determined only by the degradation parameters of MISFET.
5. Conclusions
This paper generalized experimental data on research of response parameter changes of MISFET-based sensors on Pd–Ta2O5–SiO2–Si structures undergoing long-term operation, and the proposed models in general and numerical form take into account performance degradations. The analysis of the experimental data allows us to draw the following conclusions.
All parameters of the hydrogen response change as a result of long-term periodic impacts of hydrogen pulses of different concentrations. Three amplitude and two time response parameters were measured. The changes of initial response voltage of each response V0i decreases with increasing concentration Ci in each hydrogen impact cycle. The hydrogen sensitivity was determined by the conversion function ΔVC(C) based on the approximation of the averaged experimental data ΔVC(Ci). Changes in response parameters were considered depending on the total hydrogen dose D being equal to ∫C(t)dt. When the hydrogen sensitivity is reduced, the hydrogen exposition time and dose D increase. As a result of the effects of 200 identical repetitive cycles with different hydrogen concentrations Ci, the amplitude parameters of the responses decrease by 20–40%.
All tested MISFET sensors undergoing long-term operation have degradation features: the reduction of hydrogen sensitivity and “zero-line drift” (ZLD), which depend on operating conditions and accumulated hydrogen dose D. The maximum change of response parameters (approximately 80%) are manifested in the first stages of hydrogen expositions at D less than 25% vol. × min. The time parameters of responses decrease slightly by 1–2 s. Herewith, the degradation rate of the response parameters decreases with the growth of the total concentration dose D.
The observed changes of the response parameters and the phenomenon of ZLD change saturation were explained by the presence of reversible and irreversible effects in the (hydrogen + air)–Pd–Ta2O5 structure under hydrogen impacts (in particular, the irreversible formation of stable compounds Pd–H, Pd–O, mechanical stresses and Pd swelling). These effects for practical applications of hydrogen sensors were taken into account as the additive errors of “zero” (basic line drift), which can be compensated for by calibrating the sensor prior to each measurement of the hydrogen concentration.
To interpret the experimental results, we proposed models in both general and numerical forms that also allowed for estimating the response parameter degradations effect on hydrogen sensitivity. The models were obtained on the basis of the averaging of experimental data and approximations of dependences of model components on time and hydrogen concentrations. The presented models can be used to predict the degradation characteristics of devices and sensors based on other types of electrical circuits, including circuits with several MISFET sensing elements.
The stability and reproducibility requirements of the sensors depend on their application. If the gas sensor is used to detect the presence of gas in the environment (e.g., to detect the location of hydrogen leakage in a hydrogen engine), the effects of ZLD and the reduction of hydrogen sensitivity do not affect its operation. In this case, it is enough that the sensor has palpable hydrogen sensitivity. In devices for short-term measurements of gas concentrations, degradation of the amplitude parameters of the responses should be taken into account. Therefore, such devices need to be calibrated before each measurement. These include devices for assessing the degree of fire in mines, one-time measurements of gas concentrations in the environment and medical diagnosis. In devices for long-term measurements of gas concentrations in the environment, it is also necessary to take into account degradation processes. Therefore, after the first calibration, we must periodically calibrate the device or replace the sensors. Such modes of operation relate to fire hazard detectors and devices for environmental monitoring.
It should be noted that the preparation of sensors, the experiments and the processing of the data took about a year. Despite the previous studies and the results of this work, the issues of the degree of degradation of sensor characteristics in continuous operation, as well as effect of aging, remain to be explored.
Author Contributions
Conceptualization, methodology, design of experiments and writing—original draft preparation, B.P. The experimental data processing, N.S. Fabrication and selection of sensors for experiments and response measurements, M.N. Experimental data processing, A.K.
Funding
This research was funded by the Russian Science Foundation (Grant Agreement 18-79-10230 of 08.08.2018).
Acknowledgments
The authors thank associate professor NRNU MEPHI Voronov Yu. A. for the assistance provided during the fabrication of the sensors.
Conflicts of Interest
The authors declare no conflict of interest.
Appendix A

Table A1.
The average values of response amplitude ΔVCi and its parameters for the first and fiftieth j-cycles.
Table A1.
The average values of response amplitude ΔVCi and its parameters for the first and fiftieth j-cycles.
| C,% vol. | j = 1 | Total j = 50 | ||||
|---|---|---|---|---|---|---|
| ΔVC1, mV | ρV1 | Si1,V/% | ΔVC2, mV | ρV2 | Si2,V/% | |
| 0.02 | 82 | 0.04 | 4.1 | 58 | 0.05 | 2.9 |
| 0.05 | 262 | 0.01 | 5.24 | 212 | 0.014 | 4.24 |
| 0.1 | 344 | 0.009 | 3.44 | 282 | 0.01 | 2.82 |
| 0.15 | 355 | 0.008 | 2.37 | 290 | 0.01 | 1.88 |
| 0.2 | 415 | 0.01 | 2.07 | 340 | 0.012 | 1.7 |
Table A2.
Average values of response and model parameters of the conversion function ΔVC (C) for lkj-cycles.
Table A2.
Average values of response and model parameters of the conversion function ΔVC (C) for lkj-cycles.
| ↓parameters /lkj→ | 111 | 155 | 255 | 355–455 | 555–655 | 755–855 | Total ΔYD,% |
|---|---|---|---|---|---|---|---|
| ΔVCM, V/ρVCM, % | 0.46/4.3 | 0.41/3.7 | 0.39/3.8 | 0.38/3.9 | 0.37/4.0 | 0.36/4.2 | 21.7 |
| k, 1/%/ρk, % | 12/8.2 | 10/8.8 | 8.5/10.6 | 8.2/10.6 | 8.1/11.5 | 8.0/11.5 | 33.3 |
| SdM, V/%/ρSdM, % | 5.52/12.5 | 4.1/12.5 | 3.32/14.4 | 3.12/14.5 | 2.96/15.5 | 2.88/15.7 | 47.8 |
| vS, V/(% × day) | - | 0.28 | 0.16 | 0.024 | 0.016 | 0.08 | - |
| S5, V/%/ρS5, % | 2.1/2.4 | 1.8/2.8 | 1.7/3.1 | 1.55/3.2 | 1.50/3.3 | 1.45/3.45 | 31.0 |
| ΔV0Slkj, mV | 43 | 37 | 16 | 7 | 3 | - | |
| vΔV0, mV/(day) | - | 7.4 | 3.2 | 1.4 | 0.6 | - | |
| τ1i, s/τ3i, s (i = 2) | 10/15 | 9/15 | 8/15 | 7/16 | 7/15 | 30/6.6 | |
| τ1i, s/τ3i, s (i = 5) | 7/17 | 7/16 | 6/16 | 6/16 | 7/15 | 14.3/11.8 | |
| D, % × min | 0.26 | 6.5 | 13 | 19.5–26 | 32.5–39 | 45.5–52 | - |
References
- Hübert, T.; Boon-Brett, L.; Black, G.; Banach, U. Hydrogen sensors—A review. Sens. Actuators B Chem. 2011, 157, 329–352. [Google Scholar] [CrossRef]
- Lundström, I.; Shivaraman, S.; Svensson, C.; Lundkvist, L. A hydrogen-sensitive MOS field-effect transistor. Appl. Phys. Lett. 1975, 26, 55–57. [Google Scholar] [CrossRef]
- Lundström, I. Hydrogen sensitive MOS-structures, Part I: Principles and applications. Sens. Actuators 1981, 1, 423–426. [Google Scholar] [CrossRef]
- Lundström, I.; Armgarth, M.; Spetz, A.; Winquist, F. Gas sensors based on catalytic metal-gate field-effect devices. Sens. Actuators 1986, 3–4, 399–421. [Google Scholar]
- Spetz, A.; Helmersson, U.; Enquist, F.; Armgarth, M.; Lundström, I. Structure and ammonia sensitivity of thin platinum or iridium gates in metal–oxide–silicon capacitors. Thin Solid Films 1989, 177, 77–93. [Google Scholar] [CrossRef]
- Fomenko, S.; Gumenjuk, S.; Podlepetsky, B.; Chuvashov, V.; Safronkin, G. The influence of technological factors on hydrogen sensitivity of MOSFET sensors. Sens. Actuators B Chem. 1992, 10, 7–10. [Google Scholar] [CrossRef]
- Fogelberg, J.; Eriksson, M.; Dannetun, H.; Petersson, L.-G. Kinetic modeling of hydrogen adsorption/absorption in thin films on hydrogen-sensitive field-effect devices: Observation of large hydrogen-induced dipoles at the Pd–SiO2 interface. J. Appl. Phys. 1995, 78, 988–996. [Google Scholar] [CrossRef]
- Eriksson, M.; Lundström, I.; Ekedahl, L.-G. A model of the Temkin isotherm behaviour for hydrogen adsorption at Pd–SiO2 interfaces. J. Appl. Phys. 1997, 82, 3143–3146. [Google Scholar] [CrossRef]
- Lin, K.W.; Cheng, C.C.; Cheng, S.Y.; Yu, K.H.; Wang, C.K.; Chuang, H.M.; Liu, W.C. A novel Pd/oxide/GaAs metal–insulator–semiconductor field-effect transistor (MISFET) hydrogen sensor. Semicond. Sci. Technol. 2001, 16, 997–1001. [Google Scholar] [CrossRef]
- Wong, H.Y.; Braga, N.; Mickevicius, R.V. Prediction of highly scaled hydroden-terminated diamond MISFET performance based on calibrated TCAD simulation. Diam. Relat. Mater. 2017, 80, 14–17. [Google Scholar] [CrossRef]
- Podlepetsky, B.I.; Nikiforova, M.Y.; Gumenyuk, S.V. Stability investigation of the characteristics of integral hydrogen sensors. Instrum. Exp. Tech. 2001, 44, 257–258. [Google Scholar] [CrossRef]
- Lundström, I.; Sundgren, H.; Winquist, F.; Eriksson, M.; Krants-Rülcker, C.; Lloyd-Spets, A. Twenty-five years of field effect gas sensor research in Linköping. Sens. Actuators B Chem. 2007, 121, 247–262. [Google Scholar] [CrossRef]
- Kalinina, L.; Litvinov, A.; Nikolaev, I.; Samotaev, N. MIS-Field Effect Sensors for low concentration of H2S for enviromental monitoring. Procedia Eng. 2010, 5, 1216–1219. [Google Scholar] [CrossRef]
- Andersson, M.; Pearce, R.; Lloyd-Spetz, A. New generation SiC based field effect transistor gas sensors. Sens. Actuators B Chem. 2013, 179, 95–106. [Google Scholar] [CrossRef]
- Podlepetsky, B.I. Integrated Hydrogen Sensors Based on MIS Transistor Sensitive Elements: Modeling of Characteristics. Autom. Remote Control. 2015, 76, 535–547. [Google Scholar] [CrossRef]
- Podlepetsky, B.I. Effect of irradiation on hydrogen sensors based on MISFET. Sens. Actuators B Chem. 2017, 238, 1207–1213. [Google Scholar] [CrossRef]
- Podlepetsky, B.I.; Nikiforova, M.Y.; Kovalenko, A.V. Chip temperature influence on characteristics of MISFET hydrogen sensors. Sens. Actuators B Chem. 2018, 254, 1200–1205. [Google Scholar] [CrossRef]
- Podlepetsky, B.I.; Nikiforova, M.Y.; Kovalenko, A.V. Performance degradations of MISFET-based hydrogen sensors with Pd-Ta2O5-SiO2-Si structure at long-time operation. Multidiscip. Digit. Publ. Inst. Proc. 2018, 2, 777. [Google Scholar] [CrossRef]
- Podlepetsky, B.; Kovalenko, A.; Nikiforova, M. Influence of electrical modes on radiation sensitivity of hydrogen sensors based on Pd-Ta2O5-SiO2-Si structures. Sens. Actuators B Chem. 2018, 273, 999–1007. [Google Scholar] [CrossRef]
- Podlepetsky, B.; Samotaev, N.; Kovalenko, A. Responses’ parameters of hydrogen sensors based on MISFET with Pd(Ag)-Ta2O5-SiO2-Si structure. Sens. Actuators B Chem. 2019. [Google Scholar] [CrossRef]
Figure 1.
Photos of the sensor chips. (a) The fragment of the silicon wafer, undivided into chips; (b) The separate chip and designations of the contact pads of the MISFET element: gate (G), source (S), drain (D) and substrate (SB).
Figure 1.
Photos of the sensor chips. (a) The fragment of the silicon wafer, undivided into chips; (b) The separate chip and designations of the contact pads of the MISFET element: gate (G), source (S), drain (D) and substrate (SB).

Figure 2.
The sensor chip. (a) Layout and designations of the contact pads and the pin numbers of elements of a sensor integrated cell: gate (G), source (S), drain (D) and substrate (SB) of Pd–Ta2O5–SiO2–Si FET, the source of Al–SiO2–Si FET (TS) and heater-resistor (H1–H2); (b) The chip in the sensor housing without cover (numbers are the numbers ouputs’ terminals of the chip).

Figure 3.
(a)The simplified structure of the sensor characteristic measuring circuitry; (b) The typical i- hydrogen response and its parameters at Ci being equal to 0.05% vol.
Figure 3.
(a)The simplified structure of the sensor characteristic measuring circuitry; (b) The typical i- hydrogen response and its parameters at Ci being equal to 0.05% vol.

Figure 4.
The response parameters: (a) Time diagram of the typical j-ordinary cycle at different Ci; (b) Experimental (symbols) and approximations (lines) of the response residual sum values ΔV0 and amplitudes ΔVC vs. concentration C for the first j-cycle.
Figure 4.
The response parameters: (a) Time diagram of the typical j-ordinary cycle at different Ci; (b) Experimental (symbols) and approximations (lines) of the response residual sum values ΔV0 and amplitudes ΔVC vs. concentration C for the first j-cycle.

Figure 5.
Changes in response parameters during lk-cycles on different days: (a) Summary ZLD changes, A and P are active and passive ZLD stages; (b) Maximum differential sensitivity SdM.
Figure 5.
Changes in response parameters during lk-cycles on different days: (a) Summary ZLD changes, A and P are active and passive ZLD stages; (b) Maximum differential sensitivity SdM.

Figure 6.
The changes in response parameters as a function of D: (a) The changes of SZLD parameters, sensitivities SdM and S5 during the week’s l-cycles; (b) Parameters k and ΔV0, maximum response amplitudes ΔVCM vs. D. Symbols correspond to experimental data and lines are approximations.
Figure 6.
The changes in response parameters as a function of D: (a) The changes of SZLD parameters, sensitivities SdM and S5 during the week’s l-cycles; (b) Parameters k and ΔV0, maximum response amplitudes ΔVCM vs. D. Symbols correspond to experimental data and lines are approximations.

Table 1.
Average values of the parameters of MISFETs and the used parameter models (3).
| Symbols | Parameters | Values |
|---|---|---|
| d1 | thickness of Ta2O5 | 90–100 nm |
| d2 | thickness of SiO2 | 80–90 nm |
| d | d1 + d2 | 170–190 nm |
| ε0 | vacuum dielectric constant | 8.85 × 10⁻¹² F/m |
| ε1 | relative permittivity of Ta2O5 | 25 |
| ε2 | relative permittivity of SiO2 | 4 |
| ε3 | relative permittivity of Si | 12 |
| ε | value (dε1ε2)/(ε1d2 + ε2d1) | 6.9 |
| C0 | dielectric capacitance (ε0ε)/d | 30 nF/cm2 |
| NA | concentration of acceptors | 5 × 1015 cm−3 |
| b | transconductance | 2.0 mA/V2 |
| k | Boltzmann constant | 1.38 × 10⁻²³ J/K |
| T | operating chip temperature | 400 K |
| q | electron charge | 1.6 × 10⁻¹⁹ C |
| (q · φms0) | Pd–Si work functions difference | 0.08 eV |
| φT | thermal potential kT/q for T = 400 K | 33 mV |
| φs0 | φTln(NA/ni) for T = 400 K ≈ 130 °C | 0.21 V |
| a | (2q · ε3ε0NA)0.5/C0 | 1.33 V0.5 |
Table 2.
Designations and nlkji-response parameters (Ylkji) for the characterization of instabilities and performance degradation parameters of output voltage (C,t,tC). ZLD = zero-line drift.
Table 2.
Designations and nlkji-response parameters (Ylkji) for the characterization of instabilities and performance degradation parameters of output voltage (C,t,tC). ZLD = zero-line drift.
| i-Response | j-Cycle | k-and l-Cycles |
|---|---|---|
| V0i—initial voltage; | maximum amplitude ΔVCM; | number of days (nk) and weeks (nl) |
| τi—H2 pulse duration: 25–30 s; | amplitude’ changes: δVCMj = ΔVCM − ΔVCM j; | amplitude changes: δVCMlk = ΔVCM − ΔVCMlk; |
| Ci—H2 concentration; | differential sensitivity: Sdj = d(ΔVC)/dC; | total exposition time: tC = 5 · nj · nk · nl · τi ≤ 500 min; |
| δV0i—residual value; | maximum sensitivity SdMlk; | summary ZLD (j = 1; k = 1): ΔV0Sk = V0k − V0(k+1); ΔV0Sl = V0l − V0(l+1); ΔV0S = V0111 − V0(lkji) max; |
| ΔVCi—response amplitude; | break time tbj ≈ 60 min; | |
| τ1i—response time; | cycle time tj ≈ 75 min; | |
| τ3i—relaxation time; | ||
| ti—response period: ≈1.0 min | ZLD: ΔV0j = V0j1 − V0j imax; | |
| Si = ΔVCi/Ci—sensitivity; | C-time factor: D = nk · nl · Dj max ≤ 52 (% × min) | |
| Di = (Ci · τi) is the Ci-time factor | Summary ZLD(SZLD) (i = 1): ΔV0Slkj = V0lk1 − V0lk(j+1) |
© 2019 by the authors. Licensee MDPI, Basel, Switzerland. This article is an open access article distributed under the terms and conditions of the Creative Commons Attribution (CC BY) license (http://creativecommons.org/licenses/by/4.0/).
Share and Cite
MDPI and ACS Style
Podlepetsky, B.; Samotaev, N.; Nikiforova, M.; Kovalenko, A. Performance Degradations of MISFET-Based Hydrogen Sensors with a Pd-Ta2O5-SiO2-Si Structure During Long-Term Operation. Sensors 2019, 19, 1855. https://doi.org/10.3390/s19081855
AMA Style
Podlepetsky B, Samotaev N, Nikiforova M, Kovalenko A. Performance Degradations of MISFET-Based Hydrogen Sensors with a Pd-Ta2O5-SiO2-Si Structure During Long-Term Operation. Sensors. 2019; 19(8):1855. https://doi.org/10.3390/s19081855
Chicago/Turabian StylePodlepetsky, Boris, Nikolay Samotaev, Marina Nikiforova, and Andrew Kovalenko. 2019. "Performance Degradations of MISFET-Based Hydrogen Sensors with a Pd-Ta2O5-SiO2-Si Structure During Long-Term Operation" Sensors 19, no. 8: 1855. https://doi.org/10.3390/s19081855
Note that from the first issue of 2016, this journal uses article numbers instead of page numbers. See further details here.