Article

Exploitation of SnO2/Polypyrrole Interface for Detection of Ammonia Vapors Using Conductometric and Optical Techniques: A Theoretical and Experimental Analysis

by
Ajay Pratap Singh Gahlot
1,2,*,
Ayushi Paliwal
1 and
Avinashi Kapoor
2
1
Deshbandhu College, University of Delhi, New Delhi 110019, India
2
Department of Electronic Sciences, University of Delhi South Campus, New Delhi 110021, India
*
Author to whom correspondence should be addressed.
Sensors 2022, 22(19), 7252; https://doi.org/10.3390/s22197252
Submission received: 29 July 2022 / Revised: 10 September 2022 / Accepted: 20 September 2022 / Published: 24 September 2022
(This article belongs to the Section Chemical Sensors)

Abstract

:
This study describes the construction of a lab-built Surface Plasmon Resonance (SPR) system for gas sensing applications employing a highly sensitive and trustworthy optical approach. The nanocomposite thin film of tin oxide (SnO2) and Polypyrrole (PPy) were prepared for sensing highly toxic gas, i.e., ammonia (NH3) gas. The gas sensor was validated by both optical and conductometric techniques of gas sensing. The optical SPR gas sensor is based on the change in refractive index at the SnO2/Polypyrrole (PPy) interface with gas adsorption (NH3). The thickness of SnO2 and Polypyrrole thin films was optimised using theoretical calculations for a sharp SPR reflectance curve. The manuscript also offers theoretical SPR curves for different PPy and SnO2 layer thicknesses. To support the theoretical conclusions, the effects of NH3 gas on the prism/Au/SnO2/Polypyrrole system were also investigated experimentally. In comparison to other research described in the literature, it was observed that the constructed sensor’s sensitivity was higher. The obtained results demonstrate the utility of the SPR setup in the investigation of the interactions of adhered gas molecules with dielectrics and gas sensing. For conductometric gas sensing studies, the film having optimised thicknesses for sharp SPR reflectance curves was separately prepared on Interdigitated Electrodes. At a low working temperature of roughly 150 °C, the sensing response of the constructed film was observed and found to be maximal (60).

1. Introduction

The scientific community has been working to develop effective gas sensors for several decades in order to safeguard the environment and workplaces from harmful and deadly gas leaks [1,2]. Technologies for sensing gases come in a variety of forms, such as conductometric and optical sensing. On the other hand, conductometric sensing technology has a number of limitations, such as the requirement for elevated temperature, high energy consumption, and poor selectivity. Therefore, the development of an efficacious gas sensor based on optical sensor systems is the answer to this problem [3]. It is preferable to use optical sensors since they may operate at room temperature and use less energy [4]. Numerous optical techniques, such as infrared spectroscopy [5], ultraviolet-visible spectroscopy [6], ellipsometry [7], and SPR [8], are accessible for sensing applications. Compared to all other methods, optical gas sensors based on SPR have many advantages. SPR-based optical gas sensors provide great benefits over all other approaches, including easy fabrication of samples, sensing operation effective at room temperature, achieves lowest detection limits, good selectivity, and high responsiveness. Using the Kretschmann arrangement, investigators have deposited a gas-sensitive film on top of a metal layer to use the SPR technology for applications involving gas sensing [9,10,11]. However, the response obtained by the developed sensor is poor. As a result, optimizing the thickness of the detecting layer is the first step in developing a gas sensor. The current research begins with a theoretical simulation to determine the optimal thickness of SnO2 and Polypyrrole thin films independently. The metal-dielectric interface can undergo even the smallest modifications, and SPR is a sensitive method for detecting these changes [12]. As a result, a particular gas’s presence in the system may be associated with the shift in SPR reflectance curves.
The detection of extremely dangerous and harmful ammonia (NH3) gas is the foremost concern of the study presented here. Animal manure or pollutants from manufacturing and vehicles both produce NH3 gas. Many efforts are still being made by the research community to detect NH3 gas [13,14]. To detect NH3 leakage at exceptionally low quantities (less than 5 ppm), investigators are currently developing a sensor system [15]. Only a few studies explain SPR sensing devices that are intended only to identify NH3 gas [16,17]. However, the research showed low sensitivity to detect higher ammonia concentrations (>25 ppm). Maciak et al. detected ammonia vapours utilizing a polyaniline sensing layer; 32 ppm of ammonia vapours were found using an SPR spectroscopy method [16]. A separate sensor layer, Nafion/WO3, was utilised by Dolbec et al. [17] to detect higher ammonia concentrations. Gas sensing utilizing the SPR approach, as previously described, necessitates an optimum sensing layer for detection. As a result, selecting a good material and optimizing it is critical for the sensor’s development. The concentration of gas molecules interacting with the sensing layer determines how the index of refraction of the layer changes after exposure to the target gas.
Tin oxide (SnO2) is the most suited metal oxide for use in gas sensing applications, and it has been shown over the past few decades that semiconductor metal oxides are excellent materials for sensing applications, such as the detection of a variety of hazardous gases. Tin-oxide (SnO2) is a semiconductor metal oxide that is commonly employed as a sensor for hazardous gases due to its high sensitivity and stability [18]. The n-type semiconductor material SnO2 is thought to be the best contender for developing gas sensors for a number of dangerous gases [19].
Compared to the single component, there are advanced nanostructures with organic/inorganic composites for gas sensing applications [20]. Increased conductivity, porosity, and catalytic activity are the benefits of using composites in applications requiring gas sensing [20]. There are various organic materials that have recently been exploited for gas sensing applications [21,22]. Metal oxide gas sensors initially demonstrate strong sensitivity to harmful chemicals, but they require higher working temperatures. Selectivity and other sensing properties can be improved by using nanocomposite thin films of polymeric materials and metal oxides [23]. Another type of material that has been studied recently is conducting polymers, which have strong electrical and optical properties [24]. Because it is stable at high temperatures and it is simple to prepare samples, polypyrrole (PPy) is the most well-known conducting polymer [25]. PPy thin films for NH3 sensing were prepared electrochemically and had concentrations of between 0.01 and 1% [26]. With the use of chemically prepared PPy films, Yadav et al. observed a 4–8% sensing response to NH3 gas [27].
The majority of the findings show that at higher temperatures, the sensing response is minimal. There is no published study on how to build a SnO2/PPy multilayer-based SPR sensor for NH3 gas detection. This could enable the development of a low-level ammonia gas detection SPR sensor that works well.
In this study, the thicknesses of the thin films of Au, SnO2, and PPy were theoretically tuned for a sharp SPR curve. The SPR approach was used to examine the change in optical properties of a gas sensitive multilayer thin film structure constructed at the optimum thickness under varied concentrations of hazardous gases, such as NH3 gas.
Studies have been carried out on conductometric gas sensing of the optimised PPy/SnO2 multilayer thin film structure. The aim is to observe the sensing response using the resistive method for the best optimized film obtained using SPR.
Theoretical simulation details
When light is reflected from metal/dielectric surfaces, Fresnel’s equations can be utilised to characterise the behaviour of the reflected light intensity as a function of angle of incidence (angular interrogation mode). Theoretical reflectance values for one-layer (prism + metal + air) and two-layer (prism + metal + dielectric + air) systems, respectively, are used to calculate the dielectric constant (or refractive index) of the metal and dielectric layer [28]. The following is an explanation of the theoretical Fresnel’s equations used to simulate the graphs. For the (prism + Au + air) system, which is a single layer system with a metal (Au) sheet of thickness d1, the reflectance at an incident angle is given by
  R 014 = r 01 r 14   exp 2 i k z 1 d 1 1 + r 01 r 14   exp 2 i k z 1 d 1   2  
where   r i k = k z i ε i k z k ε k k z i ε i + k z k ε k  
and   k z i = 2 π λ ε i ε 0 sin 2   θ  
where λ is the wavelength of the incoming light and εi with i = 0, 1, and 4 are the corresponding dielectric constants of the glass prism, Au film, and air.
Given known values of ε0 = (1.517)2 and ε4 = 1.0 Equations (1)–(3) were used to obtain the theoretical SPR data, with the imaginary component (11.9 + 1.2 i) representing the dielectric loss of the Au thin film and ε1 (= ε1’ + jε1”) serving as the dielectric constant. For the (prism + Au + SnO2 + air) system, a two-layer system with an Au film of thickness d1 and a SnO2 film of thickness d2 might provide the predicted SPR graph. For the (prism + Au + SnO2 + air) system, the reflectance R0124 is given by
R 0124 = r 01 + r 124   e x p 2 i k z 1 d 1 1 + r 01 r 124   e x p 2 i k z 1 d 1   2  
w h e r e   r 124 = r 12 + r 24 e x p 2 i k z 2 d 2   1 + r 12 r 24 e x p 2 i k z 2 d 2  
where rik and kzi are determined by (2) and (3), respectively, and ε2 and d2 are the complex dielectric constant and thickness of the thin SnO2 layer, respectively. The subscripts 0, 1, 2, and 4 stand for various media, including, successively, a glass prism, an Au film, a SnO2 film, and air. The literature is used to determine the SnO2 thin film’s dielectric constant, which is ε2 (=ε2’ + 2”).
The reflectance for (prism + Au + SnO2 + PPy + air) structures, having a three-layer system (Polypyrrole, SnO2 thin films and Au layer), is given as
  R 01234 = r 01 + r 1234   exp 2 i k z 1 d 1 1 + r 01 r 1234   exp 2 i k z 1 d 1   2  
w h e r e   r 1234 = r 12 + r 234   exp 2 i k z 2 d 2   1 + r 12 r 234   exp 2 i k z 2 d 2  
where rijk, rik, and kzi are supplied by (5), (2), and (3), respectively, while subscript 0, 1, 2, 3, and 4 indicate the various media, including the prism, Au layer, SnO2 film, PPy film, and air, respectively. On the surface of the SnO2 thin film, d3 and ε3 represent the average thickness of the PPy thin film and the complex dielectric constant, respectively. The value of the PPy thin film’s complex dielectric constant (ε3 = ε3’ + 3”) was obtained from published sources.

2. Materials and Methods

This work prepared the film’ multilayer structure. First, using thermal evaporation and the specifications described in our earlier research [29], an optimal Au thin film was formed on a glass prism. The SnO2 film was then applied to the Au coated prism. SnO2 nanoparticles were synthesised using the sol–gel process, and, subsequently, thin films were created using the spin coating approach [30]. Finally, thin PPy layers were applied to this framework. PPy nanoparticles were synthesized chemically, and films were prepared via a spin coater [30].
Excitation of Surface Plasmon (SP) modes were achieved using a right-angled BK-7 glass prism (np = 1.517) in Kretschmann configuration. A p-polarized He-Ne laser (=633 nm for the (prism + Au + SnO2 + PPy + air system) was employed as the excitation source. To estimate the SPR response, the reflected light was observed as a function of incidence angle. A separate attachment of a gas cell was prepared such that gas vapours directly hit the gas sensitive-coating (prism + Au + SnO2 + PPy). The cell was first vacuumed, then a target gas of NH3 at a particular concentration was introduced via the intake valve. Both static and dynamic testing procedures were used. The target gas was positioned within the gas cell for the full range of incidence angles, while the SPR reflectance curve was recorded in the static mode using an optical power metre and rotating stage. A CCD camera was utilised for dynamic measurements to record the response’s fluctuation over time (PC interfaced).
The multilayer thin film structure of PPy/ZnO was formed on Platinum (Pt) Interdigitated Electrodes. Using this measurement technique, the variation in the resistance of the sensor was measured in response to the target gas of fixed concentration.

3. Results and Discussion

3.1. Optimization of SnO2 and PPy Thicknesses

Theoretical SPR reflectance curves obtained from Fresnel’s equations as described in the theoretical section for the prepared systems are presented in Figure 1. As the number of layers increased, i.e., when SnO2 was deposited on the Au-coated prism and when PPy was deposited on the (SnO2 + Au + prism) surface, the resonance angle increased. This was attributed to the variation in the refractive index of the sensing layer (SnO2 + PPy layer).

3.1.1. Varying Thickness of SnO2

Figure 2 illustrates the SPR reflectance curve for the multilayered (prism + Au + SnO2 + PPy + air) system by changing the thickness of SnO2. Figure 2 shows that the lowest reflectance and observed fluctuation of resonance angle are both displayed. As noted from Figure 2, the resonance angle increases from 42.8° to 47.5°, whereas the minimum reflectance decreases from 0.08 to 0.01, with an increase in thickness of SnO2.
Table 1 lists the values of FWHM with the thickness of the SnO2 film. FWHM increases with thickness, having minimum value for the lowest value of thickness. As a result, 100 nm thick SnO2 SPR has the lowest FWHM (or absorption losses), making it the ideal SnO2 layer thickness.

3.1.2. Varying Thickness of Polypyrrole Thin Film

A similar variation by varying the thickness of PPy is shown in Figure 3a. All the resonance parameters with corresponding variation with thickness of PPy layer are plotted in Figure 3a.
Table 2 shows the values of FWHM with thickness for the PPy layer. As observed from the studies, the system having a 300 nm thick PPy layer with minimum FWHM (or absorption losses) is the optimized system.

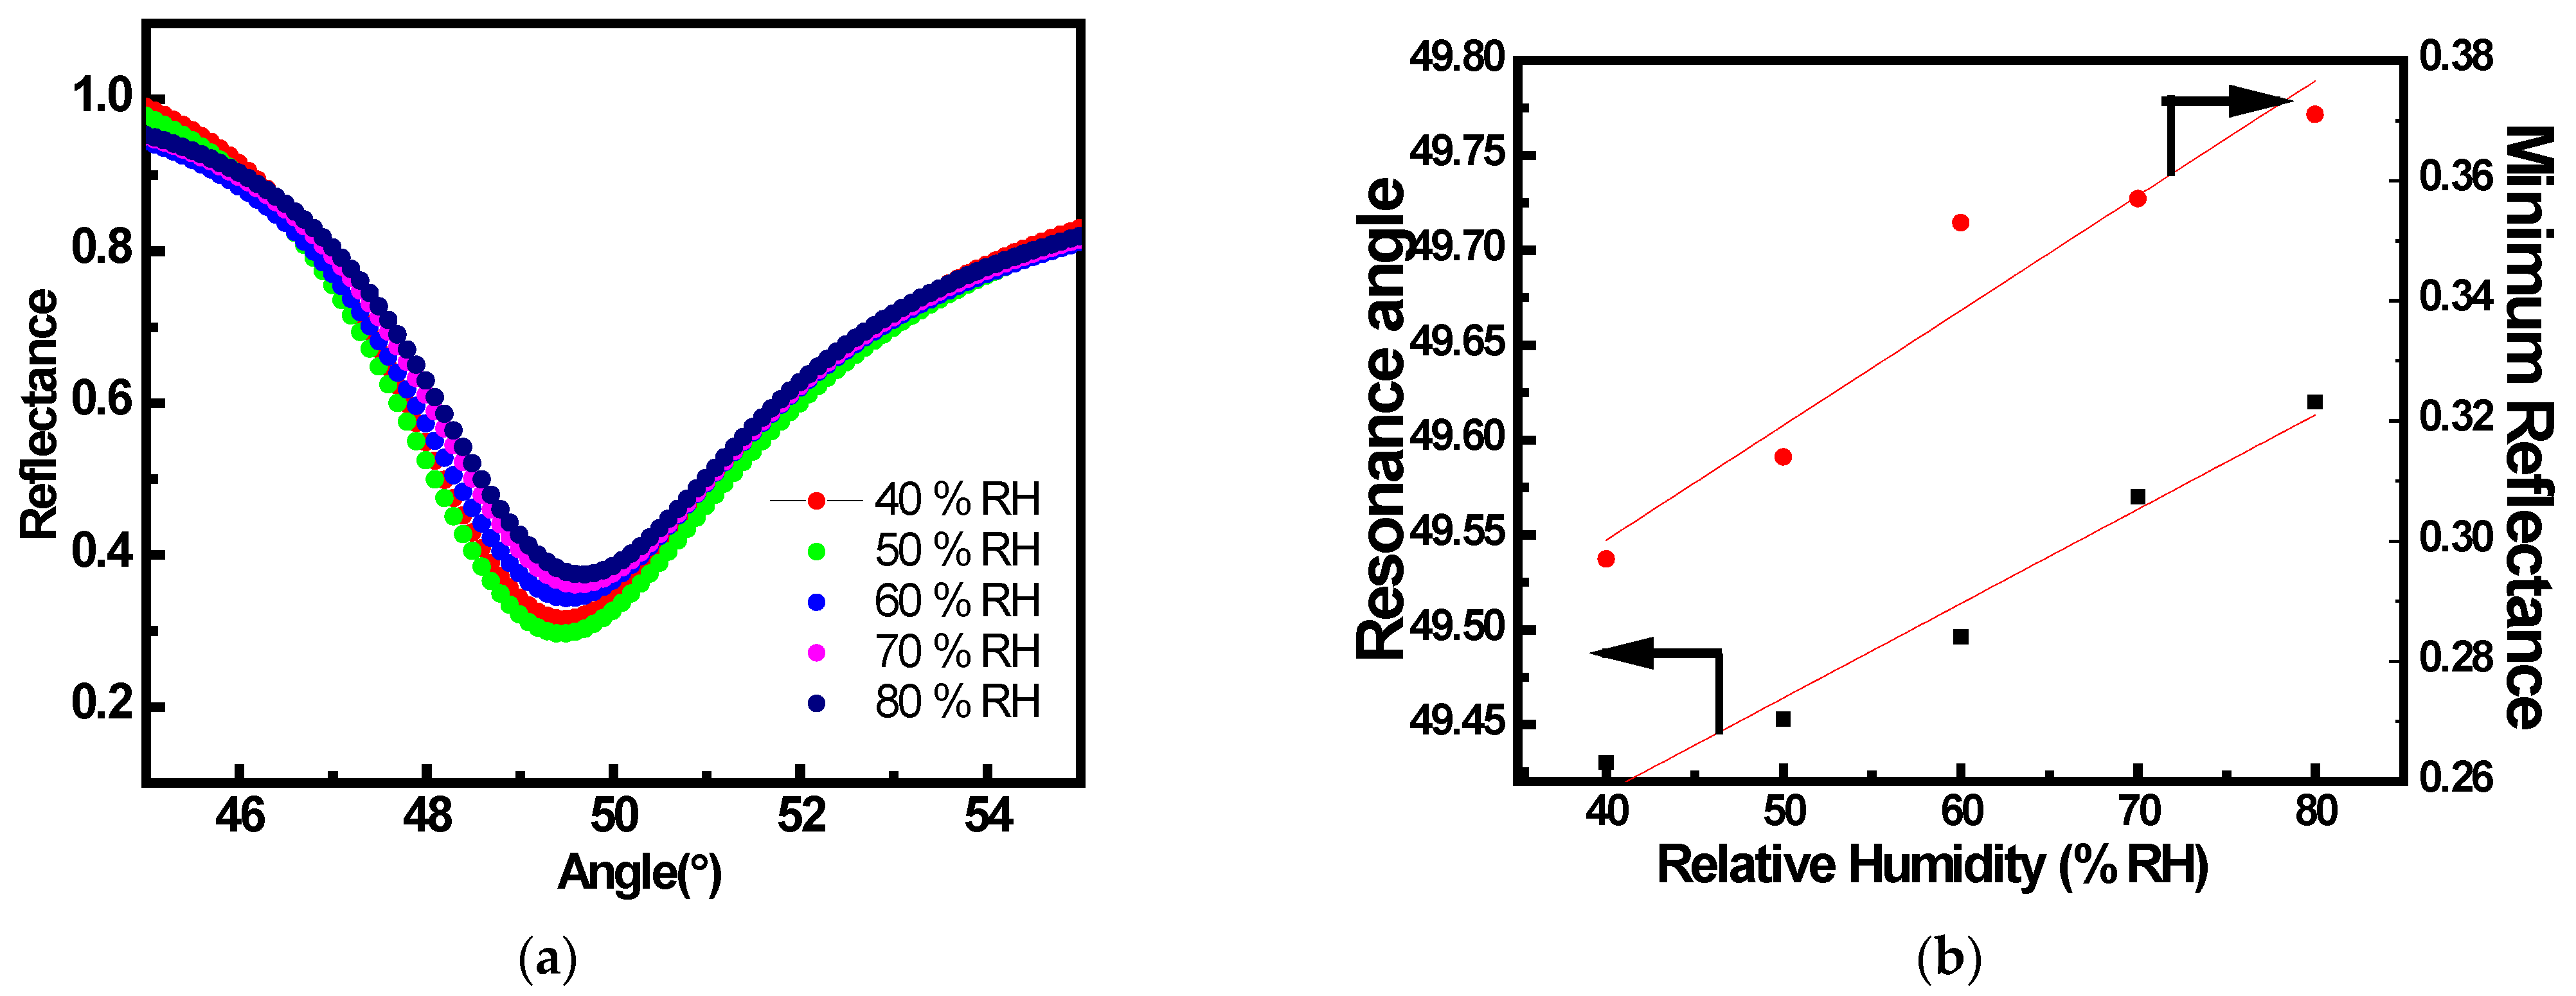
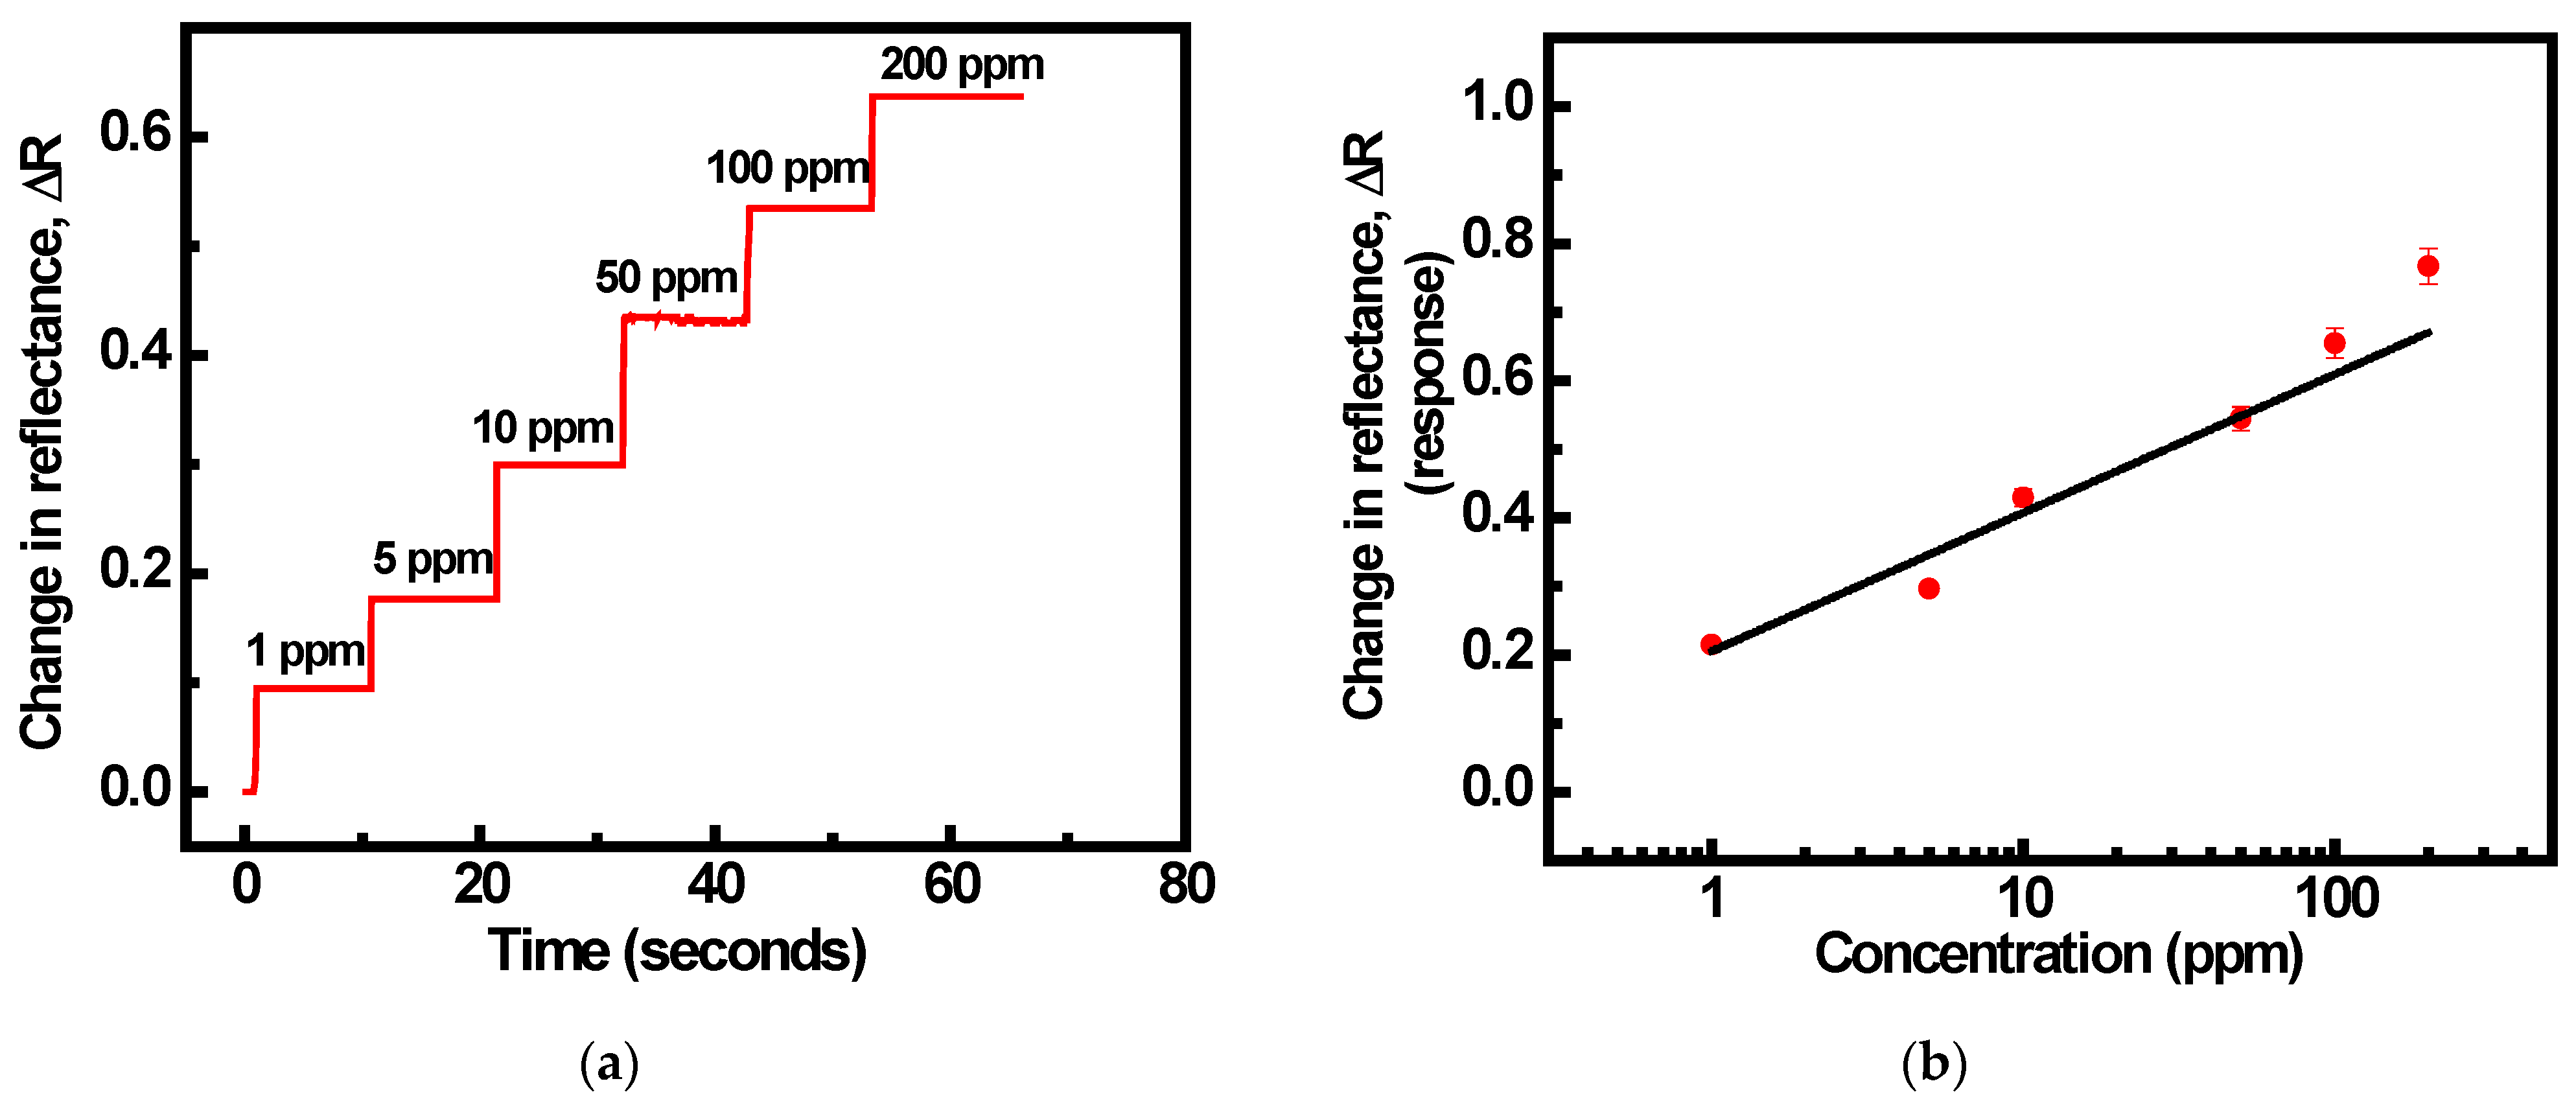
3.2. SPR Gas Sensing Experimental Studies

Before performing the experimental gas sensing studies on the prepared sample, the characterisation studies, i.e., XRD and AFM, were also included. Figure 4a shows the XRD spectra indicating the crystalline growth of SnO2 thin film and PPy thin film having amorphous structure but does not show any peak in the spectra. Using Scherrer’s formula along the prominent (101) peak, the crystallite size of the nanocomposite SnO2/PPy thin film with 100 nm and 300 nm thicknesses of SnO2 and PPy, respectively, was calculated. It was found to be around 5.2 nm. The surface morphology of the produced sample with uniformly dispersed crystallites is seen in the AFM picture in Figure 4a.The porosity of the sample was also found to be high. Characterisation studies confirmed that the sample was optimized for a higher sensing response due to high porosity and uniformly distributed crystallites. Figure 4a shows the schematic of SPR gas sensor having metal/dielectric interface as (Au + SnO2 + PPy), the Multi layered sensing element. Surface Plasmon Wave was generated at the interface of Au/SnO2 propagating along the interface. Fixed concentration of NH3 gas was exposed to the surface of the (prism + Au + SnO2 + PPy) system. Utilizing the optimized system (prism + Au + SnO2 + PPy + NH3), the gas sensing results were obtained by exposing the sensing with different concentrations of NH3 gas (0 to 200 ppm) and the recorded variation is shown in Figure 4b. With a rise in NH3 gas concentration from 1 to 200 ppm, a consistent change in the SPR Resonance angle toward a higher angle was seen from 40.7° to 51.1° (Figure 4b). This ongoing change was caused by the changes in the SnO2 thin film’s refractive index due to the adsorption of reducing NH3 gas at various concentrations.
The resonance parameters (θSPR, Rmin and FWHM), as evaluated from SPR curves in Figure 4b, are plotted in the respective graphs of Figure 5a–c. Theoretical evidence indicates that the shift in resonance that was seen experimentally is associated with the change in the effective refractive index of the (SnO2 + PPy) sensing interface brought on by the adsorption of reductive NH3 gas at various concentrations. Up to 10 ppm of NH3 gas concentration, both θSPR and Rmin, linearly increased. When the concentration of NH3 gas increased further, they saturated, suggesting that there was no discernible change in the effective refractive index. A similar variation in FWHM of SPR was recorded.

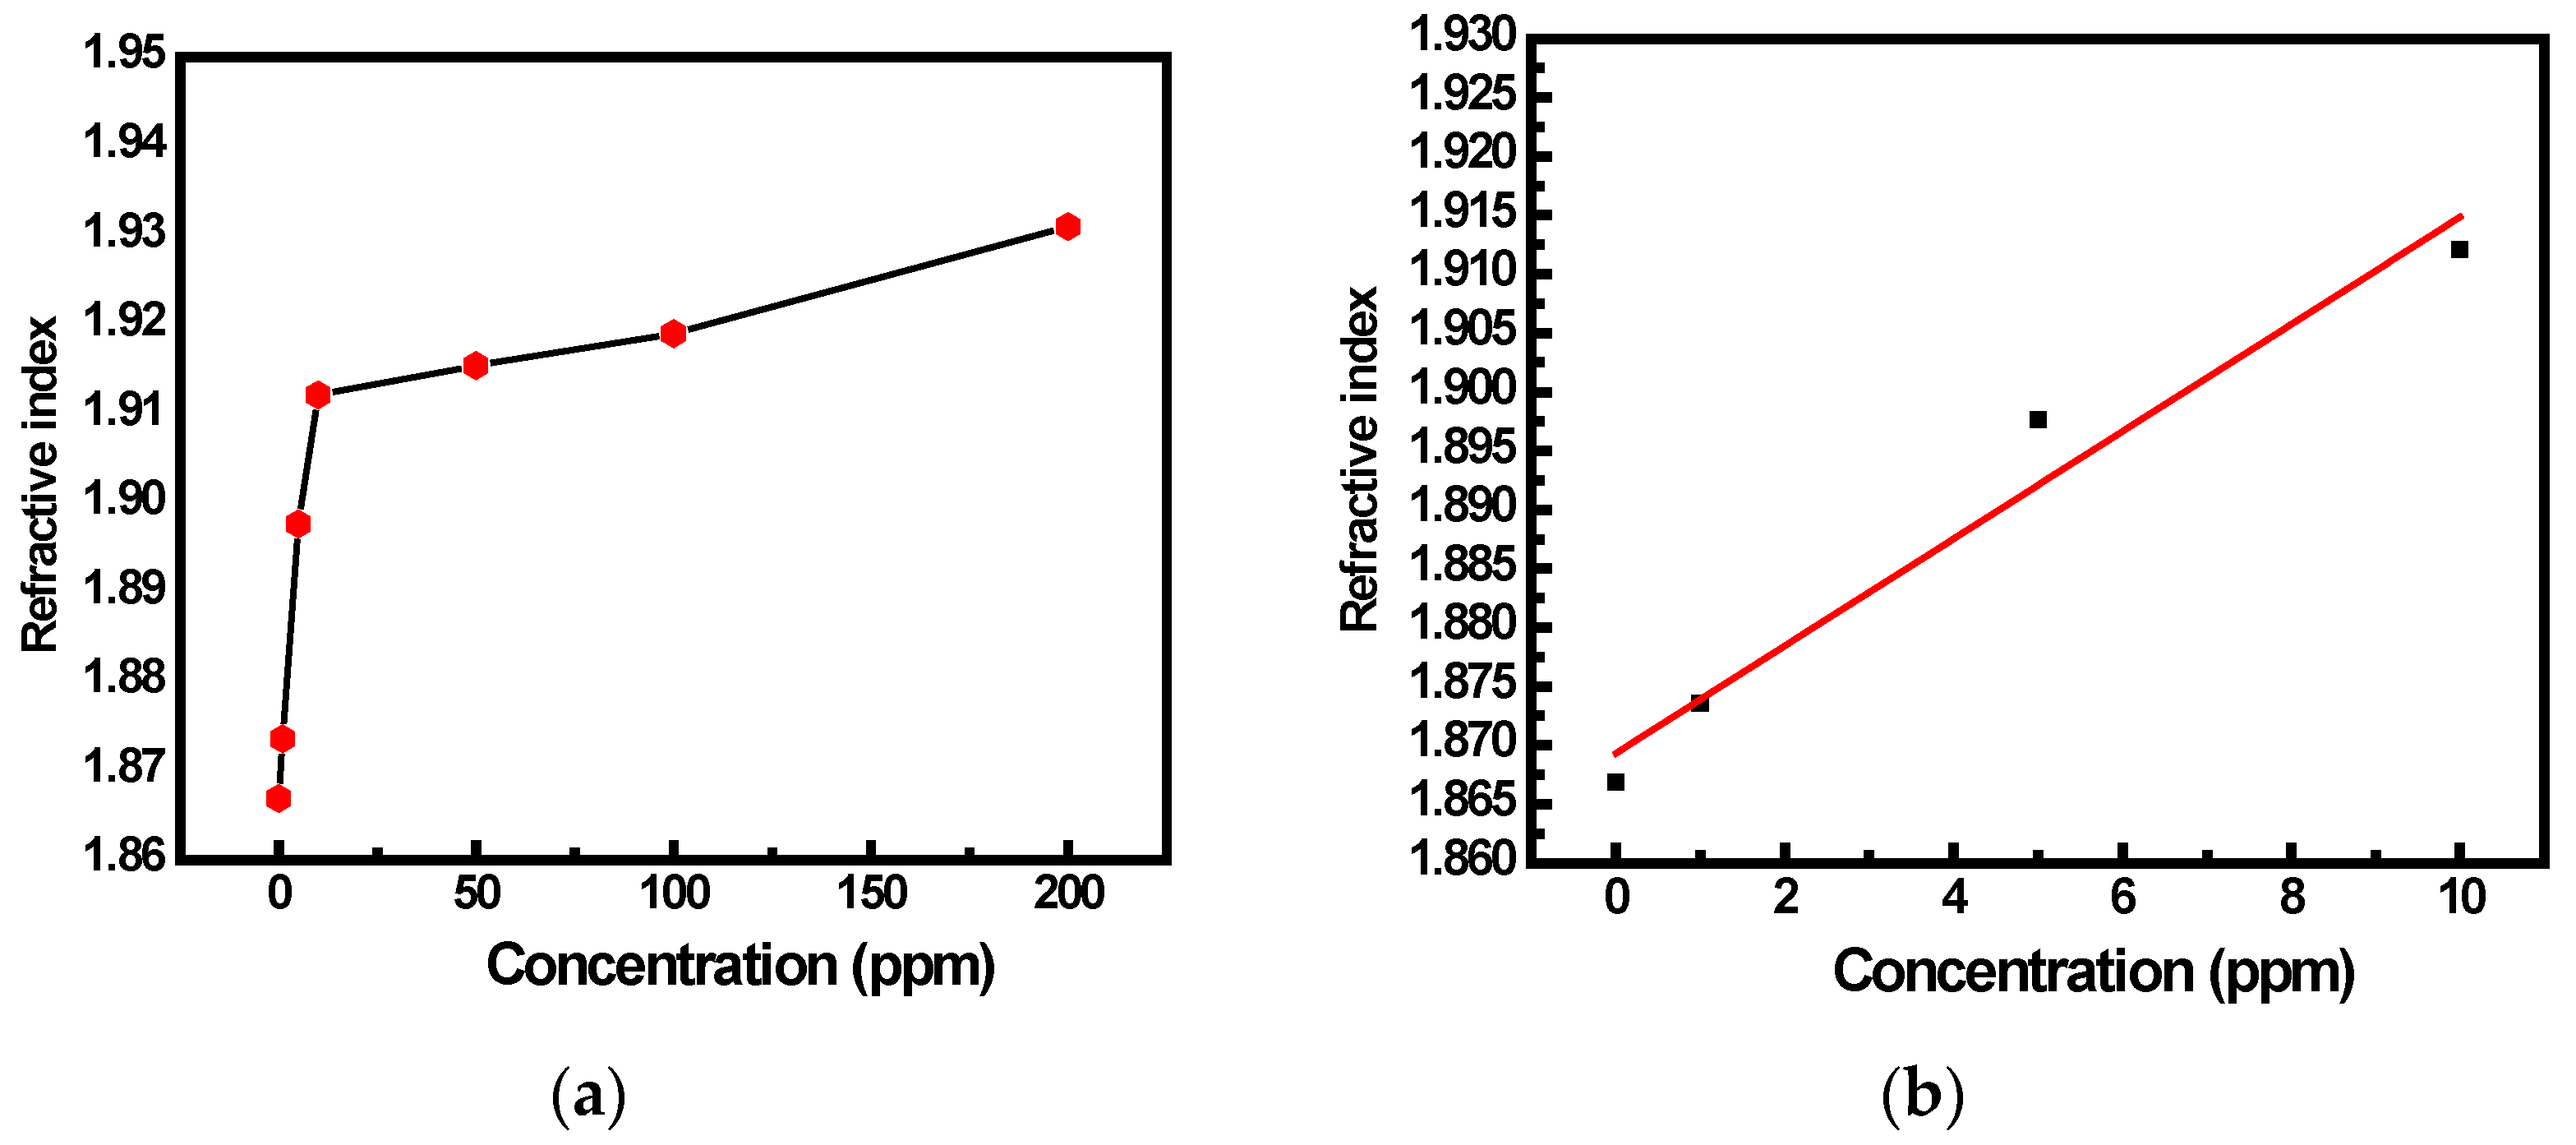
3.3. Sensing Mechanism

There are two major factors behind the detection of NH3 gas molecules using the (Au + SnO2) sensing layer. First, the change in the semi-infinite dielectric medium from air to gaseous molecules with a greater index of refraction for Ammonia (NH3). Secondly, an increase in the refractive index reactive layer of gas with a rise in the concentration of adsorbed NH3 gas molecules. The basic reason for the rise in the sensing layer’s refractive index, i.e., SnO2 is that the SnO2 reduced after interacting with NH3 gas molecules. After reduction, oxygen molecules were released from the film surface, hence the trapped electrons. This finally led to an increase in the thin-film SnO2’s refractive index.
The calibration curve of the prepared sensor, i.e., variation in effective index of (SnO2 + PPy) interface versus concentration, is shown in Figure 6a. As noted from Figure 6a, the refractive index linearly increases until 10 ppm. As a result, a different graph is constructed in Figure 6b for the variable refractive index with increasing concentration up to 10 ppm (b). The curve was fitted linearly, and the sensitivity value was determined by the calibration curve’s slope, i.e., 4.5 × 10⁻³ RIU/ppm.
Furthermore, humidity is a crucial factor in assessing the performance of a gas sensor. Hence, to check the effect of humidity on the performance of a fabricated SPR sensor, the gas sensing studies were carried out for a fixed concentration of 10 ppm of NH3 gas for varying humidity ranges (40% to 80%). SPR reflectance curves for the prism/Au/SnO2/PPy configuration on exposure to 10 ppm concentration of NH3 gas under different relative humidity conditions (40 RH% to 80 RH%) are shown in Figure 7a. The curves are found to slightly shift towards a higher angle with a slight increase in minimum reflectance. This is due to a change in the optical property (increase in conductivity) of the SnO2/PPy nanocomposite thin film as the humidity level increased. The calibration curves are also shown showing the corresponding variation of θspr and Rmin with the different relative humidity ambient (40% to 80%) in Figure 7b. The sensitivity of the prepared LRSPR sensor towards humidity derived from the calibration curve is 0.002°/RH%, which is negligible.
The dynamic response for the multi-layered system composed of a prism, Au, SnO2, and PPy when exposed to NH3 gas at concentrations ranging from 0 to 200 ppm is also included in the current work (resonance angle set at 40.7 degrees). A continuous step-like behaviour was observed from 1 to 200 ppm of NH3 gas at room temperature (Figure 8a). On the basis of the calibration curve, the constructed SPR sensor has a sensitivity of 0.202 ppm for NH3 concentrations ranging from 1 ppm to 200 ppm, (Figure 8b). The results indicate how to design a reliable SPR gas sensor for quick NH3 gas detection.

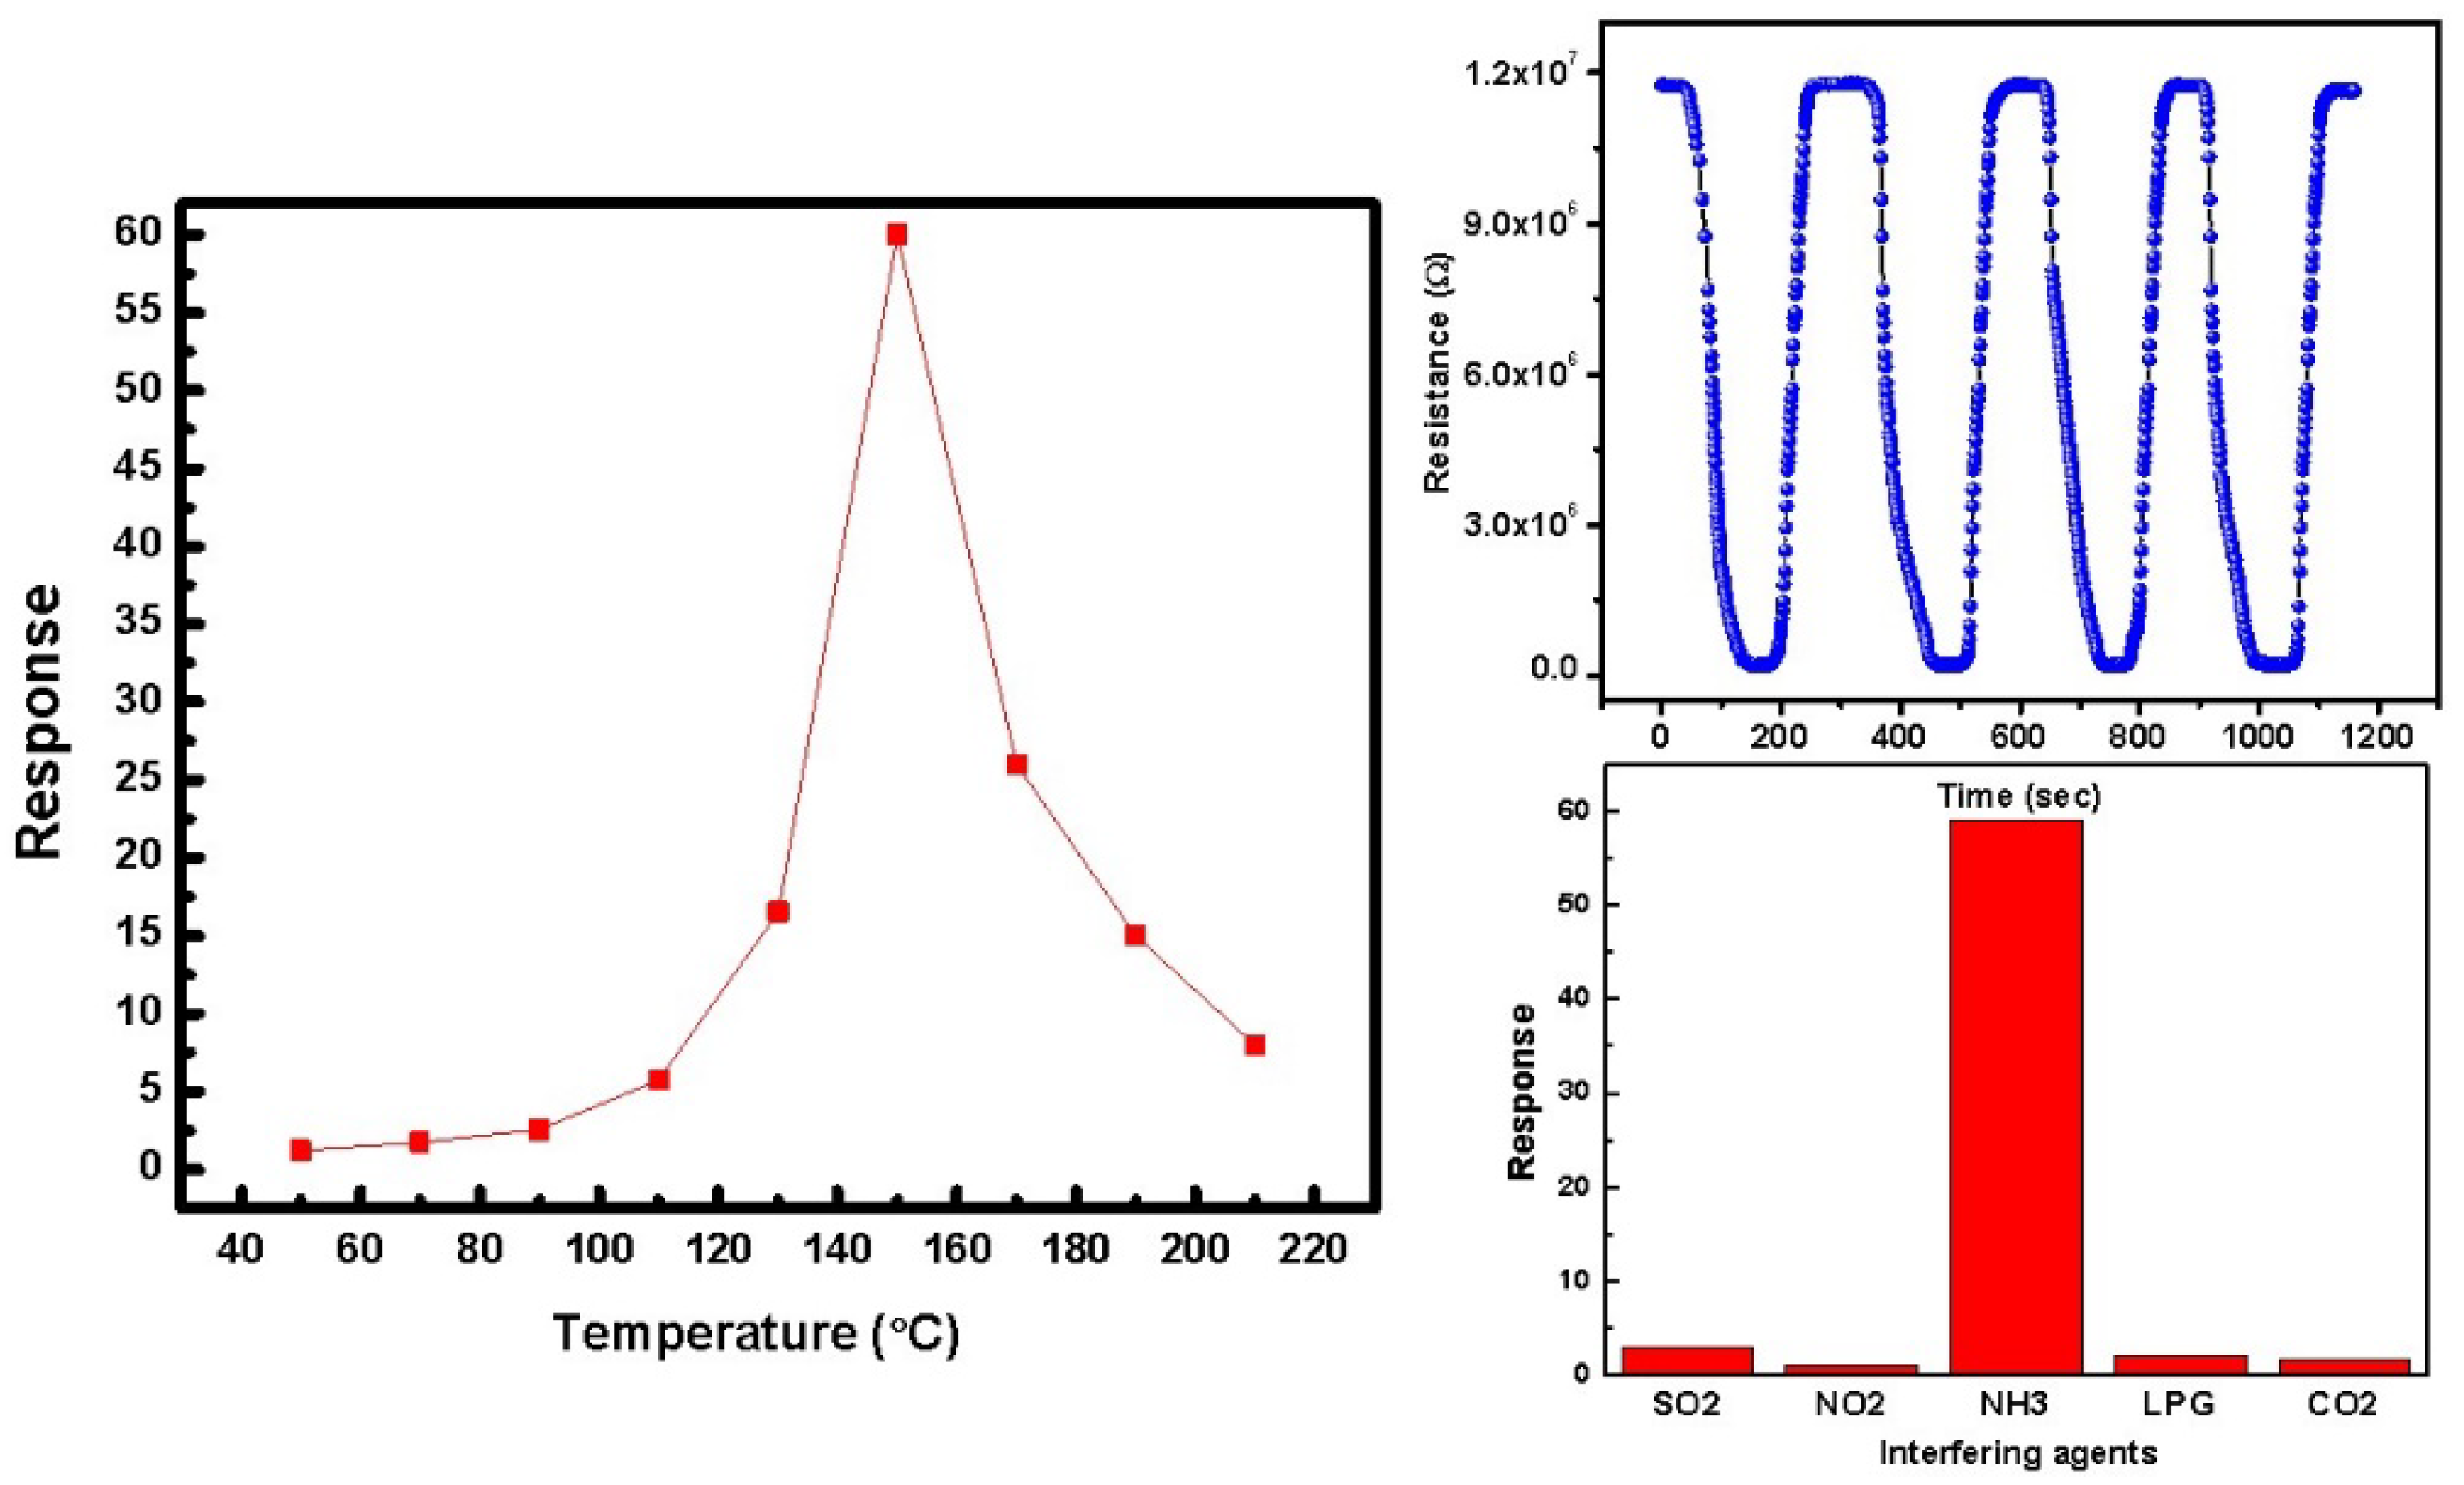
3.4. Conductometric Gas Sensing Studies

Response variation of the optimized sensor with annealing temperature is shown in Figure 9 and it is evident from the sensing graph that there is a maximum response of 60 at a temperature of 150 °C. The sensing response is calculated as:
S = (Ra − Rg)/Rg
where Rg is associated with resistance in the presence of the target gas and Ra is defined as sensor resistance in the presence of clean air. The sensor’s response time is the amount of time it takes to reach 90% of saturated resistance in the presence of reducing (NH3) gas, whereas the sensor’s recovery time is the amount of time it takes to reach 10% of saturated resistance. The sensing response shows maxima due to highly porous film having higher surface roughness, leading to maximum adsorption of target gas molecules. The adsorption leads to a change in the resistance of the film showing maxima. The sensor was also tested for repeatable characteristics. Another especially important parameter of the sensor is the selectivity. Selectivity of the sensor is also shown in Figure 9. The developed sensor was found to be highly selective towards the target gas, which is clear from the figure where a low response is observed for other interfering gases and a high response for the target gas. The reason behind the selective sensing of ammonia gas by the prepared sensor is the NH3 gas adsorbed on the SnO2/PPy surface. The sensor’s ability to be selective in terms of sensing is greatly enhanced by the PPy thin layer and the NH3 gas due to a de-doping reaction between PPy and NH3 molecules. Hence, Figure 9 shows the highest sensing response of the prepared sensor towards NH3 gas.
A lot of work has been conducted on NH3 gas sensors using various metal oxide thin films, including ZnO [31,32], etc. Among these metal oxides, SnO2 thin film was studied extensively in comparison to other semiconducting materials towards the detection of a number of both oxidizing and reducing gases [33]. SnO2 is the most used material for conductometric gas sensors [33]. Very few reports are available on NH3 using SPR [16]. However, the reports lack in various context. The sensitivity was reported to be poor and mostly SPR sensors are utilized to identify ammonia with a greater concentration (>25 ppm). There are no published reports of SPR gas sensors for NH3 that use SnO2 sensing layers, even though SnO2 exhibits enhanced sensitivity for most of the gases [16]. This might assist in the development of effective SPR sensors for detecting ammonia gas at low levels. Additionally, an effort has been made to make the sensor more selective by incorporating the PPy layer. The sensor in the present study has higher sensitivity compared to other reports in the literature [34,35].

4. Conclusions

An optical gas sensor that is room-temperature operated has been designed for the detection of highly toxic gas, i.e., NH3 gas. SPR technology has been successfully exploited using the sensitive sensing interface of SnO2 and PPy. Thicknesses of SnO2 and PPy were optimized theoretically. The SPR sensor exhibited a quick response time (1 s) and high sensitivity (4.5 × 10⁻³ RIU/ppm) towards NH3 gas across a wide variety of concentrations (1 to 10 ppm). Additionally, dynamic behaviour was seen, and the calibration curve’s estimated sensitivity of 0.202/ppm was used. The sensor was also tested for conductometric sensing.

Author Contributions

Conceptualization, A.P.S.G. and A.P.; methodology, A.P.S.G. and A.P.; software, A.P.; validation, A.P.S.G., A.P. and A.K.; formal analysis, A.P.S.G.; investigation, A.P.; resources, A.P.; writing—original draft preparation, A.P.; writing—review and editing, A.P.S.G.; supervision, A.K. All authors have read and agreed to the published version of the manuscript.

Funding

This research received no external funding.

Institutional Review Board Statement

Not applicable.

Informed Consent Statement

Not applicable.

Data Availability Statement

Not applicable.

Acknowledgments

The Authors are incredibly grateful to Late Vinay Gupta, Department of Physics and Astrophysics University of Delhi for providing his guidance and help for the experiential work.

Conflicts of Interest

The authors declare no conflict of interest.

References

  1. Richardson, T.; Smith, V.C.; Johnstone, R.A.W.; Sobral, A.J.F.N.; Rocha-Gonsalves, A.M.d’.A. Optical response of monolayer flimsof a metal-free sulfonamido-porphyrin. Thin Solid Film 1998, 327–329, 315–320. [Google Scholar] [CrossRef]
  2. Sberveglieri, G. Gas Sensors-Principles, Operation and Developments; Kluwer Academic Publisher: Dordrecht, The Netherlands, 1992. [Google Scholar]
  3. Manera, M.G.; Rella, R. Improved gas sensing performances in SPR sensors by transducers activation. Sens. Actuators B 2013, 179, 175–186. [Google Scholar] [CrossRef]
  4. Bae, M.K.; Lim, J.A.; Kim, S.; Song, Y.W. Ultra-highly sensitive optical gas sensors based on chemomechanical polymer-incorporated fiber interferometer. Opt. Exp. 2013, 21, 2018–2023. [Google Scholar] [CrossRef] [PubMed]
  5. Chen, H.; Zhang, L.; Hu, Y.; Zhou, C.; Lan, W.; Fu, H.; She, Y. Nanomaterials as optical sensors for application in rapid detection of food contaminants, quality, and authenticity. Sens. Actuators B Chem. 2013, 329, 129135. [Google Scholar] [CrossRef]
  6. Pyo, J.; Hong, S.M.; Kwon, Y.S.; Kim, M.S.; Cho, K.H. Estimation of heavy metals using deep neural network with visible and infrared spectroscopy of soil. Sci. Total Environ. 2020, 741, 140162. [Google Scholar] [CrossRef] [PubMed]
  7. Beck, U.; Hertwig, A.; Kormunda, M.; Krause, A.; Kruger, H.; Lohse, V.; Nooke, A.; Pavlik, J.; Steinbach, J. SPR enhanced ellipsometric gas monitoring on thin iron doped tin oxide layers. Sens. Actuators B 2011, 160, 609–615. [Google Scholar] [CrossRef]
  8. El-Basaty, A.B.; El-Brolossy, T.A.; Abdalla, S.; Negm, S.; Abdella, R.A.; Talaat, H. Surface Plasmon Sensors for NO2 gas. Surf. Interface Anal. 2008, 40, 1623–1626. [Google Scholar] [CrossRef]
  9. Wilde, J.N.; Petty, M.C.; Saffell, J.; Tempore, A.; Valli, L. Surface Plasmon Resonance Imaging for gas sensing. Meas. Control 1997, 30, 269–272. [Google Scholar] [CrossRef]
  10. Nikitin, P.I.; Beloglazov, A.A.; Kochergin, V.E.; Valeiko, M.V.; Ksenevich, T.I. Surface plasmon resonance interferometry for biological and chemical sensing. Sens. Actuators B 1999, 54, 43–50. [Google Scholar] [CrossRef]
  11. Bakhshpour, M.; Denizli, A. Highly sensitive detection of Cd (II) ions using ion-imprinted surface plasmon resonance sensors. Microchem. J. 2020, 159, 105572. [Google Scholar] [CrossRef]
  12. Yang, D.; Lu, H.H.; Chen, B.; Lin, C.W. Surface plasmon resonance of SnO2/Au bi-layer films for gas sensing applications. Sens. Actuators B 2010, 145, 832. [Google Scholar] [CrossRef]
  13. Bannov, A.G.; Popov, M.V.; Brester, A.E.; Kurmashov, P.B. Recent advances in ammonia gas sensors based on carbon nanomaterials. Micromachines 2021, 12, 186. [Google Scholar] [CrossRef] [PubMed]
  14. Bielecki, Z.; Stacewicz, T.; Smulko, J.; Wojtas, J. Ammonia gas sensors: Comparison of solid-state and optical methods. Appl. Sci. 2020, 10, 5111. [Google Scholar] [CrossRef]
  15. Available online: www.cdc.gov/niosh/docs (accessed on 1 January 2020).
  16. Maciak, E.; Opilski, Z.; Pustelny, T. Effect of humidity on NH3 gas sensitivity of Nafion/WO3 Sensing structure of SPR sensor. Mol. Quant. Acoust. 2005, 26, 205–215. [Google Scholar]
  17. Dolbec, R.; El Khakani, M.A. Pulsed laser deposited Platinum and gold nanoparticles as catalyst for enhancing the CO sensitivity of nanostructured SnO2 sensors. Sens. Lett. 2005, 3, 216–221. [Google Scholar] [CrossRef]
  18. Kishnani, V.; Verma, G.; Pippara, R.K.; Yadav, A.; Chauhan, P.S.; Gupta, A. Highly sensitive, ambient temperature CO sensor using tin oxide-based composites. Sens. Actuators A Phys. 2021, 332, 113111. [Google Scholar] [CrossRef]
  19. Wei, L.; Xia, Y.; Meng, J. A novel tin oxide sensor and gas detection performance in asphalt. J. Nanoelectron. Optoelectron. 2018, 13, 1290–1294. [Google Scholar] [CrossRef]
  20. Tabish, M.; Malik, M.U.; Khan, M.A.; Yasin, G.; Asif, H.M.; Anjum, M.J.; Nazir, M.T. Construction of NiCo/graphene nanocomposite coating with bulges-like morphology for enhanced mechanical properties and corrosion resistance performance. J. Alloys Compd. 2021, 867, 159138. [Google Scholar] [CrossRef]
  21. Zhang, S.; Wang, X.; Huang, Y.; Zhai, H.; Liu, Z. Ammonia sensing properties of perylene diimides: Effect of core- substituted chiral groups. Sens. Actuators B Chem. 2018, 254, 805–810. [Google Scholar] [CrossRef]
  22. Ali, S.; Jameel, M.A.; Oldham, G.; Gupta, A.; Shafiei, M.; Langford, S.J. Enhancement in room temperature ammonia sensing properties of naphthalene diimides through core expansion. J. Mater. Chem. C 2022, 10, 1326–1333. [Google Scholar] [CrossRef]
  23. Miller, D.R.; Akbar, S.A.; Morris, P.A. Nanoscale metal oxide-based heterojunctions for gas sensing: A review. Sens. Actuators B Chem. 2014, 204, 250–272. [Google Scholar] [CrossRef]
  24. Yan, H.; Zhang, L.; Shen, J.; Chen, Z.; Shi, G.; Zhang, B. Synthesis property and field-emission behaviour of amorphous polypyrrole nanowires. Nanotechnology 2006, 17, 3446–3450. [Google Scholar] [CrossRef]
  25. Cho, J.H.; Yu, J.B.; Kim, J.S.; Sohn, S.O.; Lee, D.D.; Huh, J.S. Sensing behaviours of polypyrrole sensor under humidity condition. Sens. Actuator B 2005, 108, 389–392. [Google Scholar] [CrossRef]
  26. Arora, K.; Chaubey, A.; Singhal, R.; Singh, R.P.; Pandey, M.K.; Samanta, S.B.; Malhotra, B.D.; Chand, S. Application of electrochemically prepared polypyrrole–polyvinyl sulphonate films to DNA biosensor. Biosens. Bioelectron. 2006, 21, 1777–1783. [Google Scholar] [CrossRef]
  27. Yadav, A.A.; Lokhande, A.C.; Kim, J.H.; Lokhande, C.D. Enhanced sensitivity and selectivity of CO2 gas sensor based on modified La2O3 nanorods. J. Alloys Comp. 2017, 723, 880–886. [Google Scholar] [CrossRef]
  28. Heavens, S. Optical Properties of Thin Solid Films; Butterworth: London, UK, 1955; Chapter 4. [Google Scholar]
  29. Paliwal, A.; Sharma, A.; Tomar, M.; Gupta, V. Optical properties of WO3 thin films using surface plasmon resonance technique. J. App. Phys. 2014, 115, 043104. [Google Scholar] [CrossRef]
  30. Chougule, M.A.; Dalavi, D.S.; Mali, S.; Patil, P.S.; Moholkar, A.V.; Agawane, G.L.; Kim, J.H.; Sen, S.; Patil, V.B. Novel method for fabrication of room temperature polypyrrole-ZnO nanocomposite No2 sensor. Measurement 2012, 45, 1989–1996. [Google Scholar] [CrossRef]
  31. Singh, N.K.; Shrivastava, S.; Rath, S.; Annapoorni, S. Optical and room temperature sensing properties of highly oxygen deficient flower-like ZnO nanostructures. Surf. Sci. 2010, 257, 1544–1549. [Google Scholar] [CrossRef]
  32. Hieu, N.V.; Quang, V.V.; Hoa, N.D.; Kim, D. Preparing large-scale WO3 nanowire-like structures for high sensitivity NH3 gas sensor through a simple route. Curr. Appl. Phys. 2011, 11, 657–661. [Google Scholar] [CrossRef]
  33. Kanan, S.M.; El-Kadri, O.M.; Abu-Yousef, I.A.; Kanan, M.C. Semiconducting metal oxide based sensors for selective gas pollutant detection. Sensors 2009, 9, 8158–8196. [Google Scholar] [CrossRef]
  34. Mishra, S.K.; Tripathi, S.N.; Choudhary, V.; Gupta, B.D. SPR based fibre optic ammonia gas sensor utilising nanocomposite film of PMMA/educed graphene oxide prepared by in situ polymerization. Sens. Actuators B Chem. 2014, 199, 190–200. [Google Scholar] [CrossRef]
  35. Mishra, S.K.; Bhardwaj, S.; Gupta, B.D. Surface plasmon resonance-based fibre optic sensor for the detection of low concentrations of ammonia gas. IEEE Sens. J. 2014, 15, 1235–1239. [Google Scholar] [CrossRef]
Figure 1. Theoretically simulated SPR reflectance curves for prism/Au/air, prism/Au/SnO2/air, and prism/Au/SnO2/PPy/air.
Sensors 22 07252 g001
Figure 2. (Prism + Au + SnO2 + PPy + air) Multilayered systems’ Theoretically simulated SPR reflectance curves by varying the thickness of SnO2 and variation of resonance angle and minimum reflectance with the thickness of SnO2.
Sensors 22 07252 g002
Figure 3. (a) (Prism + Au + SnO2 + PPy + air) Multilayered systems’ SPR reflectance curves with variable PPy thickness, resonance angle and minimum reflectance with variable SnO2 thickness, (b) heat map showing the colored variation for optimizing the thicknesses of SnO2 and PPy thin films.
Sensors 22 07252 g003
Figure 4. (a) Characterisation studies of SnO2/PPy nanocomposite thin film including XRD and AFM studies, (b) Schematic of the gas sensor system, (c) SPR reflectance measurements were made for the (prism + Au + SnO2 + PPy + NH3) Multi-layered structure after exposure to NH3 gas at various concentrations.
Sensors 22 07252 g004
Figure 5. Variation of (a) SPR dip angle (θSPR), (b) Rmin, and (c) FWHM for the SPR sensing system with different concentration of NH3 gas.
Sensors 22 07252 g005
Figure 6. (a) Changes in the effective index of the (SnO2 + PPy) interface caused by the adsorption of NH3 gas with increasing concentration, and (b) changes in the refractive index up to a concentration of 10 ppm.
Sensors 22 07252 g006
Figure 7. (a) SPR reflectance curves for prism/Au/SnO2/PPy structure on exposure to 10 ppm concentration of NH3 gas under varying humidity conditions, and (b) Resonance angle (θspr)(as shown by red dot) and Minimum Reflected Intensity (Rmin)(as shown by black box) variation with relative humidity.
Sensors 22 07252 g007
Figure 8. (a) Transient response of SPR sensor (prism + Au + SnO2 + PPy) system, (b) the calibration curve of the SPR sensor towards NH3 gas, and linear variation of change in reflectance with increasing concentration of NH3 gas.
Sensors 22 07252 g008
Figure 9. Response characteristics of the prepared sensor.
Sensors 22 07252 g009
Table 1. Values of FWHM with thickness of SnO2 thin film.
Thickness of SnO2 (in nm) Full Width Half Maximum (FWHM)
1001.2
200
300
400
2.0
3.8
7.2
Table 2. Values of FWHM with thickness of PPy thin film.
Thickness of PPy (in nm) Full Width Half Maximum (FWHM)
1002.1
200
300
400
3.0
1.5
4.0
Publisher’s Note: MDPI stays neutral with regard to jurisdictional claims in published maps and institutional affiliations.

