
Hydrogen Peroxide and Dopamine Sensors Based on Electrodeposition of Reduced Graphene Oxide/Silver Nanoparticles

1
School of Biomedical Engineering, Faculty of Medicine, Dalian University of Technology, Dalian 116024, China
2
Liaoning Key Lab of Integrated Circuit and Biomedical Electronic System, Dalian University of Technology, Dalian 116024, China
*
Author to whom correspondence should be addressed.
Sensors 2024, 24(2), 355; https://doi.org/10.3390/s24020355
Submission received: 20 November 2023
/
Revised: 24 December 2023
/
Accepted: 5 January 2024
/
Published: 7 January 2024
(This article belongs to the Special Issue Research Progress in Electrochemical Aptasensors and Biosensors)
Abstract
:In this work, silver nanoparticles (AgNPs)/reduced graphene oxide (rGO) nanocomposites were electrodeposited on glassy carbon electrodes (GCE) to construct electrochemical sensors for the detection of hydrogen peroxide (H2O2) and dopamine (DA). The AgNPs were synthesized on graphene oxide (GO) by the hydrothermal method, followed by the reduction of the GO during the electrodeposition process, resulting in the formation of the nanocomposites on the surface of the electrodes. The generation of AgNPs on the graphene sheets was verified by scanning electron microscopy (SEM) and electrochemical impedance spectroscopy (EIS). The AgNPs/rGO/GCE showed a linear response to H2O2 in the range of 5 μM to 620 μM, with a sensitivity of 49 μA mM−1cm−2 and a limit of detection (LOD) of 3.19 μA. The linear response of the AgNPs/rGO/GCE to DA ranged from 1 μM to 276 μM, the sensitivity was 7.86 μA mM−1cm−2, and the LOD was 0.18 μM. Furthermore, DA and H2O2 were detected simultaneously in the same solution without interferences, and the sensors displayed good stability over time. The preparation method for the sensors is relatively eco-friendly, convenient, and efficient, exhibiting great potential for sensitive detection of DA and H2O2.
1. Introduction
Electrochemical biosensors can be divided into enzymatic and non-enzymatic biosensors. Enzymes are proteins or RNAs produced by living cells with high specificity and catalytic efficiency for their substrates. Therefore, enzyme-based biosensors are usually highly selective and sensitive. However, since the catalytic performance of an enzyme depends on its own spatial structure, changes in the external environment may lead to decreased efficiency of enzymatic biosensors due to enzyme inactivation. Consequently, non-enzymatic electrochemical sensors have received considerable attention in practical applications [1]. In recent years, nanocomposites using graphene as the electrochemical substrate and metal nanoparticles to provide catalytic activity have also attracted much attention in the field of non-enzymatic electrochemical sensors.
Graphene, a single-atom-thick planar sheet composed of sp2-bonded carbon atoms, has attracted much attention due to its unique electrical, mechanical, thermal, and optical properties, thereby holding great promise in many advanced technologies, such as nanoelectronics, sensors, capacitors, and composites [2,3,4,5,6,7,8,9]. The favorable properties of graphene, such as high conductivity, a large surface-to-volume ratio, and excellent chemical resistance, make it an attractive substrate for composite materials. Accordingly, metal nanoparticle-decorated graphene composites have become the focus of research in recent years. Silver nanoparticle-modified graphene composites, in particular, have been extensively studied due to their effectiveness in a range of applications, including surface-enhanced Raman scattering substrates, catalysis, and antibacterial properties [10,11,12,13].
H2O2 is a widely used oxidant that can be produced as a by-product of most oxidases. It is widely used as a disinfectant in different chemical industries and an essential intermediate in many biological reactions, so its detection is receiving increasing attention [14,15,16]. Therefore, there is great interest in the fabrication of cost-effective, rapid, selective, sensitive, and stable H2O2 sensors. A number of techniques have been designed to estimate H2O2 concentrations, but most have disadvantages, including their requiring expensive instrumentation, low selectivity, low sensitivity, or being time-consuming [17,18,19].
DA is a major catecholamine neurotransmitter that plays a vital role in the cardiovascular and central nervous systems. The concentration level of DA in the body can affect the physical health status of people. High DA levels can lead to cardiotoxicity, further leading to increased heart rate, hypertension, and heart failure [20]. In contrast, low levels of DA in the central nervous system are thought to be a major cause of several neurological disorders, such as Parkinson’s disease, schizophrenia, and Alzheimer’s disease [21]. The level of dopamine in the human body is affected by the concentration of dopamine precursors, so the detection of dopamine precursors such as phenylalanine and tyrosine has become popular [22,23,24]. Direct measurement of DA levels is also crucial for understanding the biological functions and processes involved.
Hydrogen peroxide and dopamine are commonly used analytes in biosensor technology because of their importance in their respective fields. Silver nanomaterials are widely used in electrochemical detection, and recently Rayhane et al. successfully fabricated H2O2 sensors using prepared silver nanoplate [25]. However, compared with the metal particles themselves, GO and silver nanoparticles are more widely used because GO can provide abundant growth sites for metal nanoparticles, and their complexes are more stable. Wang et al. used a one-pot method in 2013 to prepare nano-silver-modified rGO for H2O2 detection with good sensitivity [26]. In 2015, Yang et al. synthesized a nanocomposite AgNPs–Tween–GO where TWEEN80 was employed as a modifier of the GO and a stabilizer of the AgNPs. Possibly due to the participation of the TWEEN80, which resulted in the average size and better stability of the silver nanoparticles, the modified electrode obtained by simple drop addition had a linear response to H2O2 in the range of 0.02 to 23.1 mM. One downside to this approach was that it necessitated specific limiting conditions of high pressure and high temperature during the preparation of the silver nanoparticles [27]. In a recent study, AgNPs were immobilized on the surface of MoS2–GO to selectively detect DA in the presence of uric acid and ascorbic acid without reporting the continuous detection performance and repeatability [28].
Here, we report a rapid and eco-friendly approach for the fabrication of AgNPs/rGO-based biosensors. The AgNPs/GO was first prepared using the hydrothermal method, and the growth of the AgNPs on graphene sheets was examined by SEM and EIS. The AgNPs/GO was converted to AgNPs/rGO by electrodeposition and modified on the surface of the electrode to prepare the sensor. The sensor can detect DA and H2O2, with the sensitivity, detection limit, and linear range being tested by electrochemical methods. This facile, fast, and eco-friendly methodology produced sensors that were highly sensitive and stable for DA and H2O2 detection.
2. Materials and Methods
2.1. Materials and Reagents
GO solution (GO, 1.27 wt%) was purchased from Chengdu Organic Chemicals Co., Ltd. (Chengdu, China). Anhydrous sodium citrate (C5H5O7Na3, ≥99%), NaCl (99.5%), and silver nitrate solution (AgNO3, 0.5 M) were purchased from Shanghai Aladdin Biochemical Technology Co., Ltd. (Shanghai, China). Hydrogen peroxide (H2O2, 30%) was purchased from Tianjin Kemiou Chemical Reagent Co., Ltd. (Tianjin, China). Dopamine hydrochloride (DA, 98%), KCl (99.5%), glucose (99%), and ethanol (C2H6O, 99.7%) were purchased from Shanghai Macklin Biochemical Technology Co., Ltd. (Shanghai, China). Phosphate buffer solution (PBS) was purchased from Beijing Solarbo Science & Technology Co., Ltd. (Beijing, China). Uric Acid (UA, 98%) was purchased from Bide Pharmatech Co., Ltd. (Shanghai, China).
2.2. Apparatus
CV and amperometric measurements were performed on a CHI1040C electrochemical workstation (Shanghai Chenhua Co. Ltd., China). EIS experiments were performed on a CHI660E electrochemical workstation (Shanghai Chenhua Co., Ltd., Shanghai, China). All the electrochemical experiments were performed using a standard three-electrode system consisting of a 3 mm diameter glassy carbon electrode as the working electrode, an Ag/AgCl electrode as the reference electrode, and a Pt wire electrode as the counter electrode. The SEM was undertaken using a NOVA NanoSEM 450 for the characterization of surface morphology. The AgNPs/GO was characterized using an X-ray diffractometer (XRD; D/MAX-2400, Rigaku, The Woodlands, TX, USA) and a UV-Vis spectrophotometer (Evolution 201, Thermo Scientific, Waltham, MA, USA).
2.3. Preparation of AgNPs/GO Composites
The AgNPs/GO was synthesized according to a reported method with slight modifications [29]. Briefly, 100 μL of 5 mM AgNO3 was mixed with 300 μL of 12.7 mg/mL GO in 2.6 mL ultrapure water. The solution was then ultrasonically dispersed for half an hour. Afterward, the mixture was added to 17 mL ultrapure water, which had been heated to 60 °C and stirred magnetically for 4 h. The mixed solution was magnetically stirred at 60 °C for 2 h after adding 14.8 mg of sodium citrate. Subsequently, the AgNPs/GO composite solution was obtained.
2.4. Preparation of AgNPs/rGO Modified GCE
The GCE (3 mm in diameter) was polished with 1.0, 0.3, and 0.05 µm alumina powders on a polishing cloth and rinsed with deionized water, followed by sonication in ethanol and deionized water, in turn, and allowed to dry at room temperature. The polished electrode should not be left exposed to air for an extended period. The polished glassy carbon electrode was placed in 5 mL of an AgNPs/rGO complex solution and electrodeposited with a standard three-electrode system at a voltage of −1.3 V for 600 s to obtain AgNPs/rGO/GCE. For comparison, GO/GCE was prepared by drop addition, while rGO/GCE was prepared by electrodeposition.
3. Results
3.1. The Growth of AgNPs on GO
Figure 1A shows the photos of a mixed solution of AgNO3 and GO containing sodium citrate before and after heating. It can be seen that the color of the mixed solution of AgNO3 and GO changed from light yellow to brown-black after heating. The change in the color of the solution indicated that the composition of the solution had changed. To further demonstrate the growth of AgNPs on the surface of graphene sheets and to analyze the microstructure characteristics of the AgNPs/rGO composites, the AgNPs/rGO composites were electrodeposited on glassy carbon sheets and examined by SEM. For comparison, the glassy carbon sheet modified by GO was prepared using the drop addition method. The sheet structure with wrinkles that illustrated the fundamental feature of graphene was observed in both the rGO and AgNPs/rGO samples (Figure 1B,C). This suggested that the preparation process of AgNPs/rGO did not damage the GO structure. Moreover, the growth of AgNPs on the graphene sheets was observed, demonstrating the successful electrodeposition of AgNPs/rGO on the glassy carbon surface (Figure 1C).
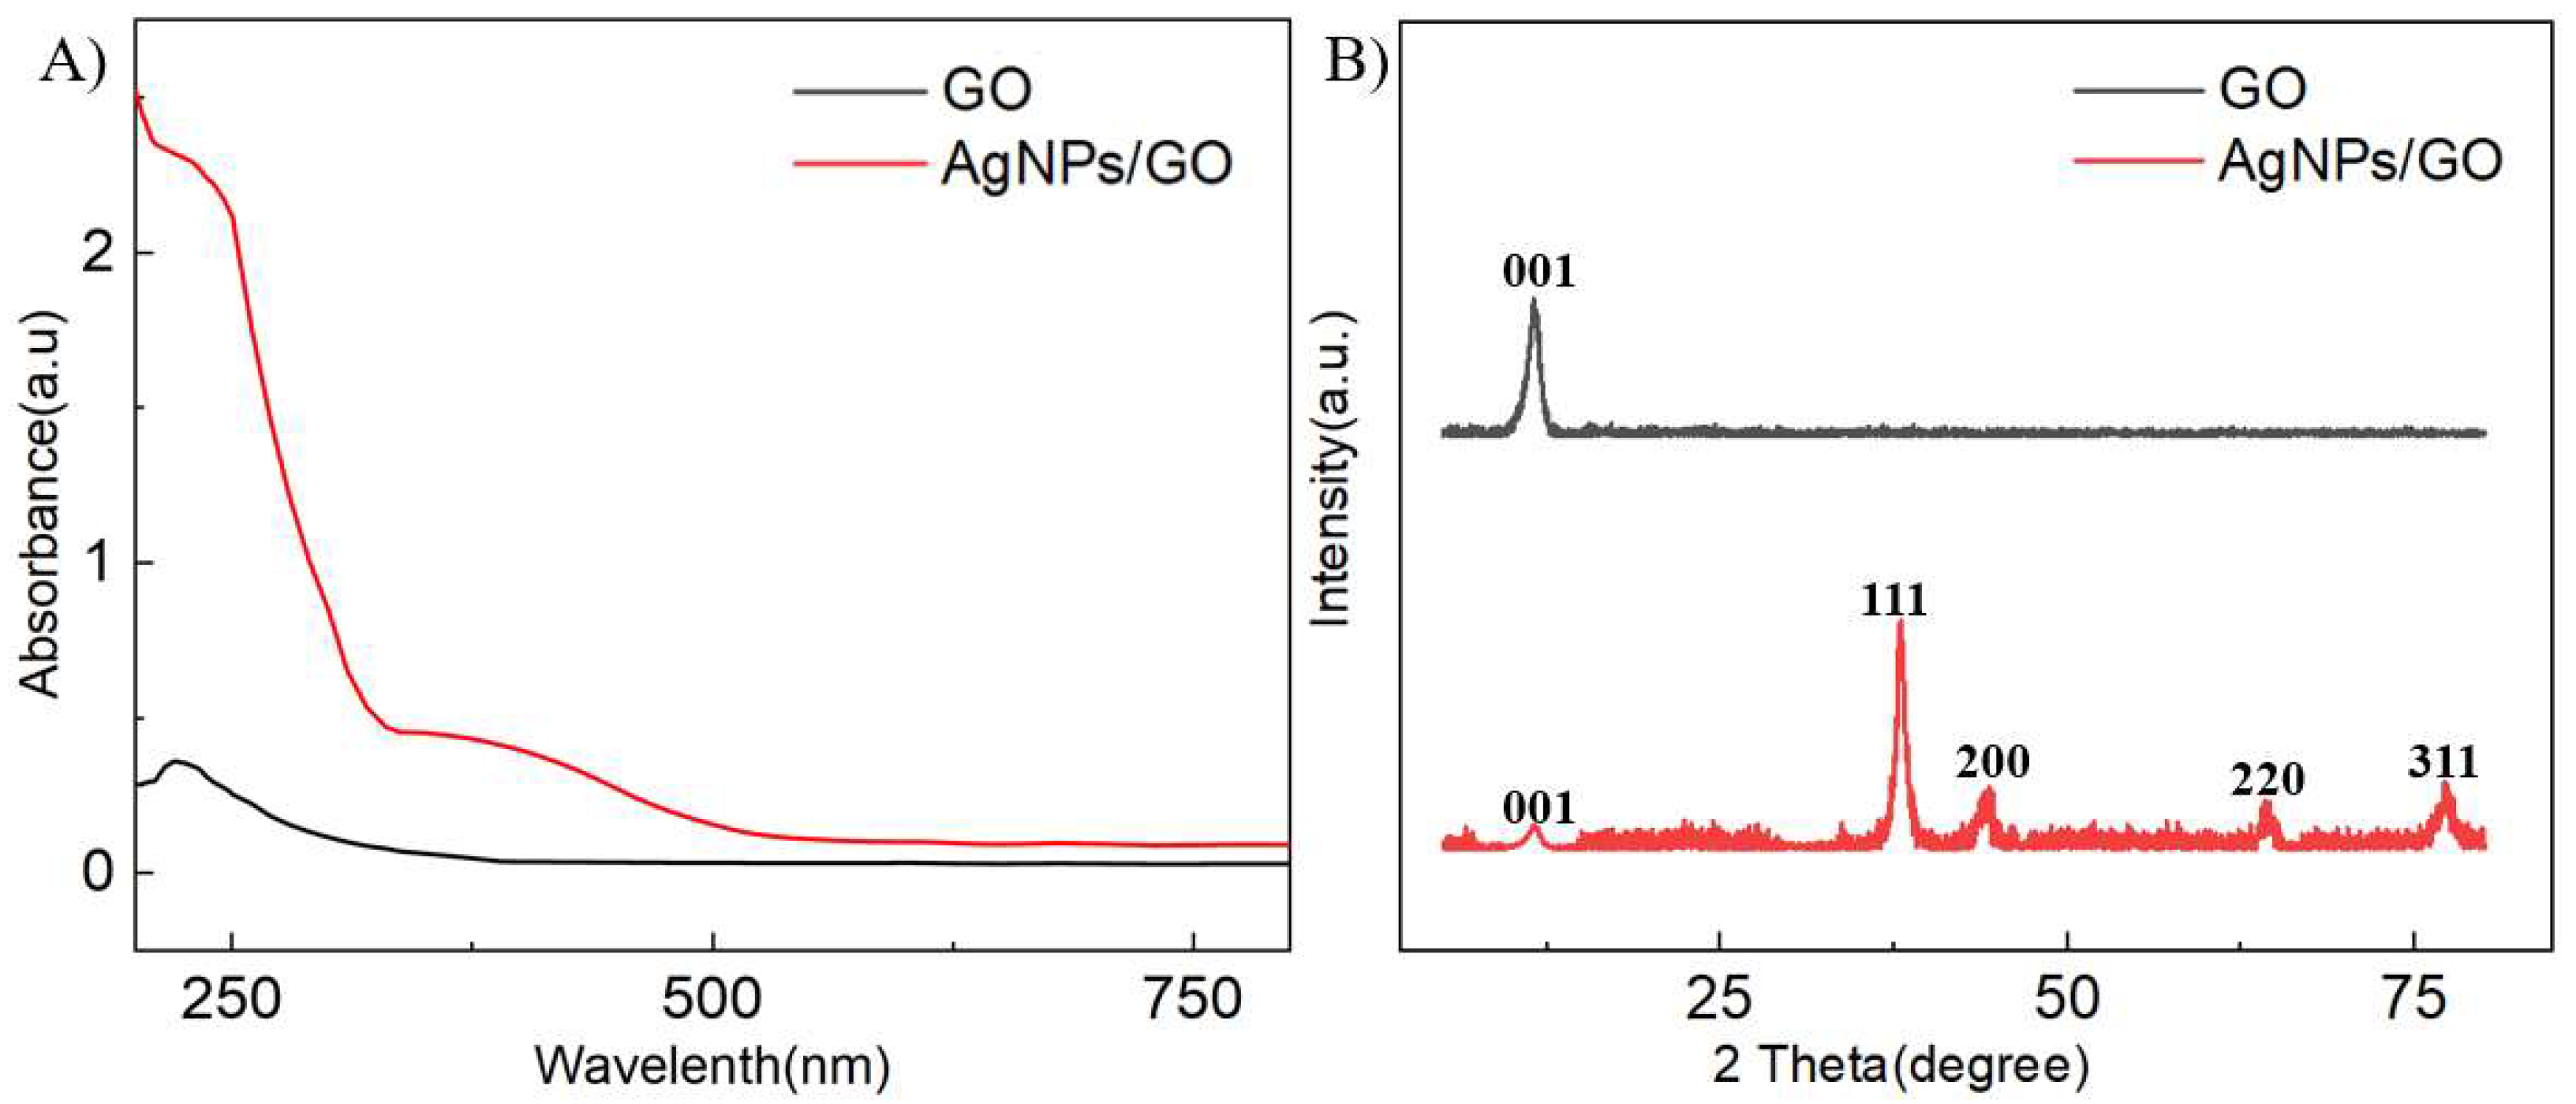
To further explore the composition of the complex, UV-Vis and XRD analysis of the complex solution were performed. As shown in Figure 2A, the GO and AgNPs/GO were characterized by UV-Vis spectroscopy. The GO exhibited a characteristic peak at around 230 nm, corresponding to the π-π* transition of C=C [30]. The observation of a shoulder peak at 230 nm in the AgNPs/GO sample indicated that the GO structure remained intact during the AgNPs growth. Furthermore, the AgNPs/GO also displayed a peak at approximately 427 nm, which accounted for the characteristic surface plasmon resonance of the AgNPs with λmax within 400–500 nm [31]. XRD was applied to analyze the characteristics of the GO and AgNPs/GO powder samples, including the crystalline phase, morphology, and microstructure. Figure 2B depicts the typical characteristic (002) peak at 10.81° of GO. Compared with the GO, the (002) peak of the AgNPs/GO displayed a decreasing trend, attributable to the growth of AgNPs on the surface of the graphene nanosheets, which hindered the re-stacking of the graphene nanoplates [32,33]. Moreover, the AgNPs/GO had newly indexed peaks at 38.1°, 44.3°, 64.4°, and 77.4°, reflecting the cubic phase of Ag (PDF card number: 00-001-1167). The results of the UV-Vis and XRD showed that AgNPs were successfully grown on the surface of the graphene sheet, and the 2D nanostructure of GO was still present.
3.2. Electrochemical Characterization of AgNPs/rGO/GCE
The electrochemical properties of the surface-modified GCE were analyzed using EIS, performed in 20 mM [Fe(CN)6]3−/4−, 0.1 M KCl over a frequency range of 106 Hz to 10 Hz. Nyquist plots of GCE, GO/GCE, rGO/GCE, and AgNPs/rGO/GCE are shown in Figure 3A, where the diameter of the semicircle indicates the charge transfer resistance (Rct). The rise in Rct after GO modification (GO/GCE) on the surface of the GCE could be attributed to decreased conductivity caused by excessive oxygen-containing groups on the surface of the GO. Therefore, after the electric reduction of the GO (rGO/GCE), the reduction of oxygen-containing groups on the surface led to a sharp increase in the overall conductivity of the electrode and a decrease in Rct. The growth of AgNPs on the graphene sheet increased the specific surface area of the electrode and promoted electron transfer, thereby lowering the Rct of AgNPs/rGO/GCE. The analysis of AgNPs/rGO/GCE, rGO/GCE, GO/GCE, and GCE by EIS indicated that AgNPs grew on the graphene and that AgNPs/rGO/GCE was successfully electrodeposited on the surface of the GCE.
CV tests were conducted on the modified electrodes to further investigate the electrochemical properties of AgNPs/rGO/GCE. When immersed in PBS and subjected to CV scanning at a voltage range spanning from −0.5 V to 0.4 V, the AgNPs/rGO/GCE exhibited an oxidation peak at 0.15 V, which represented the characteristic peak of silver nanoparticles, thereby demonstrating the growth of AgNPs on the GO surface. Moreover, it could be seen that the AgNPs/rGO/GCE had a tiny reduction peak at 0 V, indicating the reduction peak of Ag2O. Additionally, the reduction peak at −0.4 V might correspond to the reaction of oxygen in the solution catalyzed by AgNPs. The obtained CV curves remained stable over 30 cycles (Figure S1), suggesting the good electrochemical stability of AgNPs/rGO/GCE.
3.3. The Changes in Specific Surface Area
To analyze the changes in the specific surface area of the GCE after modification with AgNPs/rGO, the CV of the GCE and AgNPs/rGO/GCE were tested in a solution containing 20 mM K3[Fe(CN)6], 0.1M KCl, from −0.2 V to 0.8 V, with the scanning speed varied from 0.02 V/s to 0.2 V/s. With the Randles–Sevcik equation, , the specific surface area of each electrode was calculated. The specific surface area of the modified material is measured in A/(cm2), while the concentration of the redox mediator is given in C/(mol·cm−3). The cyclic voltammetry rate is represented as V/(V · S−1), and D/(cm2/s) is the diffusion coefficient. The peak current is Ip/(A), and n refers to the number of transferred electrons. The diffusion coefficient, D, of K3[Fe(CN)6] is 7.6 × 10⁻⁶ cm2s−1. The detailed CV test results at varying scanning speeds of the GCE and AgNPs/rGO/GCE are shown in Figures S2 and S3. The CV peak current of the AgNPs/rGO/GCE was observed to be greater than that of the GCE. The peak currents were fitted to the scan rate to obtain Figure S4. The electroactive area of the AgNPs/rGO/GCE was calculated to be 24.8 mm2.
Figure S5A shows the CV curves of the AgNPs/rGO/GCE at different scan rates. PBS was chosen as the supporting electrolyte to obtain the maximum sensitivity of the sensor. As can be seen from the figure, the potential and peak current depend on the scan rate. The peak cathode current increased linearly as the scan rate increased from 20 to 200 mV s−1, with a correlation coefficient of 0.973 (Figure S5B), indicating that the redox process of the fabricated bio-nanocomposites was a surface-controlled process.
3.4. The Detection of H2O2 by AgNPs/rGO/GCE
Based on the previously reported mechanism [34,35,36], the electrocatalytic reaction of H2O2 on the electrocatalyst occurred according to the following mechanism:
According to the first equation, the H2O2 that was adsorbed on the AgNPs gained an electron, producing (OH)ads and OH−. Subsequently, the (OH)ads received another electron from the AgNPs and produced H2O. The reduction rate here depended mainly on the adsorption of H2O2 on the electrocatalyst surface and the transfer of electrons from the electrocatalyst to (OH)ads. Therefore, the enhanced adsorption and electron transfer properties of the electrocatalyst are necessary for the electrocatalytic reduction of H2O2.
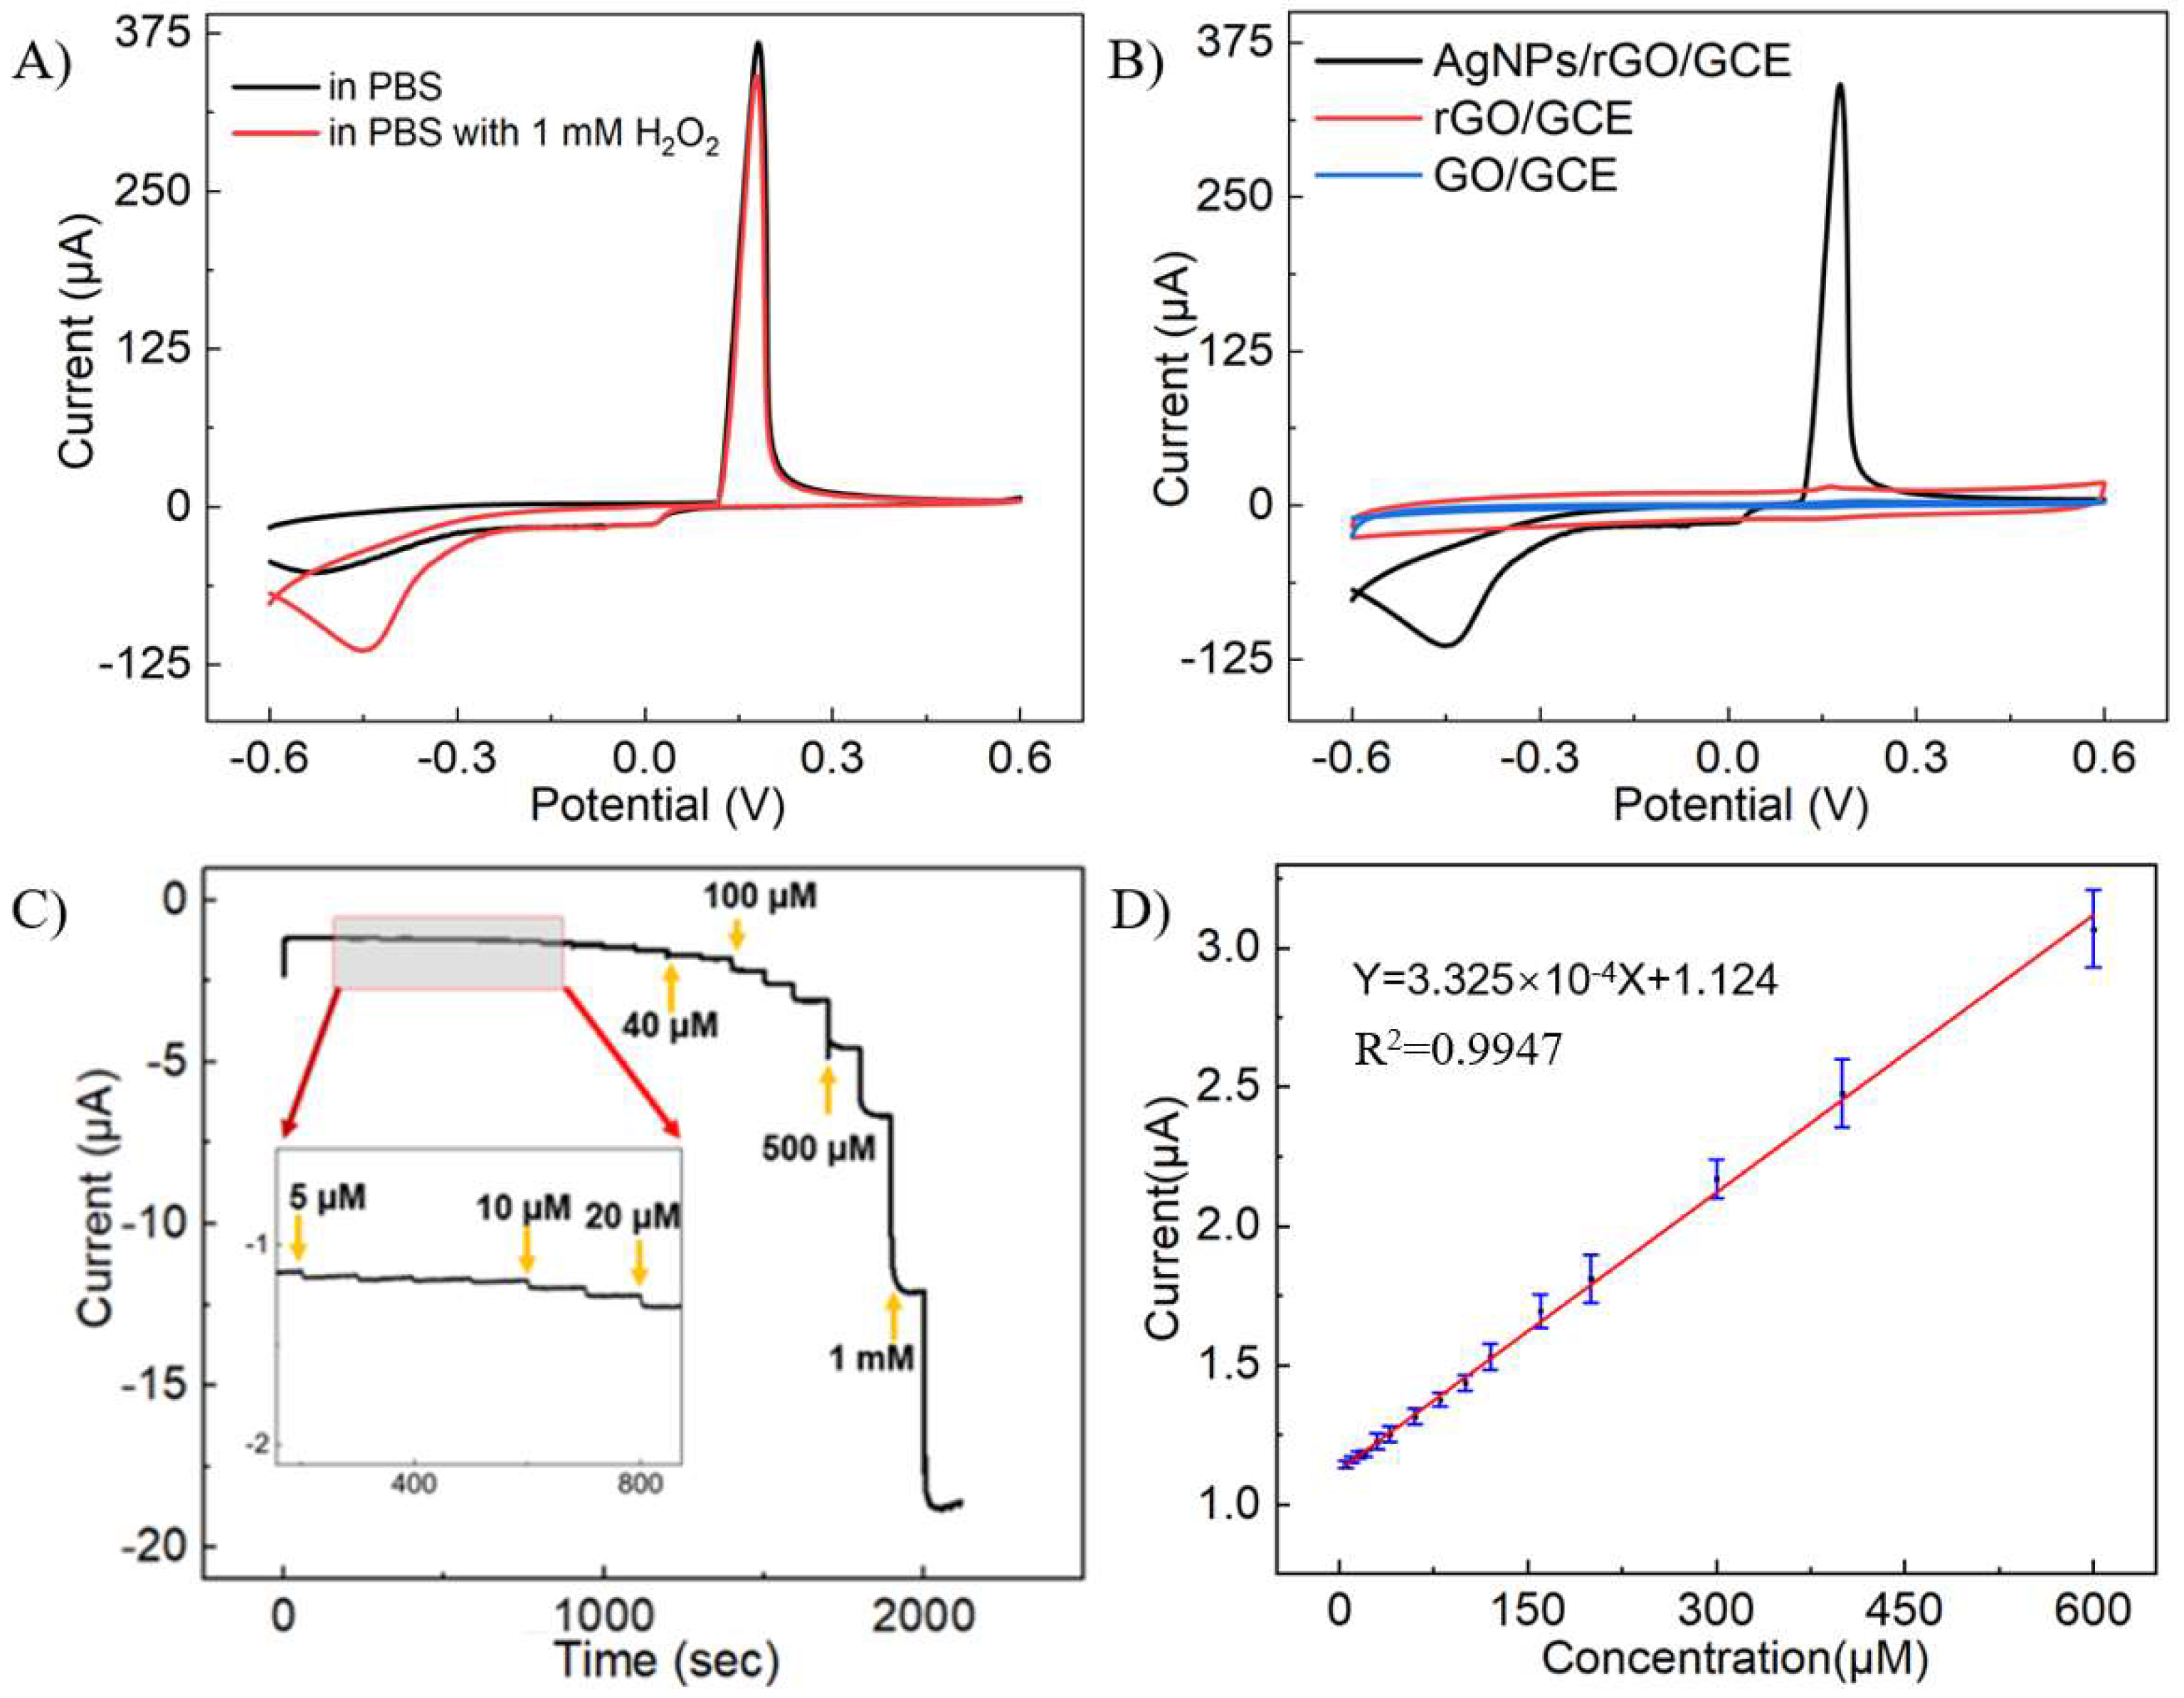
To verify the catalytic effect of AgNPs on H2O2 reduction, CV tests were conducted on GO/GCE, rGO/GCE, and AgNPs/rGO/GCE in PBS solution containing 1 mM H2O2. Upon the addition of 1 mM H2O2, there was a significant current peak at around −0.35 V, accounting for H2O2 reduction catalyzed by AgNPs compared with AgNPs/rGO/GCE in PBS solution without H2O2 (Figure 4A). On the contrary, GO/GCE and rGO/GCE barely responded to H2O2, as illustrated in Figure 4B. This indicated that the presence of AgNPs facilitated the transfer of electrons to H2O2 during the electrocatalytic reduction. The role of AgNPs in this process was to increase the specific surface area of the electrode and catalyze the reaction of H2O2, which enhances the electron transfer kinetics during its electrocatalytic reduction. Upon successively introducing H2O2 into the system, the amperometric responses of the AgNPs/rGO/GCE were examined at −0.3 V. The AgNPs/rGO/GCE displayed responses to H2O2 in a wide range, from 5 μM to 3.62 mM, and a response time (t95) of around 3 s (Figure 4C). The response current increased linearly with H2O2 concentration between 5 μM and 620 μM, with an R2 of 0.998. The sensitivity was calculated to be 49 μA mM−1cm−1, and the LOD was estimated to be 3.19 μM (S/N = 3).
3.5. The Detection of DA by AgNPs/rGO/GCE
CV measurements with a voltage spanning from −0.6 V to 0.6 V and a scanning rate of 100 mV·s−1 were conducted on AgNPs/rGO/GCE in PBS solution containing 4 mM DA to explore the optimal detection voltage for DA. Upon adding 4 mM DA, there was an oxidation peak at 0.5 V and a reduction peak at −0.45 V, indicating that the AgNPs catalyzed DA reduction in comparison to AgNPs/rGO/GCE in a PBS solution lacking DA (Figure 5A). In contrast, GO/GCE and rGO/GCE showed minimal response to DA, as illustrated in Figure 5B.
In order to have a better signal-to-noise ratio of the system, the amperometric test was conducted at a voltage of 0.25 V. Figure 5C illustrates the current changes in the system when various concentrations of DA were added, and the AgNPs/rGO/GCE responded to the DA in a wide range, from 1 μM to 776 μM. It was observed that the current response swiftly rose to a stable level within 3 s after adding DA, suggesting a quick response rate of the system. Figure 5D exhibits the curve fitting of the response current to the concentration. The linear response range of the system was from 1 μM to 276 μM (R2 = 0.997). The sensitivity was calculated as 7.86 μA mM−1cm−1, and the LOD for DA was estimated to be 0.18 μM (S/N = 3).
The CV curves of AgNPs/rGO/GCE responded at both 0.5 V and −0.45 V after the addition of DA. However, the AgNPs/rGO/GCE had no obvious current response when the amperometric tests were applied to detect DA at any voltage ranging from −0.2V to −0.6V. In terms of the report from Chen et al., AgNPs-modified GCE would have a reduction peak from −0.4 V to −0.6 V in the oxygenated solution [37]. Therefore, it was speculated that when DA was added, oxygen catalyzed the reaction of DA, resulting in a reduction peak of CV at this voltage. However, the oxygen in the solution would soon be exhausted, as amperometric tests would take a long period, and as a result, the reduction peak was unsuitable for monitoring DA in the amperometric tests.
Table 1 and Table 2 show the sensors used to detect H2O2 and DA in recent years. The sensor performance prepared in this paper was comparable to the sensors previously reported, and the preparation process was convenient, green, and fast. It is worth mentioning that Golsheikh et al. electrodeposited AgNPs-rGO onto an ITO electrode surface in one step by applying CV to the mixed solution of [Ag(NH3)2OH] and GO in 2013 [37]. Their method of preparing the sensor was also very convenient, but the LOD of the prepared sensor was high.
3.6. Interference and Stability
To investigate the anti-interference performance of AgNPs/rGO/GCE on detecting DA and H2O2 simultaneously, amperometric tests were conducted at 0.25 V and −0.3 V, respectively, and the results are shown in Figure 6. The AgNPs/rGO/GCE displayed negligible current response after the addition of NaCl, KCl, glucose, and UA compared with the sharp response to H2O2 at −0.3 V or to DA at 0.25 V. Importantly, the presence of H2O2 or DA did not interfere with the detection of the other.
To demonstrate the stability and utility of the method, we also evaluated the precision and long-term stability of the AgNPs/rGO/GCE. Eight sensors modified with AgNPs/rGO by the same method were prepared, and the peak currents of CV in PBS solution containing 1 mM H2O2 for each electrode were recorded. As shown in Figure 7A, a relative standard deviation of 1.7% for the eight electrodes was obtained, indicating a high reproducibility of our method for preparing sensor electrodes. In addition, these electrodes were used to measure the peak current at weekly intervals for 6 weeks to test the long-term stability. When not in use, the electrodes were immersed in PBS and placed at 4 °C. The sensitivity still maintained around 75% of the initial value after 6 weeks (Figure 7B), demonstrating good stability of the sensors. Similar results were obtained for DA detection using AgNPs/rGO/GCE (Figure 7C,D). The relative standard deviation of DA detection was 1.81%. After 6 weeks, the current response of the sensors to DA remained at 62.4% of the initial value.
4. Conclusions
In this work, AgNPs/GO composites were prepared in solution, followed by the electrodeposition of AgNPs/rGO on the surface of GCE to obtain AgNPs/rGO/GCE. The modification of AgNPs/rGO on GCE effectively increased the specific surface area of the GCE and gave the GCE the capacity to respond to H2O2 and DA, respectively. The sensors exhibited high sensitivity, a wide linear range, low detection limit, excellent reproducibility, and relatively good long-term stability for both H2O2 and DA. Besides, the AgNPs/rGO/GCE responded to H2O2 and DA at different voltages and could detect them simultaneously. This convenient and eco-friendly method might have great potential for sensor preparation for multiple target detection.
Supplementary Materials
The following supporting information can be downloaded at: https://www.mdpi.com/article/10.3390/s24020355/s1.
Author Contributions
Conceptualization, H.Z. and B.L.; methodology, Y.Z. and N.L.; software, Y.Z.; validation, Y.Z. and H.Z.; formal analysis, Y.Z.; investigation, Y.Z.; resources, B.L. and H.Z.; writing—original draft preparation, Y.Z.; writing—review and editing, N.L. and H.Z.; visualization, Y.Z.; supervision, B.L. and H.Z.; project administration, H.Z.; funding acquisition, B.L. and H.Z. All authors have read and agreed to the published version of the manuscript.
Funding
This work was supported by the National Key R&D Program of China (2018AAA0100300) and the Fundamental Research Funds for the Central Universities (DUT22YG238).
Institutional Review Board Statement
Not applicable.
Informed Consent Statement
Not applicable.
Data Availability Statement
Data are contained within the article and Supplementary Materials.
Acknowledgments
The authors acknowledge the assistance of the DUT Instrumental Analysis Center.
Conflicts of Interest
The authors declare no conflicts of interest.
References
- Shu, Y.; Li, B.; Xu, Q.; Gu, P.; Xiao, X.; Liu, F.; Yu, L.; Pang, H.; Hu, X. Cube-like CoSn(OH)6 nanostructure for sensitive electrochemical detection of H2O2 in human serum sample. Sens. Actuators B Chem. 2017, 241, 528–533. [Google Scholar] [CrossRef]
- Balandin, A.A.; Ghosh, S.; Bao, W.; Calizo, I.; Teweldebrhan, D.; Miao, F.; Lau, C.N. Superior thermal conductivity of single-layer graphene. Nano Lett. 2008, 8, 902–907. [Google Scholar] [CrossRef] [PubMed]
- Lee, C.; Wei, X.; Kysar, J.W.; Hone, J. Measurement of the elastic properties and intrinsic strength of monolayer graphene. Science 2008, 321, 385–388. [Google Scholar] [CrossRef] [PubMed]
- Bae, S.; Kim, H.; Lee, Y.; Xu, X.; Park, J.-S.; Zheng, Y.; Balakrishnan, J.; Lei, T.; Kim, H.R.; Song, Y.I.; et al. Roll-to-roll production of 30-inch graphene films for transparent electrodes. Nat. Nanotechnol. 2010, 5, 574–578. [Google Scholar] [CrossRef] [PubMed]
- Novoselov, K.S.; Geim, A.K.; Morozov, S.V.; Jiang, D.-E.; Zhang, Y.; Dubonos, S.V.; Grigorieva, I.V.; Firsov, A.A. Electric field effect in atomically thin carbon films. Science 2004, 306, 666–669. [Google Scholar] [CrossRef] [PubMed]
- Gilje, S.; Han, S.; Wang, M.; Wang, K.L.; Kaner, R.B.J. A chemical route to graphene for device applications. Nano Lett. 2007, 7, 3394–3398. [Google Scholar] [CrossRef] [PubMed]
- Zhou, M.; Zhai, Y.; Dong, S.J. Electrochemical sensing and biosensing platform based on chemically reduced graphene oxide. Anal. Chem. 2009, 81, 5603–5613. [Google Scholar] [CrossRef]
- Liu, C.; Yu, Z.; Neff, D.; Zhamu, A.; Jang, B.Z. Graphene-based supercapacitor with an ultrahigh energy density. Nano Lett. 2010, 10, 4863–4868. [Google Scholar] [CrossRef]
- Huang, X.; Qi, X.; Boey, F.; Zhang, H.J. Graphene-based composites. Chem. Soc. Rev. 2012, 41, 666–686. [Google Scholar] [CrossRef]
- Zhang, Z.; Xu, F.; Yang, W.; Guo, M.; Wang, X.; Zhang, B.; Tang, J. A facile one-pot method to high-quality Ag-graphene composite nanosheets for efficient surface-enhanced Raman scattering. Chem. Commun. 2011, 47, 6440–6442. [Google Scholar] [CrossRef]
- Gao, W.; Ran, C.; Wang, M.; Yao, X.; He, D.; Bai, J. Understanding the growth mechanism of stabilizer-free Ag nanoparticles on reduced graphene oxide: The role of CO. J. Nanoparticle Res. 2013, 15, 1727. [Google Scholar] [CrossRef]
- Huang, Q.; Wang, J.; Wei, W.; Yan, Q.; Wu, C.; Zhu, X. A facile and green method for synthesis of reduced graphene oxide/Ag hybrids as efficient surface enhanced Raman scattering platforms. J. Hazard. Mater. 2015, 283, 123–130. [Google Scholar] [CrossRef] [PubMed]
- Singh, S.; Gundampati, R.K.; Mitra, K.; Ramesh, K.; Jagannadham, M.V.; Misra, N.; Ray, B. Enhanced catalytic and antibacterial activities of silver nanoparticles immobilized on poly (N-vinyl pyrrolidone)-grafted graphene oxide. RSC Adv. 2015, 5, 81994–82004. [Google Scholar] [CrossRef]
- Sitnikova, N.A.; Borisova, A.V.; Komkova, M.A.; Karyakin, A.A. Superstable advanced hydrogen peroxide transducer based on transition metal hexacyanoferrates. Anal. Chem. 2011, 83, 2359–2363. [Google Scholar] [CrossRef] [PubMed]
- Ahmad, M.; Pan, C.; Gan, L.; Nawaz, Z.; Zhu, J. Highly sensitive amperometric cholesterol biosensor based on Pt-incorporated fullerene-like ZnO nanospheres. J. Phys. Chem. C 2010, 114, 243–250. [Google Scholar] [CrossRef]
- Luo, Y.; Liu, H.; Rui, Q.; Tian, Y. Detection of extracellular H2O2 released from human liver cancer cells based on TiO2 nanoneedles with enhanced electron transfer of cytochrome c. Anal. Chem. 2009, 81, 3035–3041. [Google Scholar] [CrossRef] [PubMed]
- Li, H.; Wang, D.; Liu, C.; Liu, R.; Zhang, C. Facile and sensitive chemiluminescence detection of H2O2 and glucose by a gravity/capillary flow and cloth-based low-cost platform. RSC Adv. 2017, 7, 43245–43254. [Google Scholar] [CrossRef]
- Song, M.; Wang, J.; Chen, B.; Wang, L. A Facile, Nonreactive Hydrogen Peroxide (H2O2) Detection Method Enabled by Ion Chromatography with UV Detector. Anal. Chem. 2017, 69, 11537–11544. [Google Scholar] [CrossRef]
- Chen, Y.; Zhu, W.-J.; Wei, X.-R.; Xu, Y.-J.; Sun, R.; Ge, J.-F. Near-infrared and lysosome-targetable fluorescent probe based on phenoxazinium for hydrogen peroxide detection. Anal. Methods 2018, 10, 3754–3758. [Google Scholar] [CrossRef]
- Bucolo, C.; Leggio, G.M.; Drago, F.; Salomone, S. Dopamine outside the brain: The eye, cardiovascular system and endocrine pancreas. Pharmacol. Ther. 2019, 203, 107392. [Google Scholar] [CrossRef]
- Klein, M.O.; Battagello, D.S.; Cardoso, A.R.; Hauser, D.N.; Bittencourt, J.C.; Correa, R.G. Dopamine: Functions, signaling, and association with neurological diseases. Cell. Mol. Neurobiol. 2019, 39, 31–59. [Google Scholar] [CrossRef] [PubMed]
- Ferlazzo, A.; Espro, C.; Iannazzo, D.; Neri, G. Measurement, Determination of phenylalanine by a novel enzymatic PHD/SPE biosensor. IEEE Trans. Instrum. Meas. 2023, 72, 9508308. [Google Scholar] [CrossRef]
- Parrilla, M.; Vanhooydonck, A.; Watts, R.; De Wael, K. Wearable wristband-based electrochemical sensor for the detection of phenylalanine in biofluids. Biosens. Bioelectron. 2022, 197, 113764. [Google Scholar] [CrossRef]
- Fiore, L.; De Lellis, B.; Mazzaracchio, V.; Suprun, E.; Massoud, R.; Goffredo, B.M.; Moscone, D.; Arduini, F. Smartphone-assisted electrochemical sensor for reliable detection of tyrosine in serum. Talanta 2022, 237, 122869. [Google Scholar] [CrossRef] [PubMed]
- Zribi, R.; Ferlazzo, A.; Fazio, E.; Condorelli, M.; D’Urso, L.; Neri, G.; Corsaro, C.; Neri, F.; Compagnini, G.; Neri, G. Measurement, Ag Nanoplates Modified-Screen Printed Carbon Electrode to Improve Electrochemical Performances toward a Selective H2O2 Detection. IEEE Trans. Instrum. Meas. 2023, 72, 6002708. [Google Scholar] [CrossRef]
- Wang, M.Y.; Shen, T.; Wang, M.; Zhang, D.; Chen, J. One-pot green synthesis of Ag nanoparticles-decorated reduced graphene oxide for efficient nonenzymatic H2O2 biosensor. Mater. Lett. 2013, 107, 311–314. [Google Scholar] [CrossRef]
- Yang, Z.; Qi, C.; Zheng, X.; Zheng, J. Facile synthesis of silver nanoparticle-decorated graphene oxide nanocomposites and their application for electrochemical sensing. New J. Chem. 2015, 39, 9358–9362. [Google Scholar] [CrossRef]
- Mahanta, B.; Al Mamun, H.; Konwar, M.; Patar, S.; Saikia, P.; Jyoti Borthakur, L. Non-Enzymatic Electrochemical Biosensor for Dopamine Detection Using MoS2/rGO/Ag Nanostructure. ChemistrySelect 2023, 8, e202205030. [Google Scholar] [CrossRef]
- Shi, Z.; Hao, X.; Xu, C. In situ synthesis of Ag nanoparticles-graphene oxide nanocomposites with strong SERS activity. Mater. Res. Express 2018, 5, 015034. [Google Scholar] [CrossRef]
- Khanra, P.; Kuila, T.; Kim, N.H.; Bae, S.H.; Yu, D.-S.; Lee, J.H. Simultaneous bio-functionalization and reduction of graphene oxide by baker’s yeast. Chem. Eng. J. 2012, 183, 526–533. [Google Scholar] [CrossRef]
- Kumar, V.; Gundampati, R.K.; Singh, D.K.; Jagannadham, M.V.; Sundar, S.; Hasan, S.H.J. Photo-induced rapid biosynthesis of silver nanoparticle using aqueous extract of Xanthium strumarium and its antibacterial and antileishmanial activity. J. Ind. Eng. Chem. 2016, 37, 224–236. [Google Scholar] [CrossRef]
- Xie, G.; Cheng, J.; Li, Y.; Xi, P.; Chen, F.; Liu, H.; Hou, F.; Shi, Y.; Huang, L.; Xu, Z.J. Fluorescent graphene oxide composites synthesis and its biocompatibility study. J. Mater. Chem. 2012, 22, 9308–9314. [Google Scholar] [CrossRef]
- Teo, P.; Lim, H.; Huang, N.; Chia, C.; Harrison, I. Room temperature in situ chemical synthesis of Fe3O4/graphene. Ceram. Int. 2012, 38, 6411–6416. [Google Scholar] [CrossRef]
- Zhan, B.; Liu, C.; Shi, H.; Li, C.; Wang, L.; Huang, W.; Dong, X. A hydrogen peroxide electrochemical sensor based on silver nanoparticles decorated three-dimensional graphene. Appl. Phys. Lett. 2014, 104, 243704. [Google Scholar] [CrossRef]
- Lorestani, F.; Shahnavaz, Z.; Nia, P.M.; Alias, Y.; Manan, N.S. One-step preparation of silver–polyaniline nanotube composite for non-enzymatic hydrogen peroxide detection. Appl. Surf. Sci. 2015, 347, 816–823. [Google Scholar] [CrossRef]
- Tian, Y.; Wang, F.; Liu, Y.; Pang, F.; Zhang, X. Green synthesis of silver nanoparticles on nitrogen-doped graphene for hydrogen peroxide detection. Electrochim. Acta 2014, 146, 646–653. [Google Scholar] [CrossRef]
- Chen, L.; Xie, H.; Li, J. Electrochemical glucose biosensor based on silver nanoparticles/multiwalled carbon nanotubes modified electrode. J. Solid State Electrochem. 2012, 16, 3323–3329. [Google Scholar] [CrossRef]
- Li, Y.; Zhang, W.; Zhang, L.; Li, J.; Su, Z.; Wei, G. Sequence-Designed Peptide Nanofibers Bridged Conjugation of Graphene Quantum Dots with Graphene Oxide for High Performance Electrochemical Hydrogen Peroxide Biosensor. Adv. Mater. Interfaces 2017, 4, 1600895. [Google Scholar] [CrossRef]
- Ma, Z.-M.; Wang, B.-T.; Cui, K.-Y.; Wan, Y.; Li, S.-J. The preparation of Ag nanoparticles/graphene nanocomposites with polydopamine as coupling agent for enhanced detection of H2O2. Int. J. Electrochem. Sci. 2019, 14, 6840–6854. [Google Scholar] [CrossRef]
- Lou, X.; Zhu, C.; Pan, H.; Ma, J.; Zhu, S.; Zhang, D.; Jiang, X. Cost-effective three-dimensional graphene/Ag aerogel composite for high-performance sensing. Electrochim. Acta 2016, 205, 70–76. [Google Scholar] [CrossRef]
- Samadi-Maybodi, A.; Ghasemi, S.; Ghaffari-Rad, H. Ag-doped zeolitic imidazolate framework-8 nanoparticles modified CPE for efficient electrocatalytic reduction of H2O2. Electrochim. Acta 2015, 163, 280–287. [Google Scholar] [CrossRef]
- Tajabadi, M.; Basirun, W.J.; Lorestani, F.; Zakaria, R.; Baradaran, S.; Amin, Y.M.; Mahmoudian, M.; Rezayi, M.; Sookhakian, M. Nitrogen-doped graphene-silver nanodendrites for the non-enzymatic detection of hydrogen peroxide. Electrochim. Acta 2015, 151, 126–133. [Google Scholar] [CrossRef]
- Kurowska, E.; Brzózka, A.; Jarosz, M.; Sulka, G.; Jaskuła, M. Silver nanowire array sensor for sensitive and rapid detection of H2O2. Electrochim. Acta 2013, 104, 439–447. [Google Scholar] [CrossRef]
- Golsheikh, A.M.; Huang, N.; Lim, H.; Zakaria, R.; Yin, C.-Y. One-step electrodeposition synthesis of silver-nanoparticle-decorated graphene on indium-tin-oxide for enzymeless hydrogen peroxide detection. Carbon 2013, 62, 405–412. [Google Scholar] [CrossRef]
- Zhang, H.; Liu, S.J. Electrochemical sensors based on nitrogen-doped reduced graphene oxide for the simultaneous detection of ascorbic acid, dopamine and uric acid. J. Alloy Compd. 2020, 842, 155873. [Google Scholar] [CrossRef]
- Li, D.; Liu, M.; Zhan, Y.; Su, Q.; Zhang, Y.; Zhang, D. Electrodeposited poly (3, 4-ethylenedioxythiophene) doped with graphene oxide for the simultaneous voltammetric determination of ascorbic acid, dopamine and uric acid. Microchim. Acta 2020, 187, 94. [Google Scholar] [CrossRef]
- Guo, Z.; Luo, X.; Li, Y.; Li, D.; Zhao, Q.; Li, M.; Ma, C.; Zhao, Y. Simultaneous electrochemical determination of ascorbic acid, dopamine and uric acid based on reduced graphene oxide-Ag/PANI modified glassy carbon electrode. Chem. Res. Chin. Univ. 2017, 33, 507–512. [Google Scholar] [CrossRef]
- Sookhakian, M.; Basirun, W.J.; Goh, B.T.; Woi, P.M.; Alias, Y. Molybdenum disulfide nanosheet decorated with silver nanoparticles for selective detection of dopamine. Colloids Surf. B Biointerfaces 2019, 176, 80–86. [Google Scholar] [CrossRef]
Figure 1.
The growth of AgNPs on GO. (A) The photo of the mixed solution of AgNO3 and GO before and after heating. (B) The SEM image of rGO. (C) The SEM image of AgNPs/rGO.
Figure 1.
The growth of AgNPs on GO. (A) The photo of the mixed solution of AgNO3 and GO before and after heating. (B) The SEM image of rGO. (C) The SEM image of AgNPs/rGO.

Figure 2.
Structure characterization of AgNPs/GO. (A) The absorbance spectra of GO and AgNPs/GO. (B) The XRD spectra of GO and AgNPs/GO.
Figure 2.
Structure characterization of AgNPs/GO. (A) The absorbance spectra of GO and AgNPs/GO. (B) The XRD spectra of GO and AgNPs/GO.

Figure 3.
Electrochemical characterization of AgNPs/rGO/GCE. (A) EIS curves of GCE, GO/GCE, rGO/GCE, and AgNPs/rGO/GCE. (B) The CV curves of GCE and AgNPs/rGO/GCE in PBS.
Figure 3.
Electrochemical characterization of AgNPs/rGO/GCE. (A) EIS curves of GCE, GO/GCE, rGO/GCE, and AgNPs/rGO/GCE. (B) The CV curves of GCE and AgNPs/rGO/GCE in PBS.

Figure 4.
CV responses of different electrodes and amperometric tests of AgNPs/rGO/GCE to H2O2. (A) CV curves of AgNPs/rGO/GCE in PBS solution with or without 1 mM H2O2. (B) CV curves of AgNPs/rGO/GCE, rGO/GCE, and GO/GCE in PBS solution with 1 mM H2O2. (C) Current responses at -0.3 V of AgNPs/rGO/GCE in PBS with different concentrations of H2O2. (D) The calibration curve of the current responses in (C).

Figure 5.
CV responses of different electrodes and amperometric tests of AgNPs/rGO/GCE to DA. (A) CV curves of AgNPs/rGO/GCE in PBS with or without 4 mM DA. (B) CV curves of AgNPs/rGO/GCE, rGO/GCE, and GO/GCE in PBS solution with 4 mM DA. (C) Current responses at -0.3 V of AgNPs/rGO/GCE in PBS with different concentrations of H2O2. (D) The calibration curve of the current responses in (C).

Figure 6.
Selectivity test. (A) The current response of AgNPs/rGO/GCE was obtained by adding 25 μM H2O2, 0.1 M NaCl, 0.1 M KCl, 0.1 M glucose, 0.1 M UA, 0.1 M DA, and 25 μM H2O2 to PBS solution at a voltage of −0.3 V. (B) The current response of AgNPs/rGO/GCE was obtained by adding 10 μM DA, 0.1 M NaCl, 0.1 M KCl, 0.1 M glucose, 0.1 M UA, 0.1 M H2O2, and 10 μM DA to PBS solution at a voltage of 0.25 V.

Figure 7.
Stability test. (A) Peak currents of eight different AgNPs/rGO/GCEs in PBS solution containing 1 mM H2O2. (B) Changes in the peak current of oxidation in a PBS solution containing 1 mM H2O2 for eight different electrodes after 1–6 weeks in the refrigerator. (C) Peak currents of eight different AgNPs/rGO/GCEs in PBS solution containing 10 μM DA. (D) Changes in the peak current of oxidation in a PBS solution containing 10 μM DA for eight different electrodes after 1–6 weeks in the refrigerator.


Table 1.
A comparison of this work with works in the literature regarding the performance of the H2O2 assays.
Table 1.
A comparison of this work with works in the literature regarding the performance of the H2O2 assays.
| Sensor for H2O2 | Linear Range (mM) | Detection Limit (μM) |
|---|---|---|
| GQD-PNF-GO [38] | 0.01–7.2 | 0.055 |
| AgNPs-rGO(one-pot) [26] | 0.05–5 | 10 |
| AgNPs/PDA/rGO [39] | 0.005–9.97 | 0.68 |
| 3D-rGO/AgNP [40] | 0.016–27 | 6.8 |
| Ag/ZIF–8 [41] | 0.02–5, 5.5–10 | 6.2 |
| N–graphene–AgND [42] | 0.1–80 | 0.26 |
| Ag nanowire array [43] | 0.1–3.1 | 29.2 |
| ERGO-Ag [44] | 0.1–100 | 1.6 |
| AgNPs/rGO [this work] | 0.005–0.62 | 3.19 |
Table 2.
A comparison of this work with works in the literature regarding the performance of the DA assays.
Table 2.
A comparison of this work with works in the literature regarding the performance of the DA assays.
| Sensor for DA | Linear Range (μM) | Detection Limit (μM) |
|---|---|---|
| N-rGO [45] | 1–60 | 0.1 |
| PEDOT-GO [46] | 6–200 | 2.0 |
| rGO-Ag/PANI [47] | 5–200 | 0.2 |
| MoS2/Ag [48] | 1–500 | 0.2 |
| MoS2/rGO/AgNP [28] | 2.5–12.5 | 0.009 |
| AgNPs/rGO [this work] | 1–276 | 0.18 |
Disclaimer/Publisher’s Note: The statements, opinions and data contained in all publications are solely those of the individual author(s) and contributor(s) and not of MDPI and/or the editor(s). MDPI and/or the editor(s) disclaim responsibility for any injury to people or property resulting from any ideas, methods, instructions or products referred to in the content. |
© 2024 by the authors. Licensee MDPI, Basel, Switzerland. This article is an open access article distributed under the terms and conditions of the Creative Commons Attribution (CC BY) license (https://creativecommons.org/licenses/by/4.0/).
Share and Cite
MDPI and ACS Style
Zhang, Y.; Li, N.; Liu, B.; Zhang, H. Hydrogen Peroxide and Dopamine Sensors Based on Electrodeposition of Reduced Graphene Oxide/Silver Nanoparticles. Sensors 2024, 24, 355. https://doi.org/10.3390/s24020355
AMA Style
Zhang Y, Li N, Liu B, Zhang H. Hydrogen Peroxide and Dopamine Sensors Based on Electrodeposition of Reduced Graphene Oxide/Silver Nanoparticles. Sensors. 2024; 24(2):355. https://doi.org/10.3390/s24020355
Chicago/Turabian StyleZhang, Yuhang, Na Li, Bo Liu, and Hangyu Zhang. 2024. "Hydrogen Peroxide and Dopamine Sensors Based on Electrodeposition of Reduced Graphene Oxide/Silver Nanoparticles" Sensors 24, no. 2: 355. https://doi.org/10.3390/s24020355
Note that from the first issue of 2016, this journal uses article numbers instead of page numbers. See further details here.