
Evaluating Accuracy in Five Commercial Sleep-Tracking Devices Compared to Research-Grade Actigraphy and Polysomnography
 ,
,
Abstract
:1. Introduction
2. Materials and Methods
2.1. Participants
2.2. Surveys
2.3. Sleep-Tracking Devices
2.4. Polysomnography
2.5. Procedure
2.6. Analysis
3. Results
3.1. Sample Demographics
3.2. Device Failures
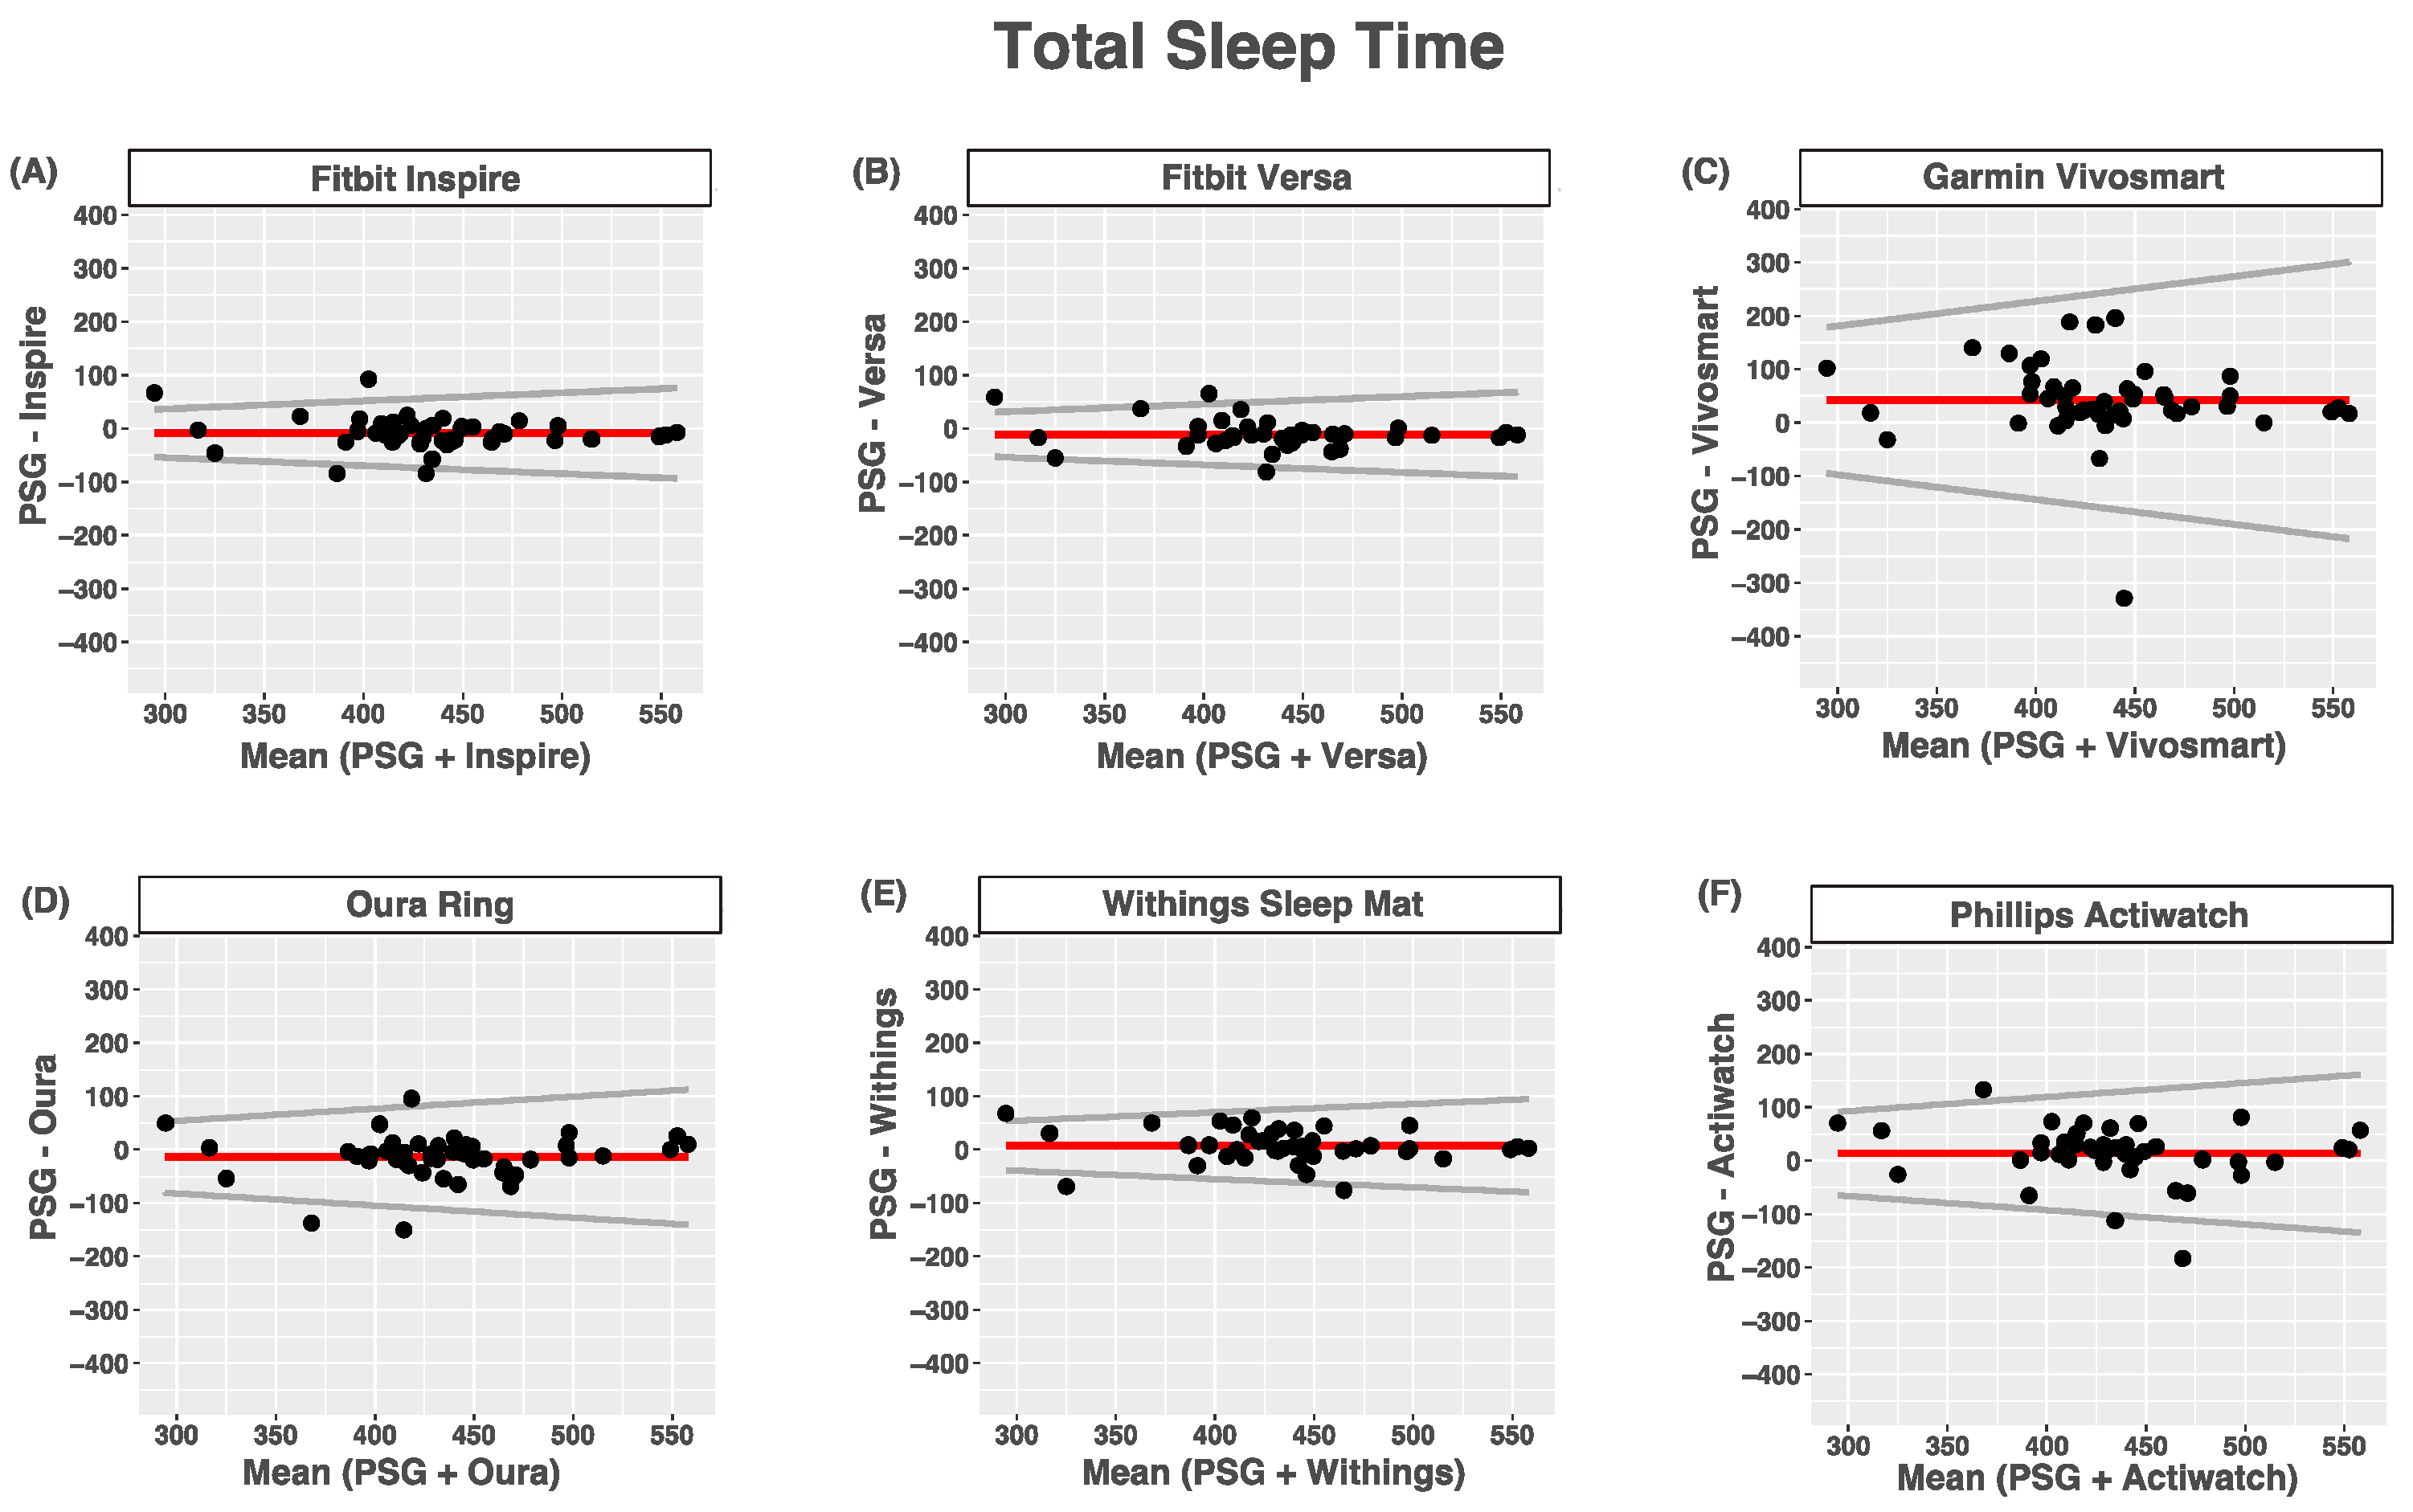
3.3. Total Sleep Time
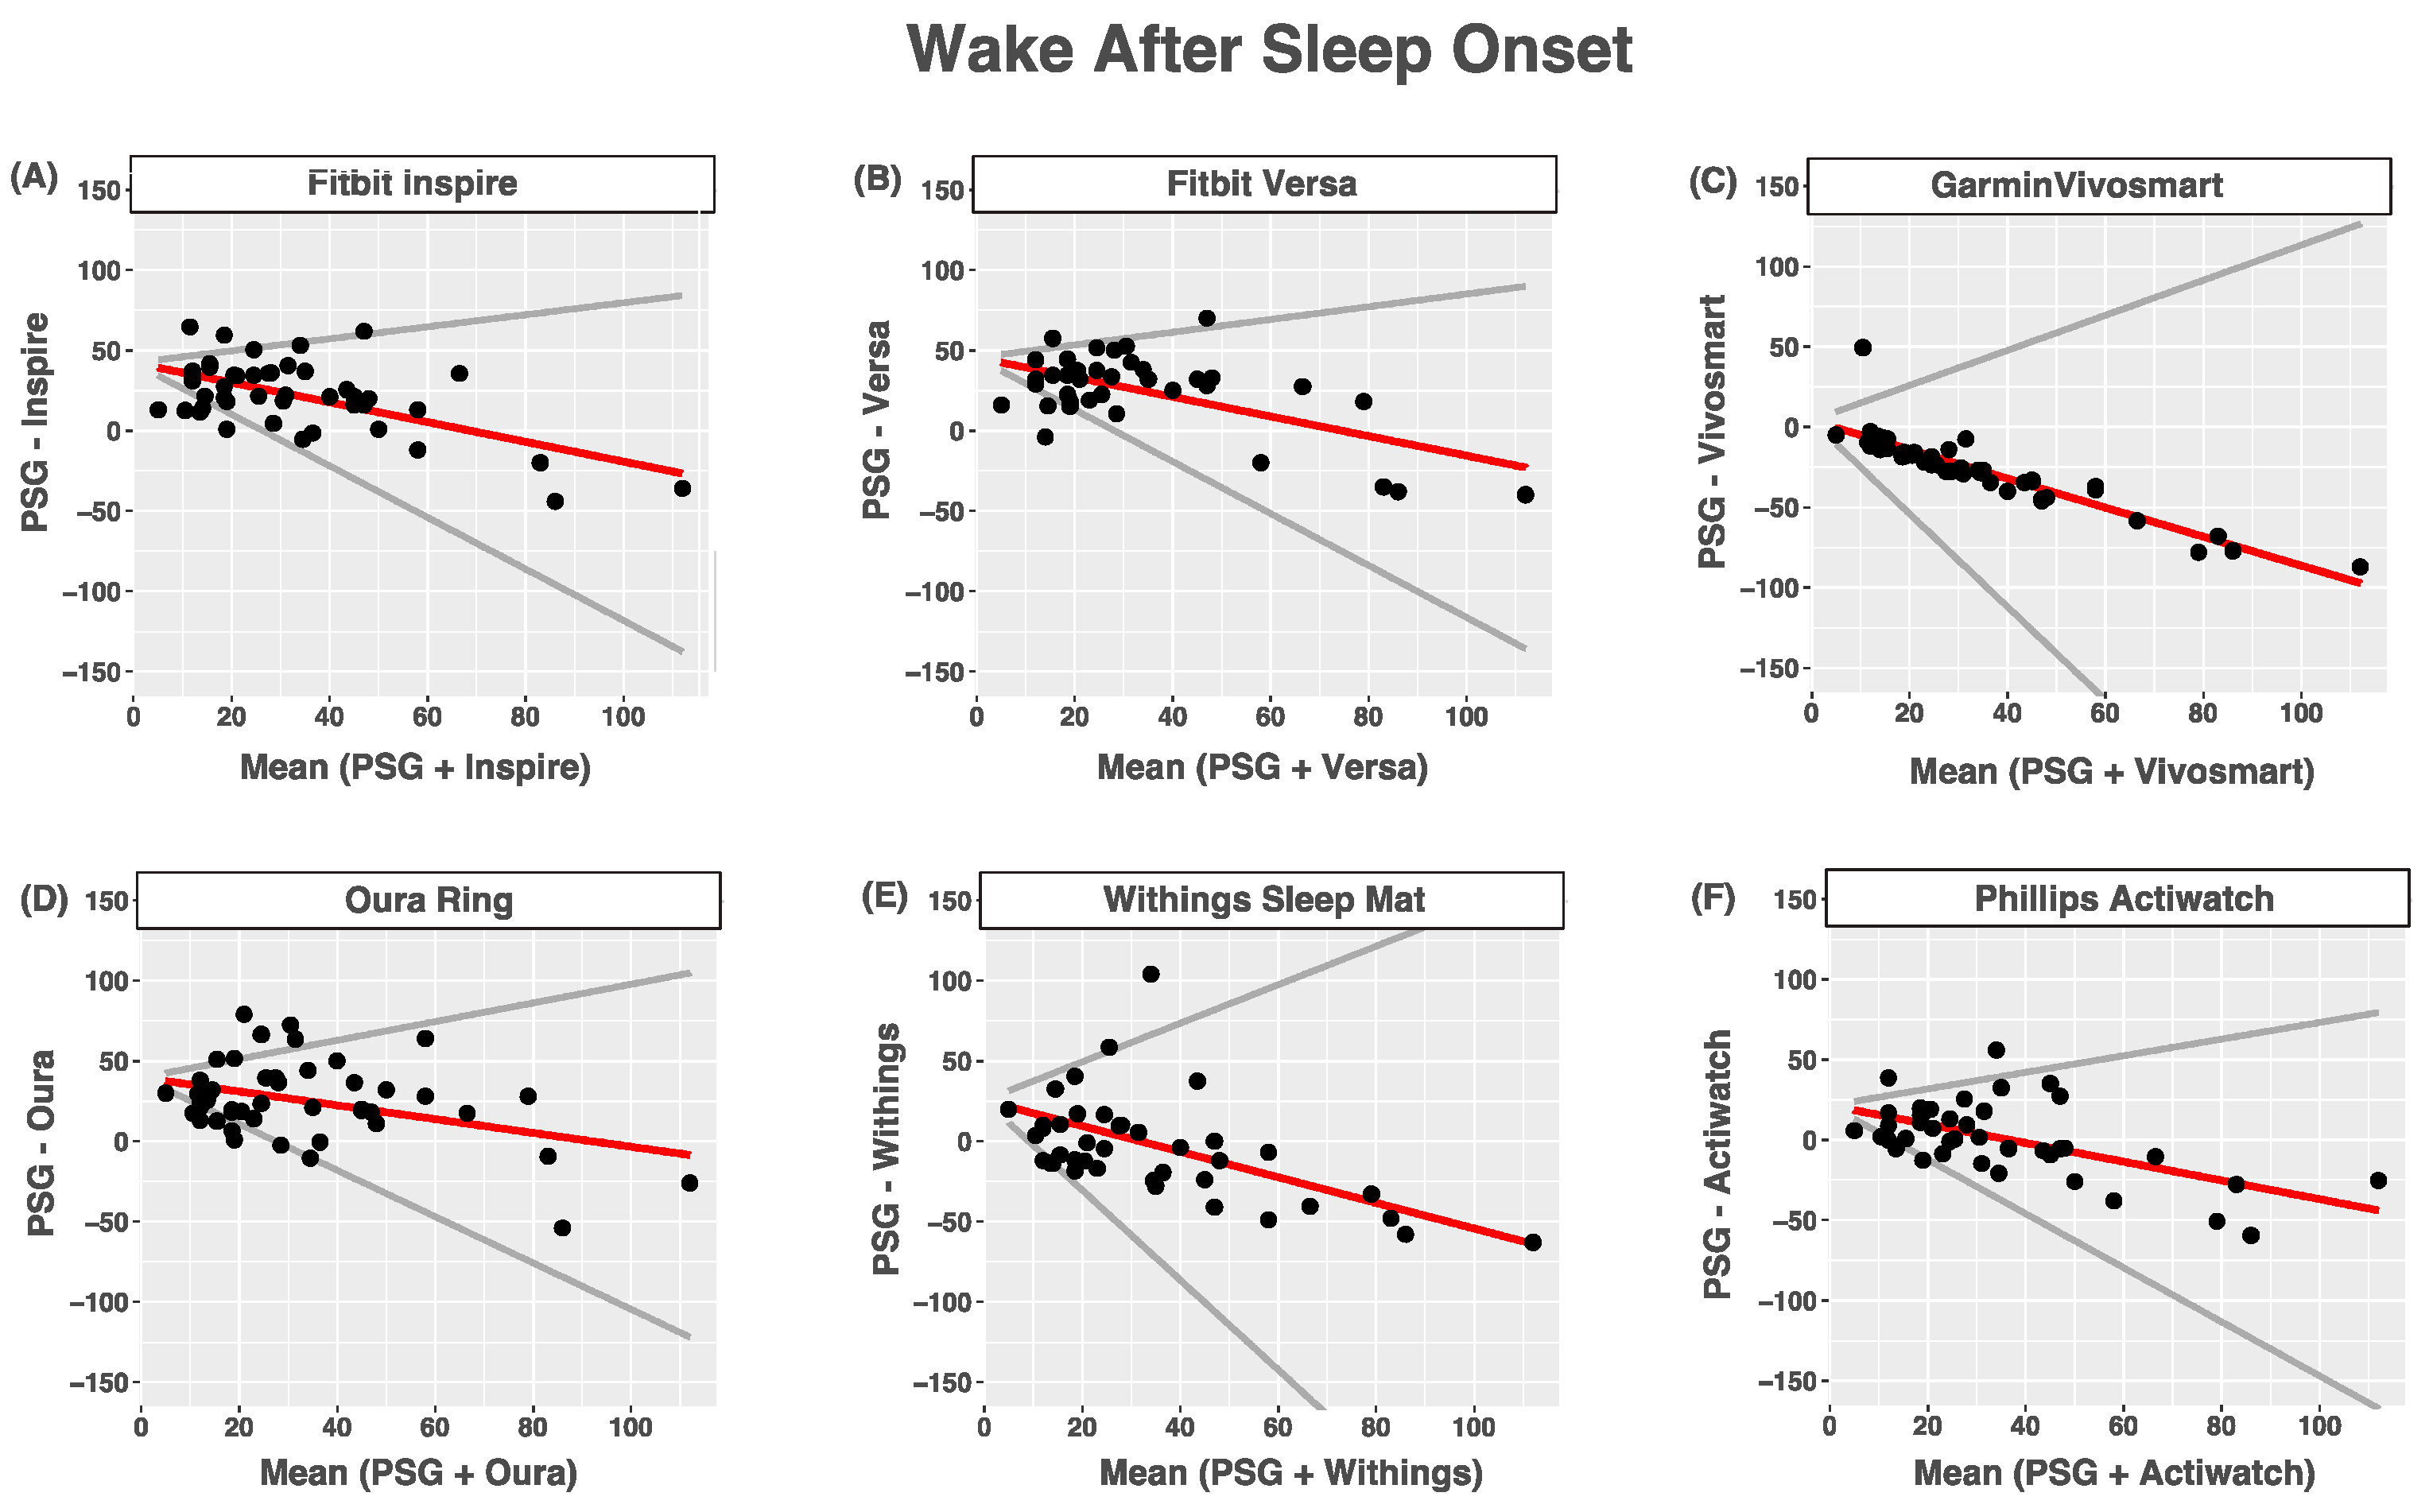
3.4. Wake after Sleep Onset
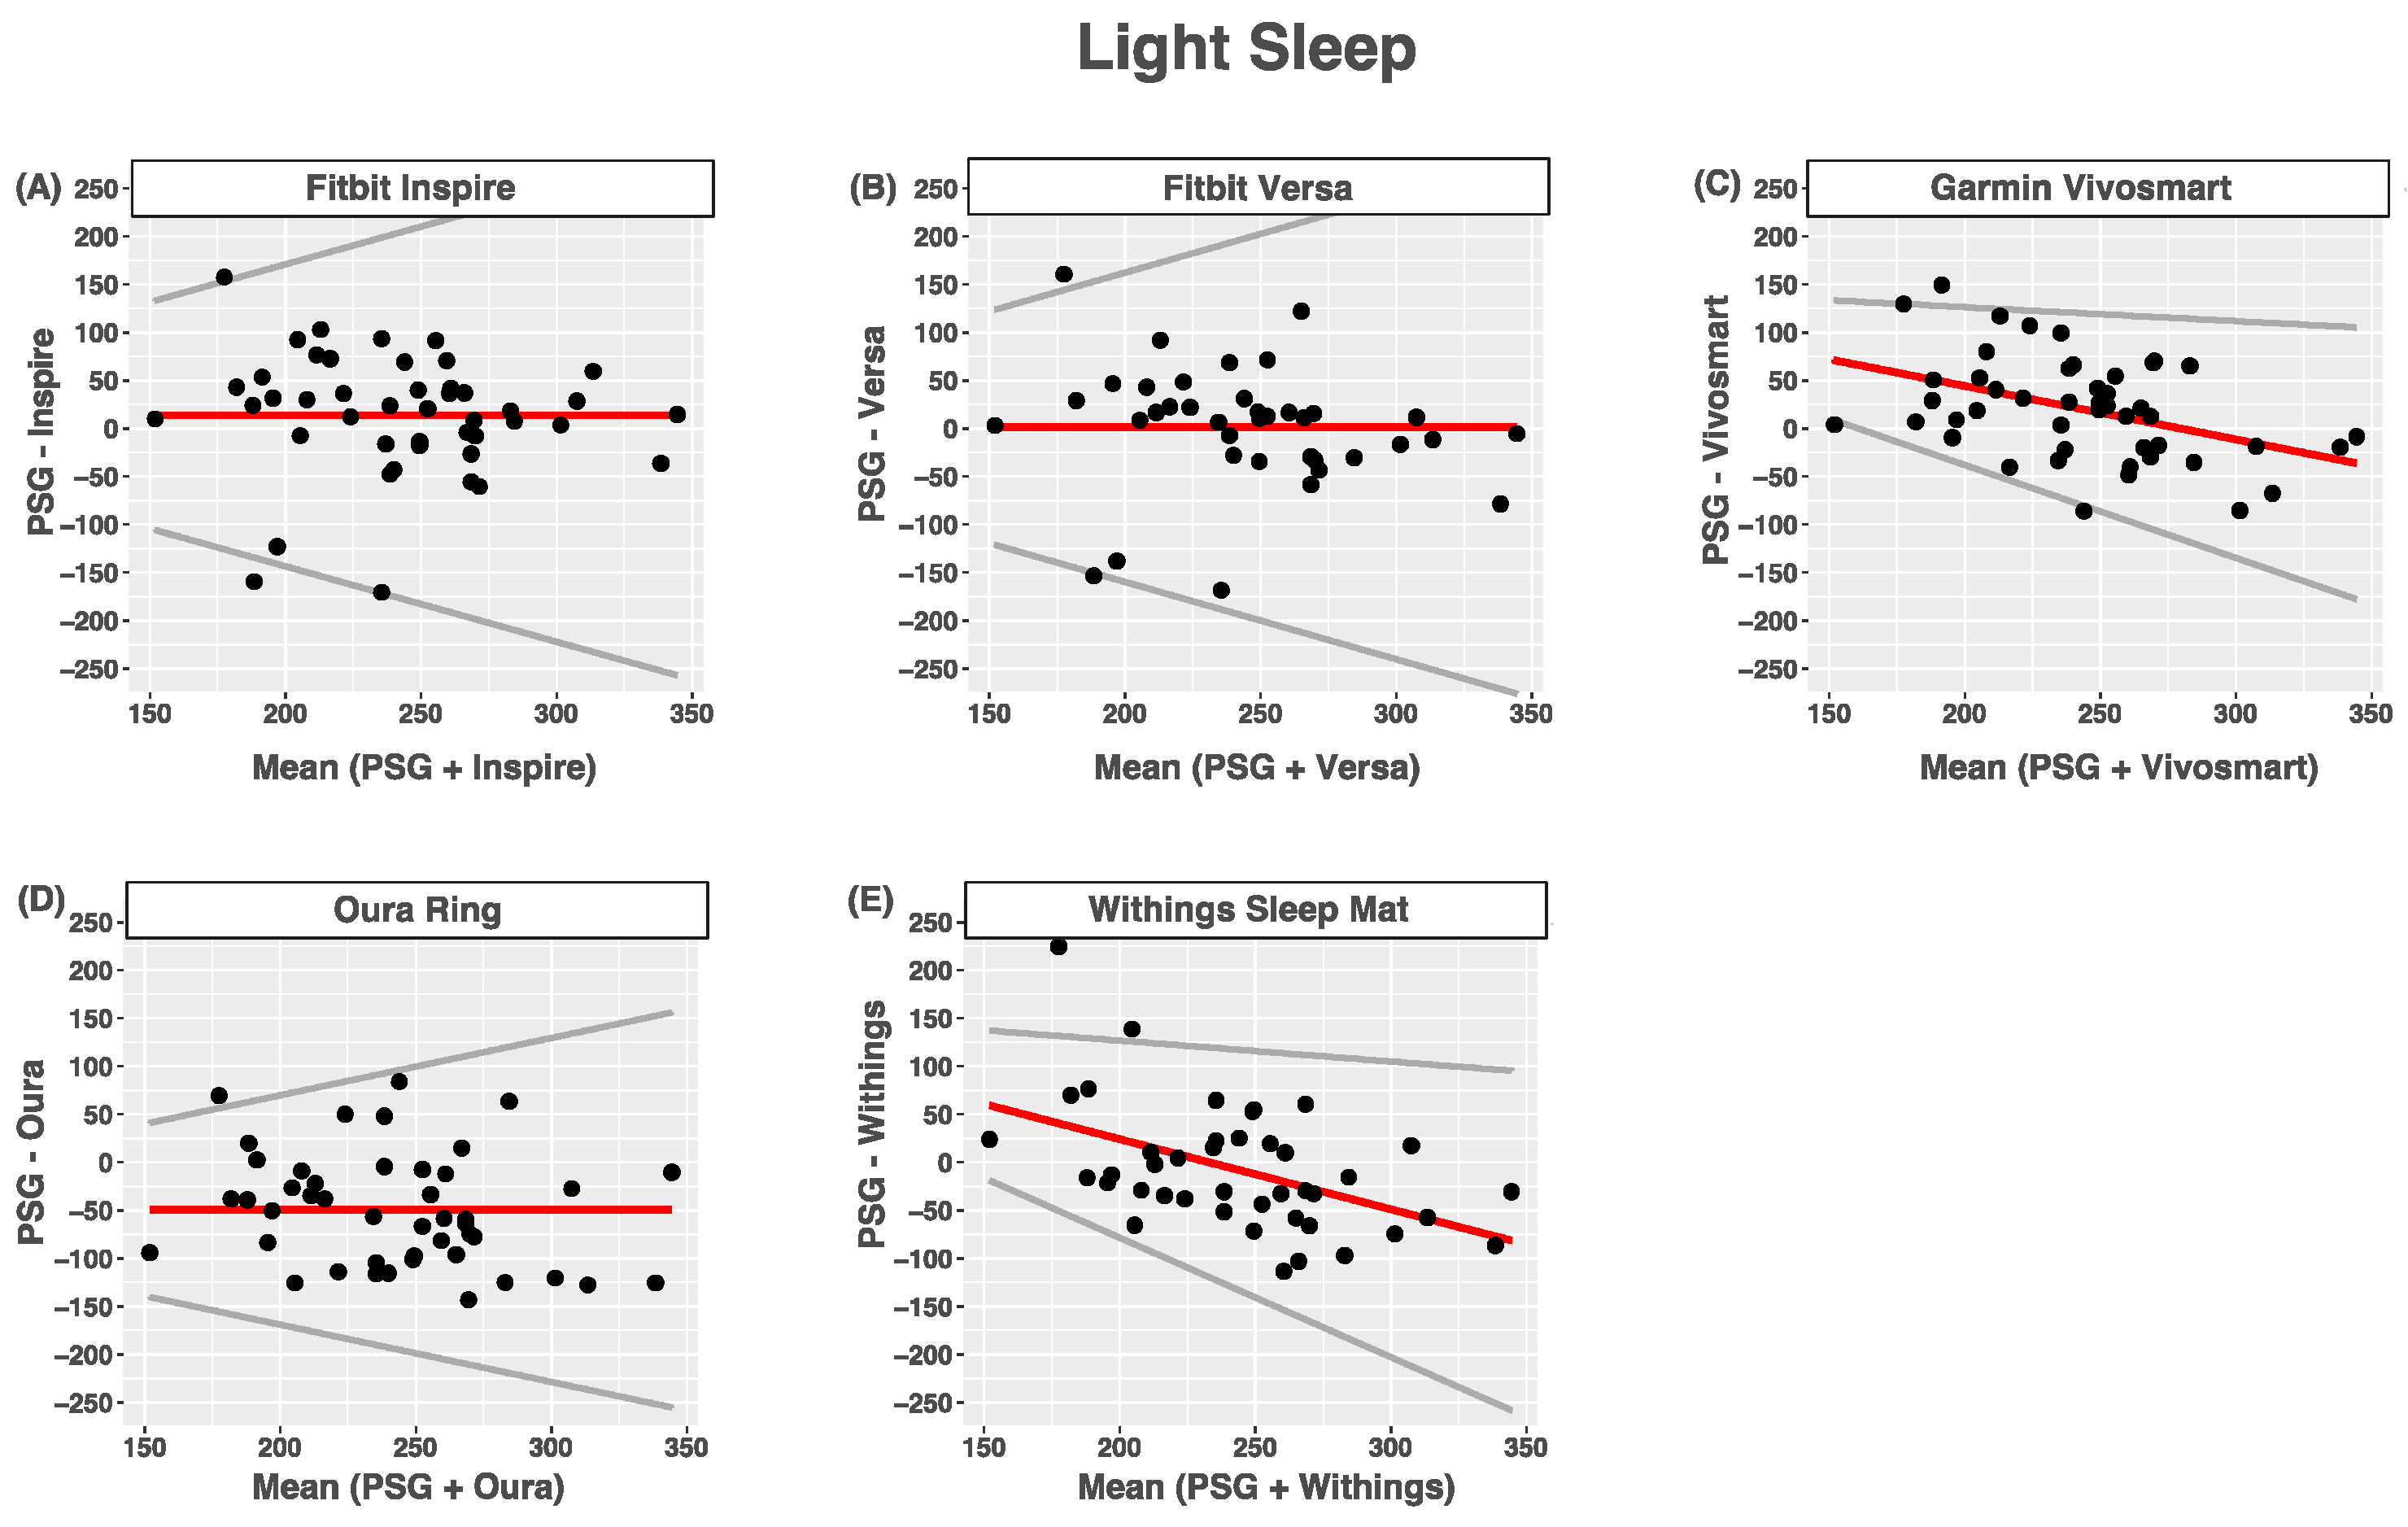
3.5. Light Sleep
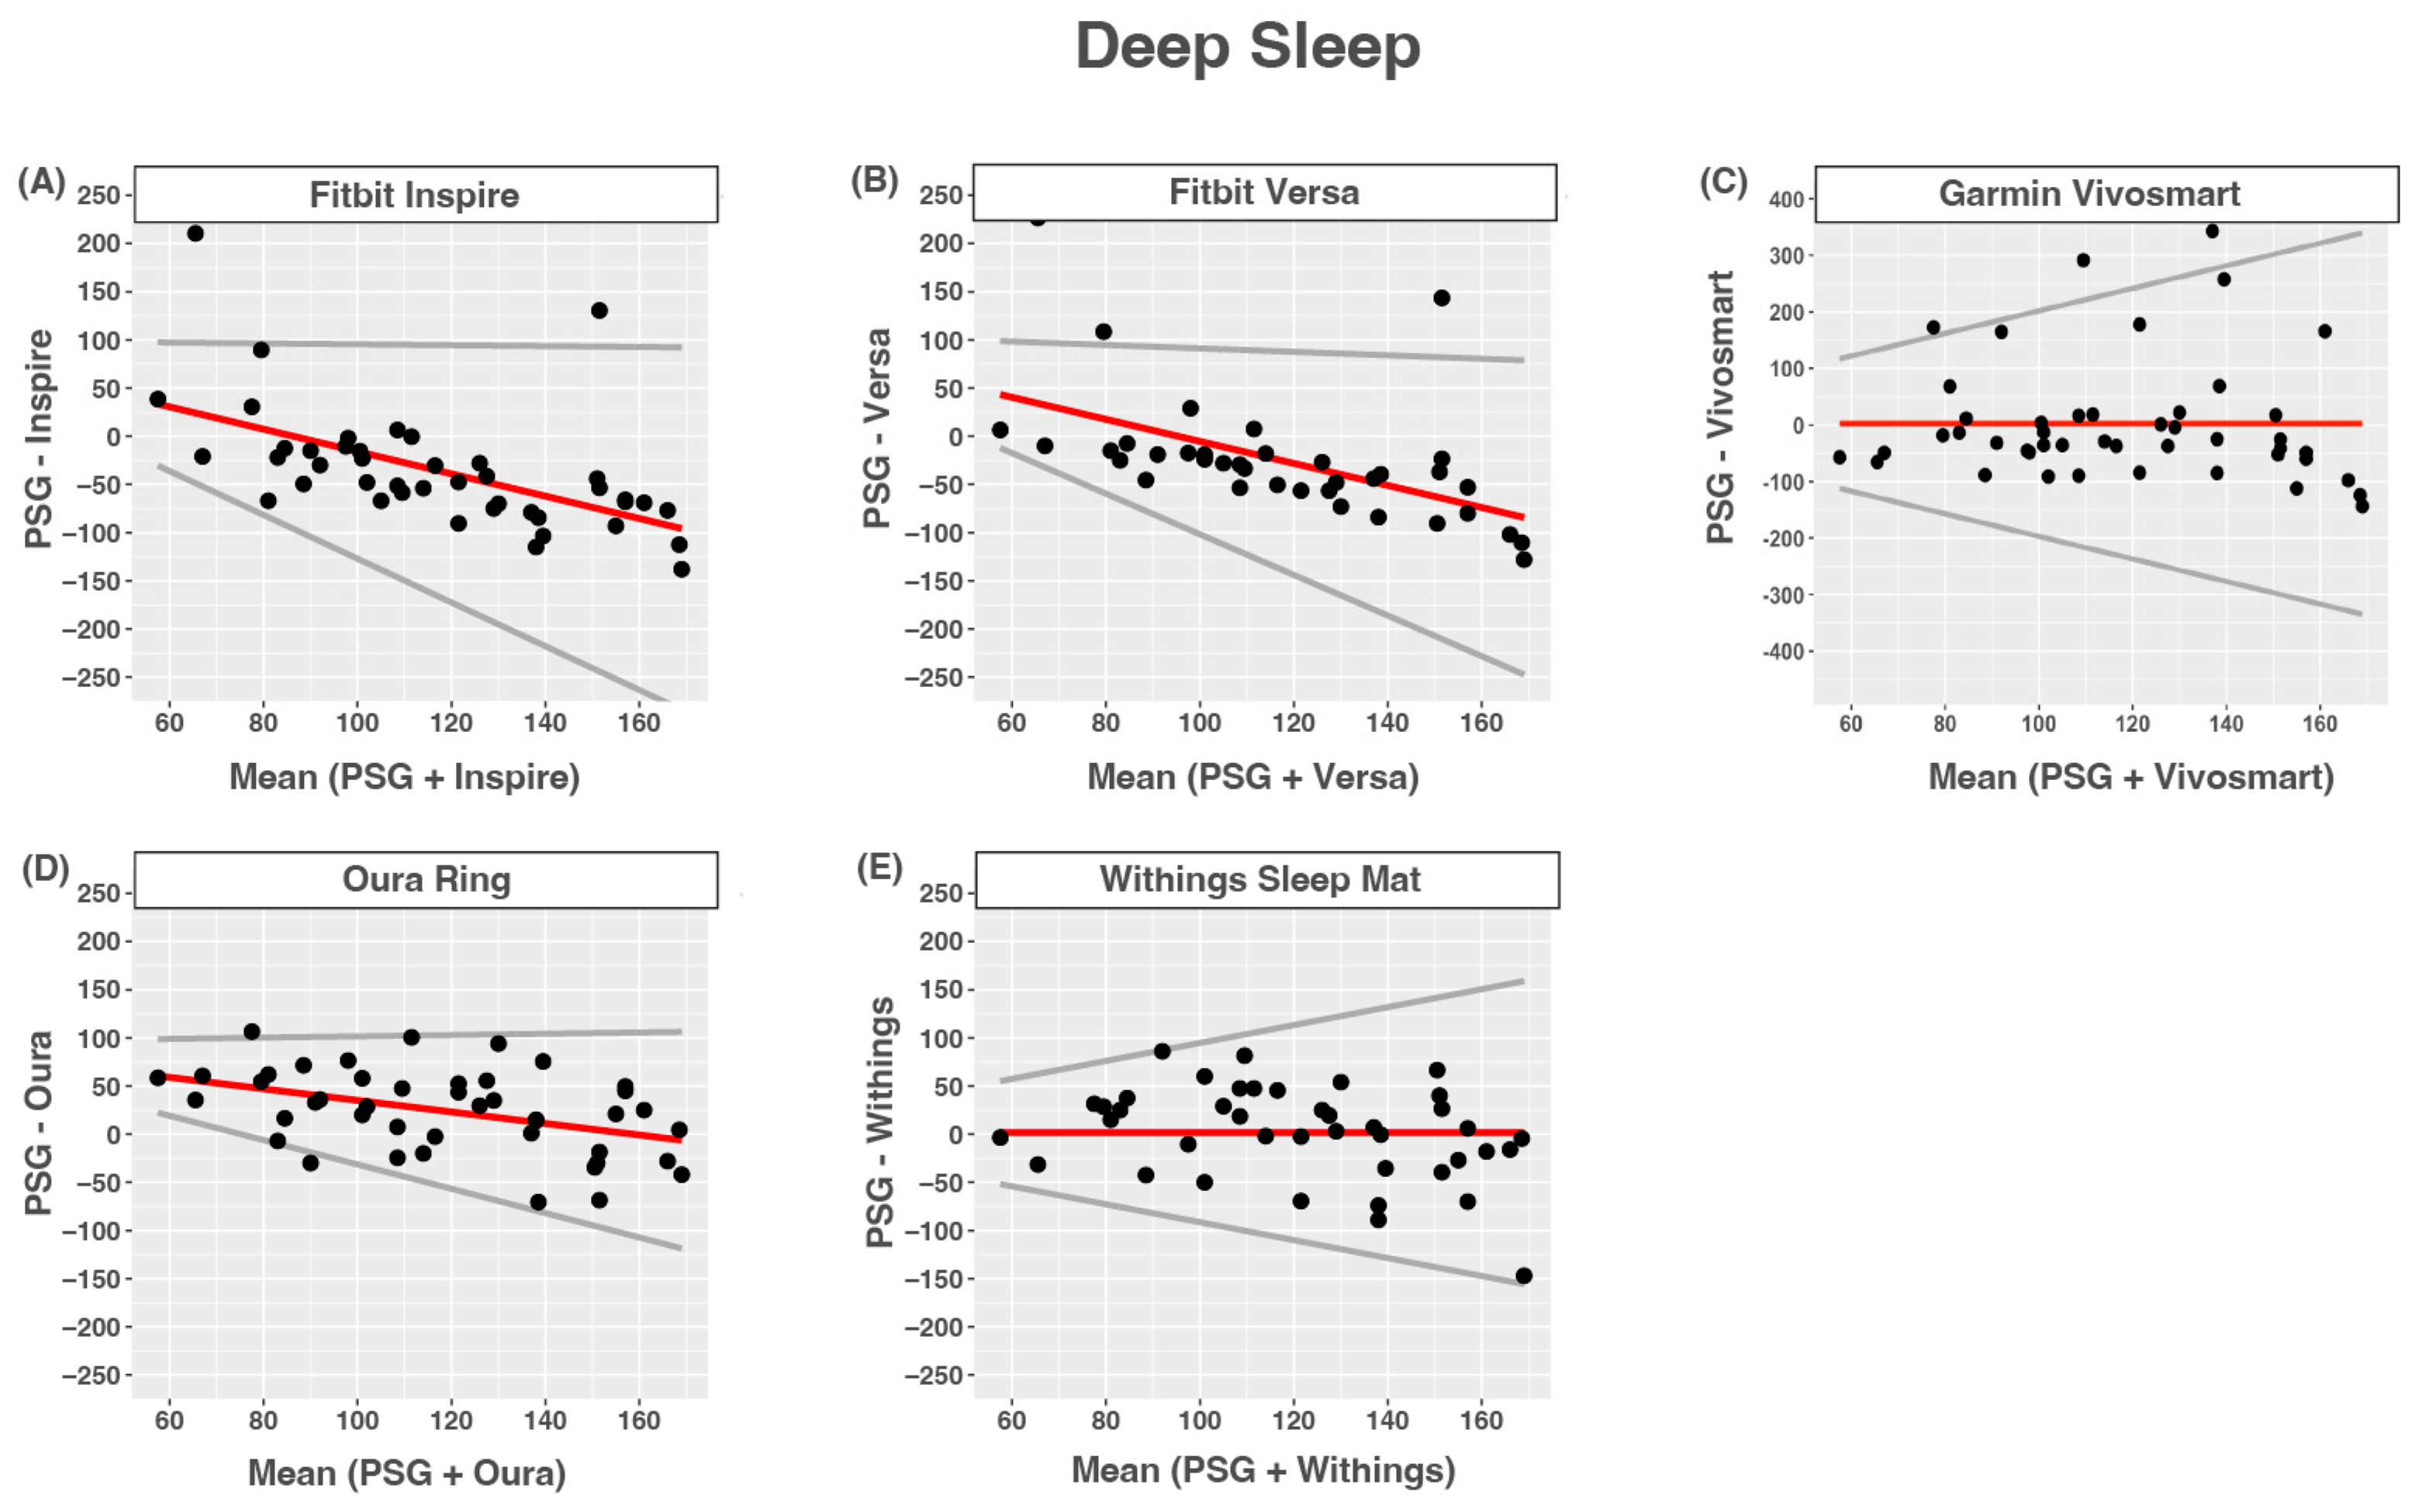
3.6. Deep Sleep
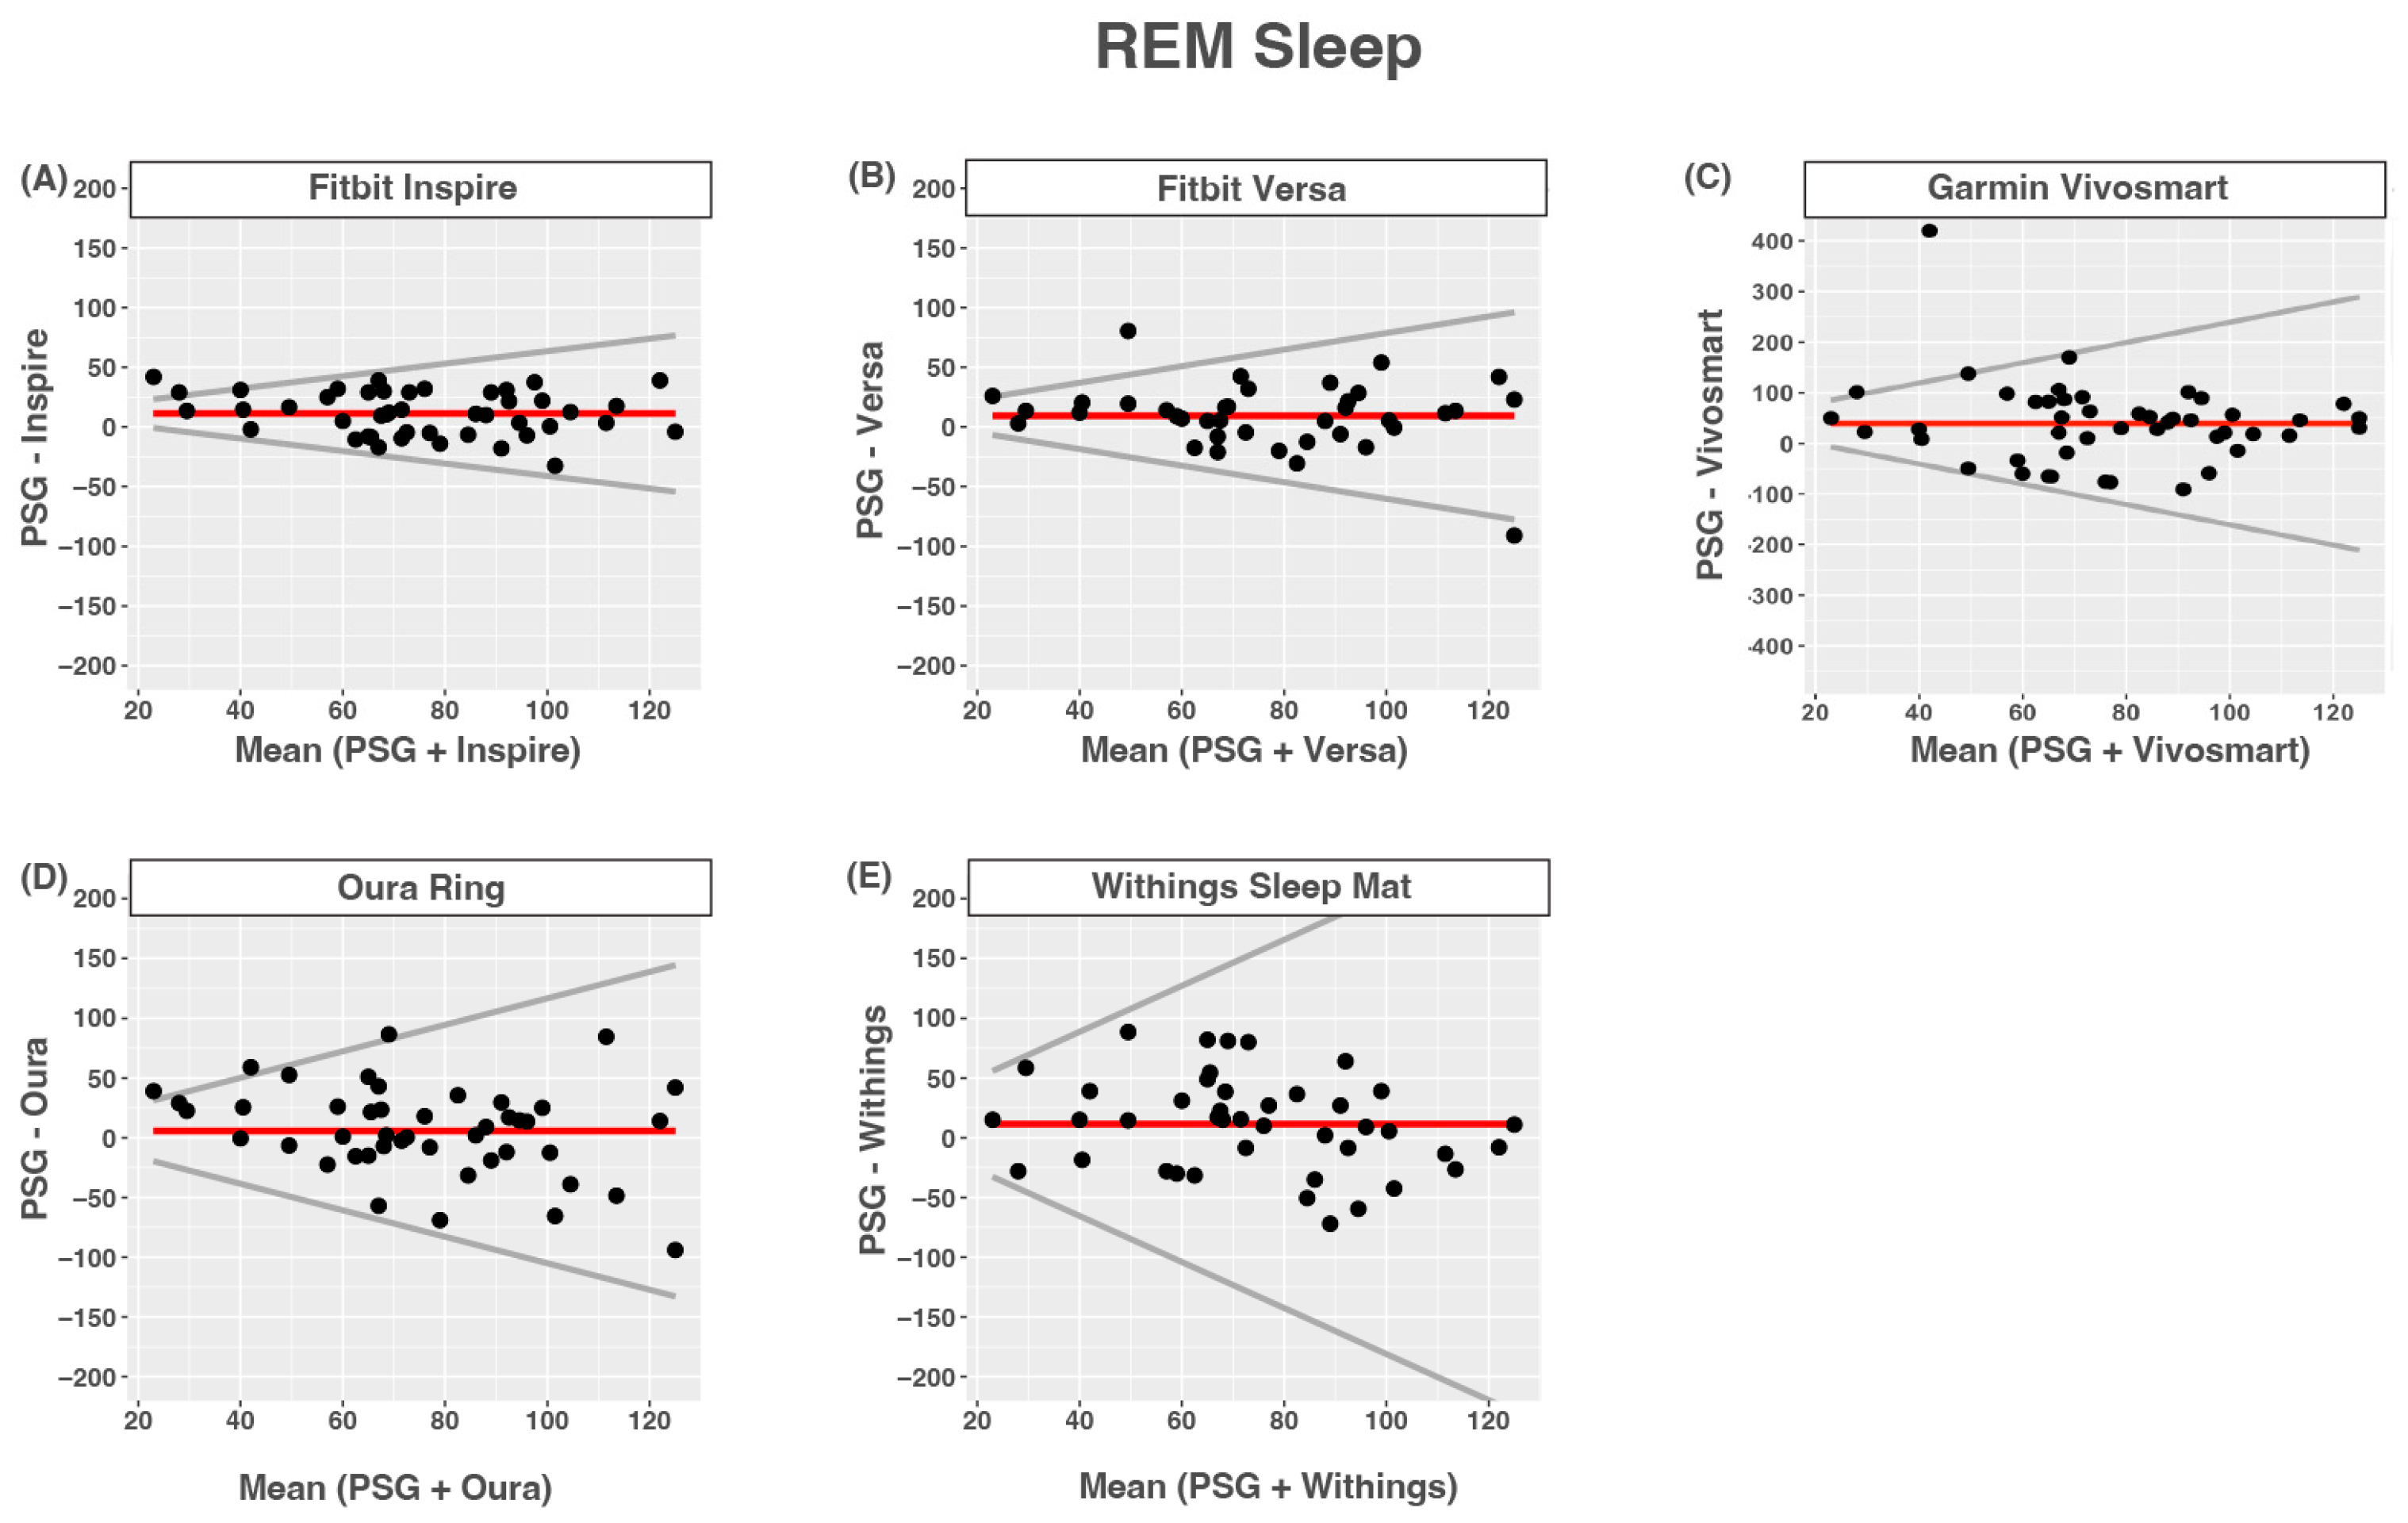
3.7. REM Sleep
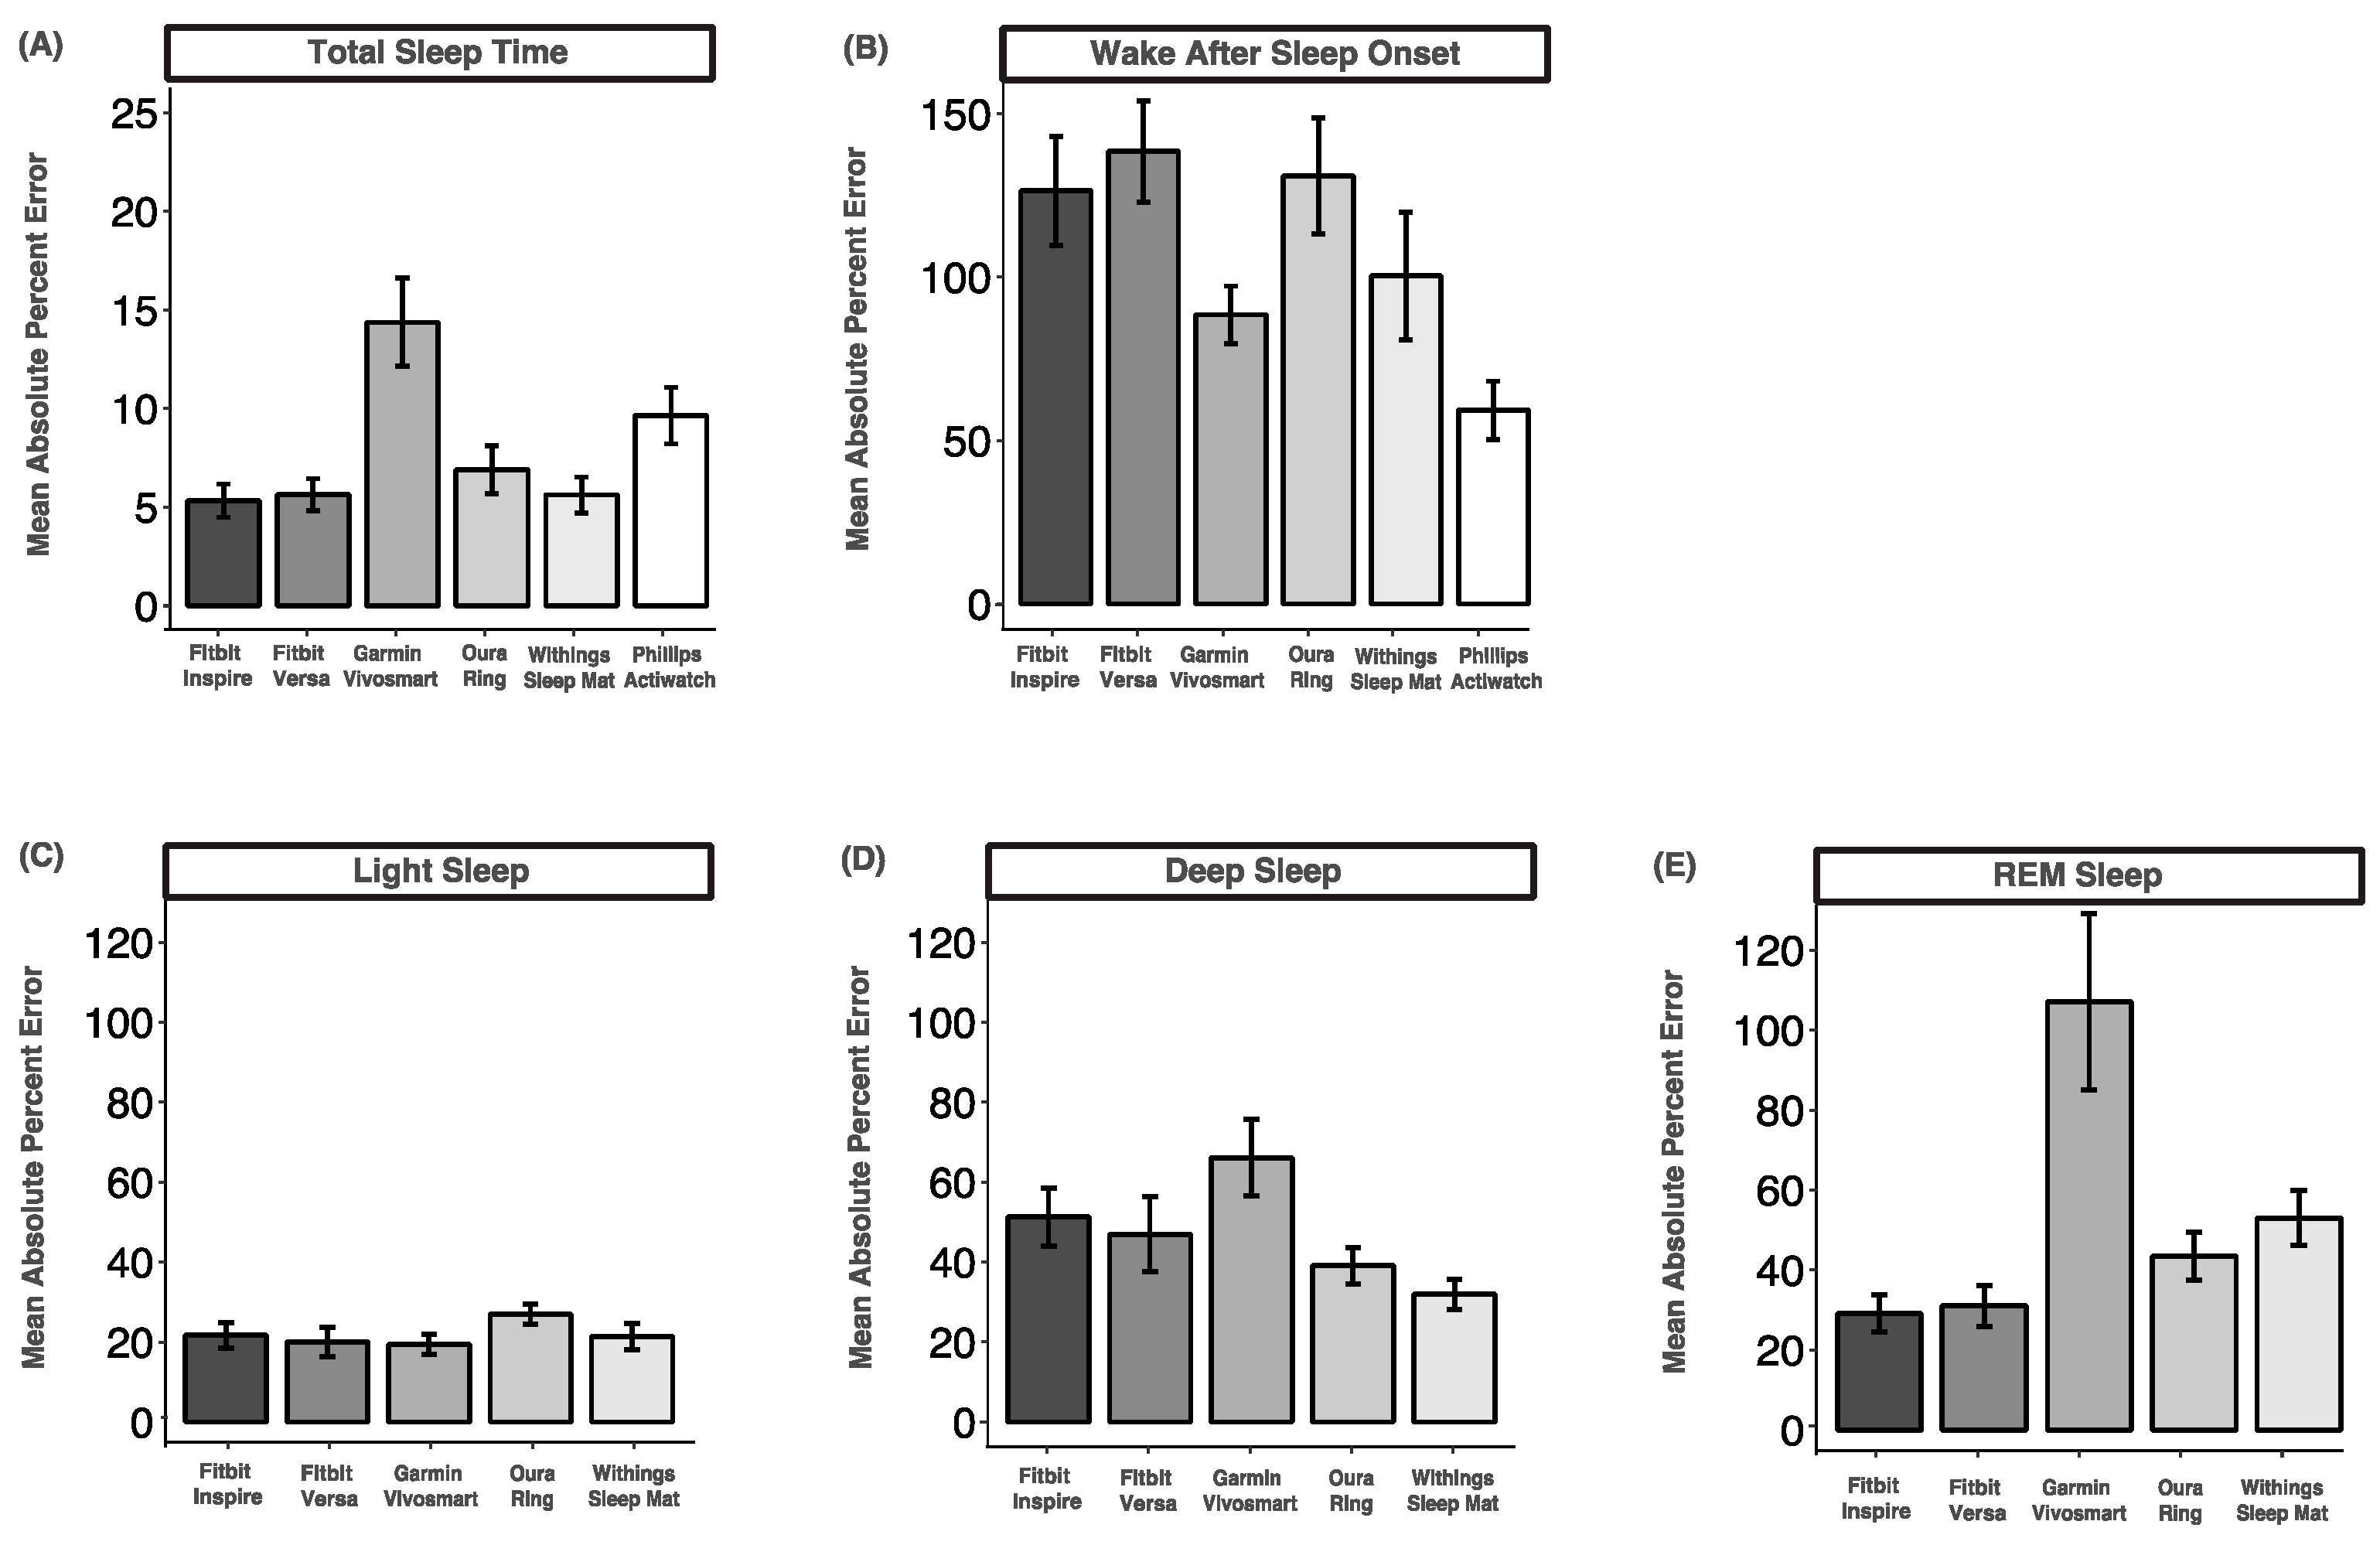
3.8. Mean Absolute Percent Error
4. Discussion
5. Limitations
6. Conclusions
Author Contributions
Funding
Institutional Review Board Statement
Informed Consent Statement
Data Availability Statement
Acknowledgments
Conflicts of Interest
References
- Khosla, S.; Deak, M.C.; Gault, D.; Goldstein, C.A.; Hwang, D.; Kwon, Y.; O’Hearn, D.; Schutte-Rodin, S.; Yurcheshen, M.; Rosen, I.M.; et al. Consumer sleep technology: An American academy of sleep medicine position statement. J. Clin. Sleep Med. 2018, 14, 877–880. [Google Scholar] [CrossRef] [PubMed]
- De Zambotti, M.; Cellini, N.; Menghini, L.; Sarlo, M.; Baker, F.C. Sensors Capabilities, Performance, and Use of Consumer Sleep Technology. Sleep Med. Clin. 2020, 15, 1–30. [Google Scholar] [CrossRef] [PubMed]
- Yoon, H.; Choi, S.H. Technologies for sleep monitoring at home: Wearables and nearables. Biomed. Eng. Lett. 2023, 13, 313–327. [Google Scholar] [CrossRef] [PubMed]
- Imtiaz, S.A. A systematic review of sensing technologies for wearable sleep staging. Sensors 2021, 21, 1562. [Google Scholar] [CrossRef] [PubMed]
- Chinoy, E.D.; Cuellar, J.A.; Huwa, K.E.; Jameson, J.T.; Watson, C.H.; Bessman, S.C.; Hirsch, D.A.; Cooper, A.D.; Drummond, S.P.A.; Markwald, R.R. Performance of seven consumer sleep-tracking devices compared with polysomnography. Sleep 2021, 44, zsaa291. [Google Scholar] [CrossRef] [PubMed]
- Grandner, M.A.; Lujan, M.R.; Ghani, S.B. Sleep-tracking technology in scientific research: Looking to the future. Sleep 2021, 44, zsab071. [Google Scholar] [CrossRef] [PubMed]
- Goldstein, C.A.; Depner, C. Miles to go before we sleep… A step toward transparent evaluation of consumer sleep tracking devices. Sleep 2021, 44, zsab020. [Google Scholar] [CrossRef]
- Topol, E.J. Welcoming new guidelines for AI clinical research. Nat. Med. 2020, 26, 1318–1320. [Google Scholar] [CrossRef]
- Norgeot, B.; Quer, G.; Beaulieu-Jones, B.K.; Torkamani, A.; Dias, R.; Gianfrancesco, M.; Arnaout, R.; Kohane, I.S.; Saria, S.; Topol, E.; et al. Minimum information about clinical artificial intelligence modeling: The MI-CLAIM checklist. Nat. Med. 2020, 26, 1320–1324. [Google Scholar] [CrossRef]
- Menghini, L.; Cellini, N.; Goldstone, A.; Baker, F.C.; De Zambotti, M. A standardized framework for testing the performance of sleep-Tracking technology: Step-by-step guidelines and open-source code. Sleep 2021, 44, zsaa170. [Google Scholar] [CrossRef]
- De Zambotti, M.; Cellini, N.; Goldstone, A.; Colrain, I.M.; Baker, F.C. Wearable Sleep Technology in Clinical and Research Settings. Med. Sci. Sports Exerc. 2019, 51, 1538–1557. [Google Scholar] [CrossRef]
- Baumert, M.; Cowie, M.R.; Redline, S.; Mehra, R.; Arzt, M.; Pépin, J.-L.; Linz, D. Sleep characterization with smart wearable devices: A call for standardization and consensus recommendations. Sleep 2022, 45, zsac183. [Google Scholar] [CrossRef]
- Faust, O.; Razaghi, H.; Barika, R.; Ciaccio, E.J.; Acharya, U.R. A review of automated sleep stage scoring based on physiological signals for the new millennia. Comput. Methods Programs Biomed. 2019, 176, 81–91. [Google Scholar] [CrossRef] [PubMed]
- Patel, A.K.; Reddy, V.; Shumway, K.R.; Araujo, J.F. Physiology, Sleep Stages. In StatPearls; StatPearls Publishing: Treasure Island, FL, USA, 2018. Available online: http://www.ncbi.nlm.nih.gov/pubmed/30252388 (accessed on 22 August 2023).
- Roebuck, A.; Monasterio, V.; Gederi, E.; Osipov, M.; Behar, J.; Malhotra, A.; Penzel, T.; Clifford, G.D. A review of signals used in sleep analysis. Physiol. Meas. 2014, 35, R1. [Google Scholar] [CrossRef] [PubMed]
- Hirshkowitz, M. The History of Polysomnography: Tool of Scientific Discovery. In Sleep Medicine; Springer: New York, NY, USA, 2015; pp. 91–100. [Google Scholar] [CrossRef]
- Kryger, M.H.; Dement, W.C.; Roth, T. (Eds.) Principles and Practice of Sleep Medicine; Elsevier: Amsterdam, The Netherlands, 2010. [Google Scholar] [CrossRef]
- Silber, M.H.; Ancoli-Israel, S.; Bonnet, M.H.; Chokroverty, S.; Grigg-Damberger, M.M.; Hirshkowitz, M.; Kapen, S.; Keenan, S.A.; Kryger, M.H.; Penzel, T.; et al. The visual scoring of sleep in adults. J. Clin. Sleep Med. 2007, 3, 121–131. [Google Scholar] [CrossRef] [PubMed]
- Berry, R.B.; Brooks, R.; Gamaldo, C.; Harding, S.M.; Lloyd, R.M.; Quan, S.F.; Troester, M.T.; Vaughn, B.V. AASM scoring manual updates for 2017 (version 2.4). J. Clin. Sleep Med. 2017, 13, 665–666. [Google Scholar] [CrossRef] [PubMed]
- Younes, M.; Raneri, J.; Hanly, P. Staging Sleep in Polysomnograms: Analysis of Inter-Scorer Variability. J. Clin. Sleep Med. 2016, 12, 885–894. [Google Scholar] [CrossRef] [PubMed]
- Berthomier, C.; Muto, V.; Schmidt, C.; Vandewalle, G.; Jaspar, M.; Devillers, J.; Gaggioni, G.; Chellappa, S.L.; Meyer, C.; Phillips, C.; et al. Exploring scoring methods for research studies: Accuracy and variability of visual and automated sleep scoring. J. Sleep Res. 2020, 29, e12994. [Google Scholar] [CrossRef]
- Deutsch, P.A.; Simmons, M.S.; Wallace, J.M. Cost-effectiveness of split-night polysomnography and home studies in the evaluation of obstructive sleep apnea syndrome. J. Clin. Sleep Med. 2006, 2, 145–153. [Google Scholar] [CrossRef]
- Van De Water, A.T.M.; Holmes, A.; Hurley, D.A. Objective measurements of sleep for non-laboratory settings as alternatives to polysomnography—A systematic review. J. Sleep Res. 2011, 20, 183–200. [Google Scholar] [CrossRef]
- Penzel, T. Sleep scoring moving from visual scoring towards automated scoring. Sleep 2022, 45, zsac190. [Google Scholar] [CrossRef] [PubMed]
- Bakker, J.P.; Ross, M.; Cerny, A.; Vasko, R.; Shaw, E.; Kuna, S.; Magalang, U.J.; Punjabi, N.M.; Anderer, P. Scoring sleep with artificial intelligence enables quantification of sleep stage ambiguity: Hypnodensity based on multiple expert scorers and auto-scoring. Sleep 2023, 46, zsac154. [Google Scholar] [CrossRef] [PubMed]
- Ko, P.R.T.; Kientz, J.A.; Choe, E.K.; Kay, M.; Landis, C.A.; Watson, N.F. Consumer sleep technologies: A review of the landscape. J. Clin. Sleep Med. 2015, 11, 1455–1461. [Google Scholar] [CrossRef] [PubMed]
- Hilty, D.M.; Armstrong, C.M.; Luxton, D.D.; Gentry, M.T.; Krupinski, E.A. A Scoping Review of Sensors, Wearables, and Remote Monitoring For Behavioral Health: Uses, Outcomes, Clinical Competencies, and Research Directions. J. Technol. Behav. Sci. 2021, 6, 278–313. [Google Scholar] [CrossRef]
- Shei, R.J.; Holder, I.G.; Oumsang, A.S.; Paris, B.A.; Paris, H.L. Wearable activity trackers–advanced technology or advanced marketing? Eur. J. Appl. Physiol. 2022, 122, 1975–1990. [Google Scholar] [CrossRef] [PubMed]
- Rapoport, D.M. Non-contact sleep monitoring: Are we there yet? J. Clin. Sleep Med. 2019, 15, 935–936. [Google Scholar] [CrossRef] [PubMed]
- Danzig, R.; Wang, M.; Shah, A.; Trotti, L.M. The wrist is not the brain: Estimation of sleep by clinical and consumer wearable actigraphy devices is impacted by multiple patient- and device-specific factors. J. Sleep Res. 2020, 29, e12926. [Google Scholar] [CrossRef] [PubMed]
- Svensson, T.; Chung, U.I.; Tokuno, S.; Nakamura, M.; Svensson, A.K. A validation study of a consumer wearable sleep tracker compared to a portable EEG system in naturalistic conditions. J. Psychosom. Res. 2019, 126, 109822. [Google Scholar] [CrossRef]
- Imtiaz, S.A.; Rodriguez-Villegas, E. Recommendations for performance assessment of automatic sleep staging algorithms. In Proceedings of the 2014 36th Annual International Conference of the IEEE Engineering in Medicine and Biology Society (EMBC 2014), Chicago, IL, USA, 26–30 August 2014; pp. 5044–5047. [Google Scholar] [CrossRef]
- Horne, J.A.; Ostberg, O. A self assessment questionnaire to determine Morningness Eveningness in human circadian rhythms. Int. J. Chronobiol. 1976, 4, 97–110. [Google Scholar]
- Buysse, D.J.; Reynolds, C.F.; Monk, T.H.; Berman, S.R.; Kupfer, D.J. The Pittsburgh sleep quality index: A new instrument for psychiatric practice and research. Psychiatry Res. 1989, 28, 193–213. [Google Scholar] [CrossRef]
- Chow, C.M.; Wong, S.N.; Shin, M.; Maddox, R.G.; Feilds, K.L.; Paxton, K.; Hawke, C.; Hazell, P.; Steinbeck, K. Defining the rest interval associated with the main sleep period in actigraph scoring. Nat. Sci. Sleep 2016, 8, 321–328. [Google Scholar] [CrossRef] [PubMed]
- Chinoy, E.D.; Cuellar, J.A.; Jameson, J.T.; Markwald, R.R. Performance of Four Commercial Wearable Sleep-Tracking Devices Tested Under Unrestricted Conditions at Home in Healthy Young Adults. Nat. Sci. Sleep 2022, 14, 493–516. [Google Scholar] [CrossRef] [PubMed]
- Koo, T.K.; Li, M.Y. A Guideline of Selecting and Reporting Intraclass Correlation Coefficients for Reliability Research. J. Chiropr. Med. 2016, 15, 155–163. [Google Scholar] [CrossRef] [PubMed]
- Kubala, A.G.; Gibbs, B.B.; Buysse, D.J.; Patel, S.R.; Hall, M.H.; Kline, C.E. Field-based Measurement of Sleep: Agreement between Six Commercial Activity Monitors and a Validated Accelerometer. Behav. Sleep Med. 2020, 18, 637–652. [Google Scholar] [CrossRef] [PubMed]
- Cellini, N.; McDevitt, E.A.; Mednick, S.C.; Buman, M.P. Free-living Cross-Comparison of Two Wearable Monitors for Sleep and Physical Activity in Healthy Young Adults. Physiol. Behav. 2016, 157, 79–86. [Google Scholar] [CrossRef]
- R Foundation for Statistical Computing. A Language and Environment for Statistical Computing; R Foundation for Statistical Computing: Vienna, Austria, 2010; Volume 10, pp. 11–18. Available online: https://www.r-project.org/ (accessed on 26 May 2021).
- Miller, D.J.; Sargent, C.; Roach, G.D. A Validation of Six Wearable Devices for Estimating Sleep, Heart Rate and Heart Rate Variability in Healthy Adults. Sensors 2022, 22, 6317. [Google Scholar] [CrossRef]
- De Zambotti, M.; Menghini, L.; Grandner, M.A.; Redline, S.; Zhang, Y.; Wallace, M.L.; Buxton, O.M. Rigorous performance evaluation (previously, ‘validation’) for informed use of new technologies for sleep health measurement. Sleep Health 2022, 8, 263–269. [Google Scholar] [CrossRef]
- Depner, C.M.; Cheng, P.C.; Devine, J.K.; Khosla, S.; de Zambotti, M.; Robillard, R.; Vakulin, A.; Drummond, S.P.A. Wearable technologies for developing sleep and circadian biomarkers: A summary of workshop discussions. Sleep 2020, 43, zsz254. [Google Scholar] [CrossRef]
- Mantua, J.; Gravel, N.; Spencer, R.M.C. Reliability of sleep measures from four personal health monitoring devices compared to research-based actigraphy and polysomnography. Sensors 2016, 16, 646. [Google Scholar] [CrossRef]
- De Zambotti, M.; Rosas, L.; Colrain, I.M.; Baker, F.C. The Sleep of the Ring: Comparison of the ŌURA Sleep Tracker Against Polysomnography. Behav. Sleep Med. 2019, 17, 124–136. [Google Scholar] [CrossRef]
- Cook, J.D.; Eftekari, S.C.; Dallmann, E.; Sippy, M.; Plante, D.T. Ability of the Fitbit Alta HR to quantify and classify sleep in patients with suspected central disorders of hypersomnolence: A comparison against polysomnography. J. Sleep Res. 2019, 28, e12789. [Google Scholar] [CrossRef] [PubMed]
- De Zambotti, M.; Goldstone, A.; Claudatos, S.; Colrain, I.M.; Baker, F.C. A validation study of Fitbit Charge 2™ compared with polysomnography in adults. Chronobiol. Int. 2018, 35, 465–476. [Google Scholar] [CrossRef]
- Kahawage, P.; Jumabhoy, R.; Hamill, K.; de Zambotti, M.; Drummond, S.P.A. Validity, potential clinical utility, and comparison of consumer and research-grade activity trackers in Insomnia Disorder I: In-lab validation against polysomnography. J. Sleep Res. 2020, 29, e12931. [Google Scholar] [CrossRef]
- Moreno-Pino, F.; Porras-Segovia, A.; López-Esteban, P.; Artés, A.; Baca-García, E. Validation of fitbit charge 2 and fitbit alta hr against polysomnography for assessing sleep in adults with obstructive sleep apnea. J. Clin. Sleep Med. 2019, 15, 1645–1653. [Google Scholar] [CrossRef] [PubMed]
- Lee, X.K.; Chee, N.I.Y.N.; Ong, J.L.; Teo, T.B.; van Rijn, E.; Lo, J.C.; Chee, M.W.L. Validation of a consumer sleep wearable device with actigraphy and polysomnography in adolescents across sleep opportunity manipulations. J. Clin. Sleep Med. 2019, 15, 1337–1346. [Google Scholar] [CrossRef] [PubMed]
- Schade, M.M.; Bauer, C.E.; Murray, B.R.; Gahan, L.; Doheny, E.P.; Kilroy, H.; Zaffaroni, A.; Montgomery-Downs, H.E. Sleep validity of a non-contact bedside movement and respiration-sensing device. J. Clin. Sleep Med. 2019, 15, 1051–1061. [Google Scholar] [CrossRef]
- Colvonen, P.J.; DeYoung, P.N.; Bosompra, N.O.A.; Owens, R.L. Limiting racial disparities and bias for wearable devices in health science research. Sleep 2020, 43, zsaa159. [Google Scholar] [CrossRef]
- Djanian, S.; Bruun, A.; Nielsen, T.D. Sleep classification using Consumer Sleep Technologies and AI: A review of the current landscape. Sleep Med. 2022, 100, 390–403. [Google Scholar] [CrossRef]
- Hamill, K.; Jumabhoy, R.; Kahawage, P.; de Zambotti, M.; Walters, E.M.; Drummond, S.P.A. Validity, potential clinical utility and comparison of a consumer activity tracker and a research-grade activity tracker in insomnia disorder II: Outside the laboratory. J. Sleep Res. 2020, 29, e12944. [Google Scholar] [CrossRef]
- Nowara, E.M.; McDuff, D.; Veeraraghavan, A. A Meta-Analysis of the Impact of Skin Tone and Gender on Non-Contact Photoplethysmography Measurements. 2020, pp. 284–285. Available online: http://data.un.org/ (accessed on 11 January 2024).
- Koerber, D.; Khan, S.; Shamsheri, T.; Kirubarajan, A.; Mehta, S. Accuracy of Heart Rate Measurement with Wrist-Worn Wearable Devices in Various Skin Tones: A Systematic Review. J. Racial Ethn. Health Disparities 2023, 10, 2676–2684. [Google Scholar] [CrossRef]
- Puranen, A.; Halkola, T.; Kirkeby, O.; Vehkaoja, A. Effect of skin tone and activity on the performance of wrist-worn optical beat-to-beat heart rate monitoring. In Proceedings of the 2020 IEEE SENSORS, Rotterdam, The Netherlands, 25–28 October 2020. [Google Scholar] [CrossRef]
- Cabanas, A.M.; Fuentes-Guajardo, M.; Latorre, K.; León, D.; Martín-Escudero, P. Skin Pigmentation Influence on Pulse Oximetry Accuracy: A Systematic Review and Bibliometric Analysis. Sensors 2022, 22, 3402. [Google Scholar] [CrossRef] [PubMed]
- Chandrasekaran, R.; Katthula, V.; Moustakas, E. Patterns of Use and Key Predictors for the Use of Wearable Health Care Devices by US Adults: Insights from a National Survey. J. Med. Internet Res. 2020, 22, e22443. [Google Scholar] [CrossRef] [PubMed]
- Berryhill, S.; Morton, C.J.; Dean, A.; Berryhill, A.; Provencio-Dean, N.; Patel, S.I.; Estep, L.; Combs, D.; Mashaqi, S.; Gerald, L.B.; et al. Effect of wearables on sleep in healthy individuals: A randomized crossover trial and validation study. J. Clin. Sleep Med. 2020, 16, 775–783. [Google Scholar] [CrossRef]
- Peake, J.M.; Kerr, G.; Sullivan, J.P. A critical review of consumer wearables, mobile applications, and equipment for providing biofeedback, monitoring stress, and sleep in physically active populations. Front. Physiol. 2018, 9, 743. [Google Scholar] [CrossRef] [PubMed]

| Cost | Location | Measurements | |
|---|---|---|---|
| Fitbit Inspire HR | USD 97 | Wrist | Activity, Sleep, Heart Rate |
| Fitbit Versa 2 | USD 200 | Wrist | Activity, Sleep, Heart Rate, SpO2 |
| Garmin Vivosmart | USD 110 | Wrist | Activity, Sleep, Heart Rate, SpO2 |
| Oura Ring | USD 300 | Finger | Activity, Sleep, Heart Rate |
| Withings | USD 80 | Under Mattress | Activity, Sleep, Heart Rate |
| Actiwatch | USD 800 | Wrist | Activity, Sleep |
| Total | F:M | White | Asian | Hispanic | Black | DNR | |
|---|---|---|---|---|---|---|---|
| N | 53 | 31:22 | 29 | 11 | 7 | 3 | 3 |
| Age (Years) | Height (m) | Weight (kg) | BMI (kg/m2) | MEQ * | PSQI | |
|---|---|---|---|---|---|---|
| Mean (SD) | 22.5 (3.5) | 1.7 (0.10) | 69.4 (16.6) | 23.7 (5.0) | 45.4 (8.4) | 5.9 (2.8) |
| Median | 22.0 | 1.7 | 65.8 | 22.7 | 45.5 | 6.0 |
| Range | 18–34 | 1.5–1.9 | 49.9–131 | 16.9–44.4 | 26–64 | 1–17 |
| TST | WASO | NREM1 | NREM2 | NREM3 | REM | |
|---|---|---|---|---|---|---|
| Mean (SD) | 431 (54.7) | 33.1 (22.6) | 15.7 (10.0) | 226 (38.4) | 113 (35.2) | 76.4 (25.2) |
| Device | % of Data Lost | N Errors Total | Data Synch | Poor Fit | Low Battery |
|---|---|---|---|---|---|
| Fitbit Inspire | 5.6% | 3 | 1 | 2 | 0 |
| Fitbit Versa | 18.8% | 10 | 9 | 1 | 0 |
| Vivosmart | 5.6% | 3 | 2 | 1 | 0 |
| Oura Ring | 7.5% | 4 | 3 | 0 | 1 |
| Withings | 11.3% | 6 | 6 | 0 | 0 |
| Actiwatch | 15.1% | 8 | 1 | 7 | 0 |
| Device (min) | PSG (min) | Bias | LOA | ICC | |
|---|---|---|---|---|---|
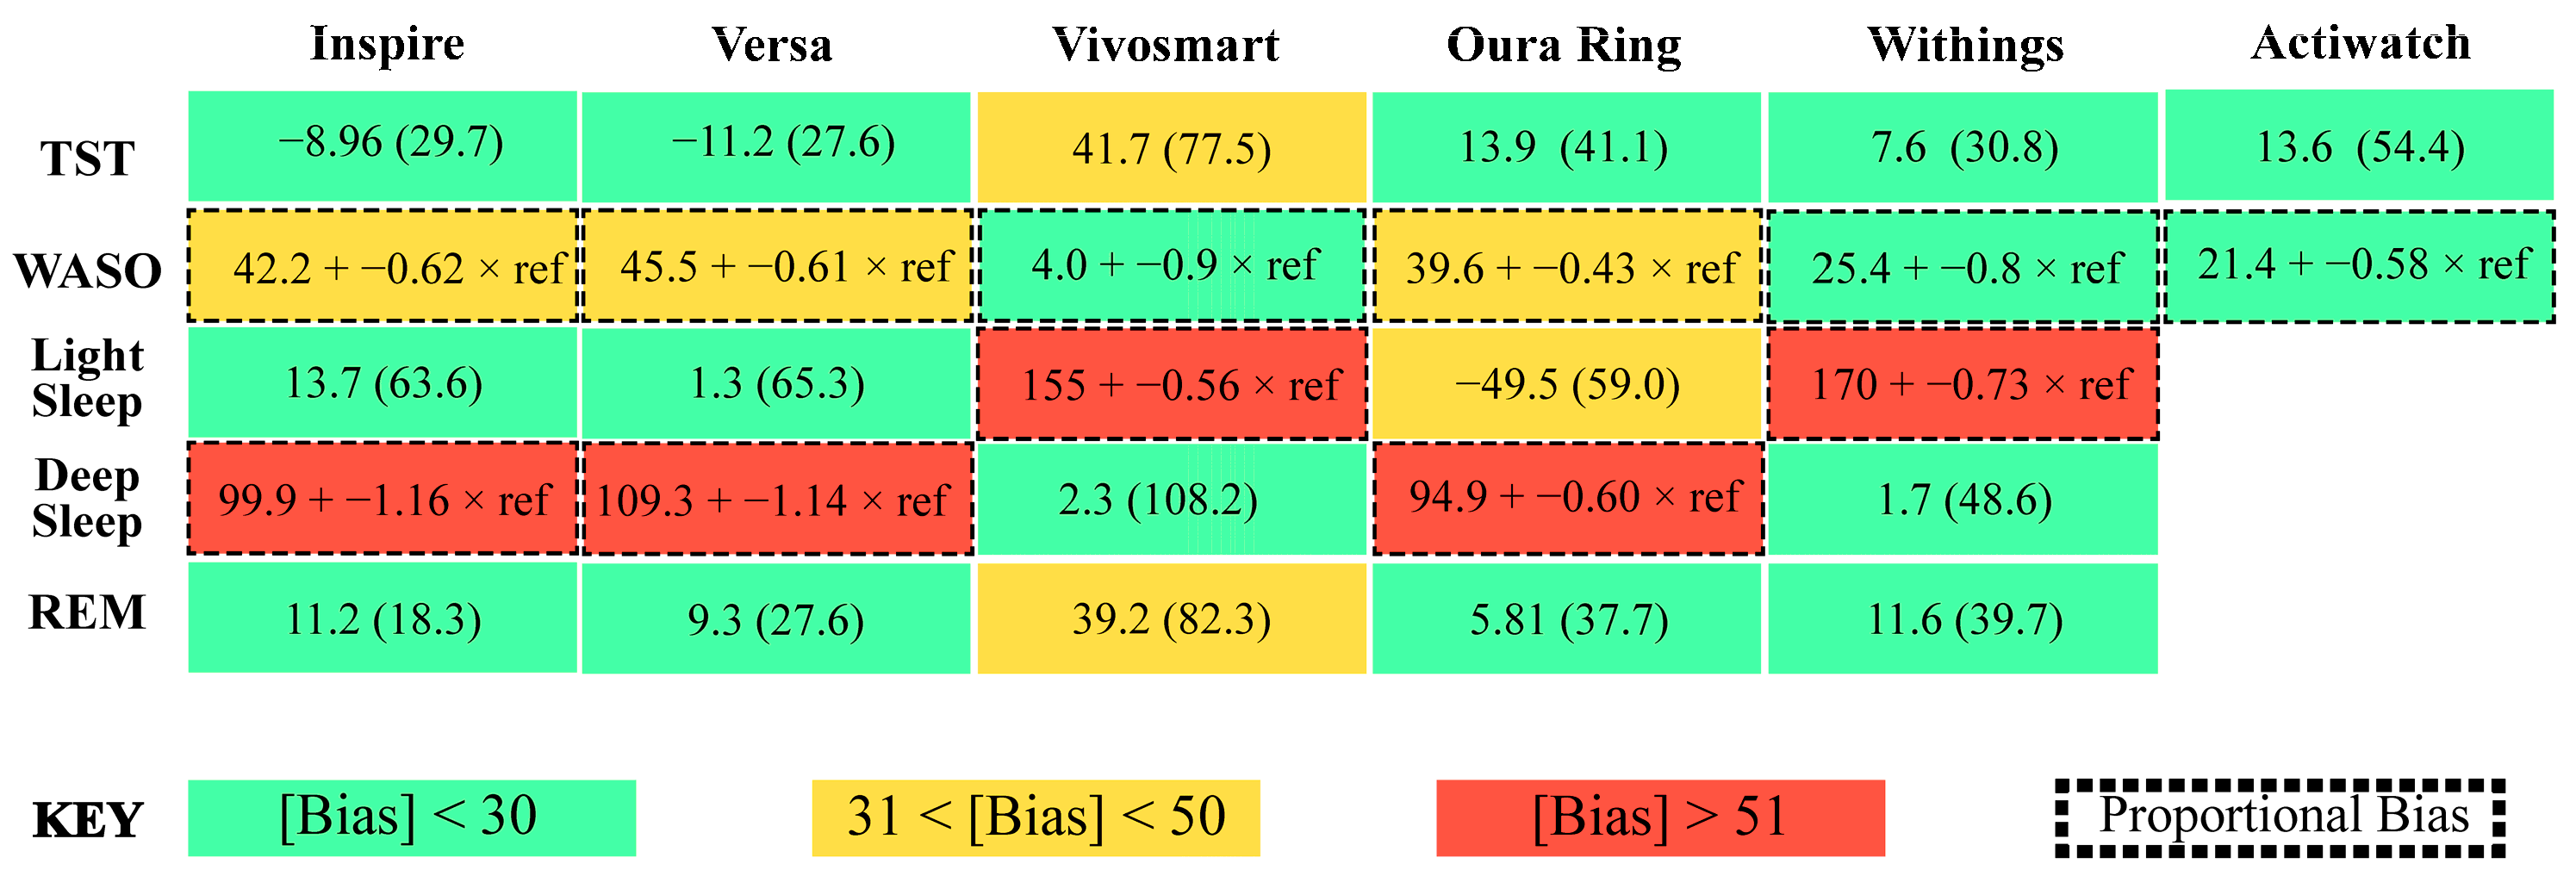
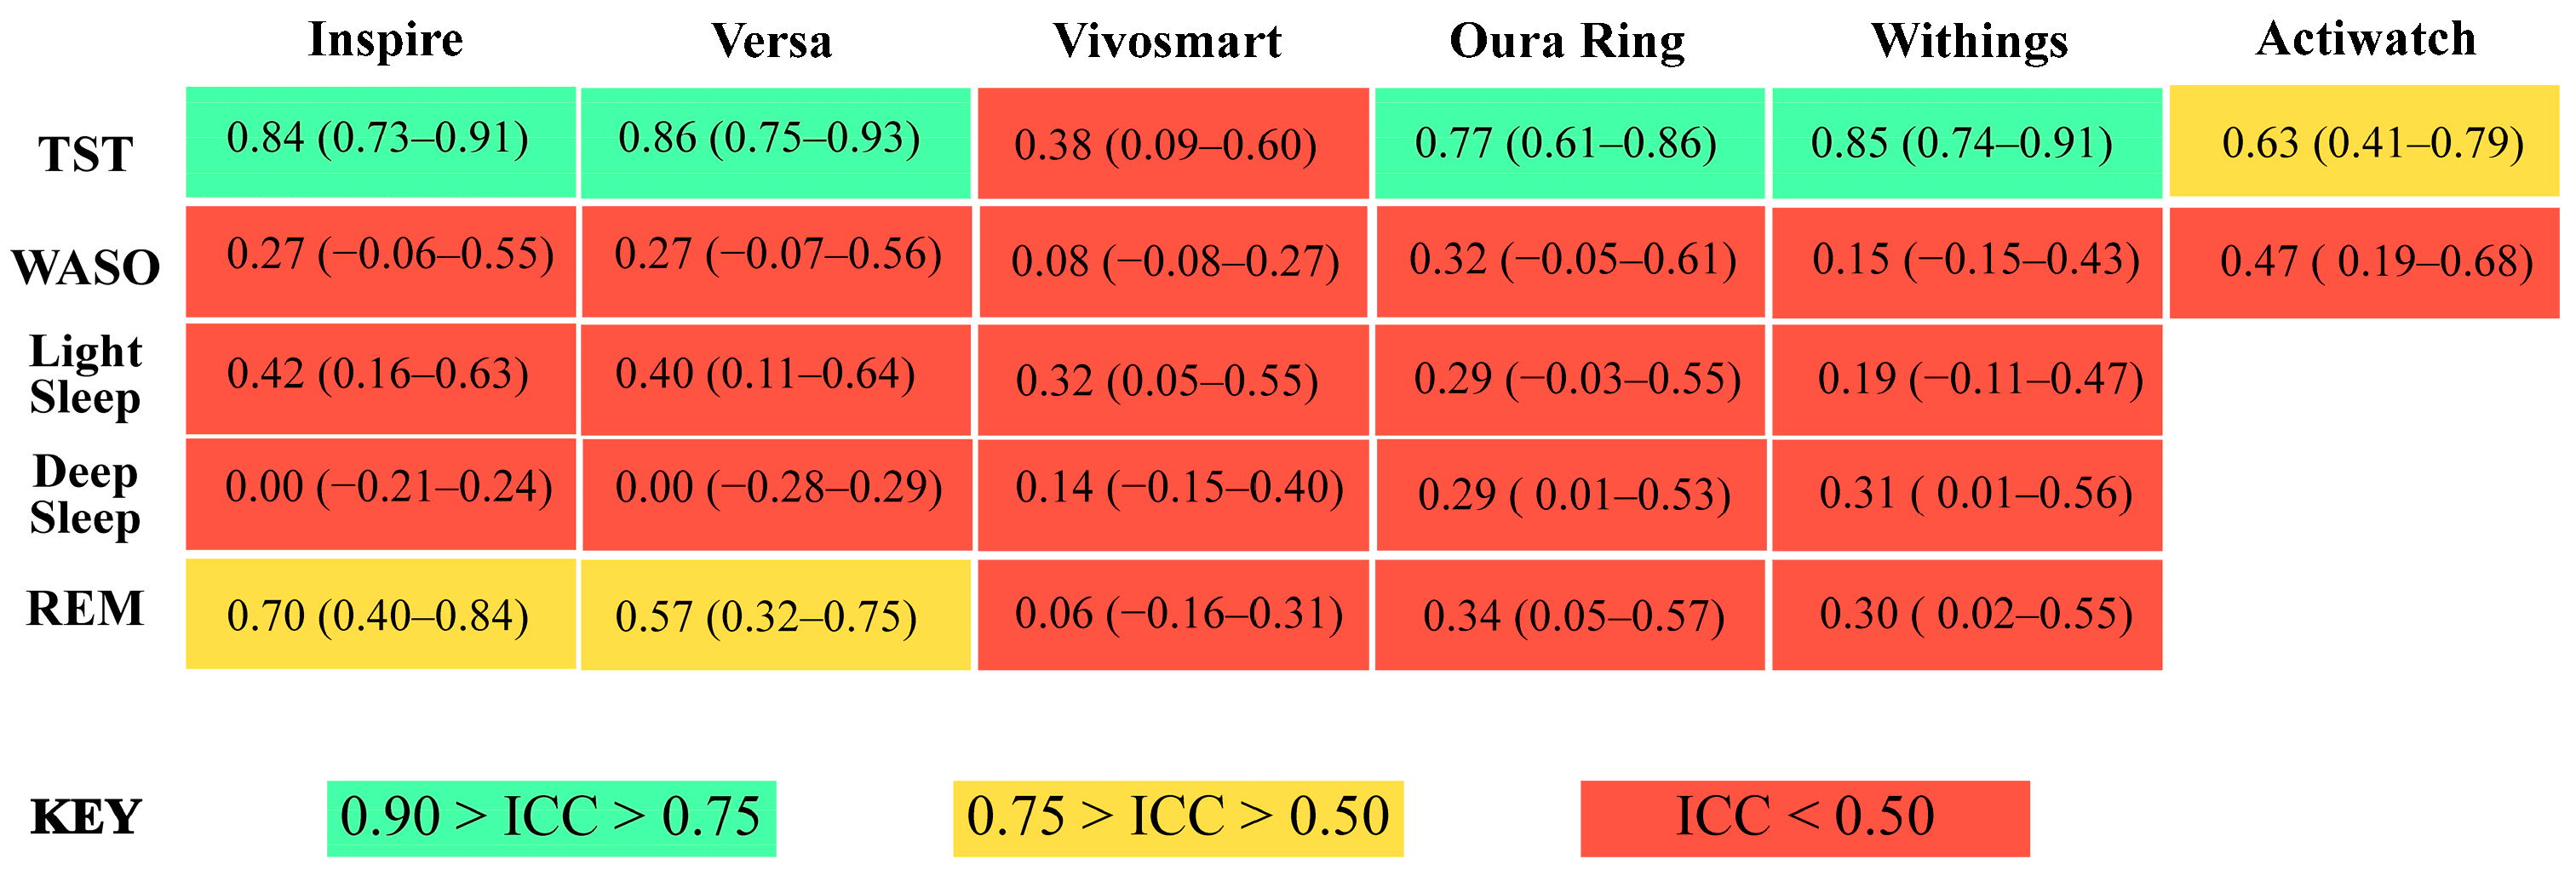
| Inspire | 424.5 (66.4) | 433.5 (52.7) | −8.96 (29.7) | 0.15 | 0.84 (0.73–0.91) |
| Versa | 423.7 (57.7) | 434.9 (56.6) | −11.2 (27.6) | 0.14 | 0.86 (0.75–0.93) |
| Vivosmart | 476.6 (87.9) | 435.0 (53.5) | 41.7 (77.5) | 0.46 | 0.38 (0.09–0.60) |
| Oura Ring | 420.7 (70.6) | 434.6 (54.1) | −13.9 (41.1) | 0.23 | 0.77 (0.61–0.86) |
| Withings | 443.6 (58.9) | 436.0 (55.9) | 7.6 (30.8) | 0.16 | 0.85 (0.74–0.91) |
| Actiwatch | 449.0 (71.1) | 435.4 (56.7) | 13.6 (54.4) | 0.26 | 0.63 (0.41–0.79) |
| Device (min) | PSG (min) | Bias | LOA | ICC | |
|---|---|---|---|---|---|
| Inspire | 54.8 (20.1) | 32.7 (22.2) | 42.2 + −0.62 × ref | 0.99 | 0.27 (−0.06–0.55) |
| Versa | 58.5 (21.9) | 33.5 (24.3) | 45.5 + −0.61 × ref | 1.01 | 0.27 (−0.07–0.56) |
| Vivosmart | 7.2 (10.1) | 33.1 (22.9) | 4.0 + −0.9 × ref | 2.00 | 0.08 (−0.08–0.27) |
| Oura Ring | 58.8 (26.6) | 33.6 (23.2) | 39.6 + −0.43 × ref | 1.01 | 0.32 (−0.05–0.61) |
| Withings | 32.2 (33.2) | 33.6 (23.9) | 25.4 + −0.8 × ref | 2.00 | 0.15 (−0.15–0.43) |
| Actiwatch | 35.9 (21.1) | 34.7 (23.5) | 21.4 + −0.58 × ref | 1.10 | 0.47 (0.19–0.68) |
| Device (min) | PSG (min) | Bias | LOA | ICC | |
|---|---|---|---|---|---|
| Inspire | 256.8 (73.0) | 243.0 (42.2) | 13.7 (63.6) | 0.79 | 0.42 (0.16–0.63) |
| Versa | 246.2 (72.2) | 244.9 (43.1) | 1.3 (65.3) | 0.80 | 0.40 (0.11–0.64) |
| Vivosmart | 263.3 (51.7) | 243.0 (41.3) | 155 + −0.56 × ref | 0.41 | 0.32 (0.05–0.55) |
| Oura Ring | 193.5 (64.3) | 243.0 (42.2) | −49.5 (59.0) | 0.60 | 0.29 (−0.03–0.55) |
| Withings | 235.9 (58.5) | 243.6 (42.7) | 170 + −0.73 × ref | 0.51 | 0.19 (−0.11–0.47) |
| Device (min) | PSG (min) | Bias | LOA | ICC | |
|---|---|---|---|---|---|
| Inspire | 81.5 (52.3) | 117.7 (30.4) | 99.9 + −1.16 × ref | 1.10 | 0.00 (−0.21–0.24) |
| Versa | 92.2 (56.3) | 117.2 (30.8) | 109.3 + −1.14 × ref | 0.96 | 0.00 (−0.28–0.29) |
| Vivosmart | 120.3(110) | 117.9 (30.3) | 2.3 (108.2) | 1.99 | 0.14 (−0.15–0.40) |
| Oura Ring | 142.5(40.5) | 118.5 (30.9) | 94.9 + −0.6 × ref | 0.67 | 0.29 (0.01–0.53) |
| Withings | 122.8(48.1) | 121.1 (30.2) | 1.7 (48.6) | 0.93 | 0.31 (0.01–0.56) |
| Device (min) | PSG (min) | Bias | LOA | ICC | |
|---|---|---|---|---|---|
| Inspire | 86.8 (27.4) | 75.6 (24.2) | 11.2 (18.3) | 0.52 | 0.70 (0.40–0.84) |
| Versa | 85.8 (34.6) | 76.5 (26.6) | 9.3 (27.6) | 0.69 | 0.57 (0.32–0.75) |
| Vivosmart | 115.6 (81.8) | 76.3 (25.0) | 39.2 (82.3) | 2.00 | 0.06 (−0.16–0.31) |
| Oura Ring | 81.8 (38.9) | 75.9 (25.4) | 5.81 (37.7) | 1.11 | 0.34 (0.05–0.57) |
| Withings | 85.8 (41.0) | 74.2 (24.7) | 11.6 (39.7) | 1.93 | 0.30 (0.02–0.55) |
Disclaimer/Publisher’s Note: The statements, opinions and data contained in all publications are solely those of the individual author(s) and contributor(s) and not of MDPI and/or the editor(s). MDPI and/or the editor(s) disclaim responsibility for any injury to people or property resulting from any ideas, methods, instructions or products referred to in the content. |
© 2024 by the authors. Licensee MDPI, Basel, Switzerland. This article is an open access article distributed under the terms and conditions of the Creative Commons Attribution (CC BY) license (https://creativecommons.org/licenses/by/4.0/).
Share and Cite
Kainec, K.A.; Caccavaro, J.; Barnes, M.; Hoff, C.; Berlin, A.; Spencer, R.M.C. Evaluating Accuracy in Five Commercial Sleep-Tracking Devices Compared to Research-Grade Actigraphy and Polysomnography. Sensors 2024, 24, 635. https://doi.org/10.3390/s24020635
Kainec KA, Caccavaro J, Barnes M, Hoff C, Berlin A, Spencer RMC. Evaluating Accuracy in Five Commercial Sleep-Tracking Devices Compared to Research-Grade Actigraphy and Polysomnography. Sensors. 2024; 24(2):635. https://doi.org/10.3390/s24020635
Chicago/Turabian StyleKainec, Kyle A., Jamie Caccavaro, Morgan Barnes, Chloe Hoff, Annika Berlin, and Rebecca M. C. Spencer. 2024. "Evaluating Accuracy in Five Commercial Sleep-Tracking Devices Compared to Research-Grade Actigraphy and Polysomnography" Sensors 24, no. 2: 635. https://doi.org/10.3390/s24020635