
Investigation of the Efficacy of a Listeria monocytogenes Biosensor Using Chicken Broth Samples
by
 , , ,
, , ,
Or Zolti
1,
Baviththira Suganthan
1,
Sanket Naresh Nagdeve
1,
Ryan Maynard
2,
Jason Locklin
2 and
Ramaraja P. Ramasamy
1,* 
1
Nano Electrochemistry Laboratory, College of Engineering, University of Georgia, Athens, GA 30602, USA
2
Department of Chemistry, University of Georgia, Athens, GA 30602, USA
*
Author to whom correspondence should be addressed.
Sensors 2024, 24(8), 2617; https://doi.org/10.3390/s24082617
Submission received: 19 March 2024
/
Revised: 6 April 2024
/
Accepted: 17 April 2024
/
Published: 19 April 2024
(This article belongs to the Special Issue Sensors in 2024)
Abstract
:Foodborne pathogens are microbes present in food that cause serious illness when the contaminated food is consumed. Among these pathogens, Listeria monocytogenes is one of the most serious bacterial pathogens, and causes severe illness. The techniques currently used for L. monocytogenes detection are based on common molecular biology tools that are not easy to implement for field use in food production and distribution facilities. This work focuses on the efficacy of an electrochemical biosensor in detecting L. monocytogenes in chicken broth. The sensor is based on a nanostructured electrode modified with a bacteriophage as a bioreceptor which selectively detects L. monocytogenes using electrochemical impedance spectroscopy. The biosensing platform was able to reach a limit of detection of 55 CFU/mL in 1× PBS buffer and 10 CFU/mL in 1% diluted chicken broth. The biosensor demonstrated 83–98% recovery rates in buffer and 87–96% in chicken broth.
1. Introduction
There are 17 different species of the Listeria genus. Among them, only two species are pathogenic: Listeria ivanovii, found almost exclusively in ruminants, and Listeria monocytogenes (L. monocytogenes), which can infect humans and cause illnesses [1,2]. L. monocytogenes is a facultative, anaerobic, Gram-positive, rod-shaped bacterium known since 1924. It is a psychrophile pathogen capable of multiplying at refrigeration temperature (4 °C) and surviving at temperatures as low as −17 °C, with an optimum growing temperature range of 30 to 37 °C [3,4]. L. monocytogenes infection leads to illnesses such as listeriosis, sepsis, myocarditis, meningitis, encephalitis, bacteremia, and intrauterine or cervical infections in pregnant women that could lead to miscarriages or stillbirth [5]. The most common path of L. monocytogenes infection is through the gastrointestinal tract, similar to other foodborne pathogens. It can be found in various food products like poultry, pork, beef, dairy products, bread, fish, ready-to-eat foods, and fresh produce [6]. Its ability to form biofilms facilitates infection from surfaces, transport vehicles, and stainless-steel appliances [2,7]. Liquid and semi-liquid products like broth, milk, or soft cheeses are suitable growing grounds for Listeria detection. Chicken broth is made by cooking chicken and raw vegetables in water and, therefore, can represent samples of chicken, vegetables, and liquid samples [7,8,9,10,11].
The detection of L. monocytogenes has been performed with various types of biosensors. As their name suggests, optical biosensors provide an optical signal through luminescence, fluorescence, or color. The optical approach is very sensitive and selective but requires expensive optical equipment and is sensitive to environmental interference [12]. Thermal biosensors measure the heat change due to bioreaction between the biorecognition molecule and specific analytes that correspond with the target pathogen. The method is fast and sensitive, but its selectivity is low due to non-target responses [13]. Electrochemical biosensors (ECBSs) measure the changes in electric parameters like the current, potential, or impedance of a system due to biological interaction between the target analyte and the biorecognition molecule on the working electrode. ECBSs are sensitive, selective, fast, low cost, and do not require trained personnel. They require a small sample volume and can be portable, which makes them optimal for home or field detection in buffer or food samples [6,12,14,15].
In our previous work, we developed different phage-based approaches for separating and detecting different pathogens [16,17,18,19]. A biosensor utilizing phage-immobilized quarternized carbon nanotubes (q-CNTs) for the detection of L. monocytogenes in 1× phosphate-buffered saline (PBS) with a limit of detection of 8.4 CFU/mL was also presented [3]. This work presents an adaptation of our biosensor to a portable platform constructed from commercially available screen-printed electrodes in order to detect L. monocytogenes in chicken broth samples. This newly adapted platform, as seen in Figure 1a, offers the ability to detect the pathogen without specialized lab equipment.
The most common detection methods for L. monocytogenes include genomic and antibody-based approaches. Electrochemical detection systems relying on antibodies for L. monocytogenes have demonstrated a limit of detection (LOD) of 35 CFU/mL in 1× PBS buffer and 22 CFU/mL in spiked lettuce samples. Despite their high sensitivity, antibody-based systems are constrained by limitations in stability and cost compared to bacteriophage-based alternatives [20,21]. Another detection strategy involves genomic methods, utilizing DNA or RNA for L. monocytogenes detection, and achieving remarkably low LODs on the order of 10−14 M. However, these methods have notable drawbacks, including the necessity of high-temperature sample preparation for denaturation and prolonged sample preparation times ranging from 8 to 24 h at minimum [22,23,24]. Additionally, nucleotide- or antibody-based methods are not capable of distinguishing living and dead bacterial cells and therefore are not particularly attractive for food safety testing. The phage-based method discussed in this work overcomes this drawback [25,26,27,28,29,30,31].
2. Materials and Methods
2.1. Materials Used
Carboxylic acid functionalized multiwalled carbon nanotubes (COOH-CNT) with a 30–50 nm outer diameter and a 10–20 µm length (from Cheap Tubes Inc., Cambridgeport, Vermont, USA); 1-pyrenebutanoic acid succinimidyl ester (PBSE), bovine serum albumin (BSA), Tween® 20, dichloromethane and chlorodimethylsilane (all four from Sigma-Aldrich, St. Louis, MO, USA); dimethyl sulfoxide (DMSO) (Thermo-Scientific, Waltham, MA, USA); disodium phosphate (Na2HPO4) (Research Products International Corp, Mt Prospect, IL, USA); sodium chloride (NaCl) (EMD chemicals, Massachusetts, USA); magnesium sulfate heptahydrate (MgSO4·7H2O (J.T. Baker, Japan); thionyl chloride (SOCl2) and iodomethane (CH3I) (both from Alfa Aesar, Haverhill, Massachusetts, USA); potassium phosphate dibasic (KH2PO4) and potassium chloride (both from BDH, Solon, Ohio, USA); tris base, typtone, and ethanol (all three from Fisher Scientific, Hampton, New Hampshire); yeast extract and agar powder (both from Becton Dickinson and Company, Franklin Lakes, New Jersey, USA); and chicken broth (GreenWise ®, Lakeland, Florida, USA) were purchased from the respective commercial vendors and used as received.
Phosphate-buffered saline 10× (100 mL) was prepared by mixing 0.2 g of KCl, 8 g of NaCl, 0.245 g of KH2PO4, and 1.4 g of Na2HPO4. PBS (1×) (pH 7.4) was prepared by diluting the PBS 10× buffer. A quantity of 0.01% tween 20 solution was prepared by mixing 10 mL of PBS (1×), 85 mL deionized water (DIW), and 20 µL of Tween® 20. Luria Bertani (L.B.) (100 mL) (pH 7.0) was prepared by mixing 1 g of tryptone, 0.5 g of yeast extract, and 1 g of NaCl. S.M. buffer (pH 7.5) was prepared by mixing 100 mM NaCl, 8 mM MgSO4. 7H2O, 50 mM Tris base, and 0.01% gelatin. Standard brain–heart infusion (BHI) media was prepared by mixing 37 g of the BHI powder into 1 L of DIW using a magnetic stirrer until a homogenized solution was formed. Chicken broth, 1% dilution, was prepared by diluting 1 mL chicken broth into 99 mL 1× PBS and vortex-mixing the resulting solution. DIW with a resistivity of 18 MΩ.cm was used to prepare all the media and chemicals. All buffers and media were sterilized before use.
Screen-printed electrodes (SPE) (Zensor, Taichung City, Taiwan) were purchased from C.H. Instruments, Inc., Austin, TX, USA and used as working-, counter-, and quasi-reference electrodes. All flow-based experiments were performed using a microfluidic flow cell from Metrohm Dropsens, Oviedo, Asturias. All electrochemical impedimetric measurements were performed using a CHI-920C model potentiostat (CH Instruments Inc., Austin, TX, USA).
2.2. Methods Used
2.2.1. Microbiological Methods
Listeria monocytogenes Scott A, a pathogenic strain, was used as the target analyte, whereas Salmonella enterica subsp. Enterica serovar Typhimurium 291RH (ser. Typhimurium-291RH) and Escherichia coli O157:H7 (E. coli O157:H7) were used as the non-target pseudo-analytes for specificity studies. Listex P100 bacteriophage (P100 Phage) was purchased from Micreos Food Safety B.V, Wageningen, Netherlands. L. monocytogenes Scott A was grown by inoculating a single colony in 3 mL of BHI media and incubating at 37 °C for 24 h at 200 rpm. Both ser. Typhimurium-291RH and E. coli O157:H7 were grown by inoculating a single colony in 3 mL of BHI and Luria Broth (LB) media, respectively. Both cultures were incubated overnight for 18 h at 37 °C at 200 rpm. One mL of the mid-log phase bacterial culture was centrifuged at 5000 rpm for 8 min. For detection experiments in buffer, the supernatant was removed and washed twice with 1× PBS buffer to remove any media residue, and the pellet was resuspended in 1× PBS buffer. Then, the dilution series was prepared. For detection experiments in 1% diluted chicken broth, all supernatant was removed and 1× PBS buffer was used to wash and remove any media residue, and the pellet was resuspended in 1% diluted chicken broth. The dilution series was also prepared with 1% chicken broth as the media used. Enumeration of bacteria was performed by plate-count techniques and expressed in CFU/mL. A plaque assay was carried out with P100 phage and L. monocytogenes to measure the phage titer and was expressed in PFU/mL. A soft agar overlay technique was carried out to evaluate the specificity of the P100 phage towards the target (L. monocytogenes) and non-target bacteria (ser. Typhimurium-291RH and E. coli O157:H7), with the presence and absence of P100 phage.
2.2.2. Electrode Preparation
Quaternized carbon nanotubes (q-CNT) were prepared according to the protocol presented by Zolti et al. [3]. Screen-printed electrodes (SPE) were rinsed with DIW and dried at room temperature for 2 h prior to modification with q-CNT. Once the electrode dried, 8 µL of the 1 mg/mL q-CNT solution was drop-cast on the SPE working electrode and then dried at room temperature. After that, PBSE as a molecular tethering agent was used as a crosslinker to attach the P100 phage to the q-CNT modified electrode. The modified SPE was rinsed with 1× PBS and placed in an ice container and 0.5 µL of 20 mM PBSE solution (in DMSO) was dropped onto it and allowed to self-assemble for 15 min. Excess PBSE was removed by rinsing twice with 1× PBS prior to phage attachment. One µL of the 109 PFU/mL P100 phage solution was drop-cast on the working electrode and kept overnight at 4 °C. The P100 phage contains negatively charged capsids and positively charged tail fibers. The strong positive charge on the q-CNT created an oriented phage layer chemically anchored to the surface, as presented by Zolti et al. [3]. After immobilization, the electrode was rinsed with SM buffer and washed with 1× PBS buffer twice. Following the wash, 0.5 µL of 0.1% BSA solution was deposited on the electrode for 30 min to block areas that might not have been completely modified. Finally, the electrode was incubated in 1× PBS or with 1% diluted chicken broth for 15 min before use in electrochemical experiments.
The bacterial solution (100 µL) was drop-cast onto the SPE and incubated for 8 min before the measurement. The impedimetric characterization was carried out using a CHI-920C scanning electrochemical microscope. The electrochemical system was a 3-electrode SPE, as shown in Figure 1a. Electrochemical impedance spectroscopy (EIS) measurements were performed in 5 mM [Fe(CN)6]4−/[Fe(CN)6]3− as redox couple, with a frequency range of 1 Hz to 100 kHz and an AC amplitude of 5 mV. All measurements were performed at room temperature under standard conditions. The modified SPEs were tested in 1× PBS buffer and 1% diluted chicken broth matrices. The negative control contained no bacteria, and the test samples contained different concentrations of L. monocytogenes. The SPE was rinsed with 1× PBS after incubation with the tested solution. A 100 µL quantity of 5 mM [Fe(CN)6]4−/[Fe(CN)6]3− solution was dropped on the SPE to cover the working, counter, and reference electrodes prior to impedimetric measurements. The negative control measurement was used as the baseline RCT for each set of measurements presented in this section. Detection experiments under constant flow were performed using a syringe pump connected to a microfluidic flow chamber, as shown in Figure 1b. The chicken broth was diluted a hundred-fold to 1% in 1× PBS to produce a more homogenized sample. Due to the dilution, the heterogenous nature of the chicken broth is negated, while the relevant target bacteria concentration is not reduced below the limit of detection. The dilution was performed according to practices common in the field [20,21].
3. Results and Discussion
3.1. Detection of L. monocytogenes in Buffer and Broth
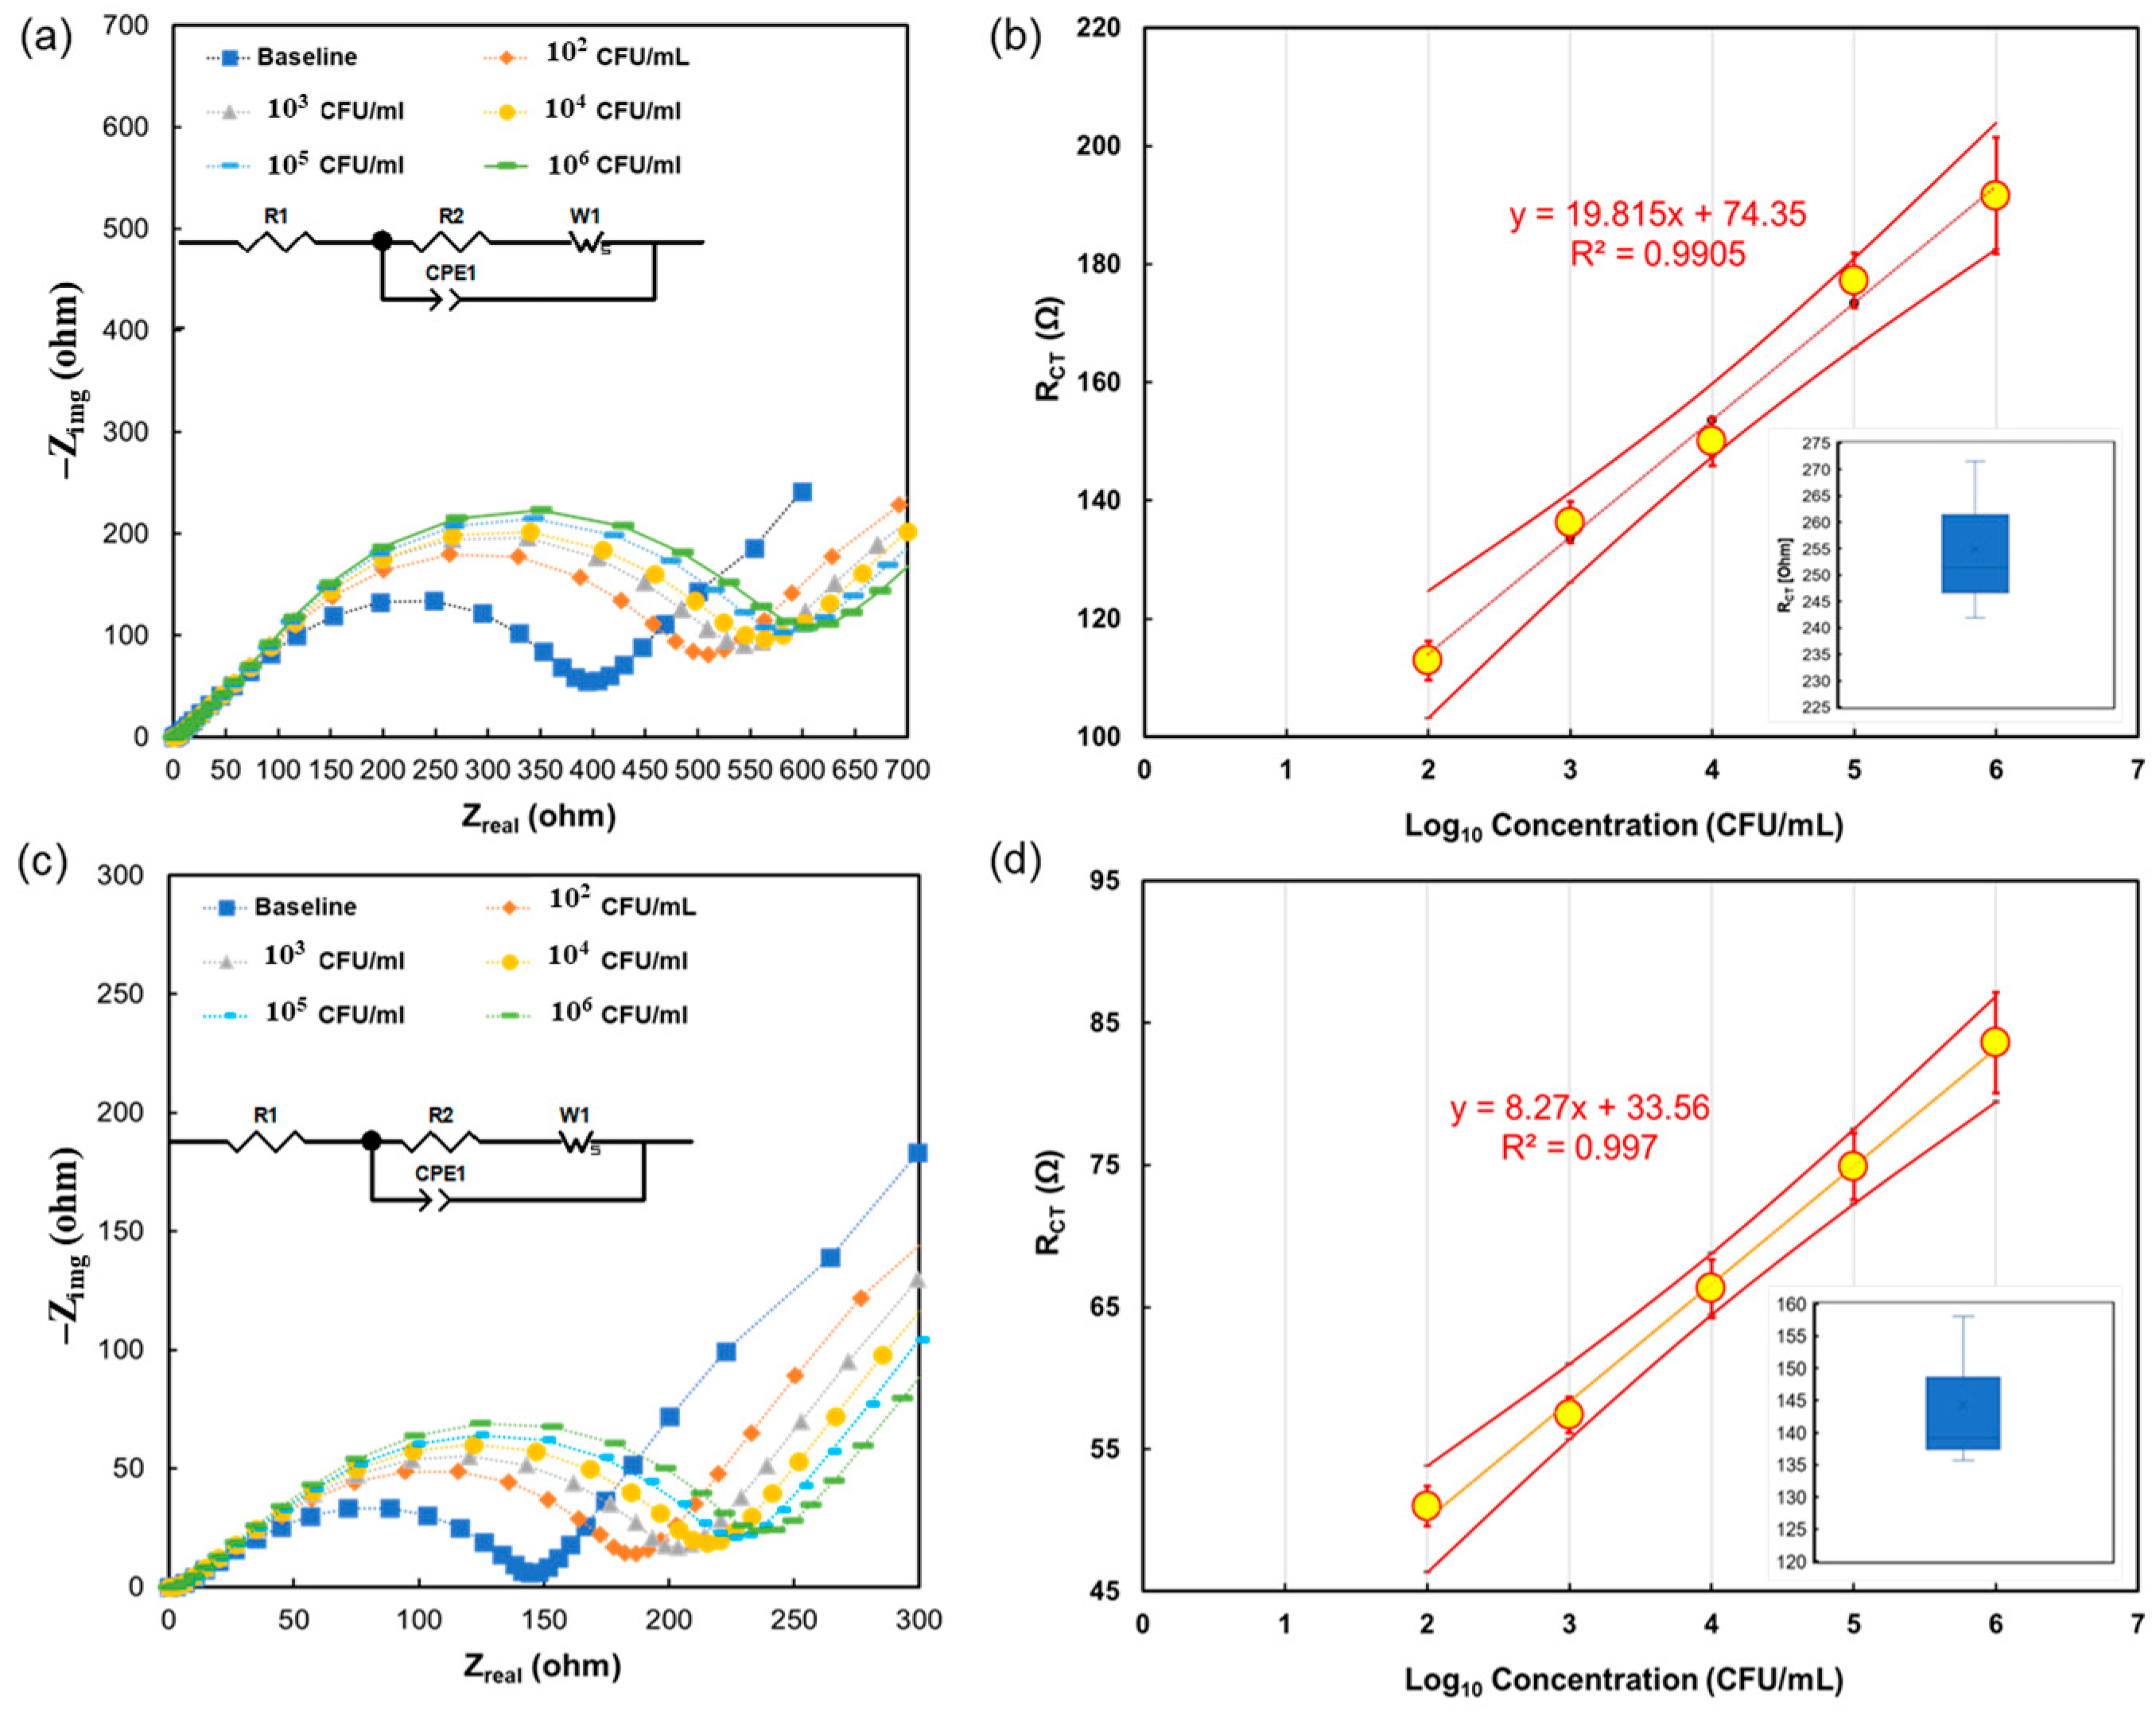
Initial impedimetric measurements were performed with the L. monocytogenes suspended in 1× PBS buffer at a concentration range of 102 CFU/mL to 106 CFU/mL. Measurements in triplicate were performed to determine the errors. Figure 2a presents a Nyquist plot with data collected from the 1× PBS buffer experiments. The calibration data with a baseline boxplot within the inset are shown in Figure 2b, along with the linear confidence limits, with a confidence level of 95%, showing that all points fall within the linear regime. It is visible that at higher concentrations, a larger error is calculated in the buffer.
The reason for this error determination is that one of the biosensors has reached saturation at lower analyte concentrations than the other two. In addition, the rate of signal change from the concentration of 104 CFU/mL has slowed at different rates. Following the buffer experiments, detection experiments were performed in which the negative control and the bacterial solutions were suspended in chicken broth. The diluted broth was used to reduce the effects of inconsistencies in broth composition. The results of these experiments are shown in Figure 2c,d. The data suggest that exposure to the broth causes a significant reduction in the overall values of the RCT, even after baseline adjustment, with respect to the corresponding measurements in the buffer. Additionally, the chicken broth measurements showed lower calculated error for all measurements. The lowest concentration measured was 102 CFU/mL. In addition, two methods were used to calculate the limit of detection (LOD). The first involved use of a linear regression method, and resulted in 55 CFU/mL in buffer and 10 CFU/mL in broth. The second method was 6σ. Here, the LOD is defined as anything higher than three standard deviations from the baseline, with a confidence level of α = 0.01. The values of three standard deviations from the baseline were 38.8 Ω in broth and 126.2 Ω in buffer. When using these numbers to calculate the limit of detection from the linear equation on the calibration curve, the value corresponds to 10 CFU/mL in broth and 300 CFU/mL in buffer [22]. A possible explanation for the improvement with broth samples is that the different salts and components reduce the charge transfer resistance of the system, in turn lowering readings and making them easier to detect above the noise level. Also, since the broth was diluted to 1%, the LOD in undiluted broth samples would be 103 CFU/mL for both methods, which meets the requirements of most Western countries and is on par with other biosensors [6]. In addition, the recovery rate is a parameter that compares the concentration calculated from the calibration curves to the actual concentration placed on the biosensor, as shown in Table 1, and this further proves the predictability and accuracy of the biosensor [23].
The sensor’s recovery rate in broth has increased with the concentration, and in some concentrations, it has been better than when in a simple matrix, here, 1× PBS buffer. This suggests that the biosensor can detect L. monocytogenes and produce a reliable measurement of its concentration in the broth sample, with an accuracy of 88% to 96%. The recovery rate is calculated using Equations (1) and (2).
Following these tests, the biosensor’s stability over time was tested. SPEs were prepared simultaneously and submerged in 1× PBS at 4 °C until tested after 1 h, 1 day, 1 week, and 2 weeks. For each mentioned time, triplicate impedimetric measurements were obtained with 102 CFU/mL L. monocytogenes in broth. The variation in impedance signal from the initial value was calculated as the percentage change from the results obtained after 1 h, as shown in Figure 3. Since all of the electrodes had been prepared simultaneously under the same conditions, the results after 1 h were used as the reference initial value (100%), and all other results were compared with this reference value. By doing so, it is possible to compare the changes in the signal over time. The stability measurements showed that the response was reduced by 10% after a day but maintained stability. After a week, an overall 30% reduction was observed, and the error became larger, and after 2 weeks, the signal was only 40% of its original value. It can be reasonably concluded that the biosensor exhibits stable performance for over a week after phage immobilization when used to detect L. monocytogenes concentration around 102 CFU/mL.
3.2. Role of Phage as Biorecognition Molecule
After testing the biosensor using varying concentrations of L. monocytogenes in broth, the effectiveness of the P100 bacteriophage as a biorecognition molecule was tested to ensure that the impedimetric signal for L. monocytogenes detection can be attributed to the presence of the biorecognition molecule. Two sets of SPE were used, one unmodified and the other immobilized with P100 bacteriophage, for the same duration. Figure 4 shows the impedimetric response of the biosensor with and without the P100 bacteriophage. The response showed that when modified with the phage, there was a significantly higher impedance signal, which also increased with the analyte concentration, while the SPE without the phage showed an almost constant response with little effect shown from the varying analyte concentrations. The results indicate that the impedance signal can be attributed to the selective binding of L. monocytogenes to P100 bacteriophage on the SPE.
3.3. Specificity of the Biosensor
The specificity of the phage-modified biosensor was tested by exposing the SPE with and without P100 bacteriophage to non-target pathogens E. coli O157:H7 and ser. Typhimurium-291RH. These bacteria were chosen since both are rod-shaped and commonly found in chicken products, alongside L. monocytogenes [32,33,34]. The first set of experiments tested 102 CFU/mL of single pathogen in broth. The second set of experiments contained a sample containing E. coli O157:H7 and ser. Typhimurium-291RH in concentrations of 103 CFU/mL each. In addition, L. monocytogenes was added at two different concentrations, 102 and 103 CFU/mL. The impedimetric response to a single pseudo-analyte was 10–20 ohms above the response from the negative broth control, while the response to L. monocytogenes was 75 ohms above it, as seen in Figure 5a; the response to pseudo-analytes is 13–26% of the response to L. monocytogenes. This suggests that the biosensor is very specific, and a positive response will only originate from bacteriophage-L. monocytogenes interaction. The biosensor without the phage biorecognition molecule showed an 8–10-ohm response from all test solutions and the control, demonstrating the effectiveness of the phage. In the interference study, shown in Figure 5b, the biosensor’s responses to broth samples with both pseudo-analytes, and with and without L. monocytogenes, are presented. A clear signal was measured when L. monocytogenes was present, even when at lower concentration than the pseudo-analytes. In these measurements, when the biosensor had no phage, the response was almost constant, without any dependency on the concentration of L. monocytogenes, which further emphasizes the specificity of the P100 bacteriophage, even in a multi-contaminate environment.
3.4. Detection under Flow
The final step was to conduct L. monocytogenes measurements in broth at different flow rates. The capability to detect L. monocytogenes in flow conditions is an important proof-of-concept on the path to portable electrochemical biosensors and the ability to integrate such a sensor into a production line. Initially, a 0.01% Tween® 20 solution was flowed through the system. Then, an SPE was inserted into the flow cell, and the broth or bacterial sample was flowed on the biosensor’s surface for 8 min at a flow rate of 0.1 mL/min. After that, 5 mM [Fe(CN)6]4−/[Fe(CN)6]3− solution was flowed on the SPE surface at a rate of either 0.5 mL/min, 1 mL/min, or 2 mL/min. By multiplexing 10 biosensors of this size in parallel, it will be possible to process a liter of broth per hour. While the redox-couple solution was flowing, impedimetric measurements were taken. A Nyquist plot with the results of the 0.5 mL/min flow rate is shown in Figure 6a, and the responses from all flow rates are presented in the bar chart in Figure 6b. The results show that without the phage, the response is an increase of 1–5 ohm, and the flow rate did not move these values outside of that range. With phage-modified SPE, the response shows a 10% decrease in signal every time the flow rate doubles. Even though there was a decreased signal, the signals all changed with the concentration of L. monocytogenes. These results demonstrate that the whole detection process can be accomplished under flow after the SPE is prepared and modified. These results show the capability of the system to work as a portable system.
4. Conclusions
In this study, a highly sensitive electrochemical biosensor tailored for L. monocytogenes detection was developed and evaluated. The biosensor exhibited exceptional efficacy, demonstrating a remarkable LOD of 10 CFU/mL, surpassing the capabilities of most existing devices and displaying a sensitivity two orders of magnitude superior to PCR. Successful detection assays were conducted in chicken broth containing multiple pathogens under continuous flow conditions. The selectivity of the P100 bacteriophage was effectively demonstrated through exposure to a singular pathogen and interference studies. Moreover, the integration of SPEs and microfluidic channels showcased the portability of the system. With a demonstrated stability of up to one week, the biosensor proves suitable for various food-pathogen testing applications. Furthermore, validation using chicken broth as a representative food matrix underscored the robust performance of the biosensor platform.
Author Contributions
Conceptualization, O.Z.; methodology, O.Z., B.S. and R.M.; validation, O.Z., B.S., S.N.N. and R.M.; formal analysis, O.Z.; investigation, O.Z.; resources, R.P.R. and J.L.; data curation, O.Z.; writing—original draft preparation, O.Z.; writing—review and editing, O.Z., B.S. and R.P.R.; visualization, O.Z.; supervision, R.P.R. All authors have read and agreed to the published version of the manuscript.
Funding
The funding for the presented work was given by the UGA Center for Food Safety. Funding number: 2022-2241364VAR.
Institutional Review Board Statement
Not applicable.
Informed Consent Statement
Not applicable.
Data Availability Statement
Data are contained within the article.
Acknowledgments
Christine Szymanski, Francisco Diez-Gonzales, and Nikki Shariat have graciously provided this work with E. coli O157:H7, L. monocytogenes, and ser. Typhimurium-291RH respectively.
Conflicts of Interest
The authors declare no conflicts of interest.
References
- Townsend, A.; Strawn, L.K.; Chapman, B.J.; Dunn, L.L. A Systematic Review of Listeria Species and Listeria monocytogenes Prevalence, Persistence, and Diversity throughout the Fresh Produce Supply Chain. Foods 2021, 10, 1427. [Google Scholar] [CrossRef] [PubMed]
- Matereke, L.T.; Okoh, A.I. Listeria monocytogenes Virulence, Antimicrobial Resistance and Environmental Persistence: A Review. Pathogens 2020, 9, 528. [Google Scholar] [CrossRef] [PubMed]
- Zolti, O.; Suganthan, B.; Maynard, R.; Asadi, H.; Locklin, J.; Ramasamy, R.P. Electrochemical Biosensor for Rapid Detection of Listeria monocytogenes. J. Electrochem. Soc. 2022, 169, 067510. [Google Scholar] [CrossRef]
- Georgia Department of Public Health. Listeria Fact Sheet. Available online: https://dph.georgia.gov/epidemiology/acute-disease-epidemiology/foodborne-and-waterborne-diseases/listeria (accessed on 7 April 2024).
- Gray, M.L.; Killinger, A.H. Listeria monocytogenes and listeric infections. Bacteriol. Rev. 1966, 30, 309–382. [Google Scholar] [CrossRef] [PubMed]
- Zolti, O.; Suganthan, B.; Ramasamy, R.P. Lab-on-a-Chip Electrochemical Biosensors for Foodborne Pathogen Detection: A Review of Common Standards and Recent Progress. Biosensors 2023, 13, 215. [Google Scholar] [CrossRef] [PubMed]
- Mazaheri, T.; Ripolles-Avila, C.; Rodríguez-Jerez, J.J. Cross-contamination of mature Listeria monocytogenes biofilms from stainless steel surfaces to chicken broth before and after the application of chlorinated alkaline and enzymatic detergents. Food Microbiol. 2023, 112, 104236. [Google Scholar] [CrossRef] [PubMed]
- McSharry, S.; Koolman, L.; Whyte, P.; Bolton, D. Inactivation of Listeria monocytogenes and Salmonella typhimurium in beef broth and on diced beef using an ultraviolet light emitting diode (UV-LED) system. LWT 2022, 158, 113150. [Google Scholar] [CrossRef]
- Lee, D.-U.; Park, Y.J.; Yu, H.H.; Jung, S.-C.; Park, J.-H.; Lee, D.-H.; Lee, N.-K.; Paik, H.-D. Antimicrobial and Antibiofilm Effect of ε-Polylysine against Salmonella enteritidis, Listeria monocytogenes, and Escherichia coli in Tryptic Soy Broth and Chicken Juice. Foods 2021, 10, 2211. [Google Scholar] [CrossRef] [PubMed]
- Shelef, L.A.; Yang, Q. Growth Suppression of Listeria monocytogenes by Lactates in Broth, Chicken, and Beef. J. Food Prot. 1991, 54, 283–287. [Google Scholar] [CrossRef]
- CDC. Listeria Outbreaks—Listeriosis. Available online: https://www.cdc.gov/listeria/outbreaks/ (accessed on 3 February 2023).
- Vizzini, P.; Braidot, M.; Vidic, J.; Manzano, M. Electrochemical and Optical Biosensors for the Detection of Campylobacter and Listeria: An Update Look. Micromachines 2019, 10, 500. [Google Scholar] [CrossRef]
- Yakovleva, M.; Bhand, S.; Danielsson, B. The enzyme thermistor—A realistic biosensor concept. A critical review. Anal. Chim. Acta 2013, 766, 1–12. [Google Scholar] [CrossRef] [PubMed]
- Liu, A.; Shen, L.; Zeng, Z.; Sun, M.; Liu, Y.; Liu, S.; Li, C.; Wang, X. A Minireview of the Methods for Listeria monocytogenes Detection. Food Anal. Methods 2018, 11, 215–223. [Google Scholar] [CrossRef]
- Gattani, A.; Singh, S.V.; Agrawal, A.; Khan, M.H.; Singh, P. Recent progress in electrochemical biosensors as point of care diagnostics in livestock health. Anal. Biochem. 2019, 579, 25–34. [Google Scholar] [CrossRef] [PubMed]
- Ghuman, A. Bacteriophage-Assisted Microfluidic Separation of Pathogens from Food Matrices. Master’s Thesis, University of Georgia, Athens, GA, USA, 2018. [Google Scholar]
- Zhou, Y.; Ramasamy, R.P. Isolation and separation of Listeria monocytogenes using bacteriophage P100-modified magnetic particles. Colloids Surf. B Biointerfaces 2019, 175, 421–427. [Google Scholar] [CrossRef]
- Zhou, Y.; Marar, A.; Kner, P.; Ramasamy, R.P. Charge-Directed Immobilization of Bacteriophage on Nanostructured Electrode for Whole-Cell Electrochemical Biosensors. Anal. Chem. 2017, 89, 5734–5741. [Google Scholar] [CrossRef] [PubMed]
- Patel, D.; Zhou, Y.; Ramasamy, R.P. A Bacteriophage-Based Electrochemical Biosensor for Detection of Methicillin-Resistant Staphylococcus aureus. J. Electrochem. Soc. 2021, 168, 57523. [Google Scholar] [CrossRef]
- Silva, N.F.D.; Neves, M.M.P.S.; Magalhães, J.M.C.S.; Freire, C.; Delerue-Matos, C. Emerging electrochemical biosensing approaches for detection of Listeria monocytogenes in food samples: An overview. Trends Food Sci. Technol. 2020, 99, 621–633. [Google Scholar] [CrossRef]
- Huang, X.; Xu, Z.; Mao, Y.; Ji, Y.; Xu, H.; Xiong, Y.; Li, Y. Gold nanoparticle-based dynamic light scattering immunoassay for ultrasensitive detection of Listeria monocytogenes in lettuces. Biosens. Bioelectron. 2015, 66, 184–190. [Google Scholar] [CrossRef] [PubMed]
- Niu, X.; Zheng, W.; Yin, C.; Weng, W.; Li, G.; Sun, W.; Men, Y. Electrochemical DNA biosensor based on gold nanoparticles and partially reduced graphene oxide modified electrode for the detection of Listeria monocytogenes hly gene sequence. J. Electroanal. Chem. 2017, 806, 116–122. [Google Scholar] [CrossRef]
- Sun, W.; Qi, X.; Zhang, Y.; Yang, H.; Gao, H.; Chen, Y.; Sun, Z. Electrochemical DNA biosensor for the detection of Listeria monocytogenes with dendritic nanogold and electrochemical reduced graphene modified carbon ionic liquid electrode. Electrochim. Acta 2012, 85, 145–151. [Google Scholar] [CrossRef]
- Kashish; Soni, D.K.; Mishra, S.K.; Prakash, R.; Dubey, S.K. Label-free impedimetric detection of Listeria monocytogenes based on poly-5-carboxy indole modified ssDNA probe. J. Biotechnol. 2015, 200, 70–76. [Google Scholar] [CrossRef] [PubMed]
- Zhao, X.; Wu, C. Recent Advances in Peptide Nucleic Acids for Rapid Detection of Foodborne Pathogens. Food Anal. Methods 2020, 13, 1956–1972. [Google Scholar] [CrossRef]
- Chen, Y.; Qian, C.; Liu, C.; Shen, H.; Wang, Z.; Ping, J.; Wu, J.; Chen, H. Nucleic acid amplification free biosensors for pathogen detection. Biosens. Bioelectron. 2020, 153, 112049. [Google Scholar] [CrossRef]
- Carvajal Barbosa, L.; Insuasty Cepeda, D.; León Torres, A.F.; Arias Cortes, M.M.; Rivera Monroy, Z.J.; Garcia Castaneda, J.E. Nucleic acid-based biosensors: Analytical devices for prevention, diagnosis and treatment of diseases. Vitae 2021, 28, 3. [Google Scholar] [CrossRef]
- Juneja, V.K.; Eblen, B.S.; Ransom, G.M. Thermal Inactivation of Salmonella spp. in Chicken Broth, Beef, Pork, Turkey, and Chicken: Determination of D- and Z-values. J. Food Sci. 2001, 66, 146–152. [Google Scholar] [CrossRef]
- Liu, J.; Jasim, I.; Abdullah, A.; Shen, Z.; Zhao, L.; El-Dweik, M.; Zhang, S.; Almasri, M. An integrated impedance biosensor platform for detection of pathogens in poultry products. Sci. Rep. 2018, 8, 16109. [Google Scholar] [CrossRef] [PubMed]
- Shrivastava, A.; Gupta, V. Methods for the determination of limit of detection and limit of quantitation of the analytical methods. Chron. Young Sci. 2011, 2, 21–25. [Google Scholar] [CrossRef]
- Mohammad-Razdari, A.; Ghasemi-Varnamkhasti, M.; Izadi, Z.; Rostami, S.; Ensafi, A.A.; Siadat, M.; Losson, E. Detection of sulfadimethoxine in meat samples using a novel electrochemical biosensor as a rapid analysis method. J. Food Compos. Anal. 2019, 82, 103252. [Google Scholar] [CrossRef]
- Birgen, B.J.; Njue, L.G.; Kaindi, D.M.; Ogutu, F.O.; Owade, J.O. Determinants of Microbial Contamination of Street-Vended Chicken Products Sold in Nairobi County, Kenya. Int. J. Food Sci. 2020, 2020, 1–8. [Google Scholar] [CrossRef]
- Wardhana, D.K.; Haskito, A.E.P.; Purnama, M.T.E.; Safitri, D.A.; Annisa, S. Detection of microbial contamination in chicken meat from local markets in Surabaya, East Java, Indonesia. Vet. World 2021, 14, 3138–3143. [Google Scholar] [CrossRef]
- Rouger, A.; Tresse, O.; Zagorec, M. Bacterial Contaminants of Poultry Meat: Sources, Species, and Dynamics. Microorganisms 2017, 5, 50. [Google Scholar] [CrossRef] [PubMed]
Figure 1.
(a) SPE electrochemical biosensor; (b) Flow-based detection apparatus.

Figure 2.
(a) Impedimetric response in 1× PBS to L. monocytogenes, with the equivalent circuit in the inset; (b) Reliable-range-of-calibration curve in 1× PBS buffer, along with linearity confidence interval limits, with a confidence level of 95%; the inset shows a box plot of the negative control (0 CFU/mL) measurements; (c) Impedimetric response in chicken broth to L. monocytogenes, with the equivalent circuit in the inset; and (d) Reliable-range-of-calibration curve in 1% chicken broth, along with linearity confidence interval limits, with confidence level of 95%; the inset shows a box plot of the negative control measurements.

Figure 3.
Biosensor stability over time, measured for broth.

Figure 4.
RCT values from measurements of SPE modified with and without P100 bacteriophage, at different L. monocytogenes concentrations in a chicken broth sample.
Figure 4.
RCT values from measurements of SPE modified with and without P100 bacteriophage, at different L. monocytogenes concentrations in a chicken broth sample.

Figure 5.
Specificity studies in 1% chicken broth: (a) biosensor responses to L. monocytogenes and non-target pathogens with and without P100 phage; and (b) interference study in which non-target pathogens were kept at 103 CFU/mL and L. monocytogenes changes from 0 (negative control) to 103 CFU/mL (EC = E. coli O157:H7 and Sal = ser. Typhimurium-291RH).

Figure 6.
Biosensor’s response to L. monocytogenes at different concentrations under flow: (a) Nyquist plot of the response with a flow rate of 0.5 mL/minute; and (b) bar chart of the responses with different flow rates and different L. monocytogenes concentrations.
Figure 6.
Biosensor’s response to L. monocytogenes at different concentrations under flow: (a) Nyquist plot of the response with a flow rate of 0.5 mL/minute; and (b) bar chart of the responses with different flow rates and different L. monocytogenes concentrations.


Table 1.
Recovery rates in chicken broth and buffer.
| Actual Concentration Log10 (CFU/mL) | Buffer | Chicken Broth | ||
|---|---|---|---|---|
| Calculated Concentration Log10 (CFU/mL) | Recovery Rate | Calculated Concentration Log10 (CFU/mL) | Recovery Rate | |
| 2 | 1.97 | 98% | 1.75 | 88% |
| 3 | 2.87 | 96% | 2.77 | 92% |
| 4 | 3.39 | 85% | 3.78 | 95% |
| 5 | 4.44 | 89% | 4.80 | 96% |
| 6 | 4.99 | 83% | 5.75 | 96% |
Disclaimer/Publisher’s Note: The statements, opinions and data contained in all publications are solely those of the individual author(s) and contributor(s) and not of MDPI and/or the editor(s). MDPI and/or the editor(s) disclaim responsibility for any injury to people or property resulting from any ideas, methods, instructions or products referred to in the content. |
© 2024 by the authors. Licensee MDPI, Basel, Switzerland. This article is an open access article distributed under the terms and conditions of the Creative Commons Attribution (CC BY) license (https://creativecommons.org/licenses/by/4.0/).
Share and Cite
MDPI and ACS Style
Zolti, O.; Suganthan, B.; Nagdeve, S.N.; Maynard, R.; Locklin, J.; Ramasamy, R.P. Investigation of the Efficacy of a Listeria monocytogenes Biosensor Using Chicken Broth Samples. Sensors 2024, 24, 2617. https://doi.org/10.3390/s24082617
AMA Style
Zolti O, Suganthan B, Nagdeve SN, Maynard R, Locklin J, Ramasamy RP. Investigation of the Efficacy of a Listeria monocytogenes Biosensor Using Chicken Broth Samples. Sensors. 2024; 24(8):2617. https://doi.org/10.3390/s24082617
Chicago/Turabian StyleZolti, Or, Baviththira Suganthan, Sanket Naresh Nagdeve, Ryan Maynard, Jason Locklin, and Ramaraja P. Ramasamy. 2024. "Investigation of the Efficacy of a Listeria monocytogenes Biosensor Using Chicken Broth Samples" Sensors 24, no. 8: 2617. https://doi.org/10.3390/s24082617
Note that from the first issue of 2016, this journal uses article numbers instead of page numbers. See further details here.