Association of Visual-Based Signals with Electroencephalography Patterns in Enhancing the Drowsiness Detection in Drivers with Obstructive Sleep Apnea

 , , , , and
Abstract
:1. Introduction
1.1. Related Works
1.2. Limitations in Previous Studies and a Proposed Solution
- 1.
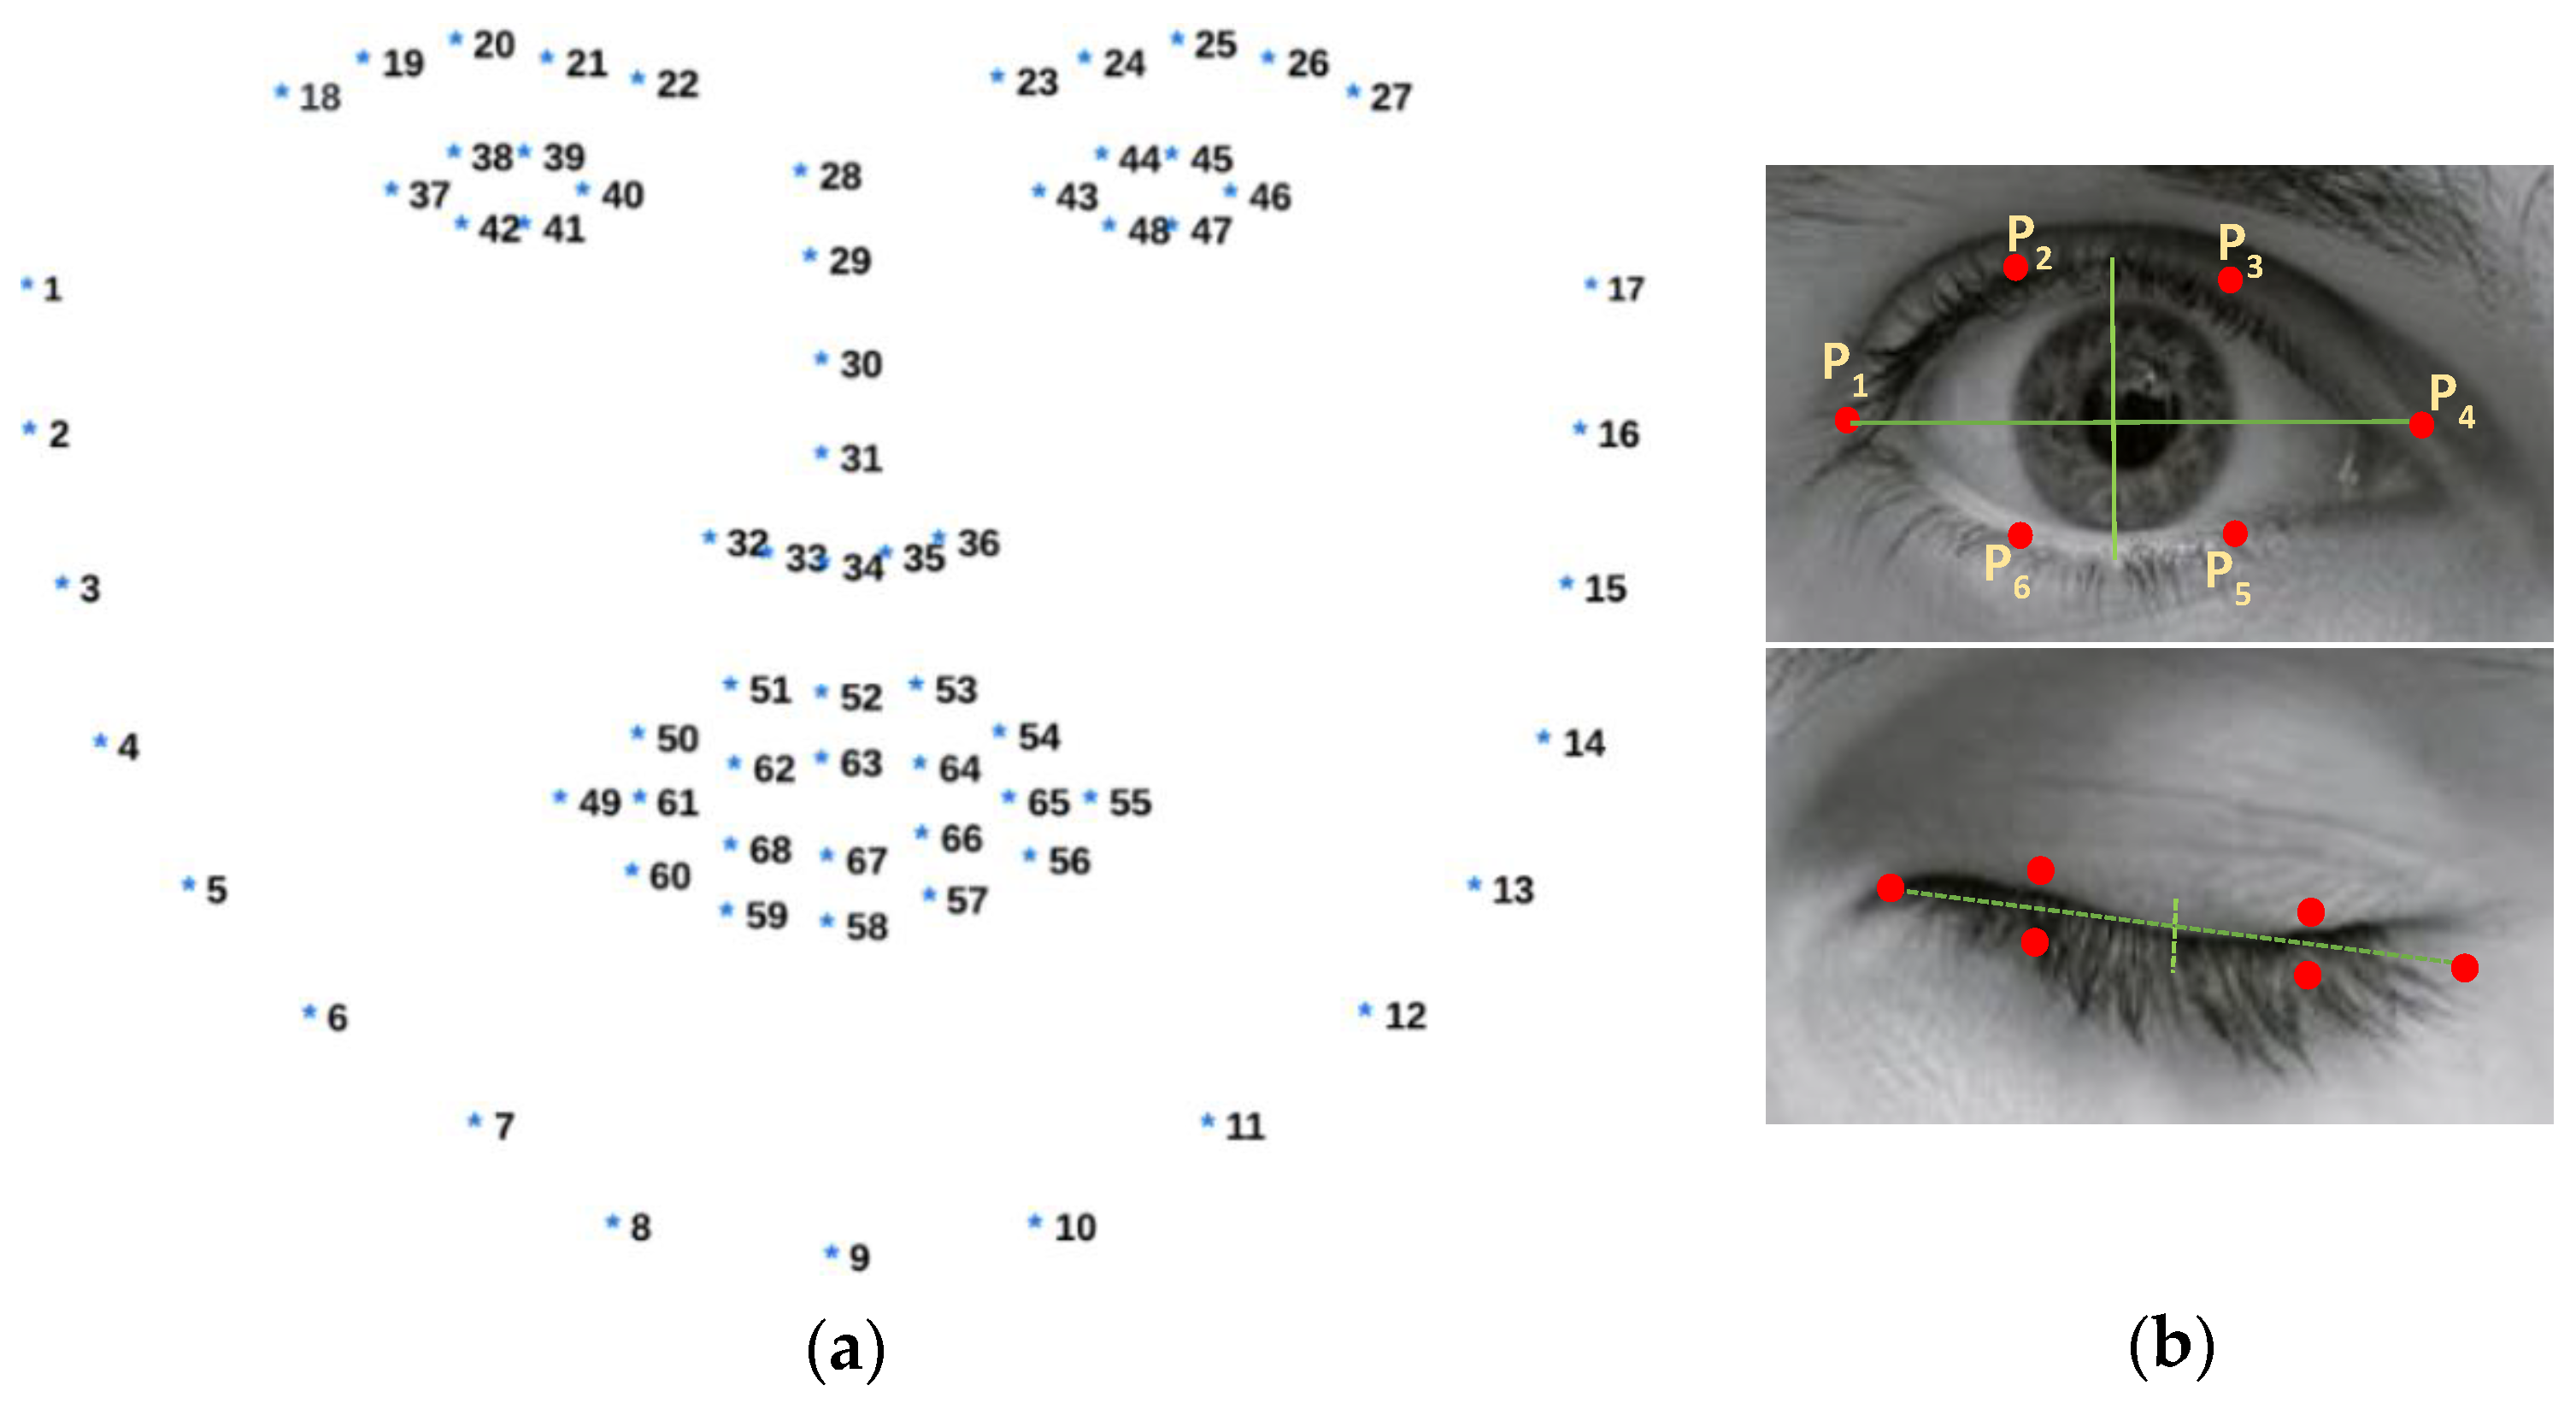
- Introducing a visual-based scoring method to detect episodes of drowsiness and wakefulness using adaptive thresholding—instead of fixed thresholding—for eye aspect ratio computation. This method leverages OpenCV for face detection and Dlib for eye region extraction (Section 2.4 and Section 3.1).
- 2.
- Proposing an integrated approach that correlates visual-based scoring with EEG patterns using ten distinct features to enhance the reliability of drowsiness detection (Section 2.5 and Section 3.1).
- 3.
- Computing the sensitivity of various EEG channels and brain regions to determine the optimal electrode count for this correlation, leading to minimizing hardware requirements, enhancing wearable applications, and prioritizing user comfort. (Section 2.6 and Section 3.2).
2. Materials and Methods
2.1. Experimental Setup
2.2. Study Population and Subject Demographics
2.3. Experimental Design
2.4. Data Acquisition
2.4.1. Video-Based Data Acquisition and Visual-Based Scoring
2.4.2. Physiological Signal-Based Data Acquisition
2.5. Concurrent Analysis for Validating Visual-Based Scoring with EEG Patterns
2.5.1. Filtering the Data
2.5.2. Loading and Processing CSV File
2.5.3. Splitting EEG Data According to Visual-Based Scoring Timestamps and Computing PSD Using DWT
- SE quantifies the level of complexity or randomness present in the power spectrum of an EEG signal. A high SE value indicates a signal with high complexity and unpredictability, often associated with a wakeful state. In contrast, a low SE value suggests a more predictable and periodic signal, commonly observed during drowsiness or sleep states [61,62].SE is calculated by first normalizing the spectral energy across all frequency bands. This normalization involves dividing the energy in each frequency band by the total energy across all bands. Following the normalization, SE is determined by summing the product of the normalized energy in each band and the logarithm (typically base 2) of that normalized energy. This summation is performed across all frequency bands involved in the analysis [63].
- SS quantifies the variability in the distribution of spectral energy within an EEG signal. It assesses the breadth of the power spectrum and reveals how energy is distributed around the spectral centroid, providing insight into the ‘sharpness’ or ‘flatness’ of the spectrum. We suggested that higher SS values are associated with drowsiness episodes, while lower values are indicative of wakefulness episodes.SS is computed as the square root of the weighted variance of the squared differences between each frequency and the spectral centroid. It represents the standard deviation of the frequency components around the spectral centroid. This computation requires the value of , the spectral centroid, to be determined first [63].
- SC represents the ‘center of mass’ of the power spectrum of an EEG signal. It corresponds to the average frequency of the power spectrum, weighted by the amplitude of each frequency component. We hypothesized that elevated SC values are associated with wakefulness episodes, whereas lower values tend to indicate drowsiness.The value of the spectral centroid, , for the ith frame is computed by taking the sum of each frequency multiplied by its corresponding amplitude divided by the sum of all amplitudes where represents the frequency index, is the amplitude at frequency , and is the windowed frame length over which the computation is performed [63].
- SRO is the frequency below which a defined percentage (typically 85% to 95%) of the total spectral energy is contained. It is a measure used to describe the skewness of the power spectrum. We proposed that higher SRO values are linked with wakefulness, whereas lower values suggest drowsiness.SRO for the ith frame is calculated by identifying the frequency bin, m, such that the cumulative sum of amplitudes up to frequency bin m is equal to a percentage of the total sum of amplitudes, where is the rolloff percentage (e.g., 0.9 for 90%) [63].
2.6. Sensitivity of EEG Channels and Brain Regions in Correlating Visual-Based Scoring with EEG Patterns
3. Results
3.1. Significant Correlation between Visual-Based Scoring and EEG Patterns across All Channels
3.2. Enhanced Sensitivity of F4 and O2 Channels and Frontal and Occipital Brain Regions in Correlating Visual-Based Scoring with EEG Patterns
4. Discussion
Limitations of the Study and Future Perspective
5. Conclusions
Author Contributions
Funding
Institutional Review Board Statement
Informed Consent Statement
Data Availability Statement
Acknowledgments
Conflicts of Interest
References
- Balk, E.M.; Moorthy, D.; Obadan, N.O.; Patel, K.; Ip, S.; Chung, M.; Bannuru, R.R.; Kitsios, G.D.; Sen, S.; Iovin, R.C.; et al. Diagnosis and Treatment of Obstructive Sleep Apnea in Adults; Report No.: 11-EHC052; Agency for Healthcare Research and Quality (US): Rockville, MD, USA, 2011. [Google Scholar]
- Lal, C.; Weaver, T.E.; Bae, C.J.; Strohl, K.P. Excessive Daytime Sleepiness in Obstructive Sleep Apnea: Mechanisms and Clinical Management. Ann. Am. Thorac. Soc. 2021, 18, 757–768. [Google Scholar] [CrossRef] [PubMed]
- Macey, P.M.; Woo, M.A.; Kumar, R.; Cross, R.L.; Harper, R.M. Relationship between obstructive sleep apnea severity and sleep, depression, and anxiety symptoms in newly diagnosed patients. PLoS ONE 2010, 5, e10211. [Google Scholar] [CrossRef] [PubMed]
- Young, T.; Palta, M.; Dempsey, J.; Skatrud, J.; Weber, S.; Badr, S. The occurrence of sleep-disordered breathing among middle-aged adults. N. Engl. J. Med. 1993, 328, 1230–1235. [Google Scholar] [CrossRef] [PubMed]
- Bonsignore, M.R.; Lombardi, C.; Lombardo, S.; Fanfulla, F. Epidemiology, Physiology and Clinical Approach to Sleepiness at the Wheel in OSA Patients: A Narrative Review. J. Clin. Med. 2022, 11, 3691. [Google Scholar] [CrossRef] [PubMed]
- Howard, M.E.; Desai, A.V.; Grunstein, R.R.; Hukins, C.; Armstrong, J.G.; Joffe, D.; Swann, P.; Campbell, D.A.; Pierce, R.J. Sleepiness, Sleep-Disordered Breathing, and Accident Risk Factors in Commercial Vehicle Drivers. Am. J. Respir. Crit. Care Med. 2004, 170, 1014–1021. [Google Scholar] [CrossRef] [PubMed]
- Tregear, S.; Reston, J.; Schoelles, K.; Phillips, B. Obstructive Sleep Apnea and Risk of Motor Vehicle Crash: Systematic Review and Meta-Analysis. J. Clin. Sleep Med. 2009, 5, 573–581. [Google Scholar] [CrossRef]
- NSC: National Safety Council. Drivers Are Falling Asleep Behind the Wheel [Website]. Available online: https://www.nsc.org/road/safety-topics/fatigued-driver (accessed on 3 January 2024).
- Skorucak, J.; Hertig-Godeschalk, A.; Achermann, P.; Mathis, J.; Schreier, D.R. Automatically Detected Microsleep Episodes in the Fitness-to-Drive Assessment. Front. Neurosci. 2020, 14, 8. [Google Scholar] [CrossRef] [PubMed]
- Skorucak, J.; Hertig-Godeschalk, A.; Schreier, D.R.; Malafeev, A.; Mathis, J.; Achermann, P. Automatic Detection of Microsleep Episodes with Feature-Based Machine Learning. Sleep 2020, 43, zsz225. [Google Scholar] [CrossRef] [PubMed]
- Pizza, F.; Contardi, S.; Mondini, S.; Trentin, L.; Cirignotta, F. Daytime Sleepiness and Driving Performance in Patients with Obstructive Sleep Apnea: Comparison of the MSLT, the MWT, and a Simulated Driving Task. Sleep 2009, 32, 382–391. [Google Scholar] [CrossRef]
- Moller, H.J.; Kayumov, L.; Bulmash, E.L.; Nhan, J.; Shapiro, C.M. Simulator Performance, Microsleep Episodes, and Subjective Sleepiness: Normative Data Using Convergent Methodologies to Assess Driver Drowsiness. J. Psychosom. Res. 2006, 61, 335–342. [Google Scholar] [CrossRef]
- Boyle, L.N.; Tippin, J.; Paul, A.; Rizzo, M. Driver Performance in the Moments Surrounding a Microsleep. Transp. Res. Part F Traffic Psychol. Behav. 2008, 11, 126–136. [Google Scholar] [CrossRef] [PubMed]
- Risser, M.R.; Ware, J.C. Driving Simulation with EEG Monitoring in Normals and Obstructive Sleep Apnea Patients. Annu. Proc. Assoc. Adv. Automot. Med. 1999, 43, 317–328. [Google Scholar]
- Fujiwara, K.; Abe, E.; Kamata, K.; Nakayama, C.; Suzuki, Y.; Yamakawa, T.; Hiraoka, T.; Kano, M.; Sumi, Y.; Masuda, F.; et al. Heart Rate Variability-Based Driver Drowsiness Detection and Its Validation With EEG. IEEE Trans. Biomed. Eng. 2019, 66, 1769–1778. [Google Scholar] [CrossRef] [PubMed]
- El-Nabi, S.A.; El-Shafai, W.; El-Rabaie, E.-S.M.; Ramadan, K.F.; El-Samie, F.E.A.; Mohsen, S. Machine Learning and Deep Learning Techniques for Driver Fatigue and Drowsiness Detection: A Review. Multimed. Tools Appl. 2024, 83, 9441–9477. [Google Scholar] [CrossRef]
- Nguyen, T.; Ahn, S.; Jang, H.; Jun, S.C.; Kim, J.G. Utilization of a combined EEG/NIRS system to predict driver drowsiness. Sci. Rep. 2017, 7, 43933. [Google Scholar] [CrossRef] [PubMed]
- Horng, W.-B.; Chen, C.-Y.; Chang, Y.; Fan, C.-H. Driver Fatigue Detection Based on Eye Tracking and Dynamic Template Matching. In Proceedings of the IEEE International Conference on Networking, Sensing and Control, Taipei, Taiwan, 21–23 March 2004; pp. 7–12. [Google Scholar] [CrossRef]
- Umut, İ.; Aki, O.; Uçar, E.; Öztürk, L. Detection of Driver Sleepiness and Warning the Driver in Real-Time Using Image Processing and Machine Learning Techniques. Adv. Sci. Technol. Res. J. 2017, 11, 95–102. [Google Scholar] [CrossRef] [PubMed]
- Alioua, N.; Amine, A.; Rziza, M. Driver’s Fatigue Detection Based on Yawning Extraction. Int. J. Veh. Technol. 2014, 2014, 678786. [Google Scholar] [CrossRef]
- Mittal, A.; Kumar, K.; Dhamija, S.; Kaur, M. Head Movement-Based Driver Drowsiness Detection: A Review of State-of-Art Techniques. In Proceedings of the 2016 IEEE International Conference on Engineering and Technology (ICETECH), Coimbatore, India, 17–18 March 2016; pp. 903–908. [Google Scholar] [CrossRef]
- McDonald, A.D.; Lee, J.D.; Schwarz, C.; Brown, T.L. Steering in a Random Forest: Ensemble Learning for Detecting Drowsiness-Related Lane Departures. Hum. Factors 2014, 56, 986–998. [Google Scholar] [CrossRef] [PubMed]
- Arefnezhad, S.; Samiee, S.; Eichberger, A.; Frühwirth, M.; Kaufmann, C.; Klotz, E. Applying deep neural networks for multi-level classification of driver drowsiness using Vehicle-based measures. Expert Syst. Appl. 2020, 162, 113778. [Google Scholar] [CrossRef]
- Hussein, M.K.; Salman, T.M.; Miry, A.H.; Subhi, M.A. Driver Drowsiness Detection Techniques: A Survey. In Proceedings of the 2021 1st Babylon International Conference on Information Technology and Science (BICITS), Babil, Iraq, 28–29 April 2021; pp. 45–51. [Google Scholar] [CrossRef]
- Arefnezhad, S.; Samiee, S.; Eichberger, A.; Nahvi, A. Driver Drowsiness Detection Based on Steering Wheel Data Applying Adaptive Neuro-Fuzzy Feature Selection. Sensors 2019, 19, 943. [Google Scholar] [CrossRef] [PubMed]
- Soares, S.; Ferreira, S.; Couto, A. Driving simulator experiments to study drowsiness: A systematic review. Traffic Inj. Prev. 2020, 21, 29–37. [Google Scholar] [CrossRef] [PubMed]
- Arefnezhad, S.; Hamet, J.; Eichberger, A.; Frühwirth, M.; Ischebeck, A.; Koglbauer, I.V.; Moser, M.; Yousefi, A. Driver drowsiness estimation using EEG signals with a dynamical encoder-decoder modeling framework. Sci. Rep. 2022, 12, 2650. [Google Scholar] [CrossRef] [PubMed]
- Chang, R.C.-H.; Wang, C.-Y.; Chen, W.-T.; Chiu, C.-D. Drowsiness Detection System Based on PERCLOS and Facial Physiological Signal. Sensors 2022, 22, 5380. [Google Scholar] [CrossRef] [PubMed]
- Lang, L.; Qi, H. The Study of Driver Fatigue Monitor Algorithm Combined PERCLOS and AECS. In Proceedings of the 2008 International Conference on Computer Science and Software Engineering, Wuhan, China, 12–14 December 2008; pp. 349–352. [Google Scholar] [CrossRef]
- Xie, J.-F.; Xie, M.; Zhu, W. Driver fatigue detection based on head gesture and PERCLOS. In Proceedings of the 2012 International Conference on Wavelet Active Media Technology and Information Processing (ICWAMTIP), Chengdu, China, 17–19 December 2012; pp. 128–131. [Google Scholar] [CrossRef]
- Liu, W.; Sun, H.; Shen, W. Driver fatigue detection through pupil detection and yawning analysis. In Proceedings of the 2010 International Conference on Bioinformatics and Biomedical Technology, Chengdu, China, 16–18 April 2010; pp. 404–407. [Google Scholar] [CrossRef]
- Cheng, B.; Zhang, W.; Lin, Y.; Feng, R.; Zhang, X. Driver drowsiness detection based on multi-source information. Hum. Factors Ergon. Manuf. Serv. Ind. 2012, 22, 450–467. [Google Scholar] [CrossRef]
- Hanowski, R.J.; Bowman, D.S.; Alden, A.; Wierwille, W.W.; Carroll, R. PERCLOS+: Development of a robust field measure of driver drowsiness. In Proceedings of the 15th World Congress on Intelligent Transport Systems and ITS America’s 2008 Annual Meeting, New York, NY, USA, 16–20 November 2008. [Google Scholar]
- Bajaj, J.S.; Kumar, N.; Kaushal, R.K.; Gururaj, H.L.; Flammini, F.; Natarajan, R. System and Method for Driver Drowsiness Detection Using Behavioral and Sensor-Based Physiological Measures. Sensors 2023, 23, 1292. [Google Scholar] [CrossRef] [PubMed]
- Danisman, T.; Bilasco, I.M.; Djeraba, C.; Ihaddadene, N. Drowsy driver detection system using eye blink patterns. In Proceedings of the 2010 International Conference on Machine and Web Intelligence, Algiers, Algeria, 3–5 October 2010; pp. 230–233. [Google Scholar] [CrossRef]
- Minhas, R.; Arbatli, S.; Celik, Y.; Peker, Y.; Semiz, B. A Novel Approach to Quantify Microsleep in Drivers with Obstructive Sleep Apnea by Concurrent Analysis of EEG Patterns and Driving Attributes. IEEE J. Biomed. Health Inform. 2024, 28, 1341–1352. [Google Scholar] [CrossRef] [PubMed]
- Klem, G.H.; Lüders, H.O.; Jasper, H.H.; Elger, C. The ten-twenty electrode system of the International Federation. The International Federation of Clinical Neurophysiology. Electroencephalogr. Clin. Neurophysiol. Suppl. 1999, 52, 3–6. [Google Scholar] [PubMed]
- Meuleners, L.; Fraser, M.L.; Govorko, M.H.; Stevenson, M.R. Obstructive sleep apnea, health-related factors, and long-distance heavy vehicle crashes in Western Australia: A case-control study. J. Clin. Sleep. Med. 2015, 11, 413–418. [Google Scholar] [CrossRef] [PubMed]
- Heinzer, R.; Vat, S.; Marques-Vidal, P.; Marti-Soler, H.; Andries, D.; Tobback, N.; Mooser, V.; Preisig, M.; Malhotra, A.; Waeber, G.; et al. Prevalence of sleep-disordered breathing in the general population: The HypnoLaus study. Lancet Respir. Med. 2015, 3, 310–318. [Google Scholar] [CrossRef] [PubMed]
- Peppard, P.E.; Young, T.; Barnet, J.H.; Palta, M.; Hagen, E.W.; Hla, K.M. Increased prevalence of sleep-disordered breathing in adults. Am. J. Epidemiol. 2013, 177, 1006–1014. [Google Scholar] [CrossRef] [PubMed]
- Epstein, L.J.; Kristo, D.; Strollo, P.J., Jr.; Friedman, N.; Malhotra, A.; Patil, S.P.; Ramar, K.; Rogers, R.; Schwab, R.J.; Weaver, E.M.; et al. Adult Obstructive Sleep Apnea Task Force of the American Academy of Sleep Medicine. Clinical guideline for the evaluation, management and long-term care of obstructive sleep apnea in adults. J. Clin. Sleep. Med. 2009, 5, 263–276. [Google Scholar] [PubMed]
- Walsh, J.K.; Muehlbach, M.J.; Humm, T.M.; Dickins, Q.S.; Sugerman, J.L.; Schweitzer, P.K. Effect of caffeine on physiological sleep tendency and ability to sustain wakefulness at night. Psychopharmacology 1990, 101, 271–273. [Google Scholar] [CrossRef] [PubMed]
- Connor, J.; Norton, R.; Ameratunga, S.; Robinson, E.; Civil, I.; Dunn, R.; Bailey, J.; Jackson, R. Driver sleepiness and risk of serious injury to car occupants: Population-based case-control study. BMJ 2002, 324, 1125. [Google Scholar] [CrossRef] [PubMed]
- Viola, P.; Jones, M. Rapid object detection using a boosted cascade of simple features. In Proceedings of the 2001 IEEE Computer Society Conference on Computer Vision and Pattern Recognition, CVPR 2001, Kauai, HI, USA, 8–14 December 2001; pp. I–I. [Google Scholar] [CrossRef]
- King, D.E. Dlib-ml: A machine learning toolkit. J. Mach. Learn. Res. 2009, 10, 1755–1758. [Google Scholar]
- Zaki, A.; Noor, M.; Jafar, F.A.; Ibrahim, M.R.; Nizam, S.; Soid, M. Fatigue Detection among Operators in Industry Based on Euclidean Distance Computation Using Python Software. Int. J. Emerg. Trends Eng. Res. 2020, 8, 6375–6379. [Google Scholar]
- Sathasivam, S.; Mahamad, A.K.; Saon, S.; Sidek, A.; Som, M.M.; Ameen, H.A. Drowsiness Detection System using Eye Aspect Ratio Technique. In Proceedings of the 2020 IEEE Student Conference on Research and Development (SCOReD), Batu Pahat, Malaysia, 27–29 September 2020; pp. 448–452. [Google Scholar] [CrossRef]
- You, F.; Li, X.; Gong, Y.; Wang, H.; Li, H. A Real-time Driving Drowsiness Detection Algorithm with Individual Differences Consideration. IEEE Access 2019, 7, 179396–179408. [Google Scholar] [CrossRef]
- Dewi, C.; Chen, R.-C.; Chang, C.-W.; Wu, S.-H.; Jiang, X.; Yu, H. Eye Aspect Ratio for Real-Time Drowsiness Detection to Improve Driver Safety. Electronics 2022, 11, 3183. [Google Scholar] [CrossRef]
- Cheng, Q.; Wang, W.; Jiang, X.; Hou, S.; Qin, Y. Assessment of Driver Mental Fatigue Using Facial Landmarks. IEEE Access 2019, 7, 150423–150434. [Google Scholar] [CrossRef]
- Kristiansen, S.; Traaen, G.M.; Øverland, B.; Plagemann, T.; Gullestad, L.; Akre, H.; Nikolaidis, K.; Aakerøy, L.; Hunt, T.E.; Loennechen, J.P.; et al. Comparing Manual and Automatic Scoring of Sleep Monitoring Data from Portable Polygraphy. J. Sleep Res. 2021, 30, e13036. [Google Scholar] [CrossRef]
- Wang, Y.; Toor, S.S.; Gautam, R.; Henson, D.B. Blink Frequency and Duration during Perimetry and Their Relationship to Test–Retest Threshold Variability. Investig. Ophthalmol. Vis. Sci. 2011, 52, 4546–4550. [Google Scholar] [CrossRef] [PubMed]
- Mir, W.A.; Anjum, M.; Izharuddin; Shahab, S. Deep-EEG: An Optimized and Robust Framework and Method for EEG-Based Diagnosis of Epileptic Seizure. Diagnostics 2023, 13, 773. [Google Scholar] [CrossRef] [PubMed]
- Mercy, M.S. Performance Analysis of Epileptic Seizure Detection Using DWT & ICA with Neural Networks. Int. J. Comput. Eng. Res. 2012, 2, 1109–1113. [Google Scholar]
- Riera-Guasp, M.; Antonino-Daviu, J.A.; Pineda-Sanchez, M.; Puche-Panadero, R.; Perez-Cruz, J. A General Approach for the Transient Detection of Slip-Dependent Fault Components Based on the Discrete Wavelet Transform. IEEE Trans. Ind. Electron. 2008, 55, 4167–4180. [Google Scholar] [CrossRef]
- Al-Qazzaz, N.K.; Hamid Bin Mohd Ali, S.; Ahmad, S.A.; Islam, M.S.; Escudero, J. Automatic Artifact Removal in EEG of Normal and Demented Individuals Using ICA-WT during Working Memory Tasks. Sensors 2017, 17, 1326. [Google Scholar] [CrossRef] [PubMed]
- Polat, C.; Özerdem, M.S. Introduction to Wavelets and Their Applications in Signal Denoising. Bitlis Eren Univ. J. Sci. Technol. 2018, 8, 1–10. [Google Scholar] [CrossRef]
- Nanthini, B.S.; Santhi, B. Electroencephalogram Signal Classification for Automated Epileptic Seizure Detection Using Genetic Algorithm. J. Nat. Sci. Biol. Med. 2017, 8, 159–166. [Google Scholar] [CrossRef] [PubMed]
- Aliyu, I.; Lim, C.G. Selection of Optimal Wavelet Features for Epileptic EEG Signal Classification with LSTM. Neural Comput. Appl. 2023, 35, 1077–1097. [Google Scholar] [CrossRef]
- Güler, I.; Übeyli, E.D. Adaptive Neuro-Fuzzy Inference System for Classification of EEG Signals Using Wavelet Coefficients. J. Neurosci. Methods 2005, 148, 113–121. [Google Scholar] [CrossRef] [PubMed]
- Sriraam, N.; Padma Shri, T.K.; Maheshwari, U. Recognition of Wake-Sleep Stage 1 Multichannel EEG Patterns Using Spectral Entropy Features for Drowsiness Detection. Australas. Phys. Eng. Sci. Med. 2016, 39, 797–806. [Google Scholar] [CrossRef] [PubMed]
- Krishnan, P.; Yaacob, S.; Krishnan, A.P. Drowsiness Detection Using Electroencephalogram Anomaly Based on Spectral Entropy Features and Linear Classifier. In Progress in Engineering Technology II, Advanced Structured Materials; Abu Bakar, M., Azwa Zamri, F., Öchsner, A., Eds.; Springer: Cham, Switzerland, 2020; Volume 131. [Google Scholar] [CrossRef]
- Giannakopoulos, T.; Pikrakis, A. Introduction to Audio Analysis; Academic Press: Cambridge, MA, USA, 2014; ISBN 9780080993898. Available online: https://www.oreilly.com/library/view/introduction-to-audio/9780080993881/ (accessed on 1 April 2023).
- De Winter, J.C.; Gosling, S.D.; Potter, J. Comparing the Pearson and Spearman Correlation Coefficients Across Distributions and Sample Sizes: A Tutorial Using Simulations and Empirical Data. Psychol. Methods 2016, 21, 273–290. [Google Scholar] [CrossRef] [PubMed]
- Drutarovsky, T.; Fogelton, A. Eye Blink Detection Using Variance of Motion Vectors. In ECCV Workshops 2014; Springer: Cham, Switzerland, 2015. [Google Scholar]
- Peker, N.Y.; Zengin, A.; Eroglu Erdem, C.; Demirsoy, M.S. A New Adaptive Threshold Algorithm for Eyeblink Detection. J. ESOGU Eng. Arch. Fac. 2023, 31, 718–728. [Google Scholar]
- Zhang, C.; Wang, W.; Chen, C.; Zeng, C.; Anderson, D.E.; Cheng, B. Determination of Optimal Electroencephalography Recording Locations for Detecting Drowsy Driving. IET Intell. Transp. Syst. 2018, 12, 345–350. [Google Scholar] [CrossRef]
- Paul, A.; Boyle, L.N.; Tippin, J.; Rizzo, M. Variability of Driving Performance During Microsleeps. In Proceedings of the Third International Driving Symposium on Human Factors in Driving Assessment, Training, and Vehicle Design, Rockport, ME, USA, 27–30 June 2005. [Google Scholar]
- Oken, B.S.; Salinsky, M.C.; Elsas, S.M. Vigilance, Alertness, or Sustained Attention: Physiological Basis and Measurement. Clin. Neurophysiol. 2006, 117, 1885–1901. [Google Scholar] [CrossRef] [PubMed]
- Lacaux, C.; Strauss, M.; Bekinschtein, T.A.; Oudiette, D. Embracing Sleep-Onset Complexity. Trends Neurosci. 2024, Online ahead of print. [Google Scholar] [CrossRef] [PubMed]
- Li, Y.; Shen, L.; Sun, M. Electroencephalography Study of Frontal Lobe Evoked by Dynamic Random-Dot Stereogram. Investig. Ophthalmol. Vis. Sci. 2022, 63, 7. [Google Scholar] [CrossRef] [PubMed]
- Papadelis, C.; Kourtidou-Papadeli, C.; Bamidis, P.D.; Chouvarda, I.; Koufogiannis, D.; Bekiaris, E.; Maglaveras, N. Indicators of sleepiness in an ambulatory EEG study of night driving. In Proceedings of the International Conference of the IEEE Engineering in Medicine and Biology Society, New York, NY, USA, 30 August–3 September 2006; pp. 6201–6204. [Google Scholar] [CrossRef]
- Lin, C.-T.; Wu, R.-C.; Liang, S.-F.; Chao, W.-H.; Chen, Y.-J.; Jung, T.-P. EEG-based drowsiness estimation for safety driving using independent component analysis. IEEE Trans. Circuits Syst. I Regul. Pap. 2005, 52, 2726–2738. [Google Scholar] [CrossRef]
- Li, G.; Chung, W.-Y. Estimation of Eye Closure Degree Using EEG Sensors and Its Application in Driver Drowsiness Detection. Sensors 2014, 14, 17491–17515. [Google Scholar] [CrossRef] [PubMed]
- Nguyen, T.P.; Chew, M.T.; Demidenko, S. Eye Tracking System to Detect Driver Drowsiness. In Proceedings of the 6th International Conference on Automation, Robotics and Applications (ICARA), Queenstown, New Zealand, 17–19 February 2015; pp. 472–477. [Google Scholar] [CrossRef]
- Dasgupta, D.; Rahman, S.; Routray, A. A Smartphone-Based Drowsiness Detection and Warning System for Automotive Drivers. IEEE Trans. Intell. Transp. Syst. 2019, 20, 4045–4054. [Google Scholar] [CrossRef]
- Zheng, Q.; Zhao, P.; Wang, H.; Elhanashi, A.; Saponara, S. Fine-Grained Modulation Classification Using Multi-Scale Radio Transformer with Dual-Channel Representation. IEEE Commun. Lett. 2022, 26, 1298–1302. [Google Scholar] [CrossRef]
- Ju, J.; Feleke, A.G.; Luo, L.; Fan, X. Recognition of Drivers’ Hard and Soft Braking Intentions Based on Hybrid Brain-Computer Interfaces. Cyborg Bionic Syst. 2022, 2022, 9847652. [Google Scholar] [CrossRef]
- Wang, F.; Ma, M.; Zhang, X. Study on a Portable Electrode Used to Detect the Fatigue of Tower Crane Drivers in Real Construction Environment. IEEE Trans. Instrum. Meas. 2024, 73, 2506914. [Google Scholar] [CrossRef]
- Zhang, H.; Zhou, Q.Q.; Chen, H.; Hu, X.Q.; Li, W.G.; Bai, Y.; Han, J.X.; Wang, Y.; Liang, Z.H.; Chen, D.; et al. The Applied Principles of EEG Analysis Methods in Neuroscience and Clinical Neurology. Mil. Med. Res. 2023, 10, 67. [Google Scholar] [CrossRef] [PubMed]
- Rajput, D.; Wang, W.J.; Chen, C.C. Evaluation of a Decided Sample Size in Machine Learning Applications. BMC Bioinform. 2023, 24, 48. [Google Scholar] [CrossRef] [PubMed]
- Machine Learning Master. Impact of Dataset Size on Deep Learning Model Skill and Performance Estimates. 2020. Available online: https://machinelearningmastery.com/impact-of-dataset-size-on-deep-learning-model-skill-and-performance-estimates/ (accessed on 1 April 2023).
- Safarov, F.; Akhmedov, F.; Abdusalomov, A.B.; Nasimov, R.; Cho, Y.I. Real-Time Deep Learning-Based Drowsiness Detection: Leveraging Computer-Vision and Eye-Blink Analyses for Enhanced Road Safety. Sensors 2023, 23, 6459. [Google Scholar] [CrossRef] [PubMed]
- Wang, F.; Gu, T.; Yao, W. Research on the Application of the Sleep EEG Net Model Based on Domain Adaptation Transfer in the Detection of Driving Fatigue. Biomed. Signal Process. Control 2024, 90, 105832. [Google Scholar] [CrossRef]
- Hertig-Godeschalk, A.; Skorucak, J.; Malafeev, A.; Achermann, P.; Mathis, J.; Schreier, D.R. Microsleep episodes in the borderland between wakefulness and sleep. Sleep 2020, 43, zsz163. [Google Scholar] [CrossRef] [PubMed]
- Guilleminault, C.; Billiard, M.; Montplaisir, J.; Dement, W.C. Altered states of consciousness in disorders of daytime sleepiness. J. Neurol. Sci. 1975, 26, 377–393. [Google Scholar] [CrossRef] [PubMed]


| Parameter | Value |
|---|---|
| Sex | All are males |
| Age | 32–68 (47.9 ± 7.6) year |
| Body Mass Index (BMI) | 23.5–41.9 (31.3 ± 4.4) kg/m2 |
| Last night sleep hours | 1–11 (6.3 ± 1.8) hour |
| Apnea–Hypopnea Index (AHI) | 5–103.5 (29.8 ± 23.2)/hour |
| Oxygen Desaturation Index (ODI) | 1.0–87.8 (24.4 ± 22.7)/hour |
| EEG Feature | Criterion for Correlation |
|---|---|
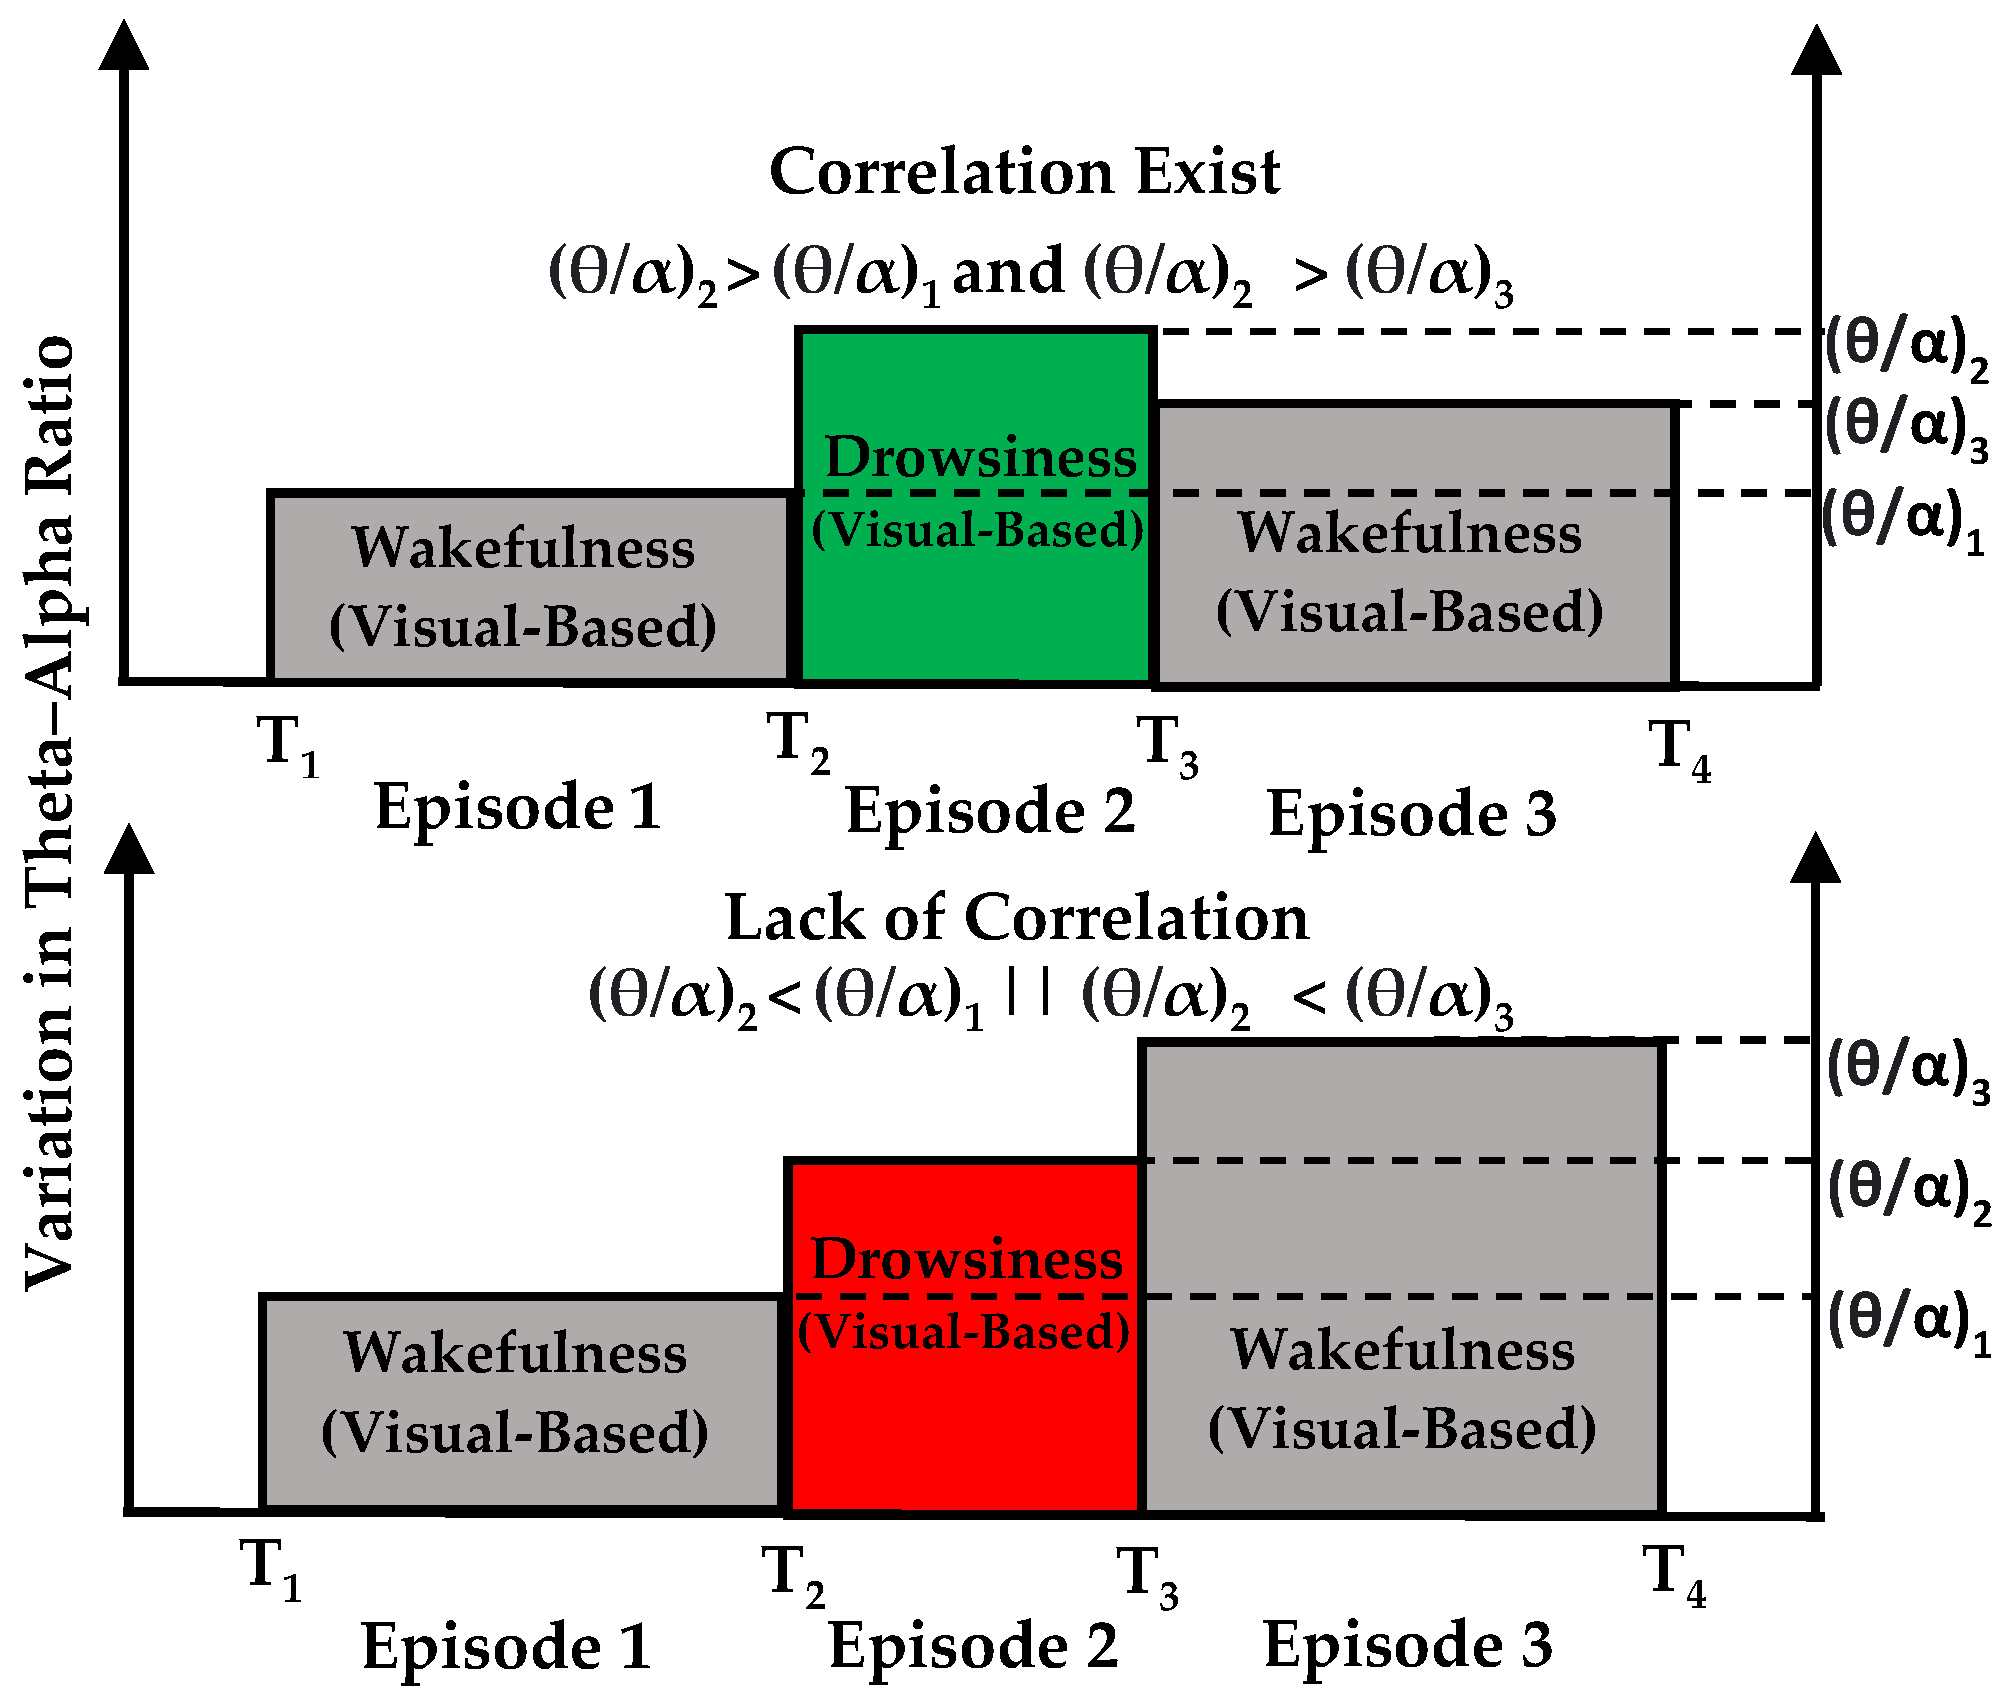
| Theta–alpha ratio | theta_alpha_ratio(i) > theta_alpha_ratio(i − 1) && theta_alpha_ratio(i + 1) |
| Delta–alpha ratio | delta_alpha_ratio(i) > delta_alpha_ratio(i − 1) && delta_alpha_ratio(i + 1) |
| Delta–theta ratio | delta_theta_ratio(i) > delta_theta_ratio(i − 1) && delta_theta_ratio(i + 1) |
| PSD Alpha | PSD_alpha(i) < PSD_alpha(i − 1) && PSD_alpha(i + 1) |
| PSD Theta | PSD_theta(i) > PSD_theta(i − 1) && PSD_theta(i + 1) |
| PSD Delta | PSD_delta(i) > PSD_delta(i − 1) && PSD_delta(i + 1) |
| Spectral Entropy | PSD_entropy(i) < PSD_entropy(i − 1) && PSD_entropy(i + 1) |
| Spectral Spread | PSD_spread(i) > PSD_spread(i − 1) && PSD_spread(i + 1) |
| Spectral Centroid | PSD_centroid(i) < PSD_centroid(i − 1) && PSD_centroid(i + 1) |
| Spectral Rolloff | PSD_rolloff(i) < PSD_rolloff(i − 1) && PSD_rolloff(i + 1) |
| Episodes | Visual-Based Scoring | Matched Episodes |
|---|---|---|
| Drowsiness | 453 | 427 (94.3%) |
| Wakefulness | 474 | 451 (95.1%) |
| Total Episodes | 927 | 878 (94.7%) |
| EEG Feature | Spearman’s Correlation |
|---|---|
| Theta–alpha ratio | r = 0.9942, p < 0.001 |
| Delta–alpha-ratio | r = 0.9768, p < 0.001 |
| Delta–theta-ratio | r = 0.9826, p < 0.001 |
| PSD Alpha | r = 0.9757, p < 0.001 |
| PSD Theta | r = 0.9633, p < 0.001 |
| PSD Delta | r = 0.9777, p < 0.001 |
| Spectral Entropy | r = 0.9268, p < 0.001 |
| Spectral Spread | r = 0.9816, p < 0.001 |
| Spectral Centroid | r = 0.9843, p < 0.001 |
| Spectral Rolloff | r = 0.9826, p < 0.001 |
| EEG Feature | EEG Channel | Average Sensitivity | Trend |
|---|---|---|---|
| Theta–alpha ratio | F4 | 75.4% | ↑ |
| Delta–alpha-ratio | O2 | 58.0% | ↑ |
| Delta–theta-ratio | O1 | 54.2% | ↑ |
| PSD Alpha | O1 | 54.2% | ↓ |
| PSD Theta | F4 | 56.5% | ↑ |
| PSD Delta | O2 | 56.1% | ↑ |
| Spectral Entropy | F3 | 55.1% | ↓ |
| Spectral Spread | O2 | 55.6% | ↑ |
| Spectral Centroid | O2 | 57.5% | ↓ |
| Spectral Rolloff | F4 | 57.0% | ↓ |
| EEG Feature | Brain Region | Average Combine Sensitivity |
|---|---|---|
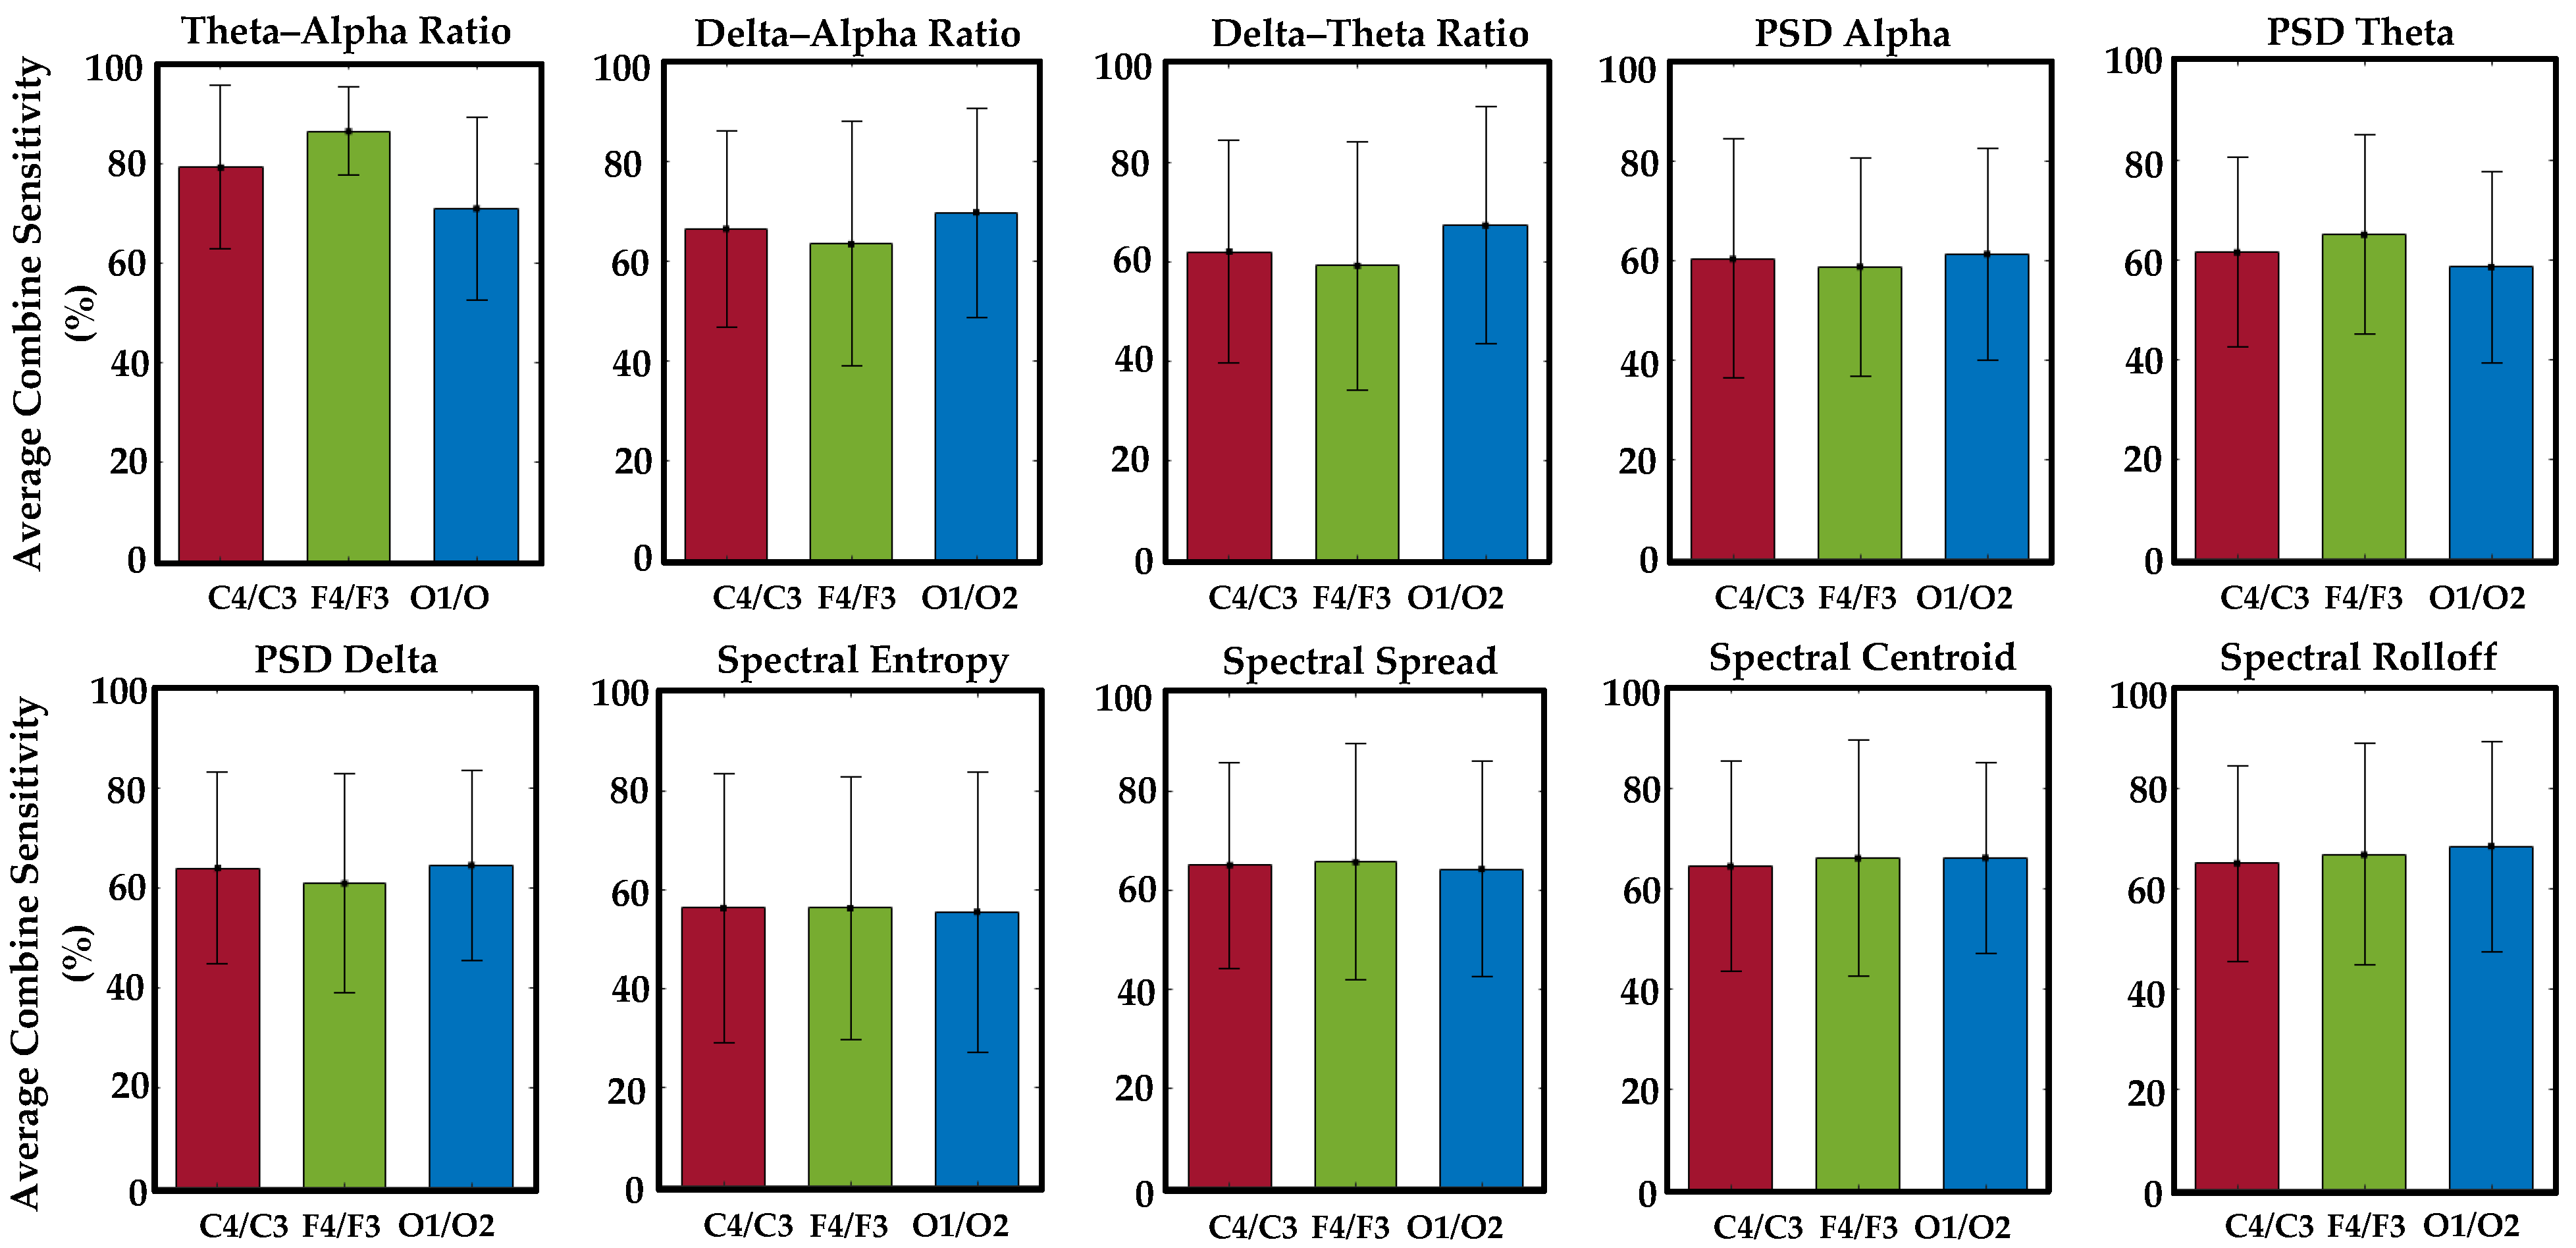
| Theta–alpha ratio | Frontal | 86.4% |
| Delta–alpha-ratio | Occipital | 69.7% |
| Delta–theta-ratio | Occipital | 67.3% |
| PSD Alpha | Occipital | 61.3% |
| PSD Theta | Frontal | 65.1% |
| PSD Delta | Occipital | 64.1% |
| Spectral Entropy | Frontal | 56.3% |
| Spectral Spread | Frontal | 65.6% |
| Spectral Centroid | Occipital | 66.1% |
| Spectral Rolloff | Occipital | 68.4% |
| Study Reference | Sensing Method | Methodology | Findings and Limitations |
|---|---|---|---|
| Safarov F et al. [83] | Camera | Threshold + DL-Based |
|
| Bajaj, J.S. et al. [34] | Camera + Galvanic Skin Response (GSR) | MTCNN |
|
| Arefnezhad, S. et al. [27] | SmartEye + EEG Electrodes | Encoder–Decoder Architecture |
|
| Arefnezhad, S. et al. [23] | Vehicle-Based | CNN + RNN |
|
| Wang, F et al. [84] | EEG Electrodes | CNN |
|
| Our Study | Camera + EEG Electrodes | One-to-one correlation |
|
Disclaimer/Publisher’s Note: The statements, opinions and data contained in all publications are solely those of the individual author(s) and contributor(s) and not of MDPI and/or the editor(s). MDPI and/or the editor(s) disclaim responsibility for any injury to people or property resulting from any ideas, methods, instructions or products referred to in the content. |
© 2024 by the authors. Licensee MDPI, Basel, Switzerland. This article is an open access article distributed under the terms and conditions of the Creative Commons Attribution (CC BY) license (https://creativecommons.org/licenses/by/4.0/).
Share and Cite
Minhas, R.; Peker, N.Y.; Hakkoz, M.A.; Arbatli, S.; Celik, Y.; Erdem, C.E.; Semiz, B.; Peker, Y. Association of Visual-Based Signals with Electroencephalography Patterns in Enhancing the Drowsiness Detection in Drivers with Obstructive Sleep Apnea. Sensors 2024, 24, 2625. https://doi.org/10.3390/s24082625
Minhas R, Peker NY, Hakkoz MA, Arbatli S, Celik Y, Erdem CE, Semiz B, Peker Y. Association of Visual-Based Signals with Electroencephalography Patterns in Enhancing the Drowsiness Detection in Drivers with Obstructive Sleep Apnea. Sensors. 2024; 24(8):2625. https://doi.org/10.3390/s24082625
Chicago/Turabian StyleMinhas, Riaz, Nur Yasin Peker, Mustafa Abdullah Hakkoz, Semih Arbatli, Yeliz Celik, Cigdem Eroglu Erdem, Beren Semiz, and Yuksel Peker. 2024. "Association of Visual-Based Signals with Electroencephalography Patterns in Enhancing the Drowsiness Detection in Drivers with Obstructive Sleep Apnea" Sensors 24, no. 8: 2625. https://doi.org/10.3390/s24082625