
Multi-Sensor Image and Range-Based Techniques for the Geometric Documentation and the Photorealistic 3D Modeling of Complex Architectural Monuments

 , ,
, ,
Abstract
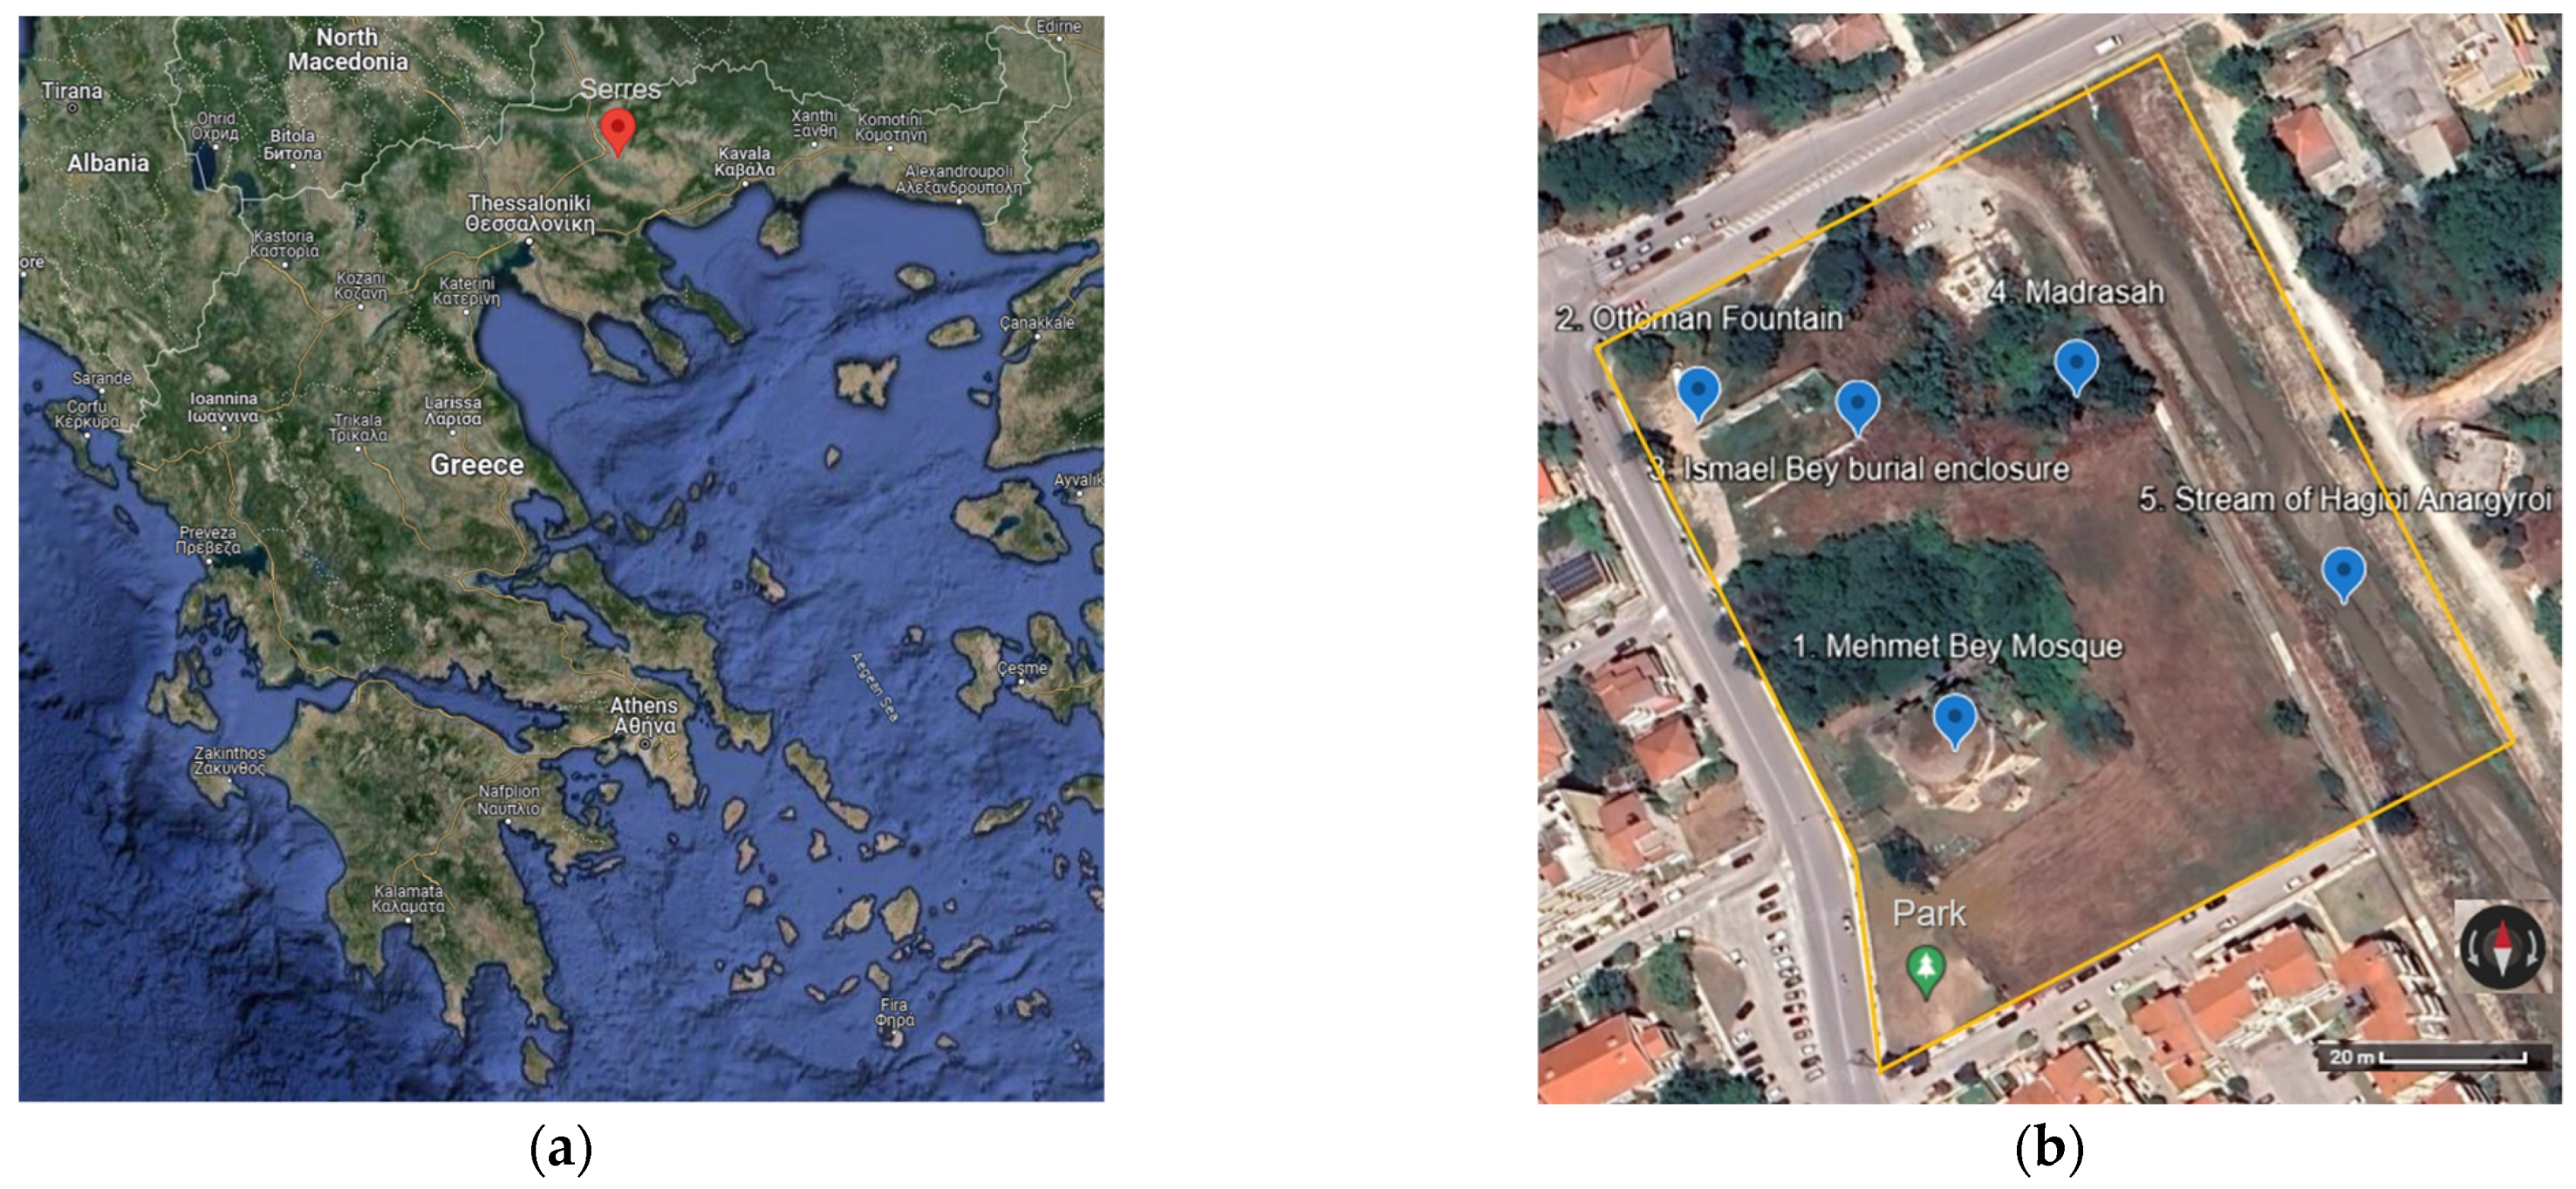
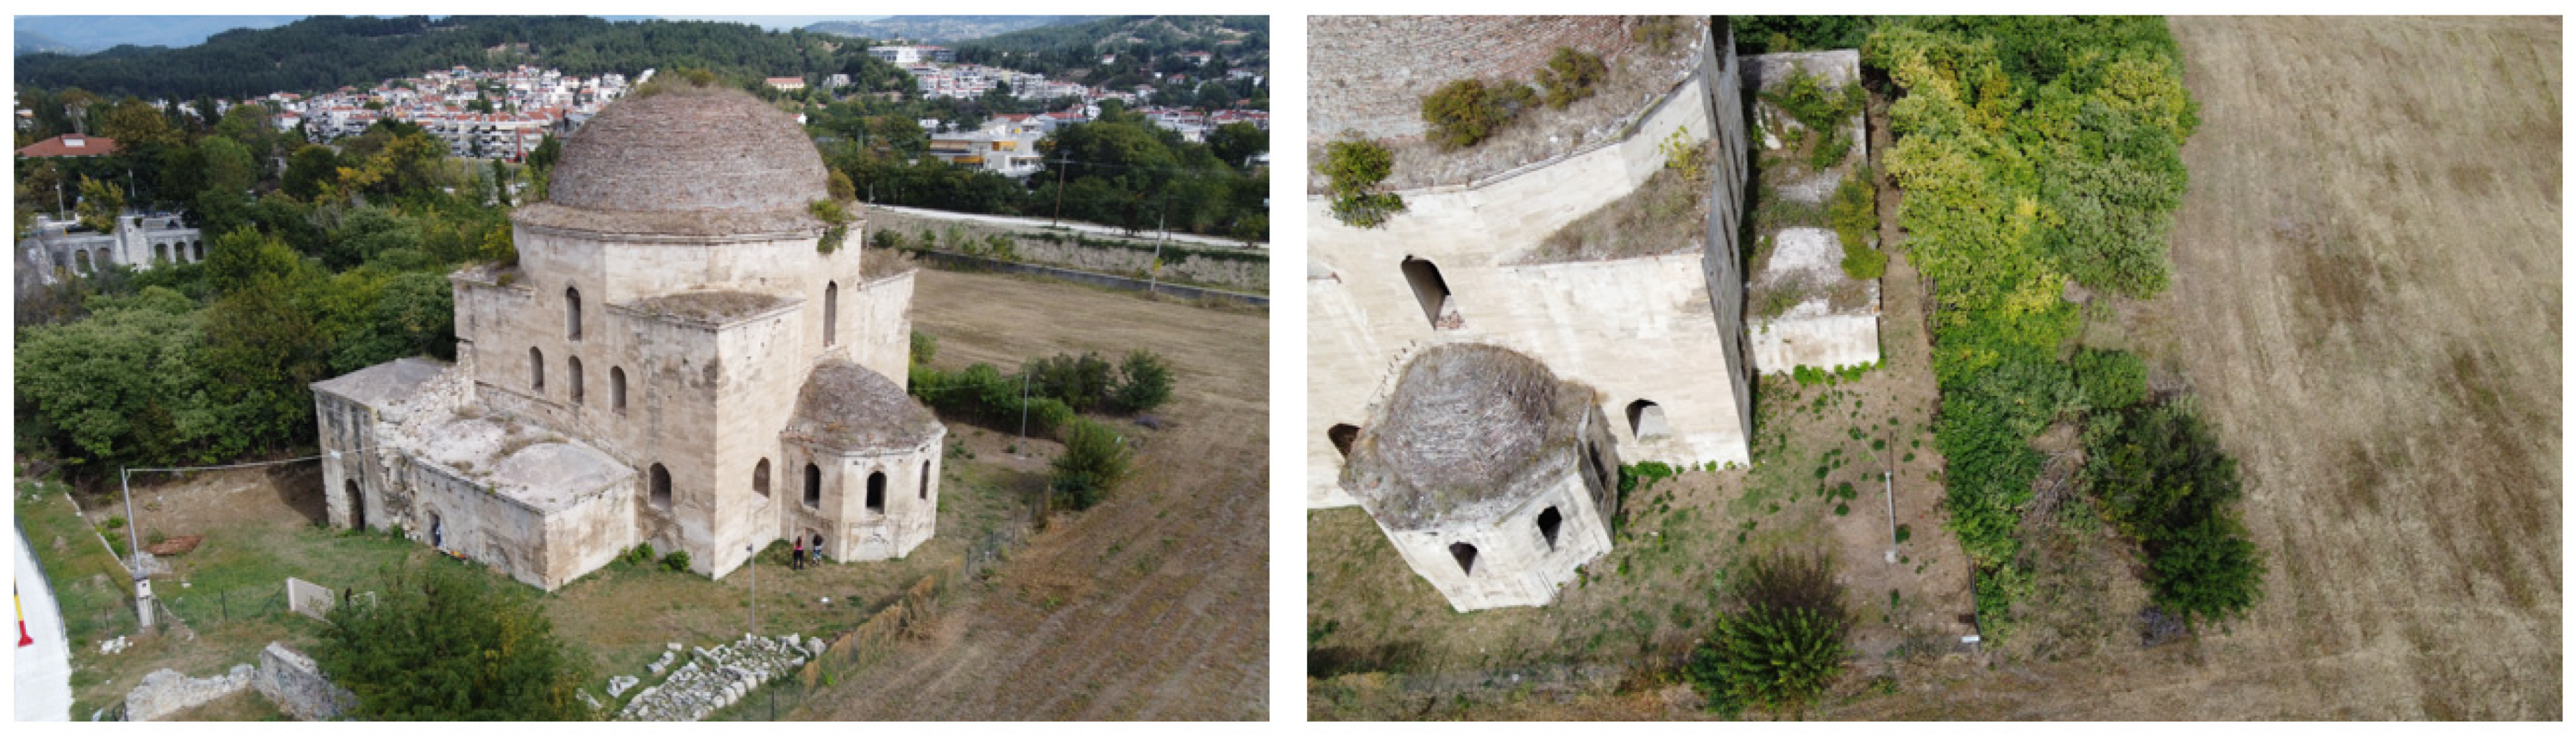
:1. Introduction
2. Methodology
2.1. Data Collection
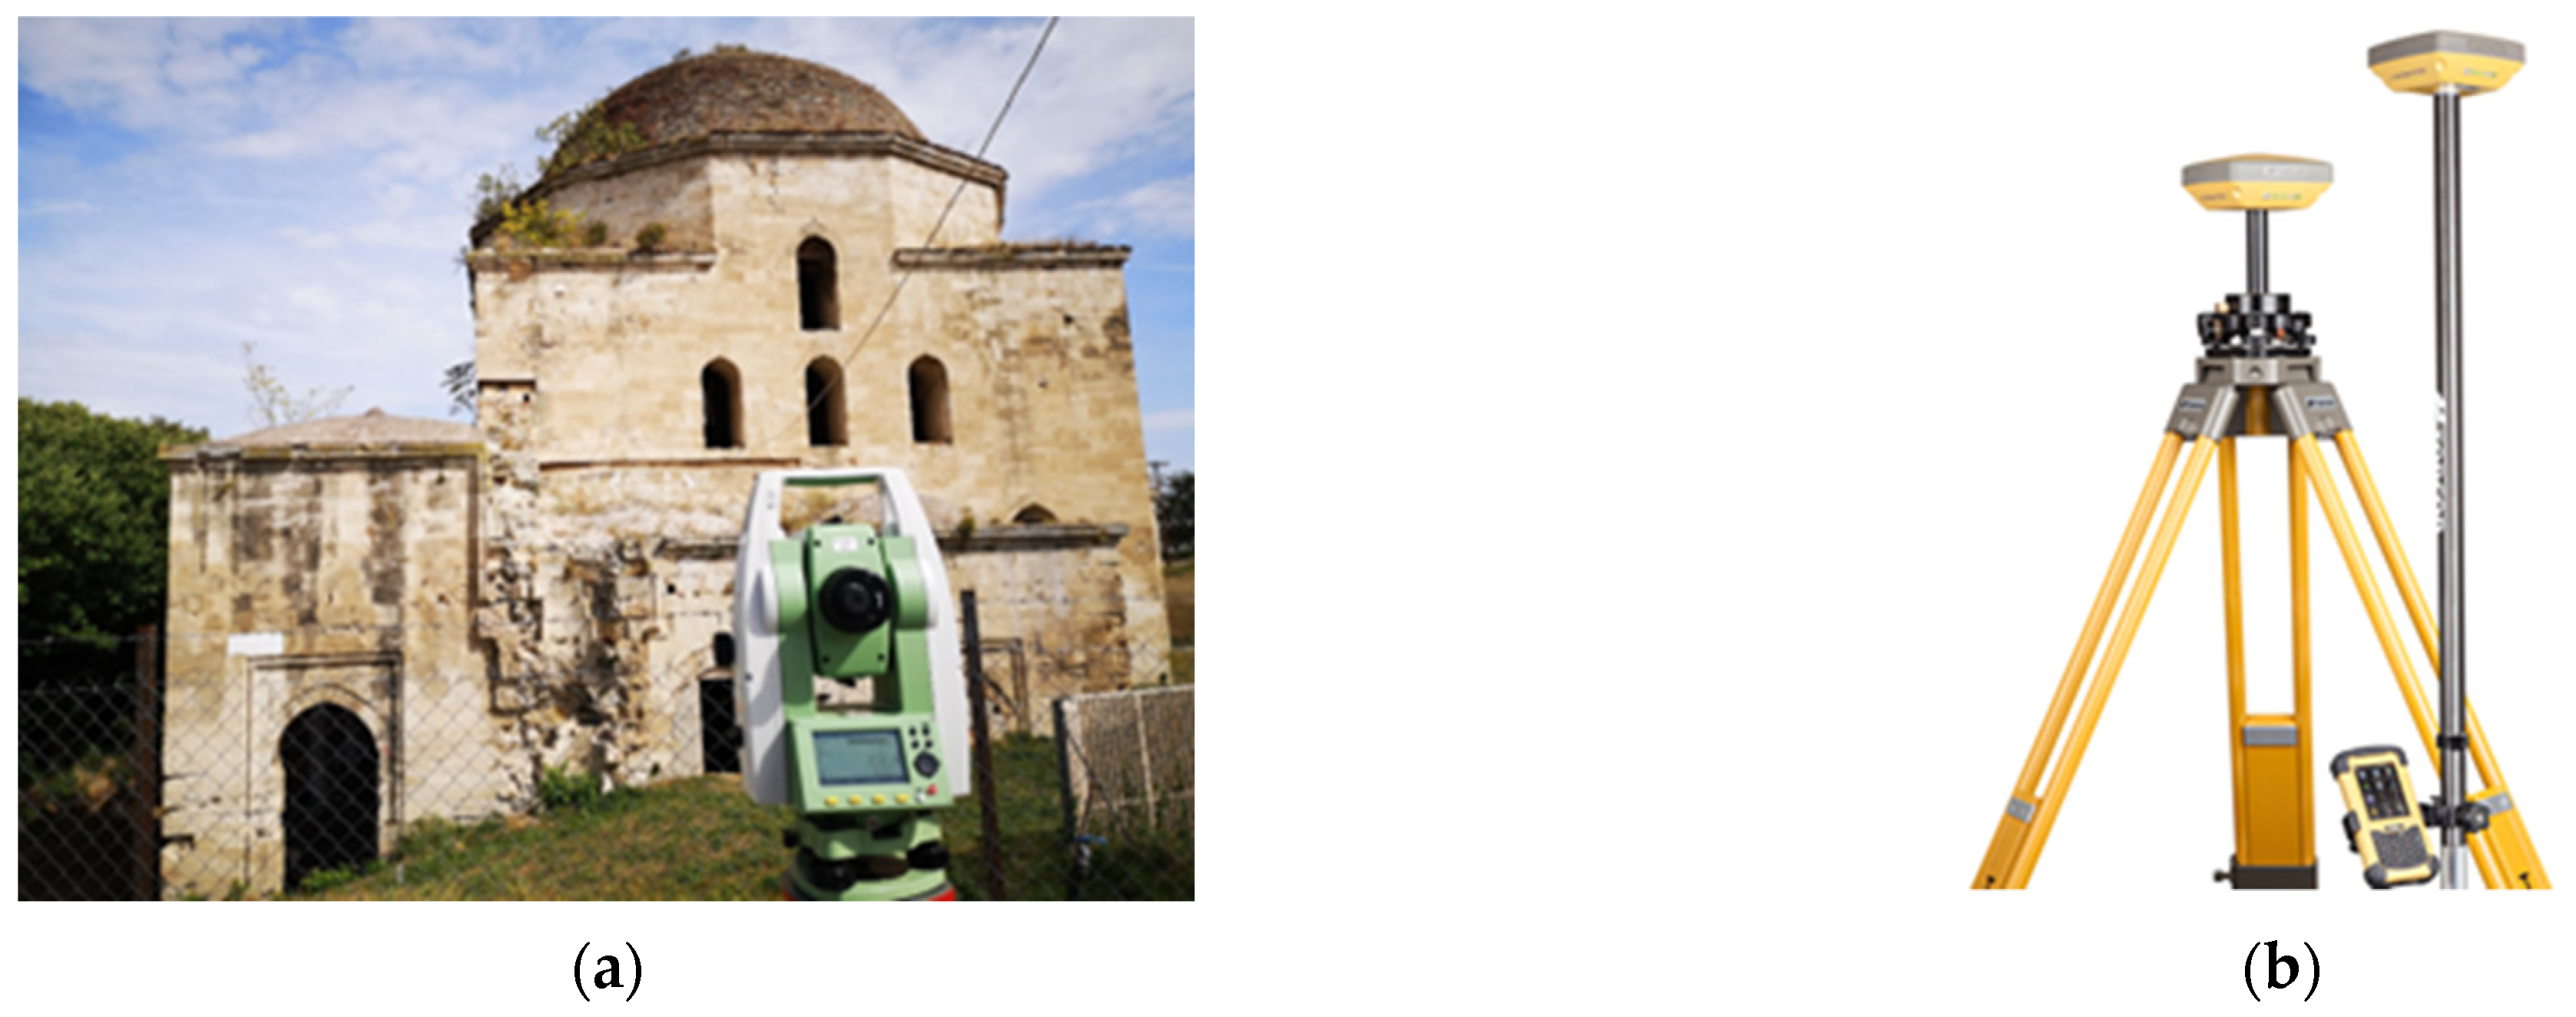
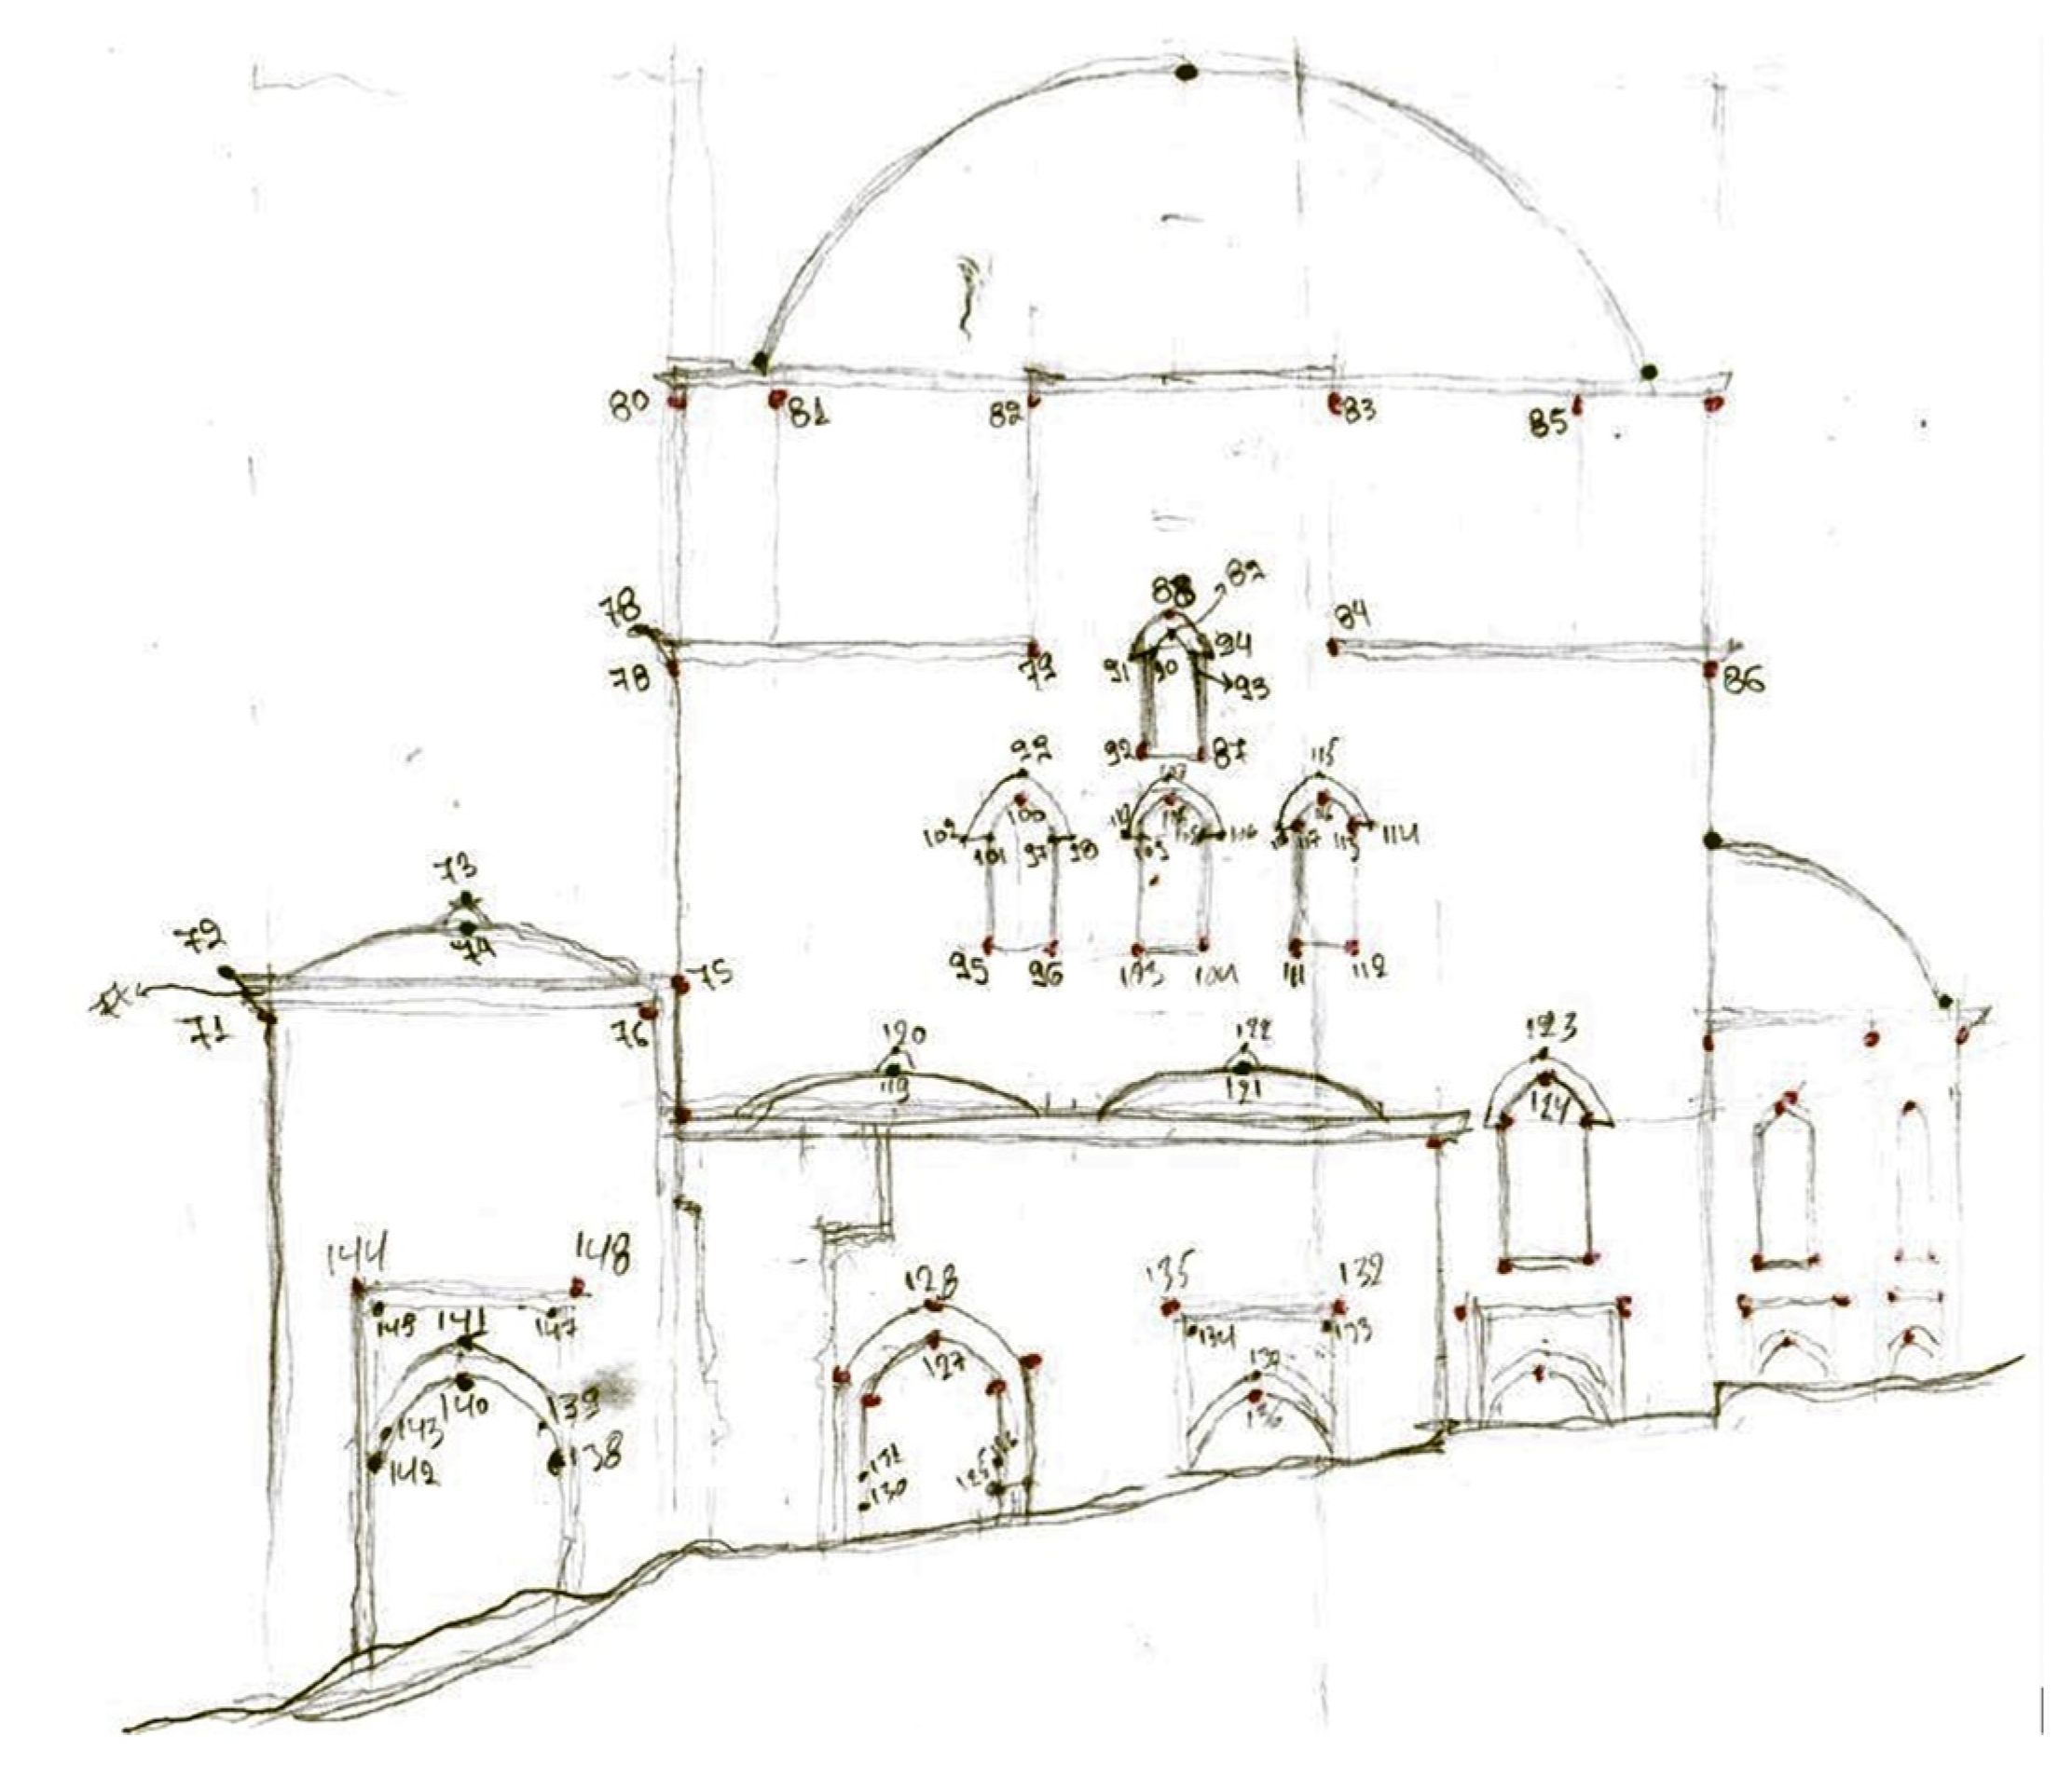
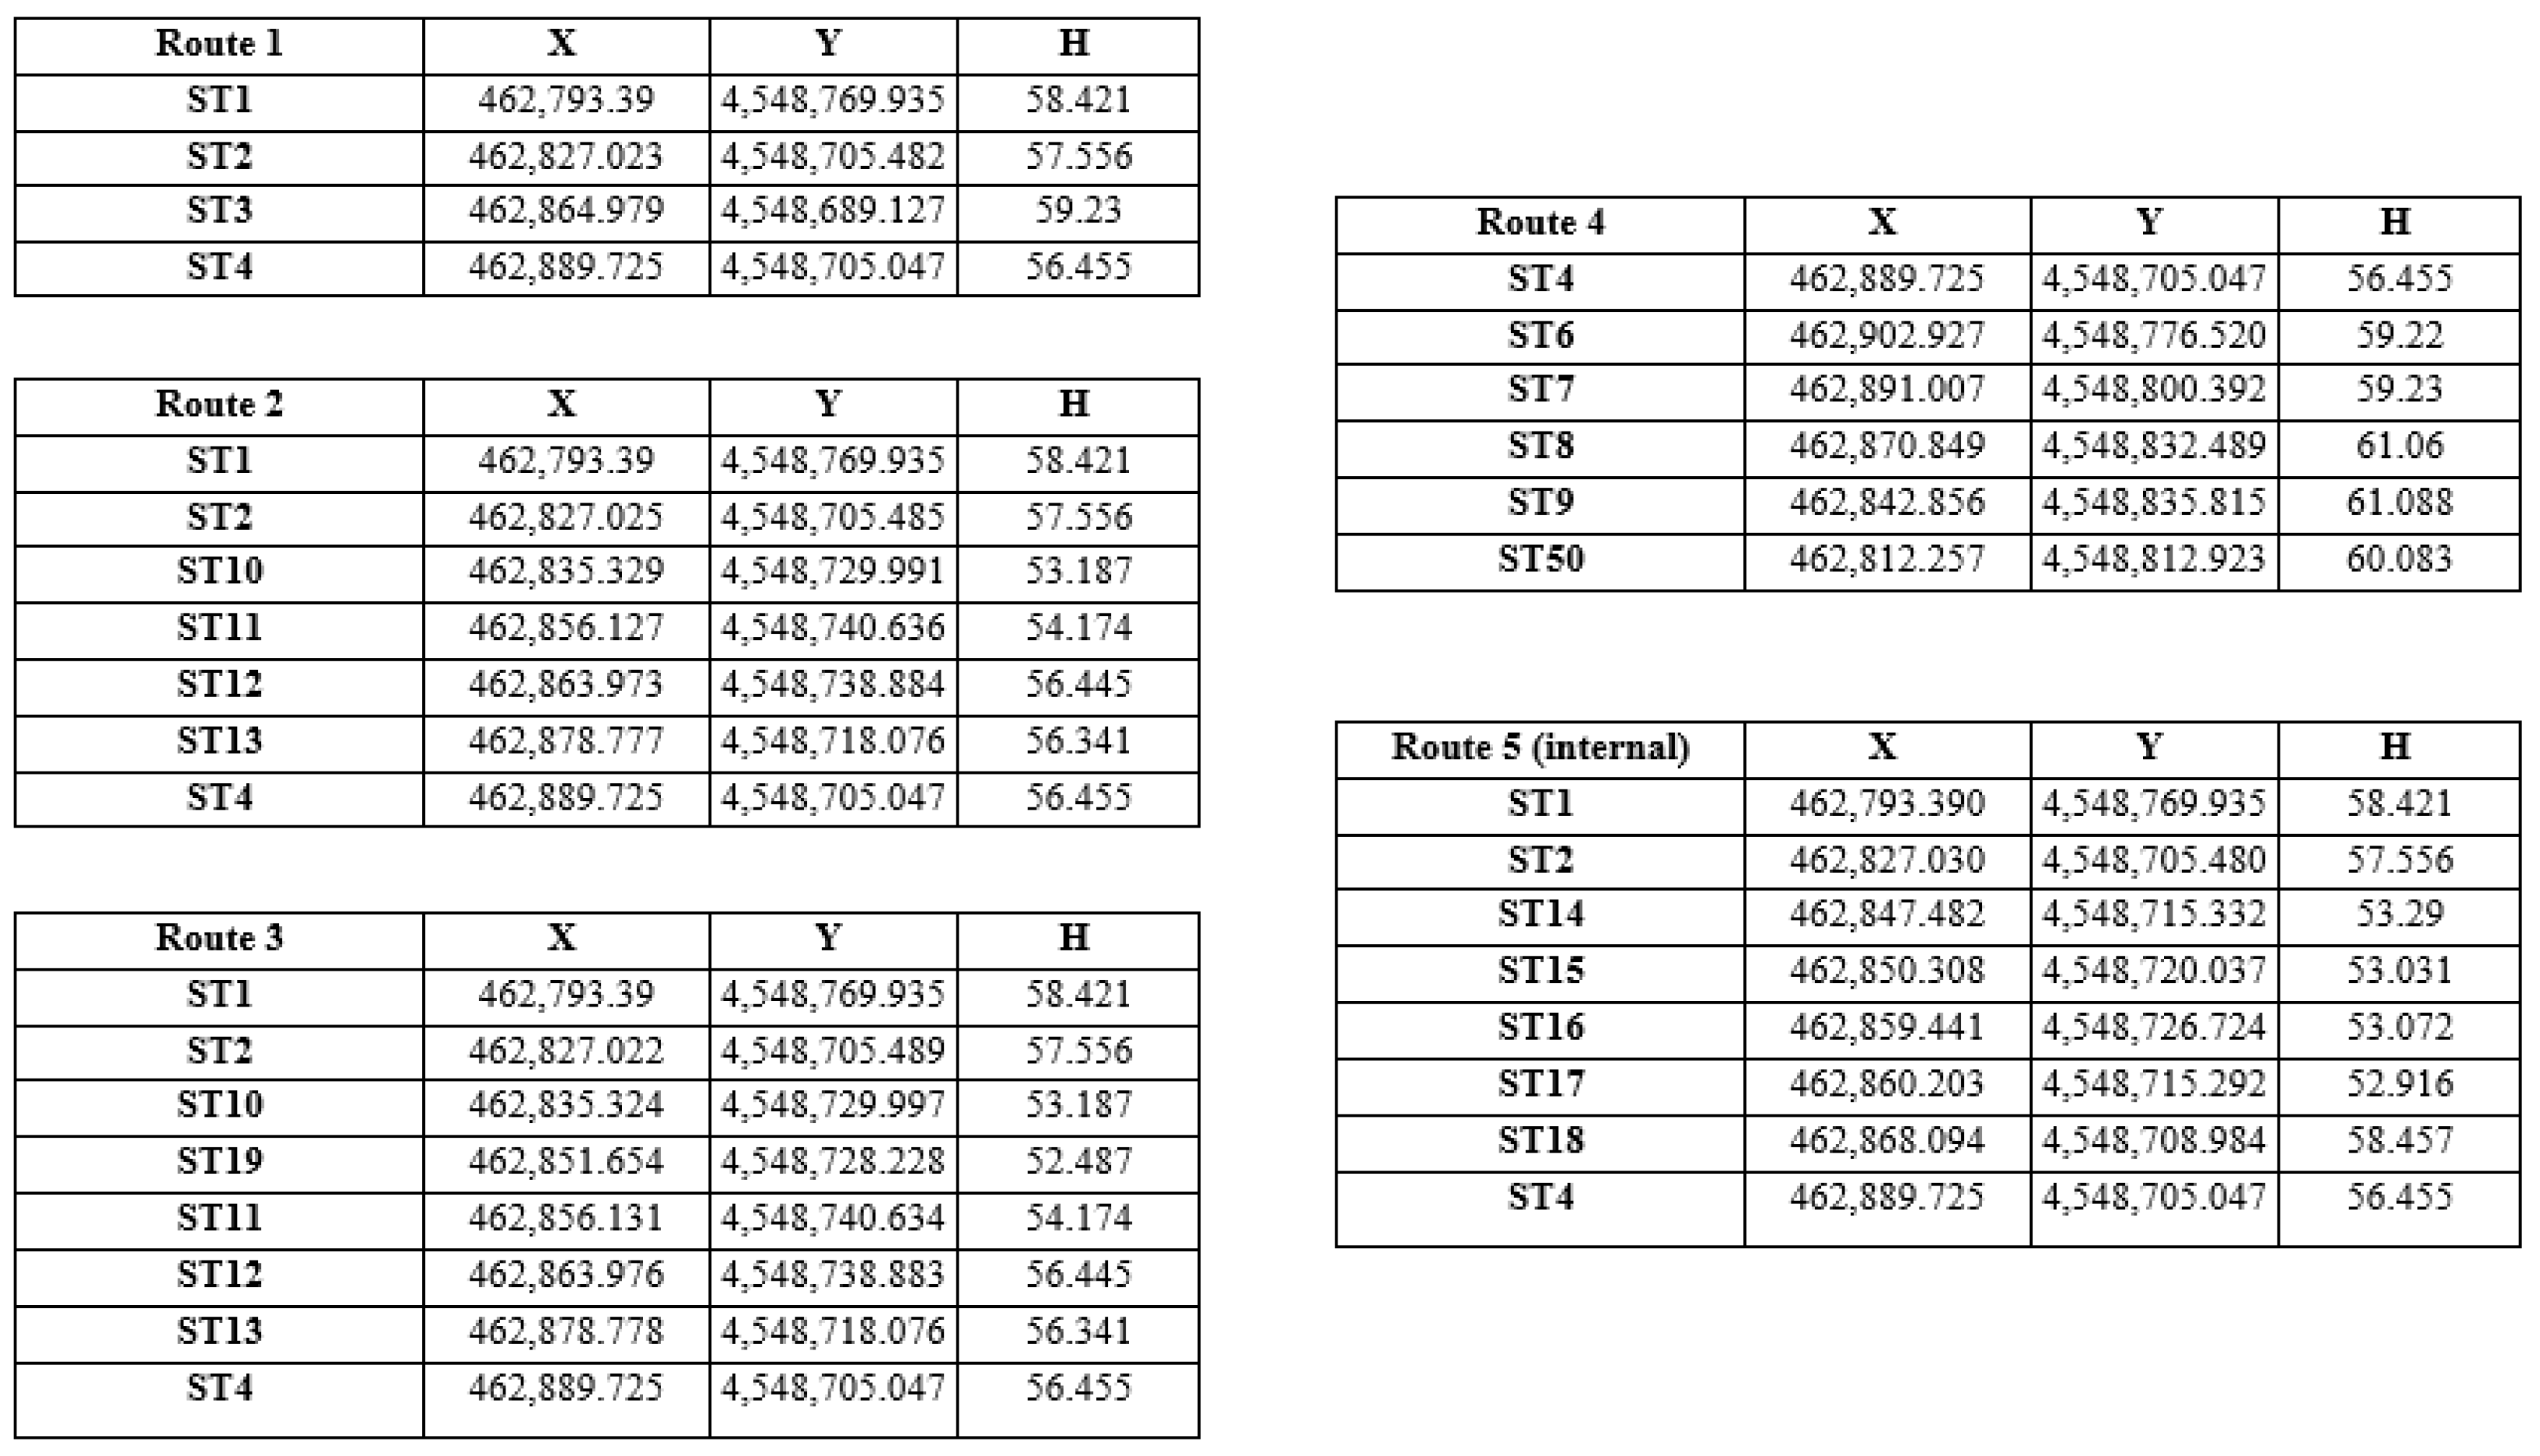
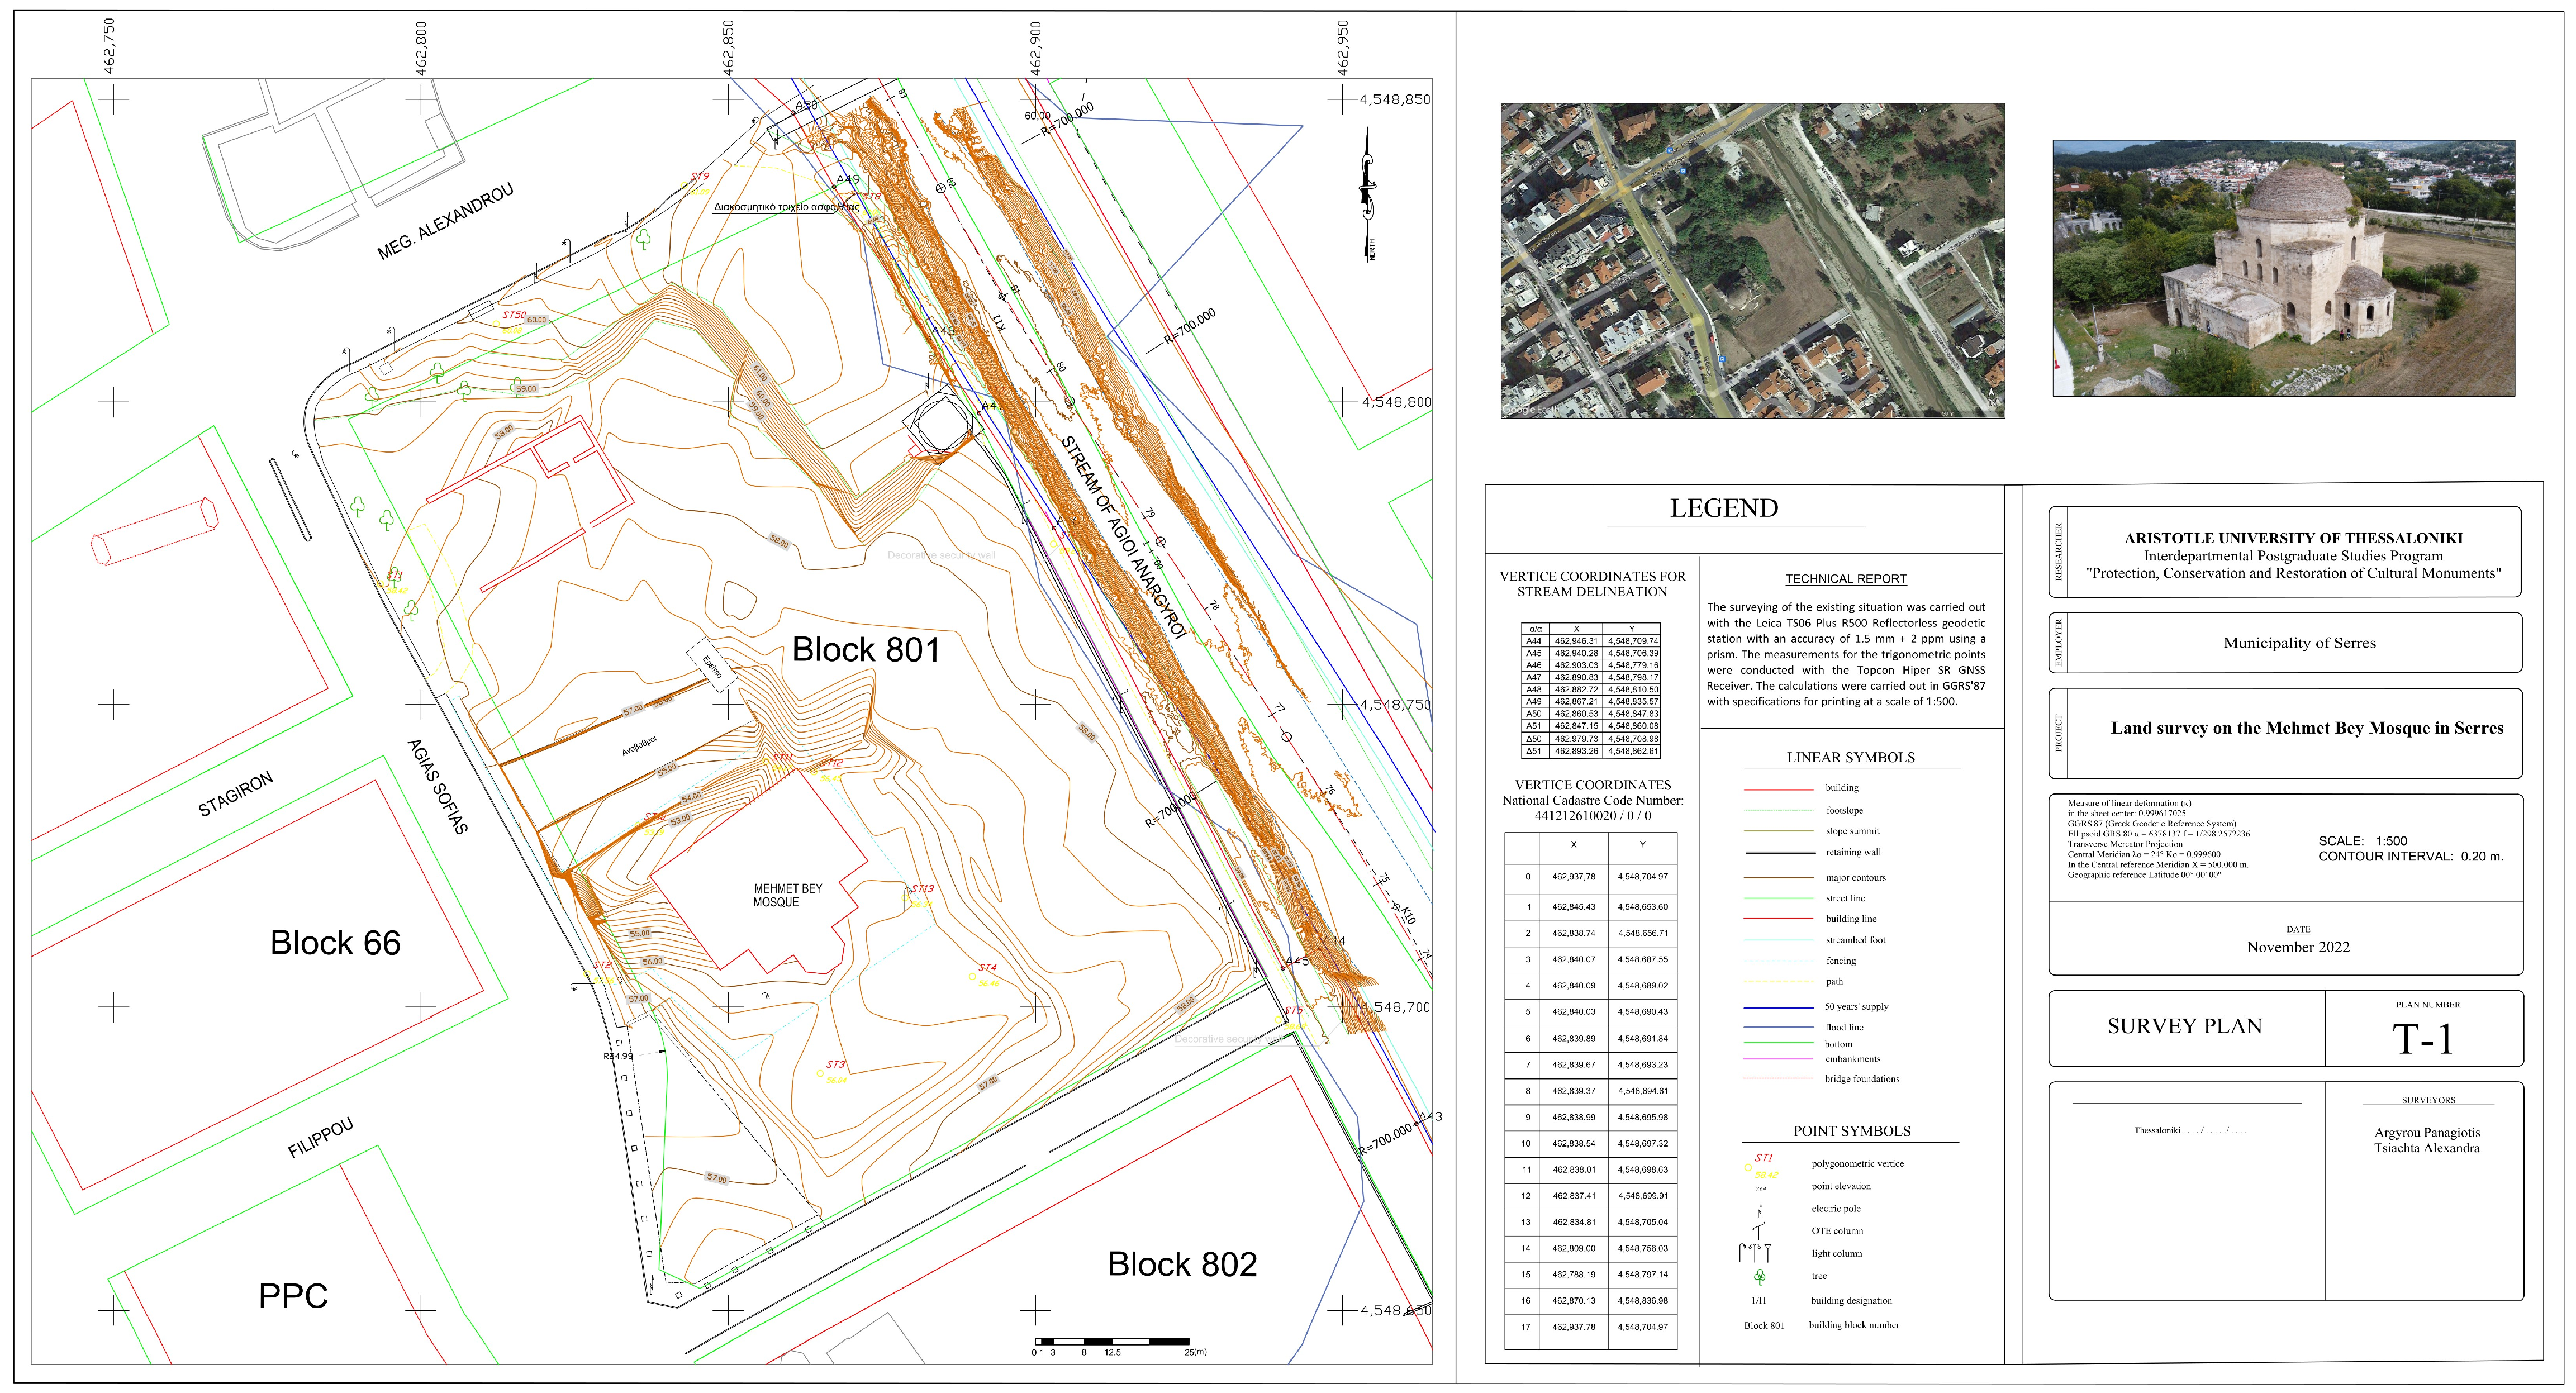
2.1.1. Land Surveying
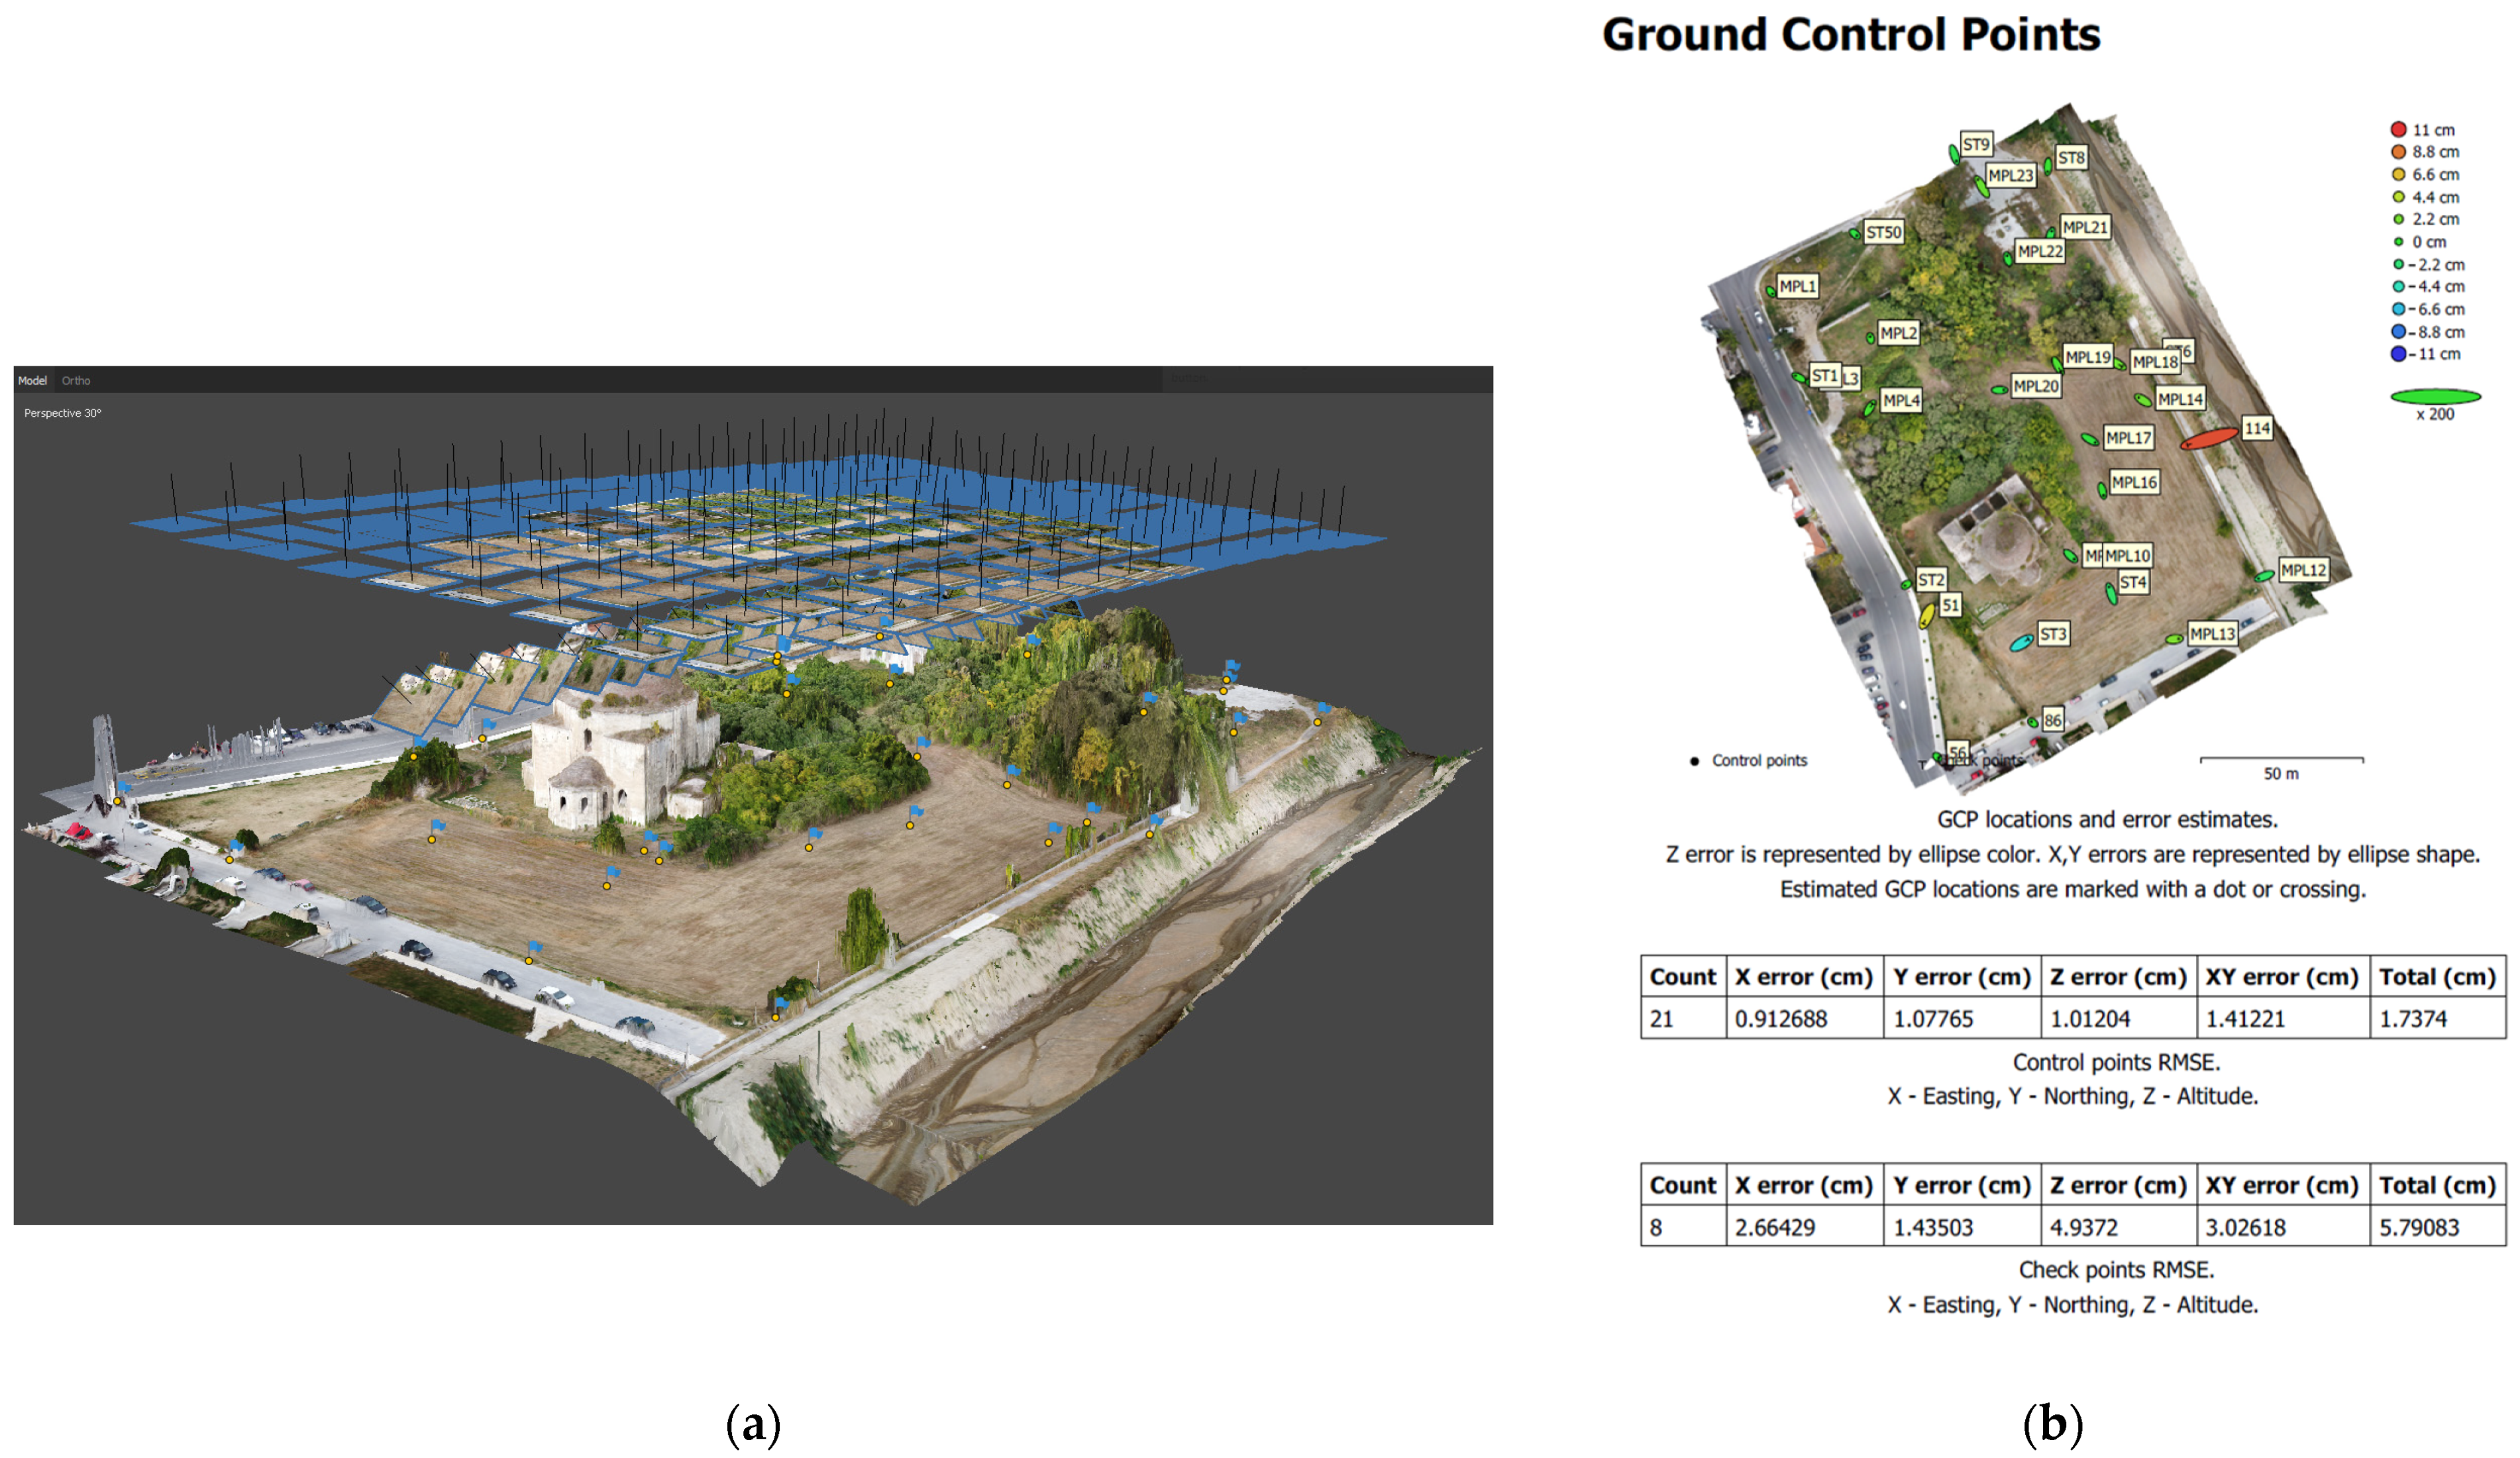
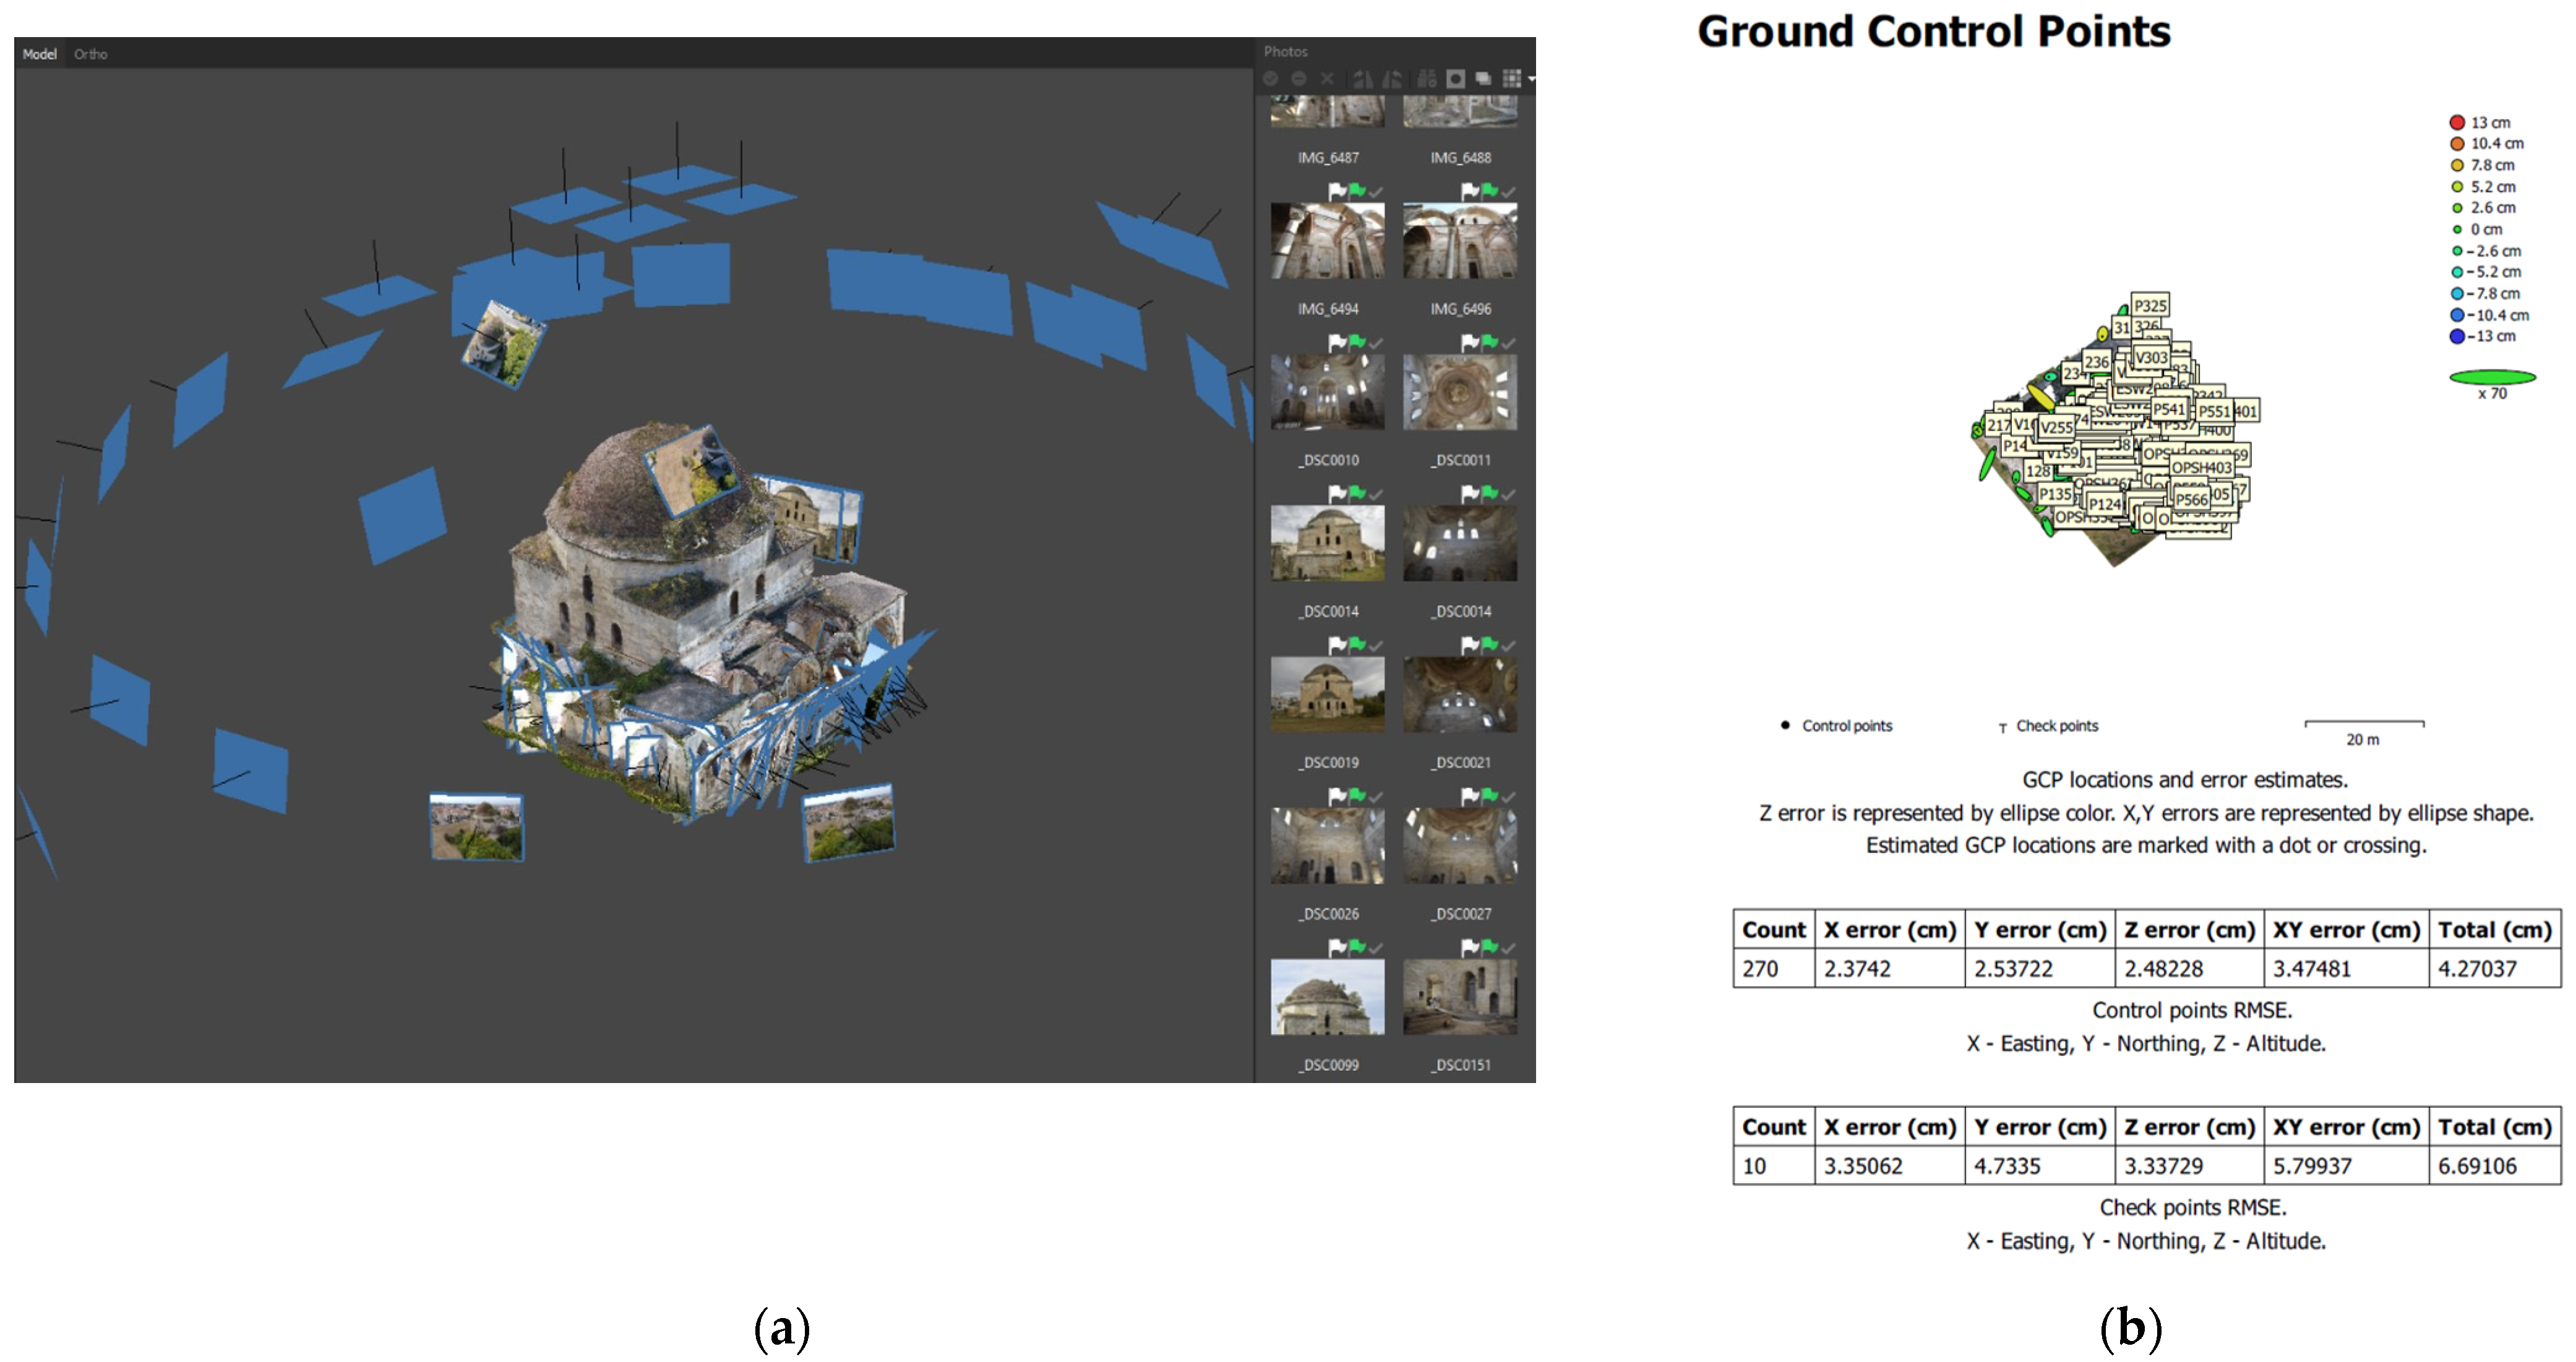
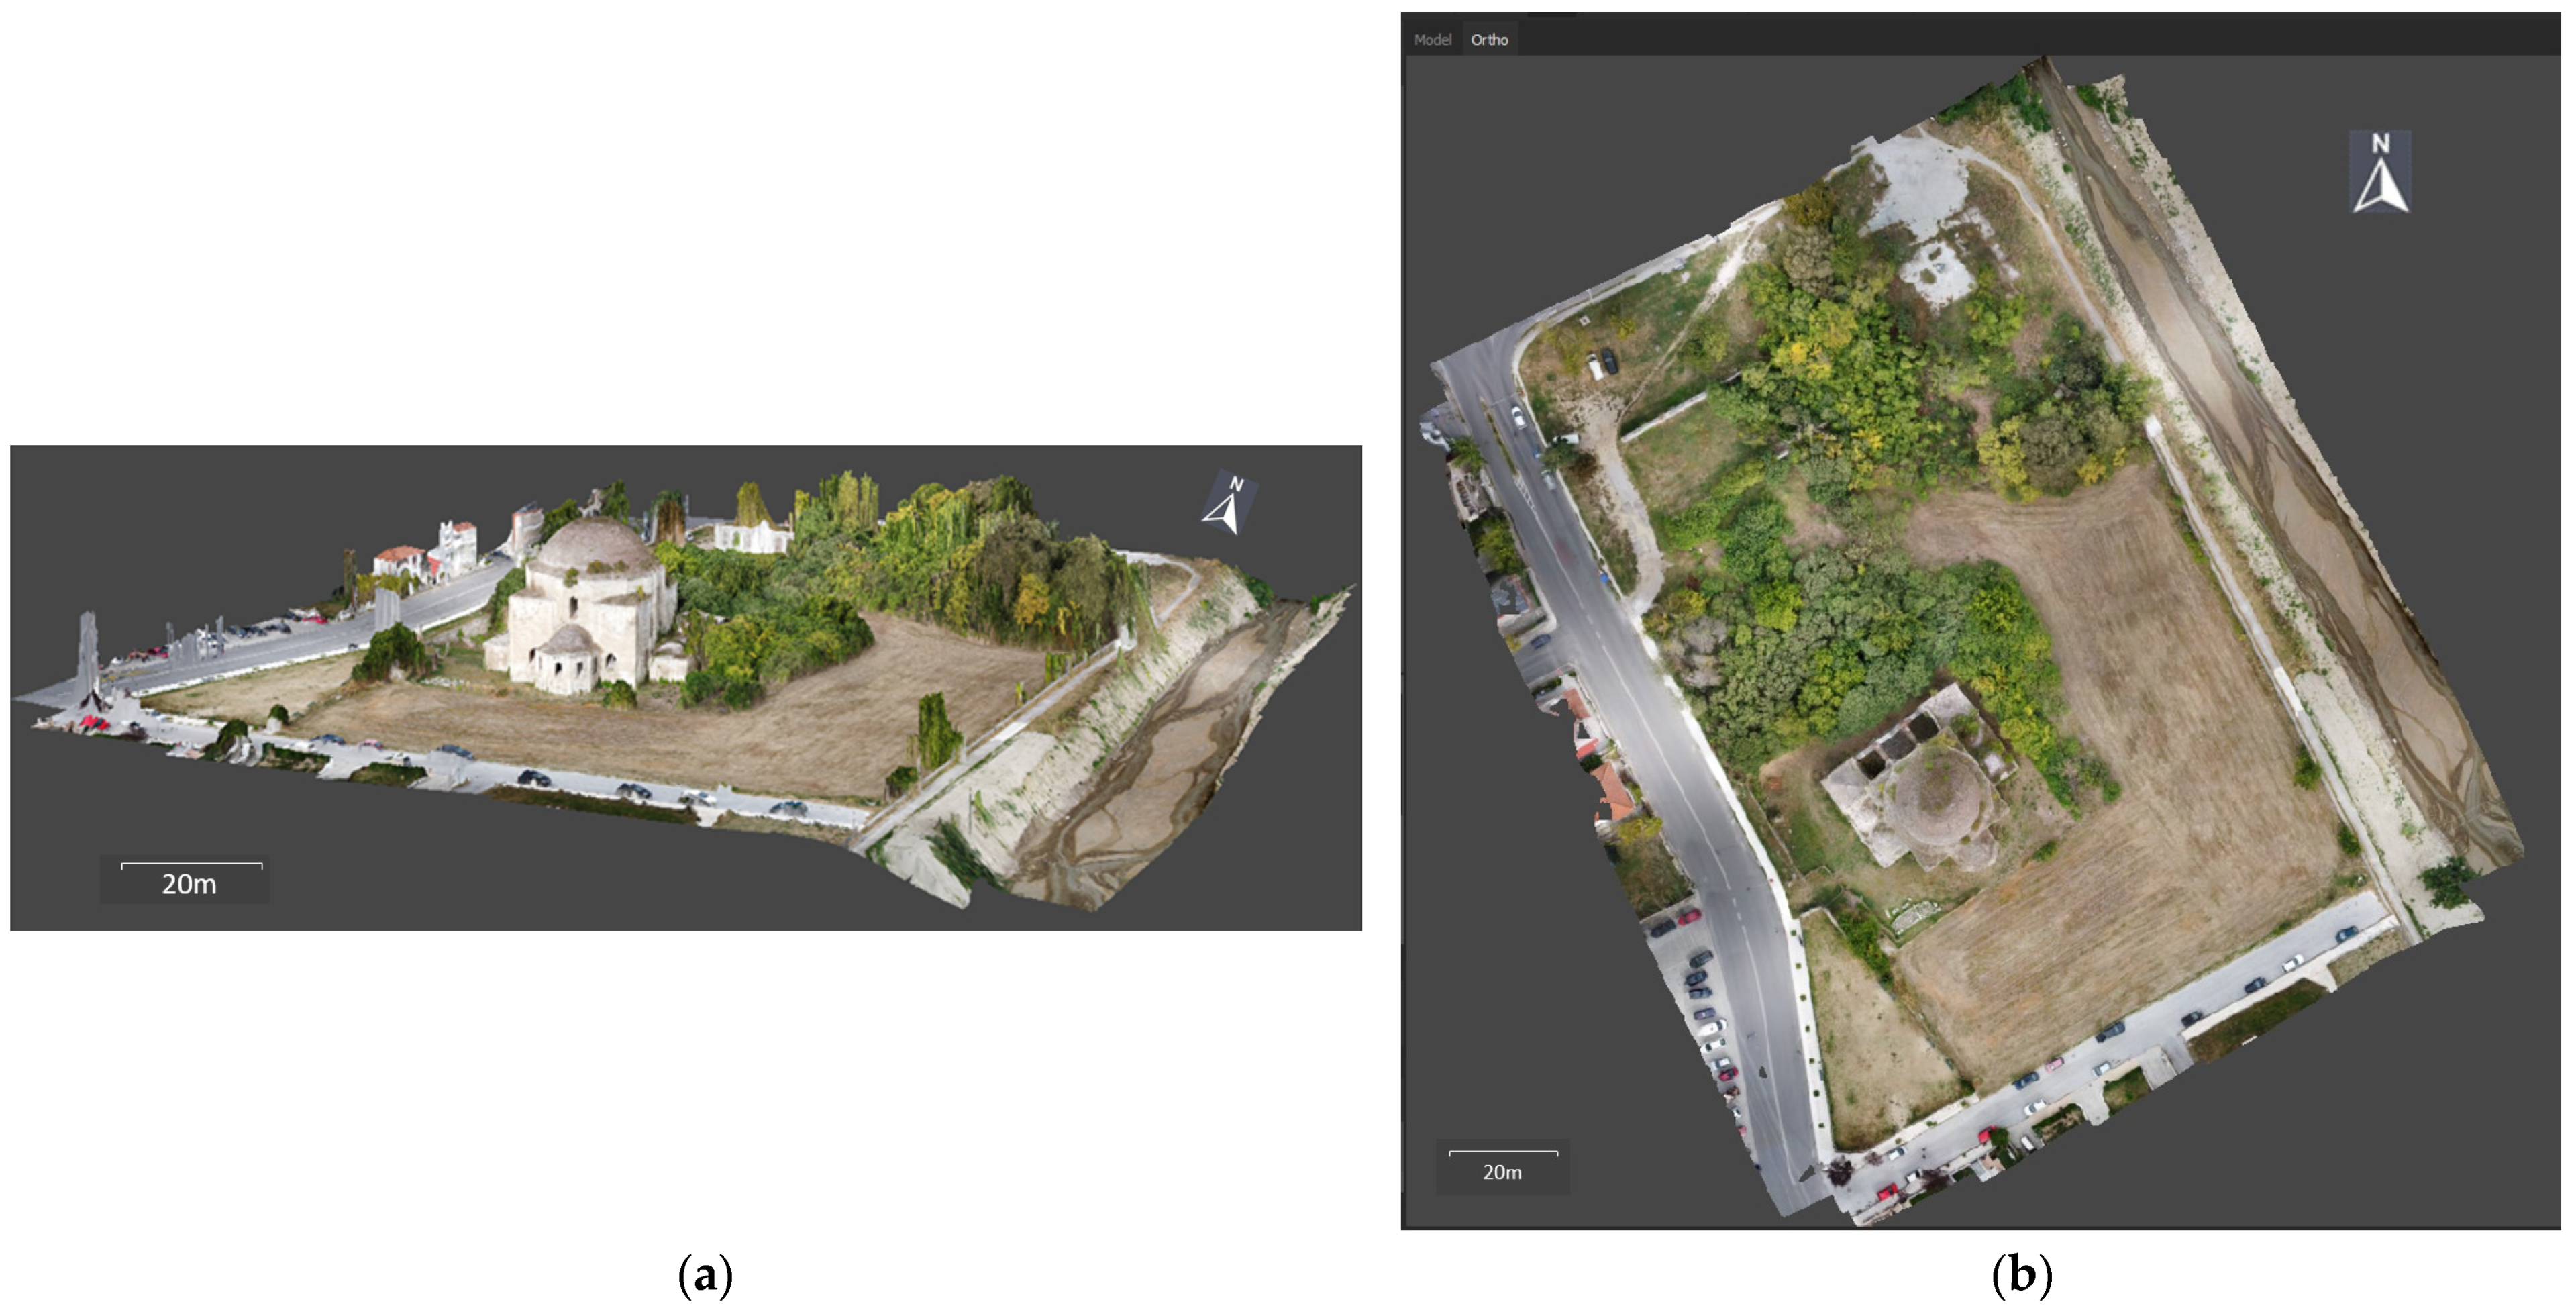
2.1.2. Aerial Photogrammetry
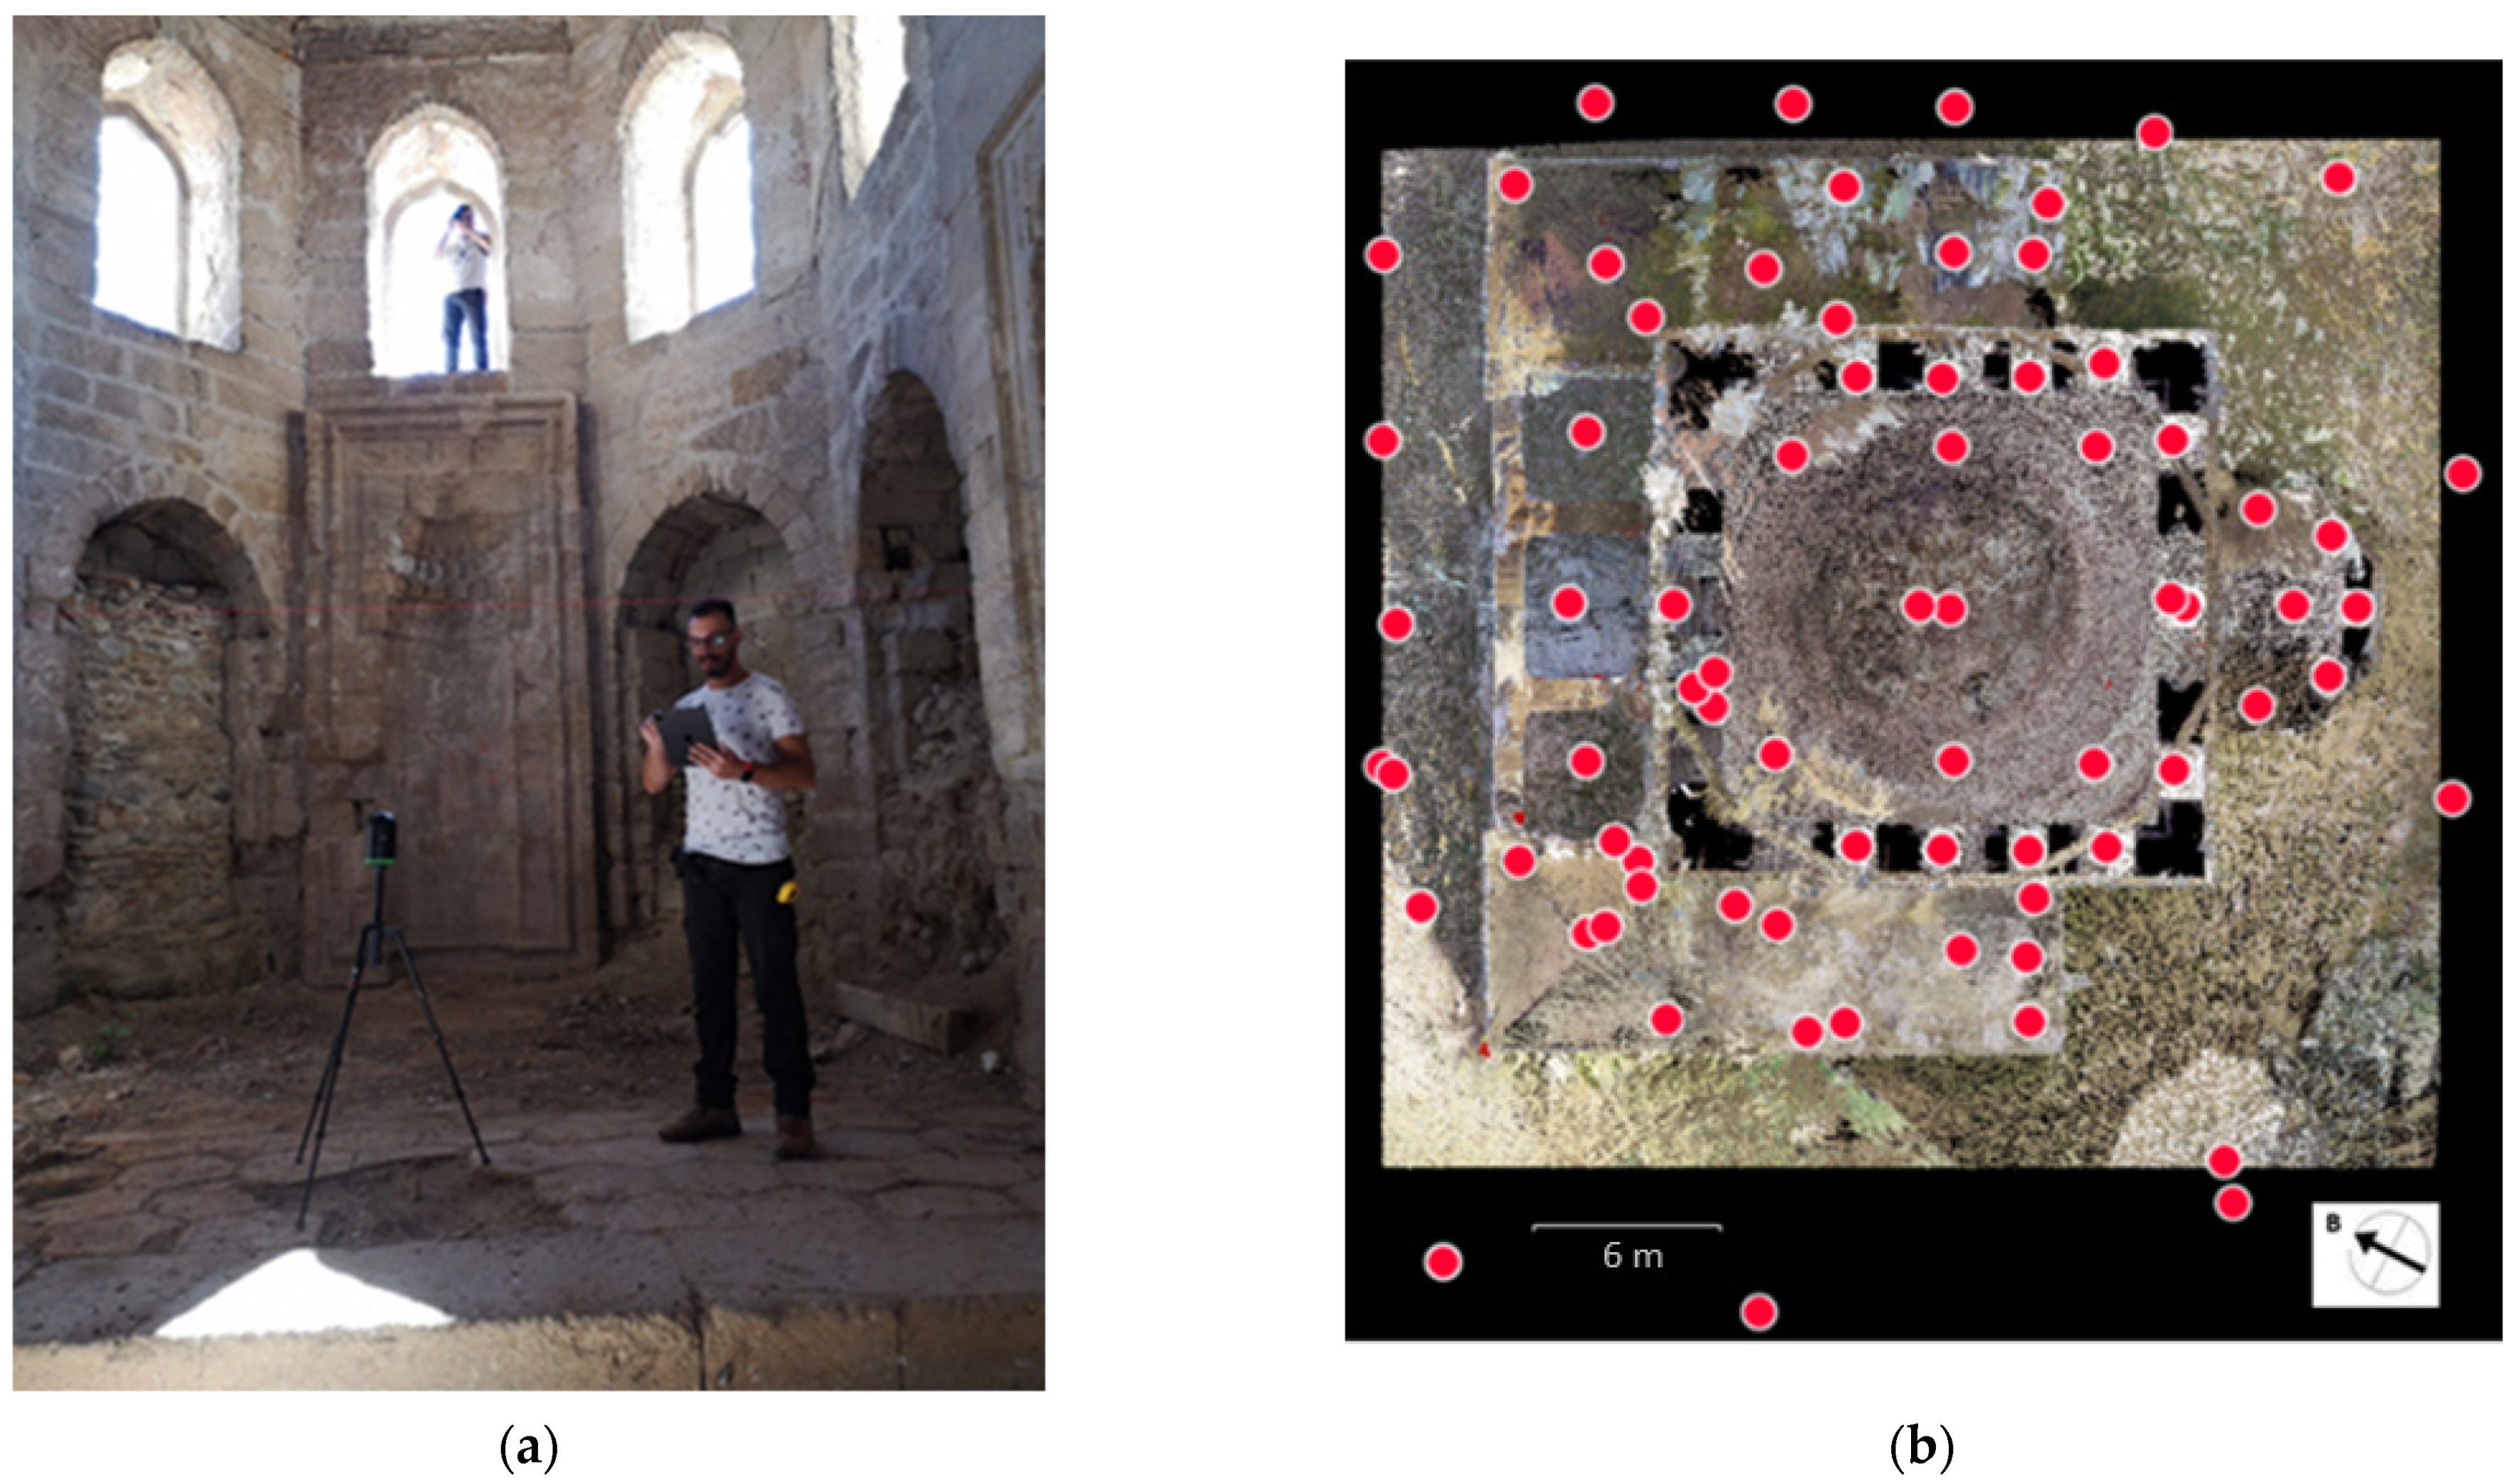
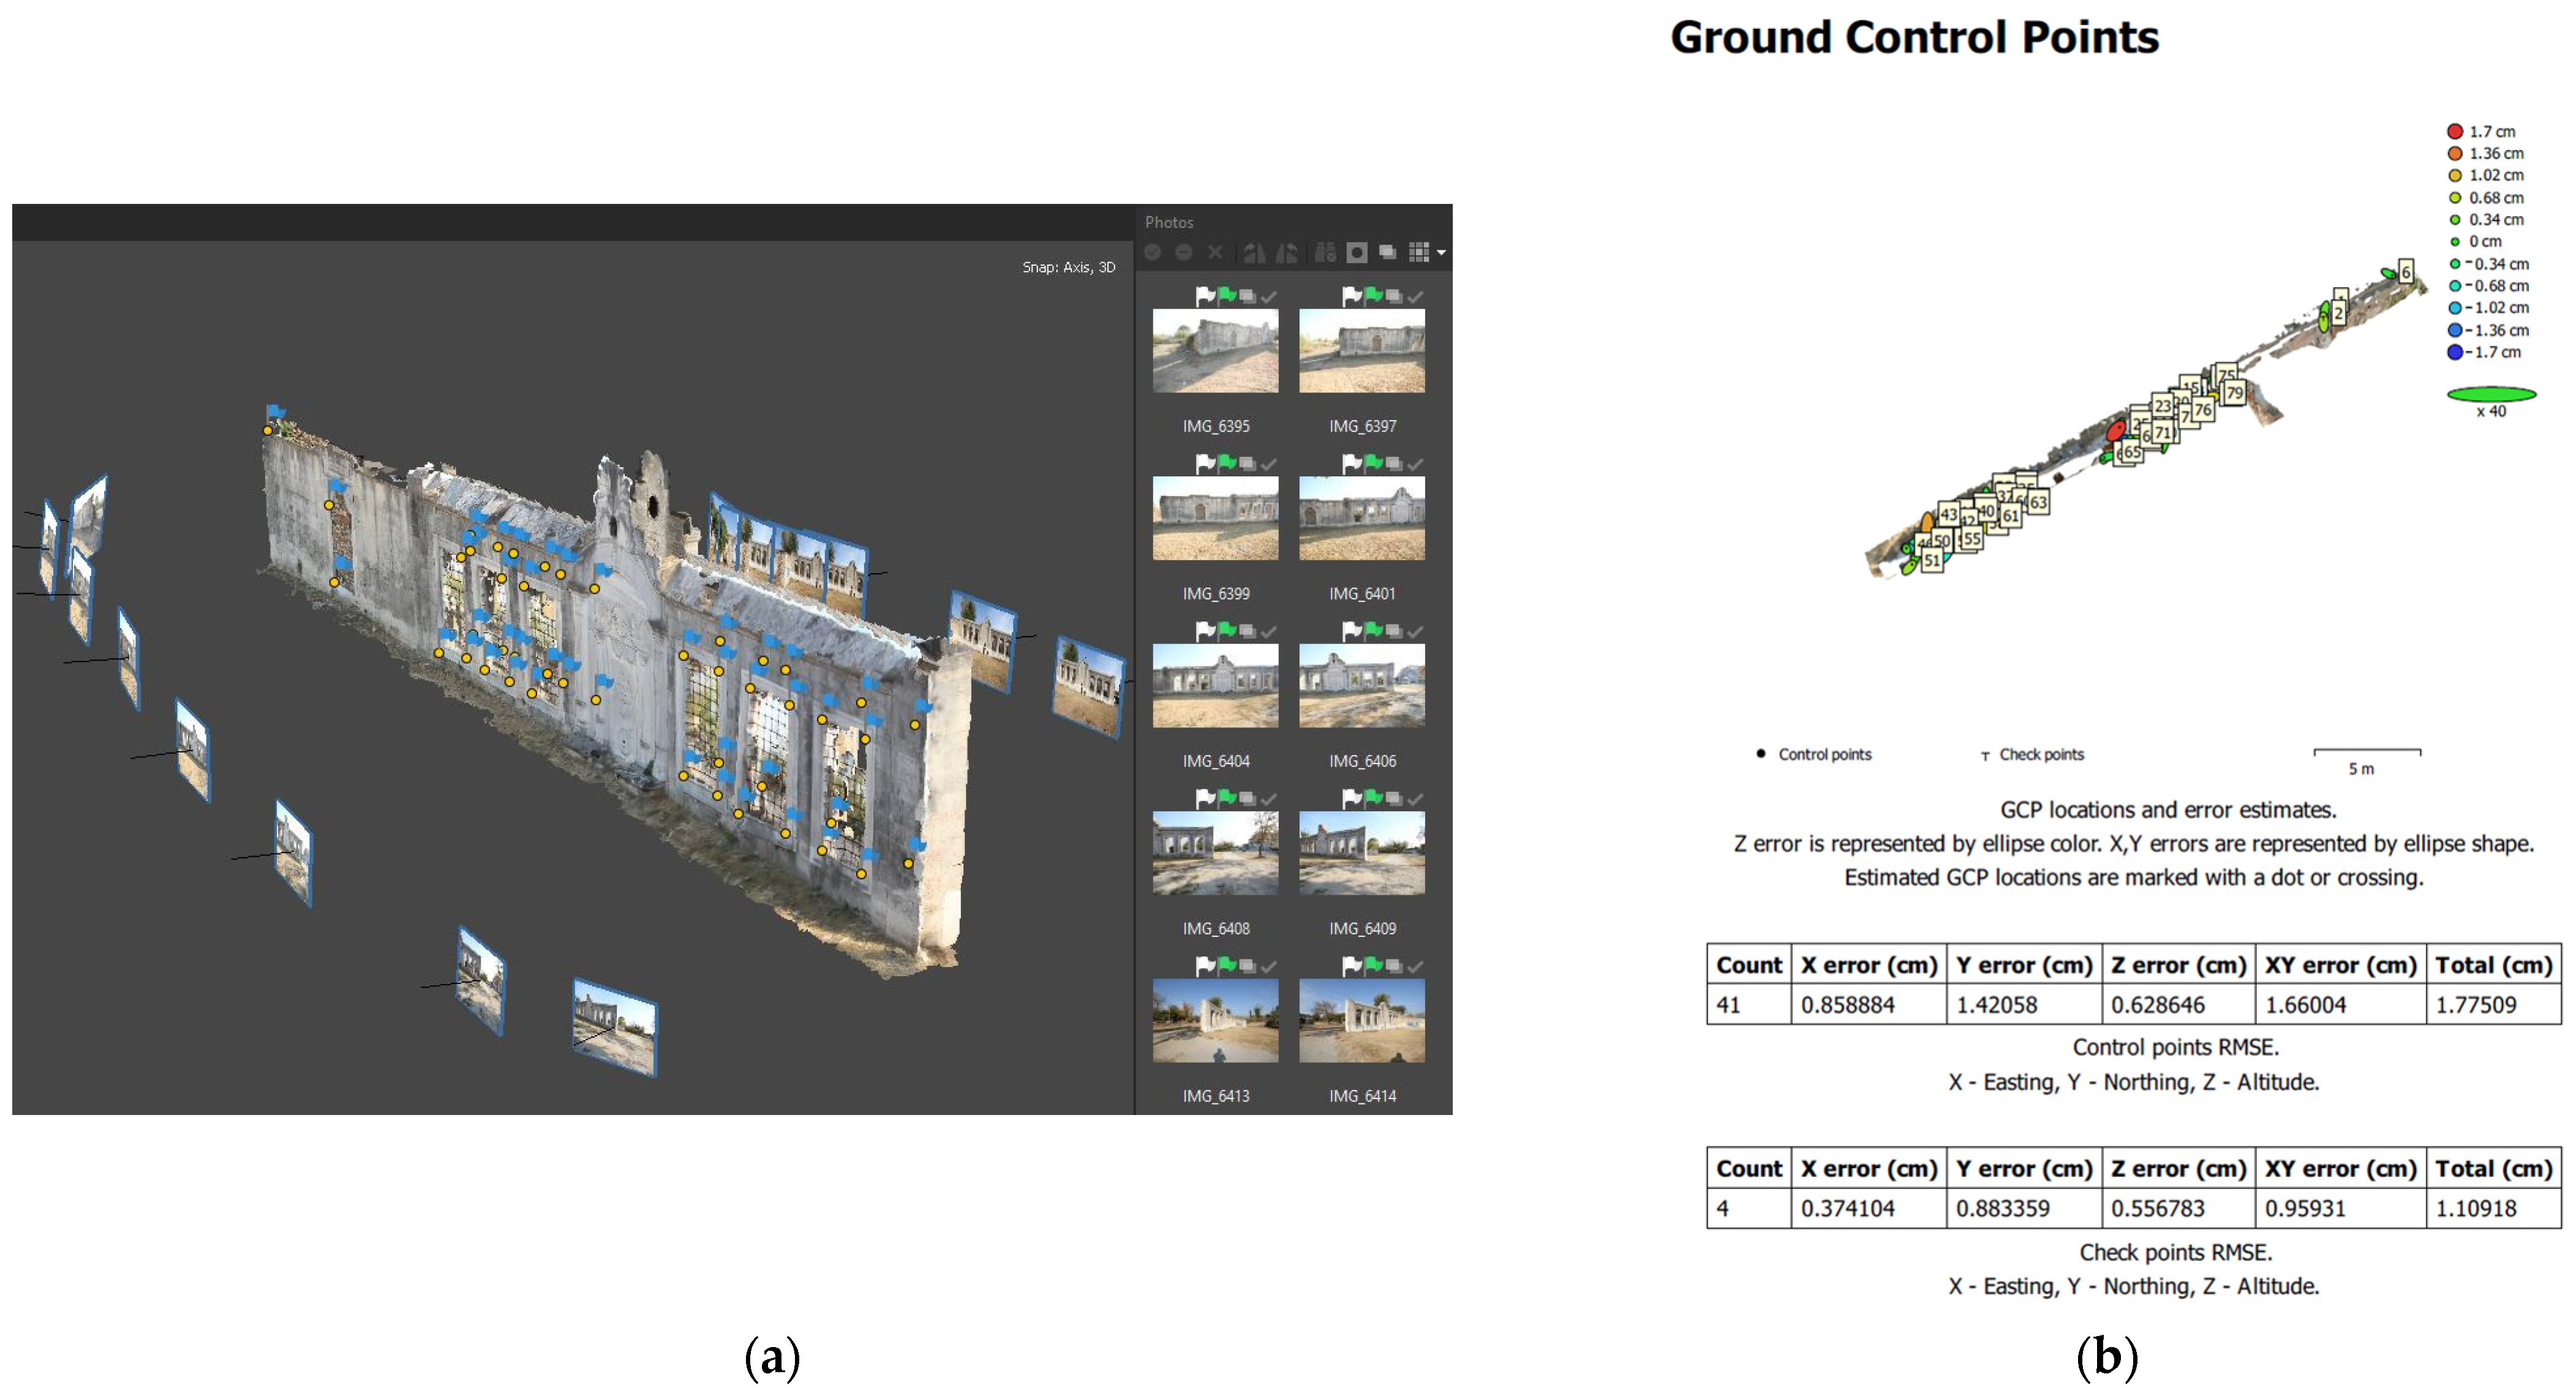
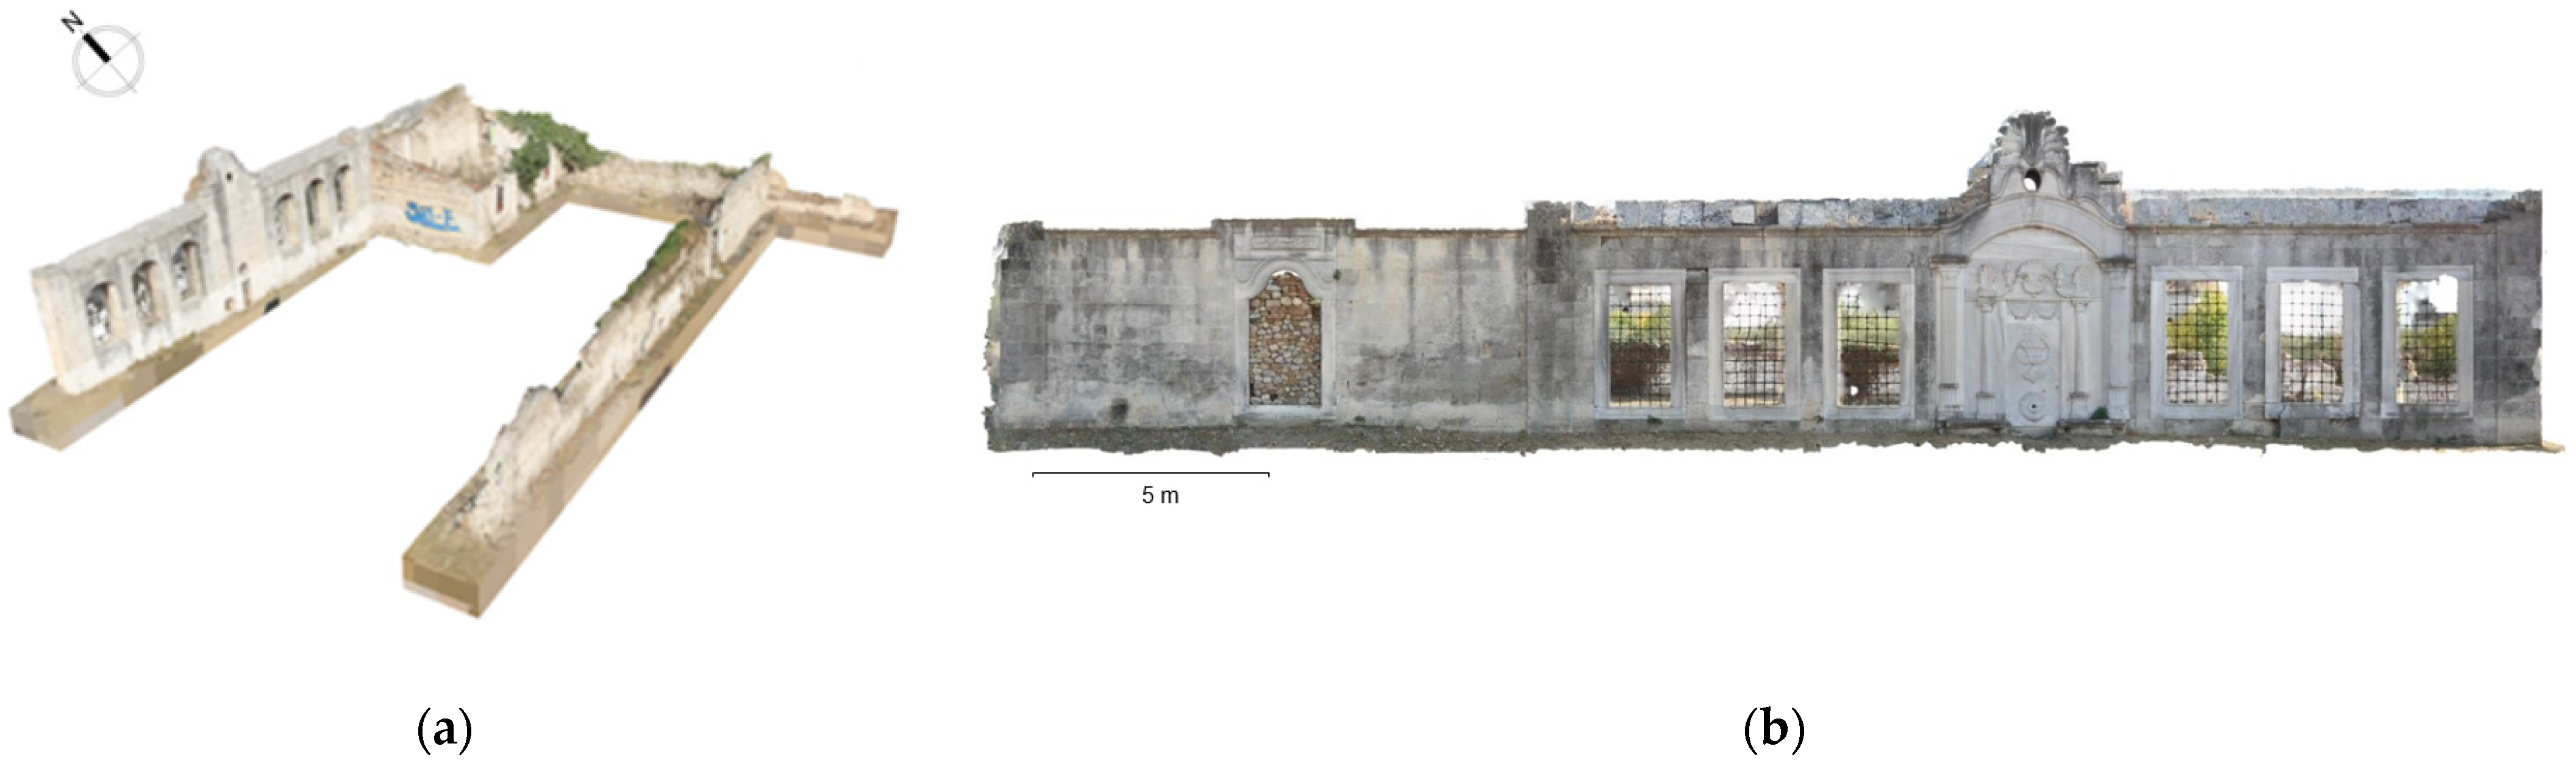
2.1.3. Terrestrial Photogrammetry

| Model Name | Canon EOS 7D DSLR Camera |
|---|---|
| Sensor | 18MP APS-C CMOS |
| Image Stabilization | None |
| Max Shutter Speed | 1/8000 s |
| Min Shutter Speed | 30 s |
| Continuous shooting | 8 frames per second |
| Form Factor | Mid-size SLR |
| AF system | 19 points |
| Wide-Angle Zoom Lens | Sigma 10–20 mm; F3.5; AF |
2.1.4. Terrestrial Laser Scanning (TLS)
- 15 MP 3-camera system, 150 MP full dome capture, HDR, LED flash, calibrated spherical image, 360° × 300°;
- Longwave infrared camera, thermal panoramic image, 360° × 70°;
- Range: 0.6 to 60 m;
- Point measurement rate up to 360,000 pts/s;
- 3D point accuracy 6 mm at 10 m/8 mm at 20 m;
- Designed for indoor and outdoor use.
2.2. Data Processing
2.2.1. Land Surveying Data
- Xi, Yi, Hi: horizontal coordinates and elevation of the target point;
- Xο, Yο, Hο: horizontal coordinates and elevation of the traverse station;
- Di: the slope distance between the target point and the mechanical center of the geodetic station;
- Zi: the zenith angle;
- Goi: the direction angle;
- Hj: the height of the mechanical center of the geodetic station from the traverse station;
- Hτ: the target height.
2.2.2. Photogrammetric Data
- Feature detection and matching;
- Triangulation;
- Dense point cloud generation;
- Surface/mesh generation;
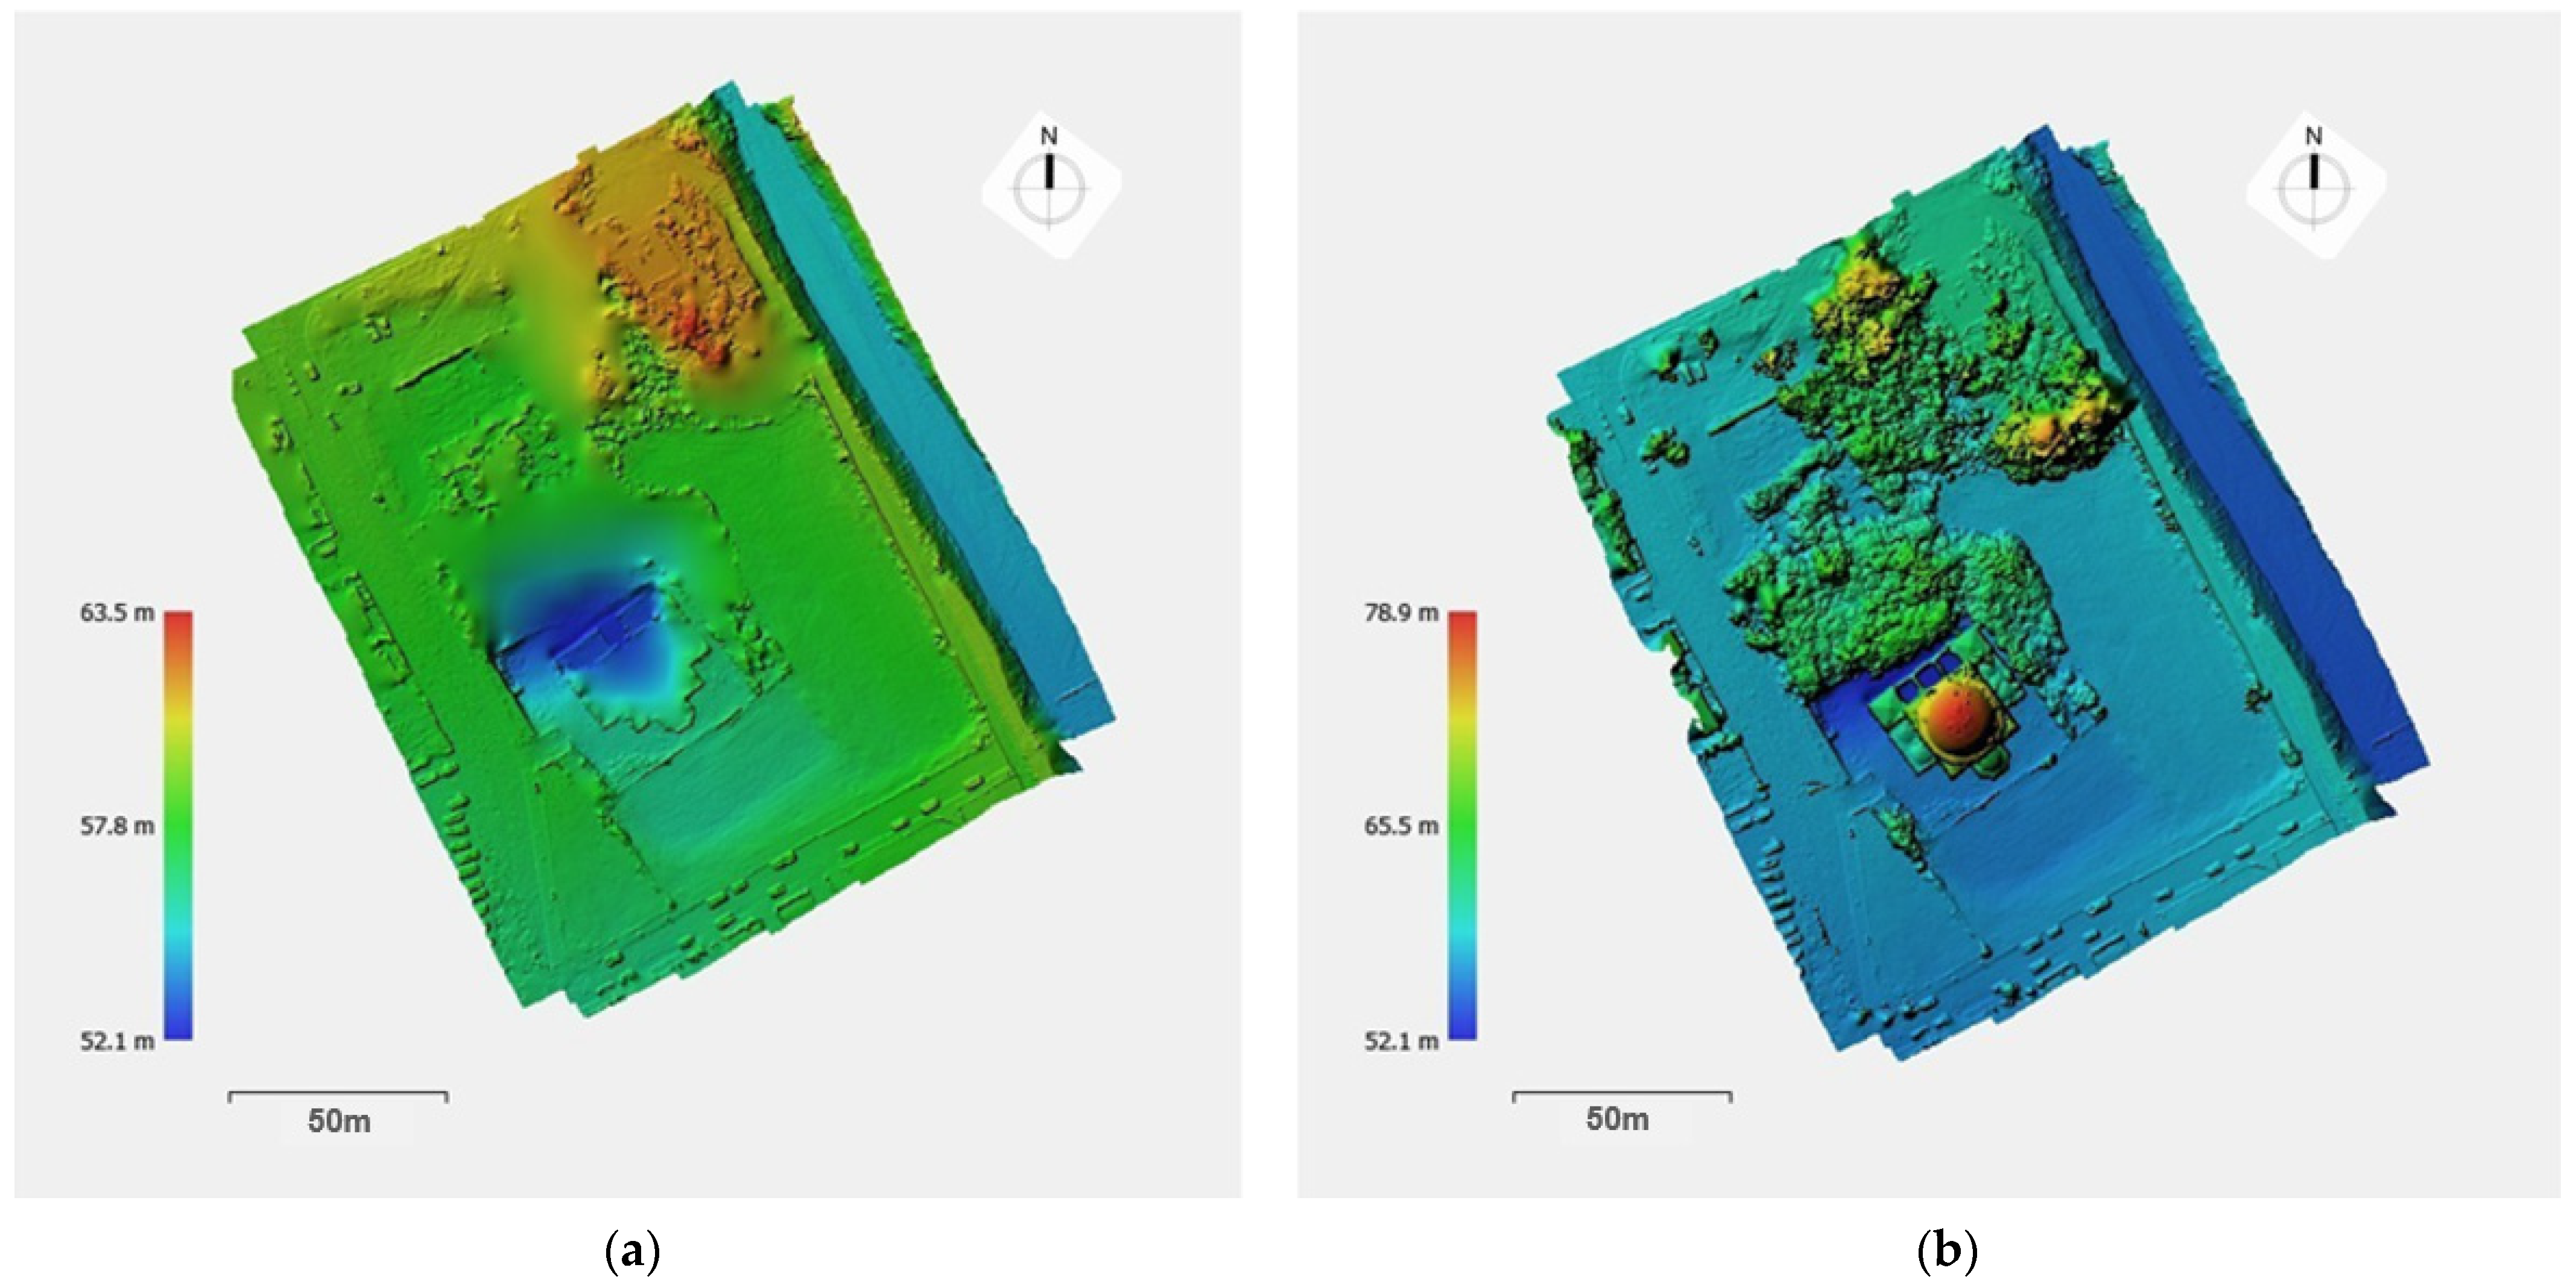
- DSM and orthophoto generation.
2.2.3. TLS/Photogrammetric Data Fusion
3. Results
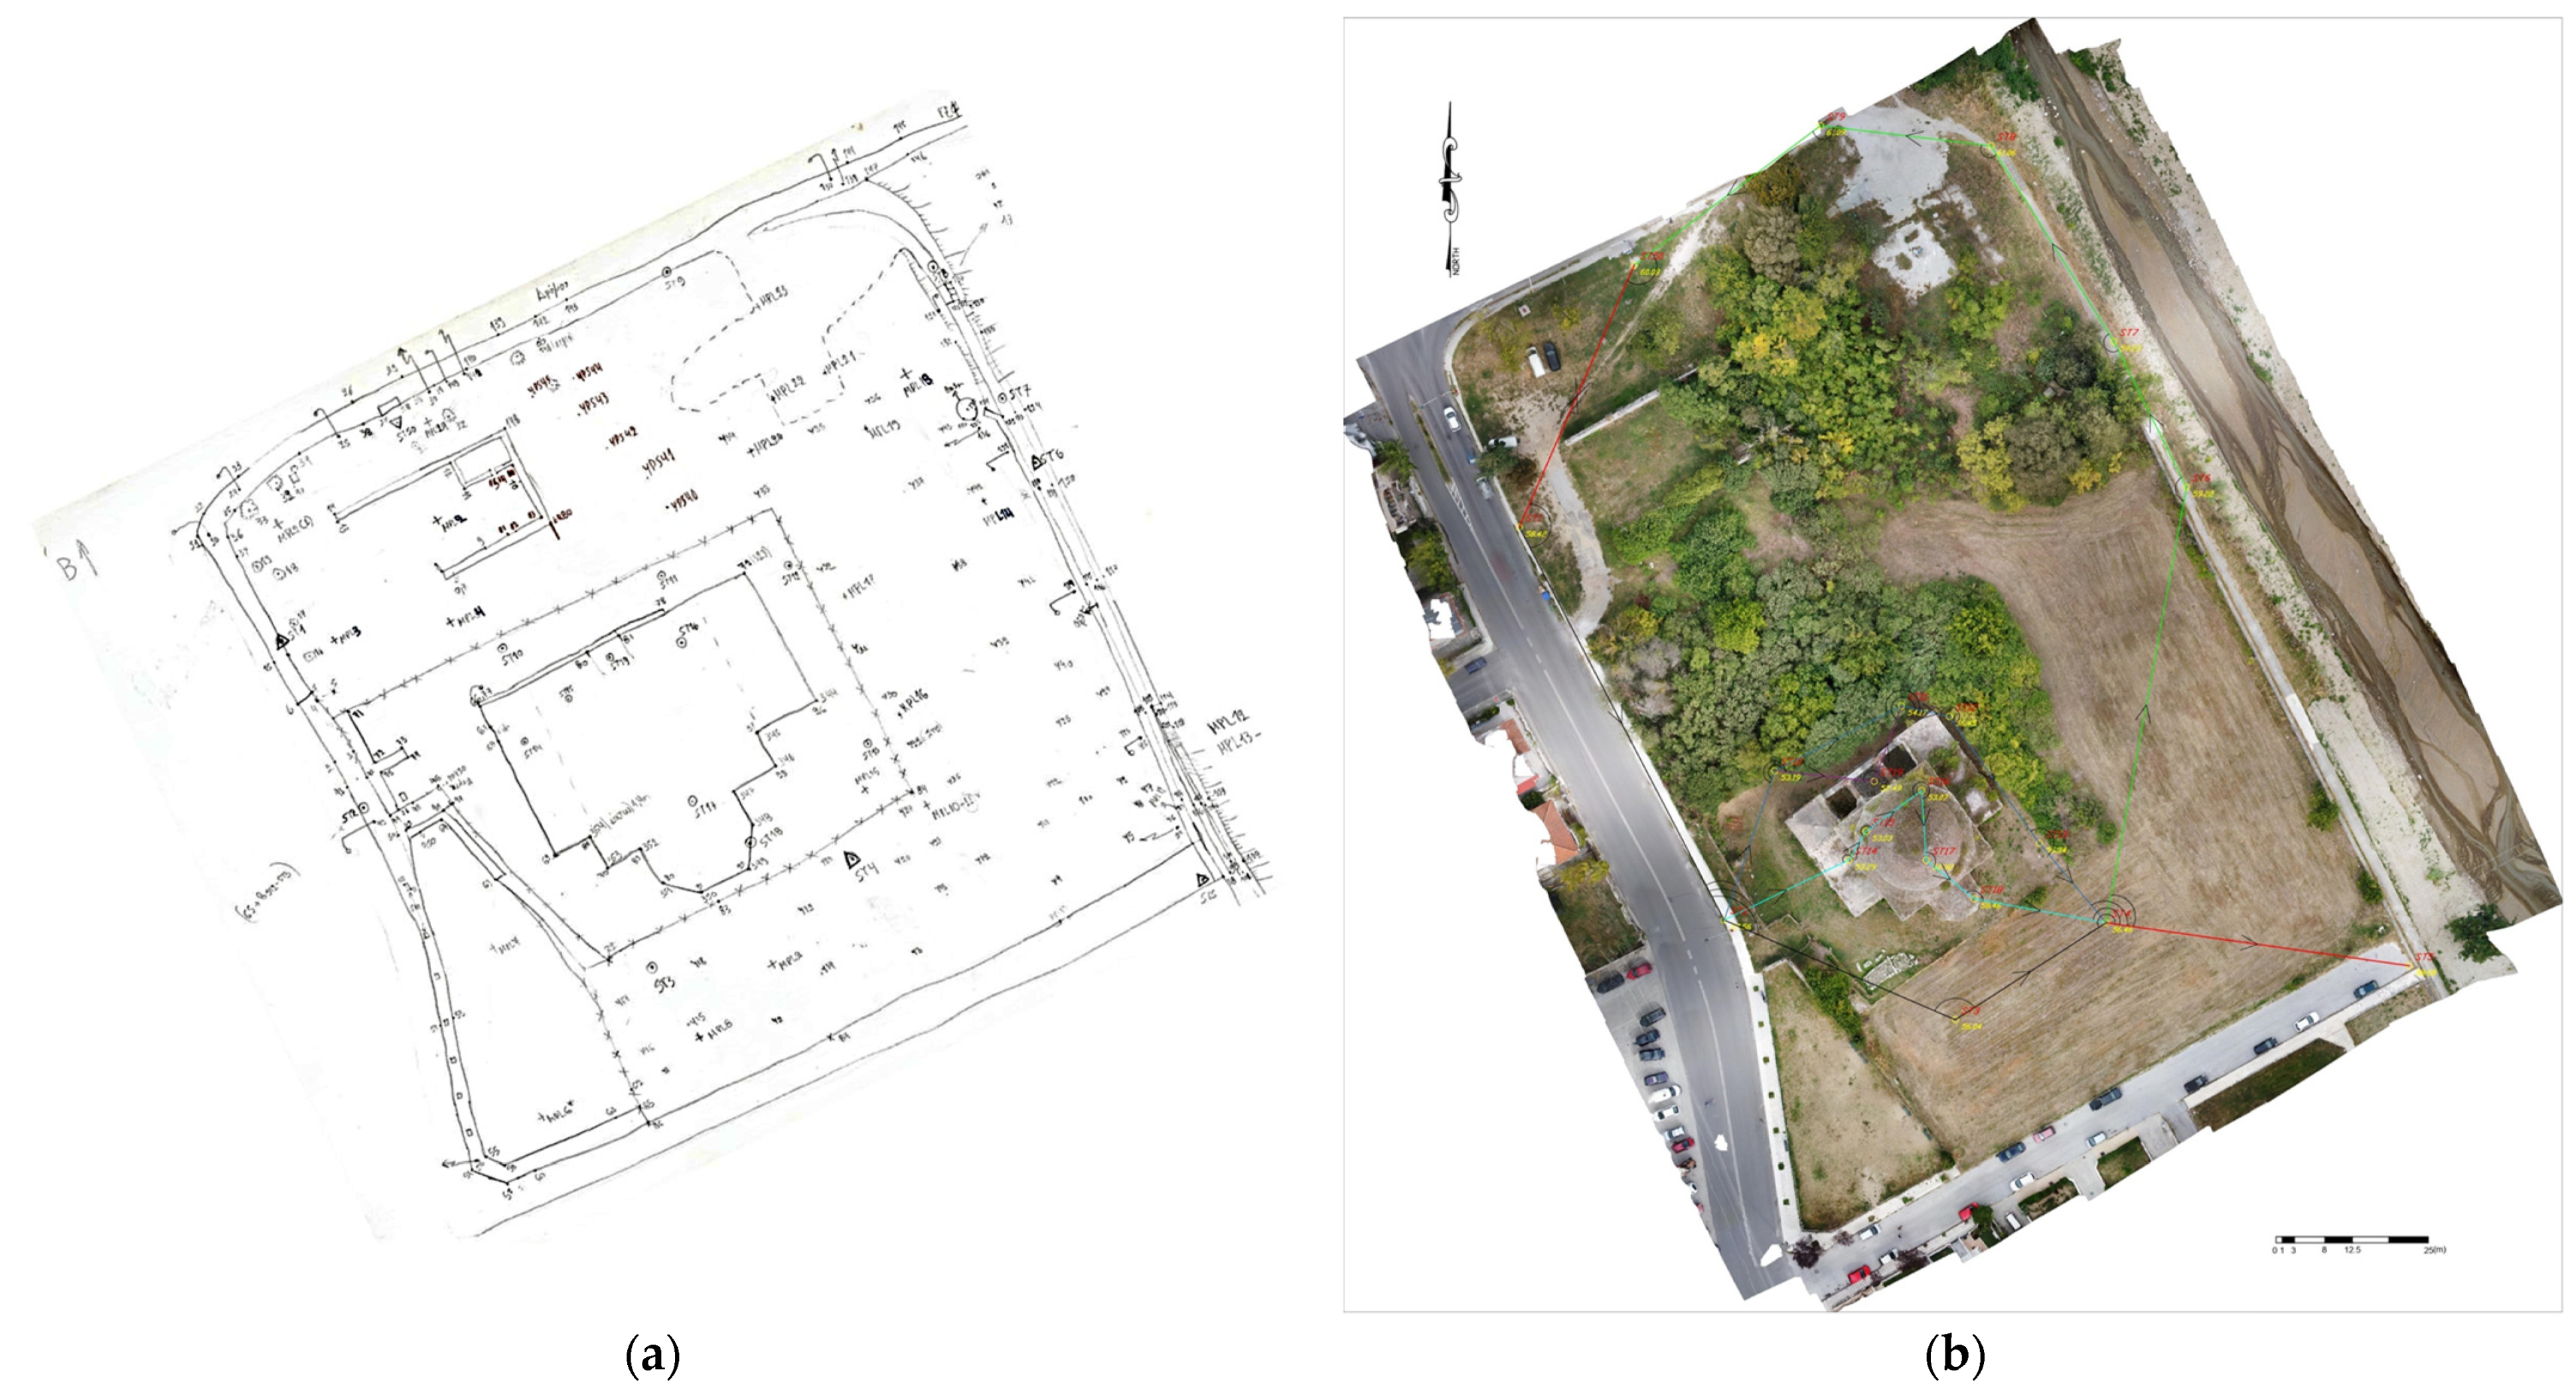
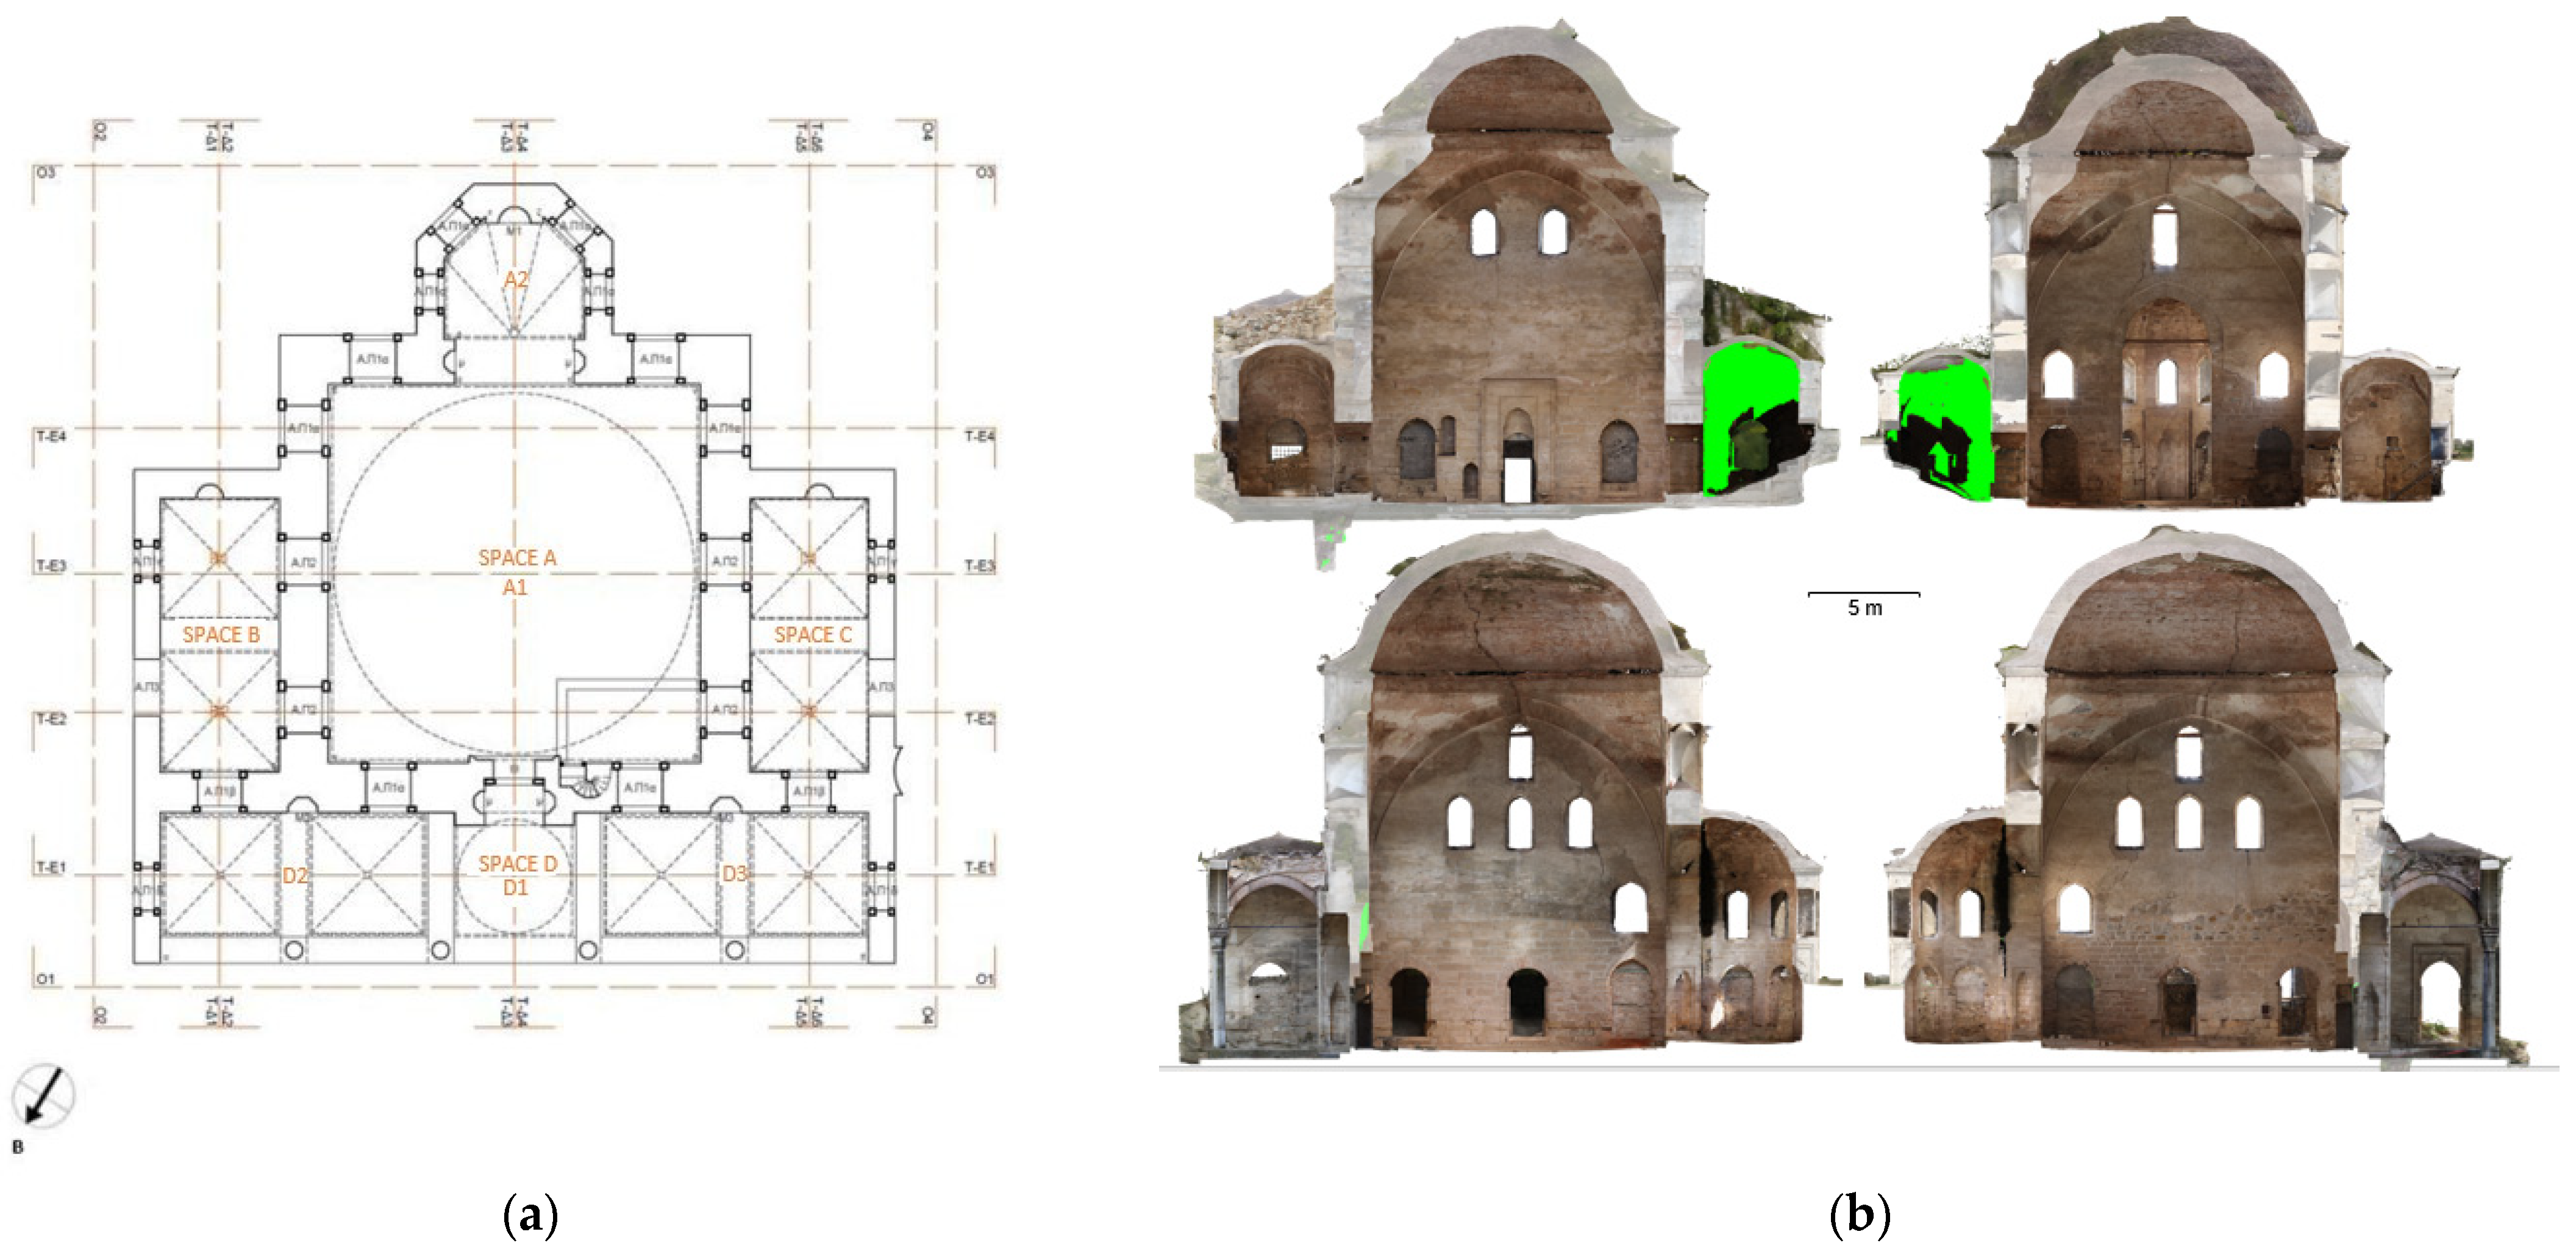
3.1. Survey Plan
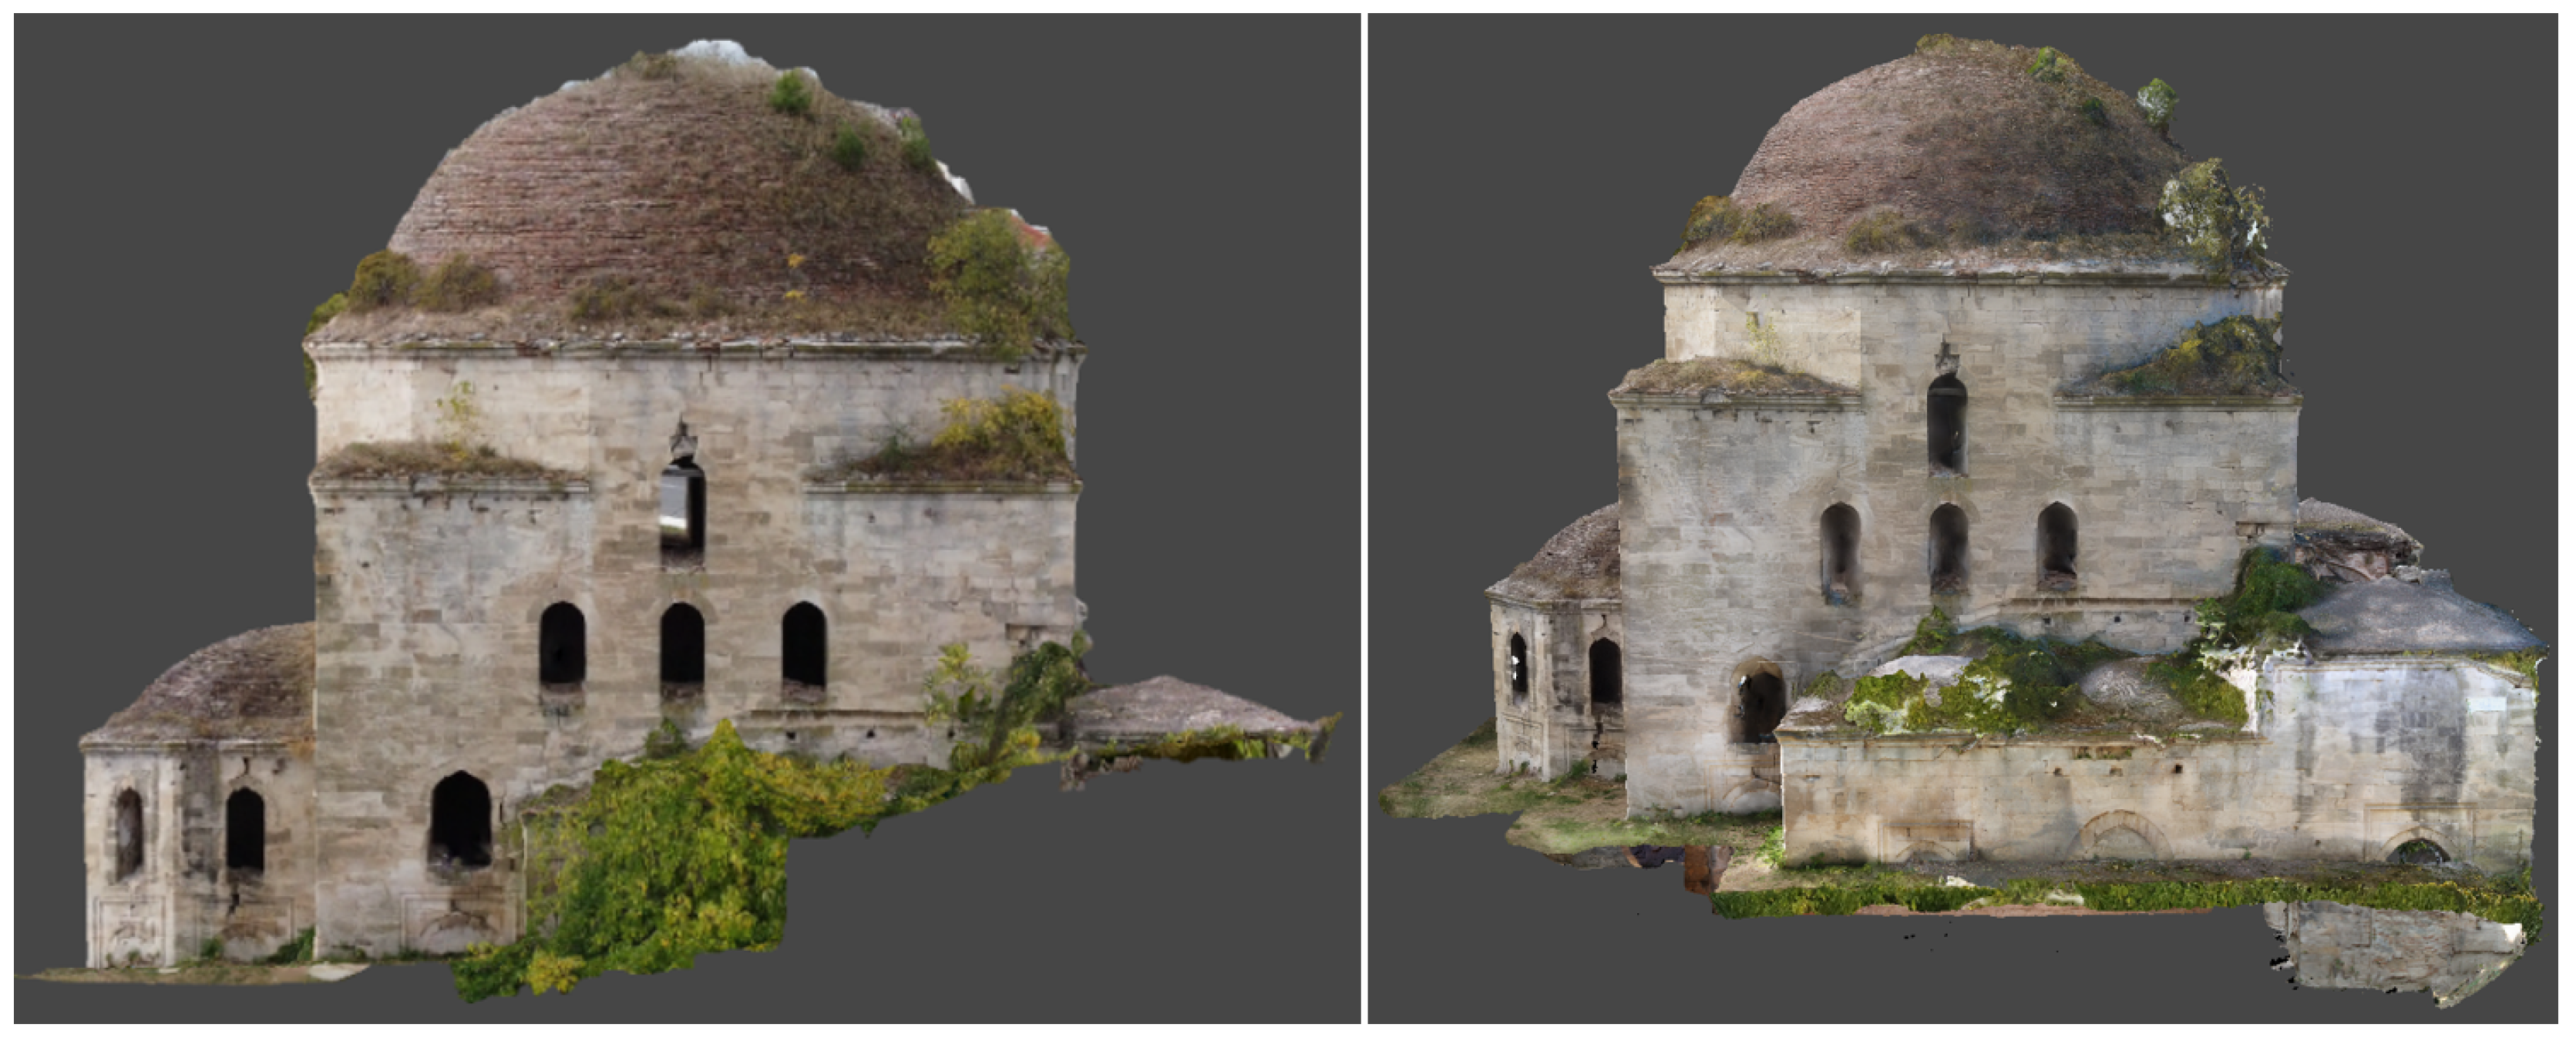
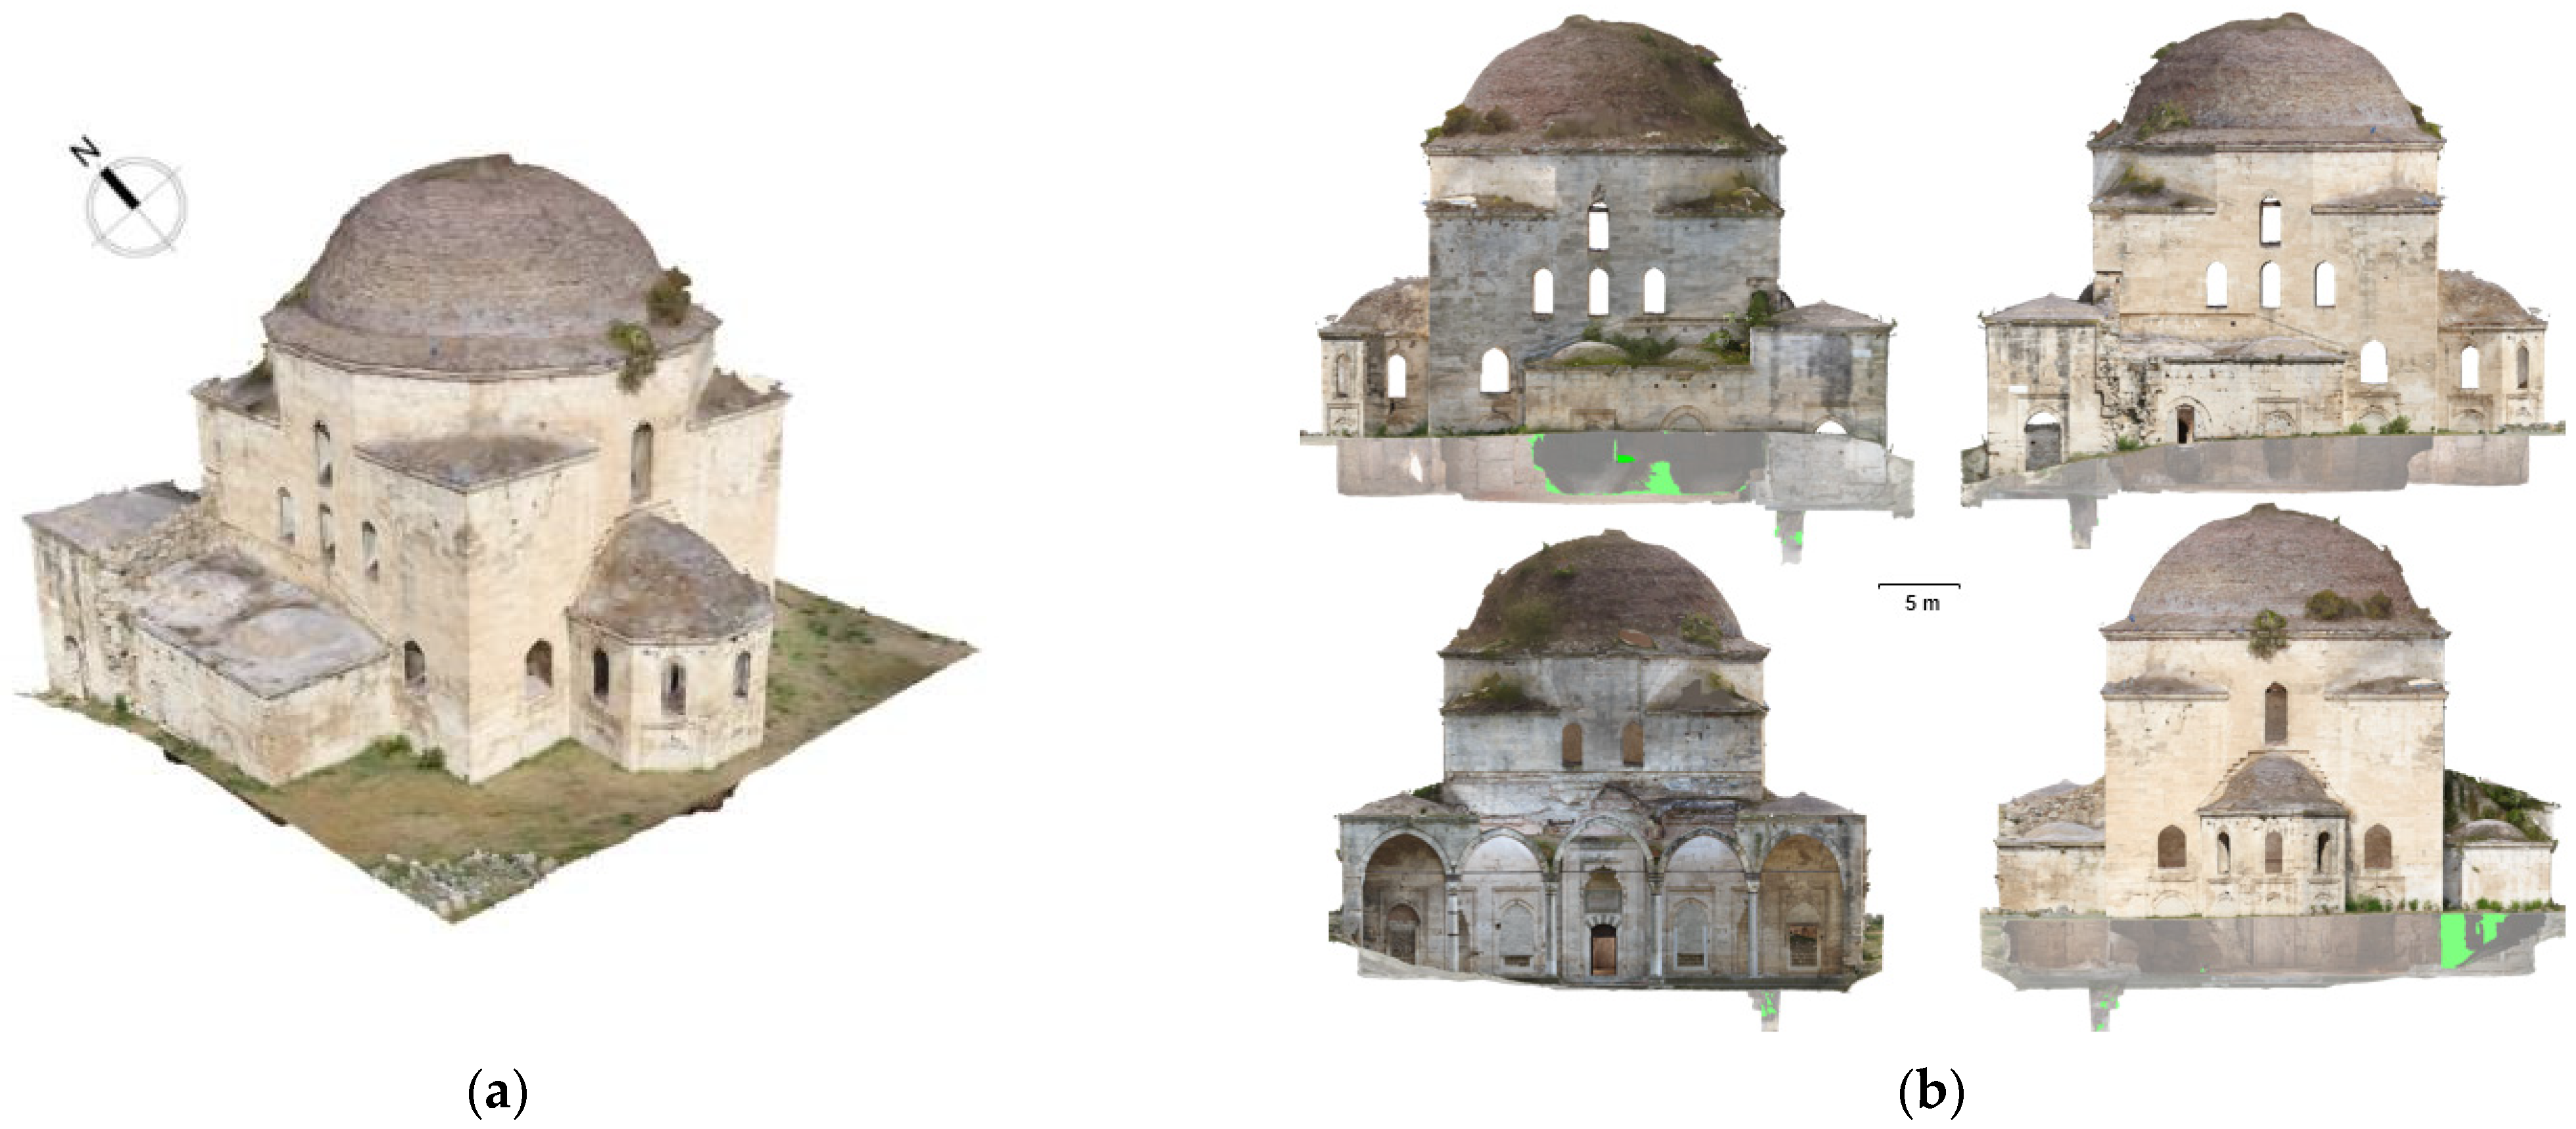
3.2. Photogrammetric Products
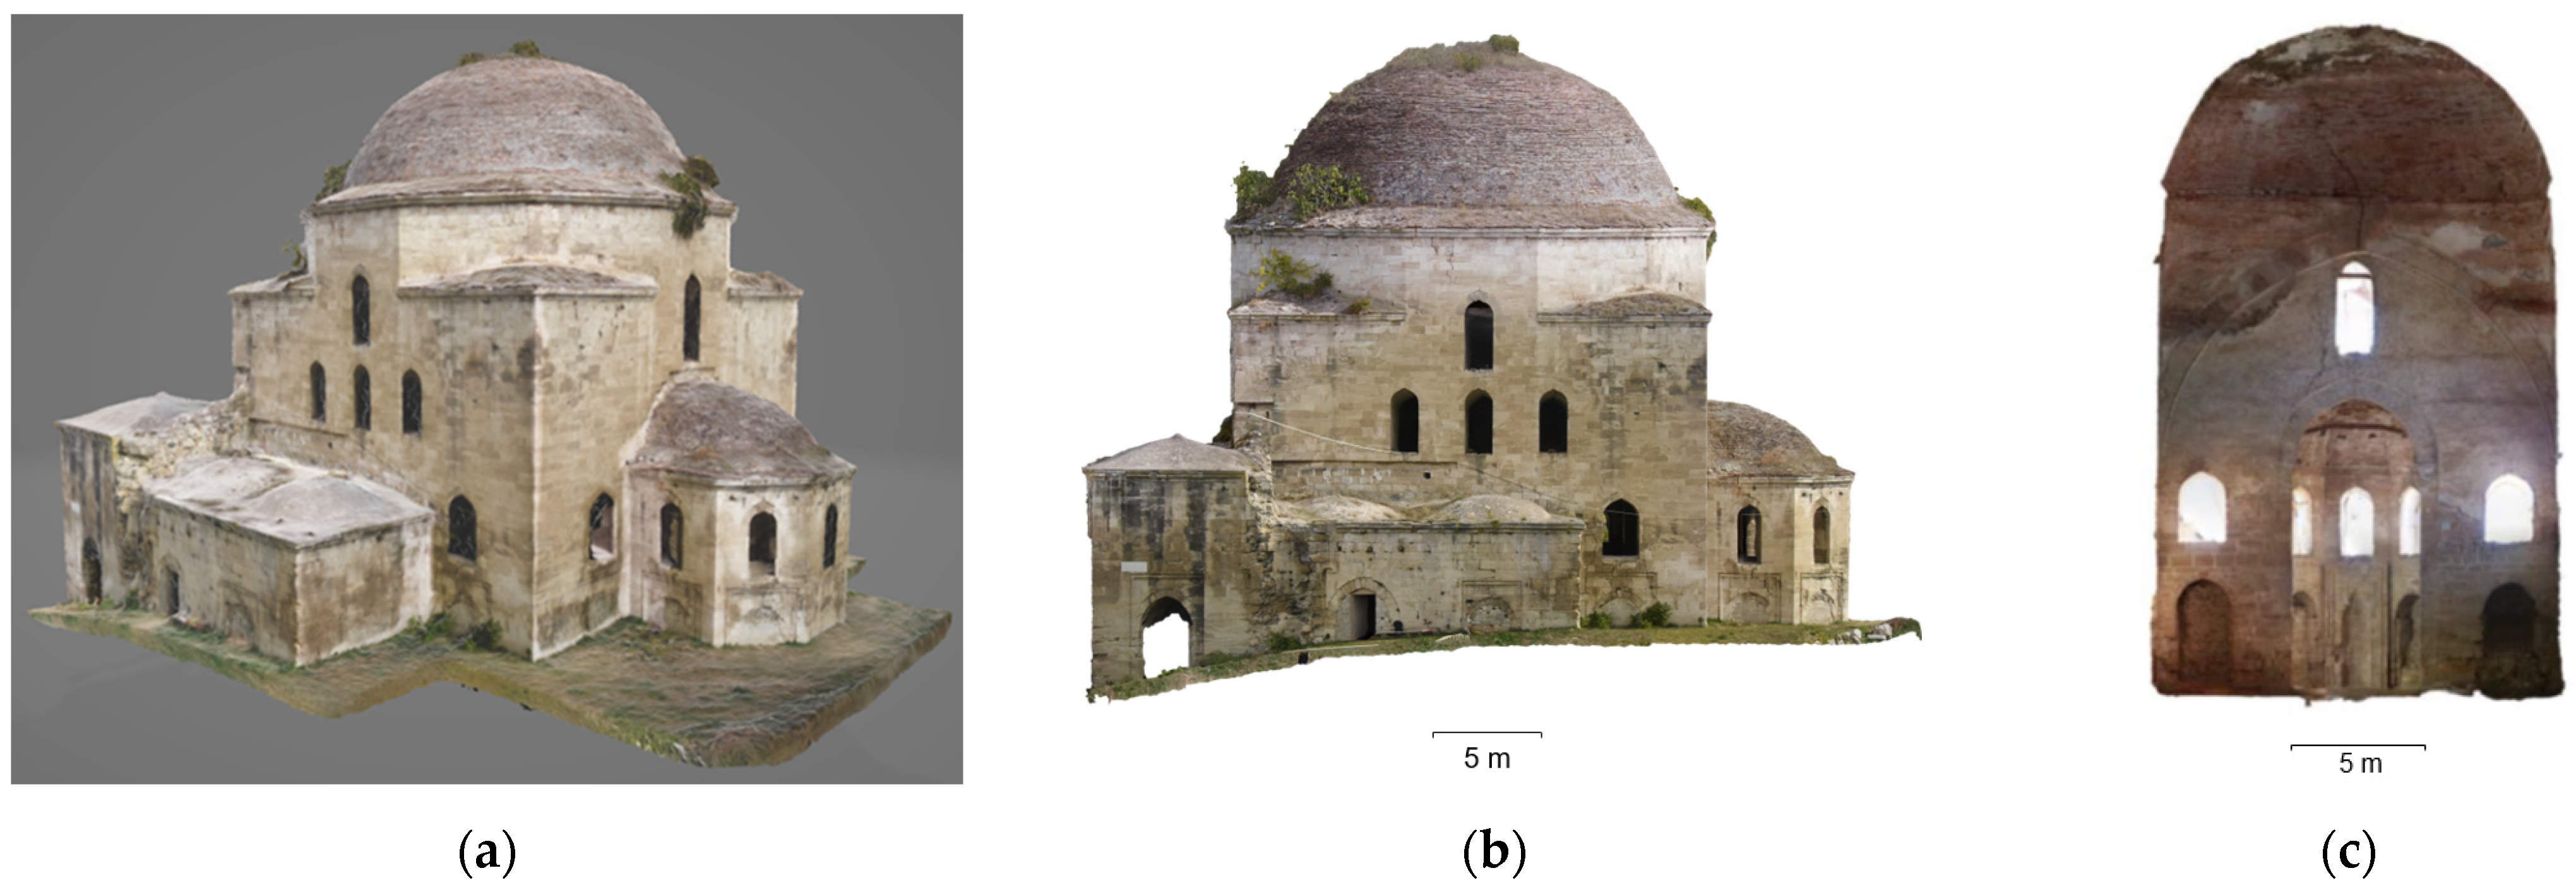
3.3. TLS/Photogrammetric Products
4. Accuracy Evaluation
5. Discussion
6. Conclusions
Author Contributions
Funding
Institutional Review Board Statement
Informed Consent Statement
Data Availability Statement
Acknowledgments
Conflicts of Interest
References
- Moysiadis, A. The importance of Geometric Documentation through Technological Geospatial Approaches to the Conservation of Cultural Heritage. In Proceedings of the 18th ICOMOS General Assembly & Scientific Symposium, Florence, Italy, 9–14 November 2014. [Google Scholar]
- Maweheb, S.; Malek, S.; Faouzi, G. Geometric Invariance in Digital Imaging for the Preservation of Cultural Heritage in Tunisia. Digit. Appl. Archaeol. Cult. Herit. 2016, 3, 99–107. [Google Scholar] [CrossRef]
- Stylianidis, E.; Evangelidis, K.; Vital, R.; Dafiotis, P.; Sylaiou, S. 3D Documentation and Visualization of Cultural Heritage Buildings through the Application of Geospatial Technologies. Heritage 2022, 5, 2818–2832. [Google Scholar] [CrossRef]
- Salonia, P.; Bellucci, V.; Scolastico, S.; Marcolongo, A.; Leti Messina, T. 3D Survey Technologies for Reconstruction, Analysis and Diagnosis in the Conservation Process of Cultural Heritage. In Proceedings of the XXI International CIPA Symposium, Athens, Greece, 1–6 October 2007. [Google Scholar]
- Tapinaki, S.; Skamantzari, M.; Anastasiou, A.; Koutros, S.; Syrokou, E.; Georgopoulos, A. 3D Holistic Documentation of Heritage Monuments in Rhodes. In Proceedings of the 28th CIPA Symposium “Great Learning & Digital Emotion”, Beijing, China, 28 August–1 September 2021. [Google Scholar]
- Tapinaki, S.; Skamantzari, M.; Chliverou, R.; Evgenikou, V.; Konidi, A.M.; Ioannatou, E.; Mylonas, A.; Georgopoulos, A. 3D Image Based Geometric Documentation of a Medieval Fortress. In Proceedings of the 8th Intl. Workshop 3D-ARCH “3D Virtual Reconstruction and Visualization of Complex Architectures”, Bergamo, Italy, 6–8 February 2019. [Google Scholar]
- Ioannidis, C.; Georgopoulos, A. Innovative Techniques for the Acquisition and Processing of Multisource Data for the Geometric Documentation of Monuments. Int. J. Archit. Comput. 2007, 5, 179–197. [Google Scholar] [CrossRef]
- Remondino, F.; El-Hakim, S. Image-Based 3D Modelling: A Review. Photogramm. Rec. 2006, 21, 269–291. [Google Scholar] [CrossRef]
- Georgopoulos, A. Data Acquisition for the Geometric Documentation of Cultural Heritage. In Mixed Reality and Gamification for Cultural Heritage; Ioannides, M., Magnenat-Thalmann, N., Papagiannakis, G., Eds.; Springer: Cham, Switzerland, 2017; pp. 29–73. [Google Scholar]
- Markiewicz, J.; Zawieska, D.; Bujakiewicz, A. Integration of Heterogeneous Photogrammetry Data for Visualization of Cultural Heritage Objects. Tech. Sci. 2015, 18, 37–48. [Google Scholar]
- Katsoulis, G. Object—Dimensional Imprinting of the Byzantine Church of the Holy Apostles in Thessaloniki Using Laser Scanner. Master’s Thesis, Aristotle University of Thessaloniki, Thessaloniki, Greece, 2013. [Google Scholar]
- Hassan, A.T.; Fritsch, D. Integration of Laser Scanning and Photogrammetry in 3D/4D Cultural Heritage Preservation—A Review. Int. J. Appl. Sci. Technol. 2019, 9, 76–91. [Google Scholar]
- Remondino, F.; Menna, F. Image-Based Surface Measurement for Close-Range Heritage Documentation. In Proceedings of the 21st ISPRS Congress, Beijing, China, 3–11 July 2008. [Google Scholar]
- Costantino, D.; Carrieri, M.; Restuccia Garofalo, A.; Angelini, M.G.; Baiocchi, V.; Bogdan, A.M. Integrated Survey for Tensional Analysis of the Vault of the Church of San Nicola in Montedoro. In Proceedings of the 2nd International Conference of Geomatics and Restoration, Milan, Italy, 8–10 May 2019. [Google Scholar]
- Manferdini, A.M.; Russo, M. From survey to high definition representations of a continuous architectonical space. The case study of the Pomposa Abbey complex. Disegnarecon 2015, 8, 1–12. [Google Scholar]
- Manferdini, A.M.; Russo, M. Multi-scalar 3D digitization of Cultural Heritage using a low-cost integrated approach. In Proceedings of the 2013 Digital Heritage International Congress, Marseille, France, 28 October–1 November 2013. [Google Scholar]
- Russo, M.; Manferdini, A.M. Integration of image and range-based techniques for surveying complex architectures. In Proceedings of the ISPRS Technical Commission V Symposium, Riva del Garda, Italy, 23–25 June 2014. [Google Scholar]
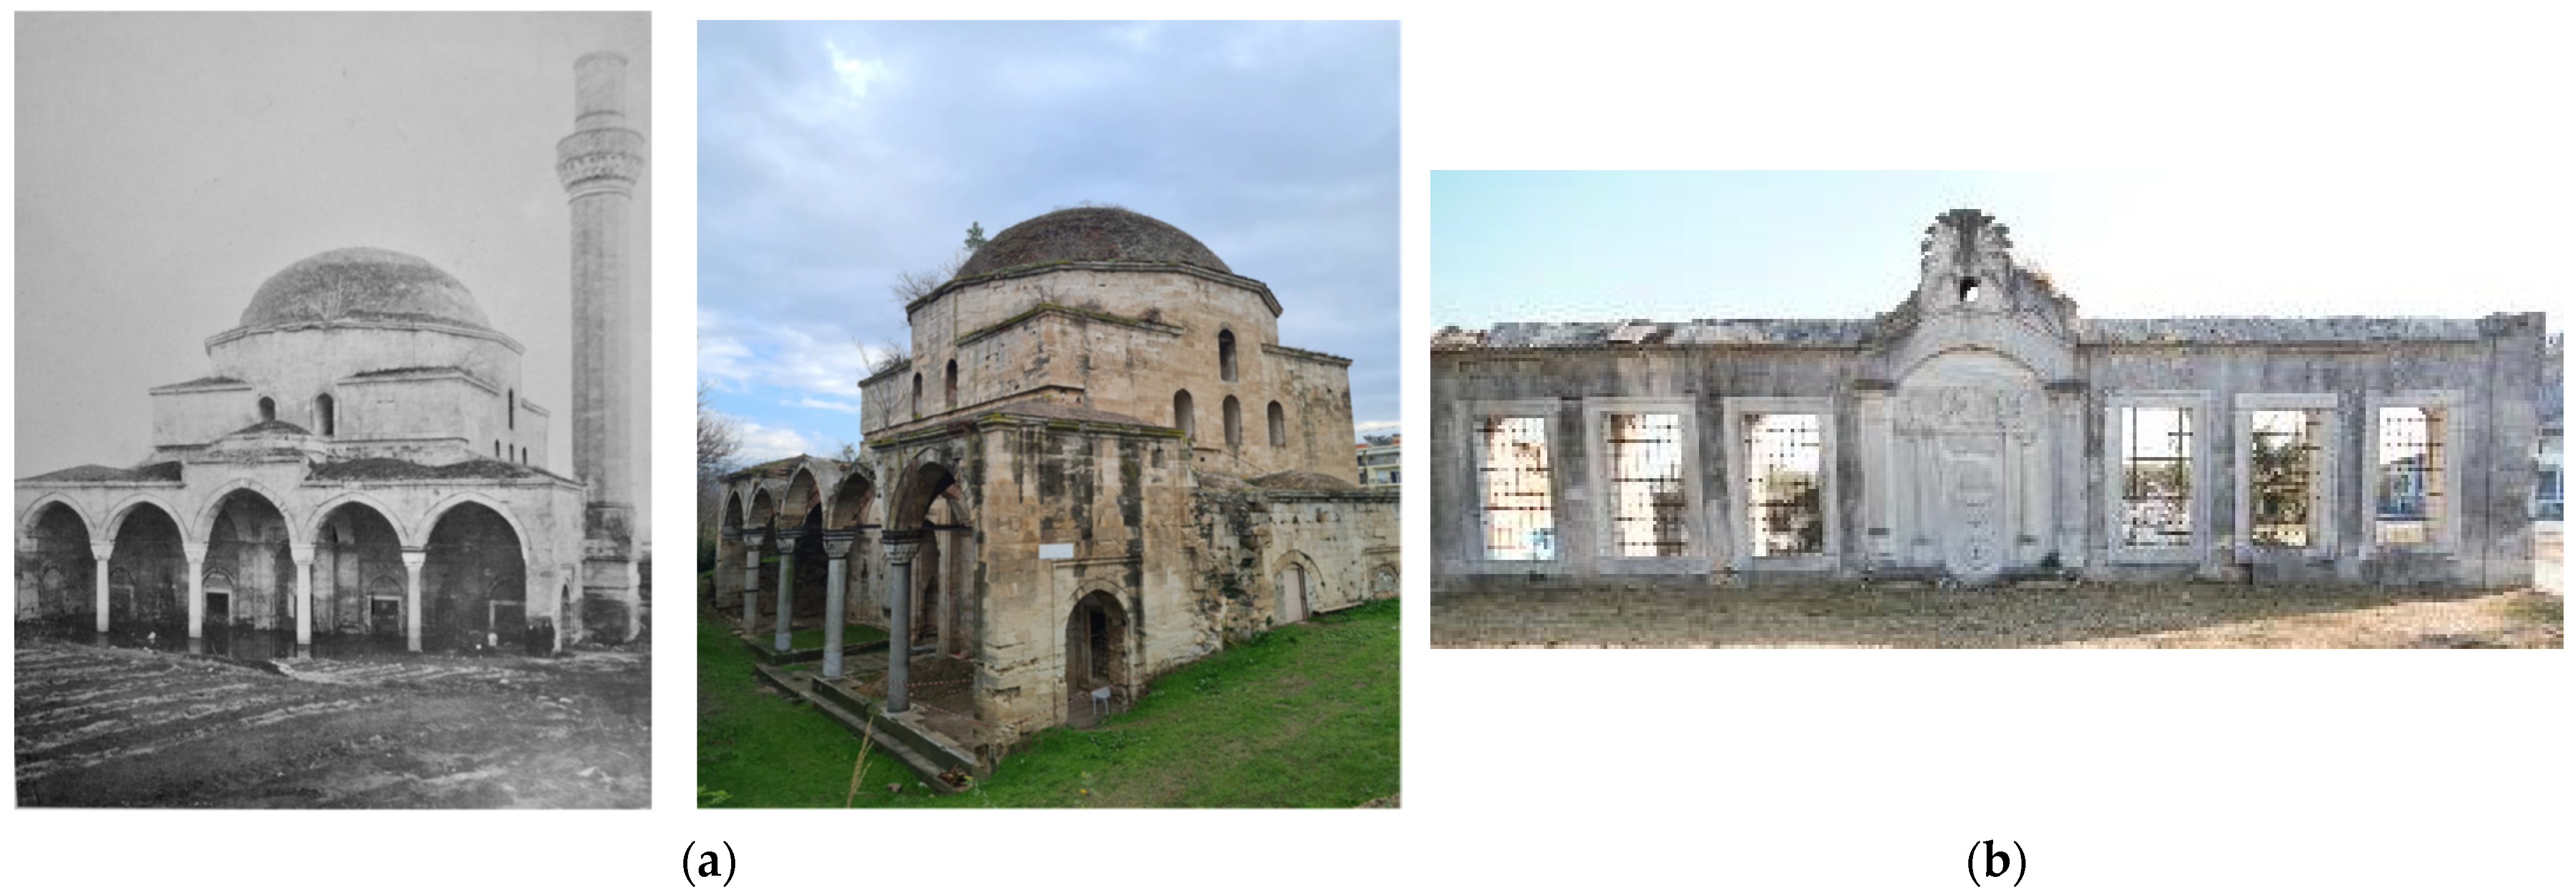
- Ameen, A. Islamic Architecture in Greece: Mosques; Bibliotheca Alexandrina: Alexandria, Egypt, 2017; pp. 87–89. [Google Scholar]
- Loukma, M.; Stefanidou, M. The Morphology and Typology of the Ottoman Mosques of Northern Greece. Int. J. Archit. Herit. 2017, 1, 78–88. [Google Scholar] [CrossRef]
- Stavridopoulos, Y. Monuments of the other: The management of the ottoman cultural heritage of Macedonia from 1912 until present. Ph.D. Thesis, University of Ioannina, Ioannina, Greece, 2015. [Google Scholar] [CrossRef]
- Konuk, N. Ottoman Architecture in Greece I; The Center for Strategic Research: Ankara, Turkey, 2010; pp. 300–306. [Google Scholar]
- Leica FlexLine TS06 Plus R500 Reflectorless Total Station. Available online: https://califfsurveying.com/product/leica-ts06-plus (accessed on 12 February 2024).
- Hiper SR. Available online: https://www.skippertech.com/product/hiper-sr/ (accessed on 12 February 2024).
- Topcon HiPer SR. Available online: https://www.synergypositioning.co.nz/products/gnss-equipment/led/topcon-hiper-sr (accessed on 12 February 2024).
- Mavic Air 2. Available online: https://www.dji.com/gr/mavic-air-2/specs (accessed on 12 February 2024).
- DJI Mavic Air 2. Available online: https://www.professional-multirotors.com/product/dji-mavic-air-2/ (accessed on 30 March 2024).
- About EOS 7D. Available online: https://www.cla.canon.com/cla/en/sna/professional/cameras_camcorders/eos_cameras/eos_7d (accessed on 12 February 2024).
- Remondino, F. Detailed image-based 3D geometric reconstruction of heritage objects. DGPF Tagungsband 2007, 16, 1–11. [Google Scholar]
- Russo, M.; Manferdini, A.M. Chapter 11, Integrated Multi-Scalar Approach for 3D Cultural Heritage Acquisitions. In Handbook of Research on Emerging Digital Tools for Architectural Surveying, Modeling, and Representation, 1st ed.; DeMarco, A., Wolfe, K., Henning, C., Martin, C., Eds.; Engineering Science Reference: Hershey, PA, USA, 2015; pp. 337–360. [Google Scholar] [CrossRef]
- Canon EOS 7D 18 MP CMOS Digital SLR Camera Body Only (Discontinued by Manufacturer). Available online: https://www.amazon.com/Canon-Digital-Camera-discontinued-manufacturer/dp/B002NEGTTW (accessed on 30 March 2024).
- Rinaudo, F.; Bornaz, L.; Ardissone, P. 3D High accuracy survey and modelling for Cultural Heritage Documentation and Restoration. In Proceedings of the VAST 2007, Brighton, UK, 26–30 November 2007; pp. 1–5. [Google Scholar]
- Caroti, G.; Martinez-Espejo Zaragoza, I.; Piemonte, A. The use of image and laser scanner survey archives for cultural heritage 3D modelling and change analysis. Acta IMEKO 2021, 10, 114–121. [Google Scholar]
- Tokmakidis, K. Teaching Notes: Geometric Documentation of Monuments & Archaeological Sites; School of Rural and Surveying Engineering AUTH: Thessaloniki, Greece, 2016. [Google Scholar]
- Pavlidis, G.; Koutsoudis, A.; Arnaoutoglou, F.; Tsioukas, V.; Chamzas, C. Methods for 3D digitization of Cultural Heritage. J. Cult. Herit. 2007, 8, 93–98. [Google Scholar] [CrossRef]
- Remondino, F.; Guarnieri, A.; Vettore, A. 3D modeling of Close-Range Objects: Photogrammetry or Laser Scanning. In Proceedings of the SPIE The International Society for Optical Engineering, Geneva, Switzerland, 29 November–1 December 2004. [Google Scholar] [CrossRef]
- Leica BLK360 G1 Imaging Laser Scanner. Available online: https://www.sccssurvey.co.uk/leica-blk360-imaging-laser-scanner-first-generation.html (accessed on 12 February 2024).
- Vlachou, M. Geometric Documentation of Patras Roman Odeon—Surveying Mapping—Mapping Mosaics. Diploma Thesis, National Technical University of Athens, Athens, Greece, October 2012. [Google Scholar]
- Agnello, F.; Lo Brutto, M. Integrated Surveying Techniques in Cultural Heritage Documentation. ISPRS Arch. 2007, 36, 47–52. [Google Scholar]
- Zvietcovich, F.; Castaneda, B.; Perucchio, R. 3D solid model updating of complex ancient monumental structures based on local geometrical meshes. Digit. Appl. Archaeol. Cult. Herit. 2015, 2, 12–27. [Google Scholar] [CrossRef]
- Stal, C.; De Wulf, A.; De Maeyer, P.; Goossens, R.; Nuttens, T. Evaluation of the accuracy of 3D data acquisition techniques for the documentation of Cultural Heritage. In Proceedings of the 3rd EARSeL Workshop on Remote Sensing for Archaeology and Cultural Heritage Management, Ghent, Belgium, 19–22 September 2012. [Google Scholar]
- Jarahizadeh, S.; Salehi, B. A Comparative Analysis of UAV Photogrammetric Software Performance for Forest 3D Modeling: A Case Study Using AgiSoft Photoscan, PIX4DMapper, and DJI Terra. Sensors 2024, 24, 286. [Google Scholar] [CrossRef] [PubMed]
- Georgoula, O. Teaching Notes: Applications of Photogrammetry in Architecture and Archeology—The Digital Methods of Rectification and Orthorectification; School of Rural and Surveying Engineering AUTH: Thessaloniki, Greece, 2010. [Google Scholar]
- Guarnieri, A.; Remondino, F.; Vettore, A. Digital Photogrammetry and TLS data fusion applied to Cultural Heritage 3D modeling. In Proceedings of the ISPRS Commission V Symposium, Image Engineering and Vision Metrology, Dresden, Germany, 25–27 September 2006. [Google Scholar]
- Daniel, M. Comparison of the 3D Laser Scanning Method with the Traditional Photogrammetric Recording. Application in the 3D Recording of a Traditional Tobacco Warehouse in Genisea, Xanthi; Aristotle University of Thessaloniki: Thessaloniki, Greece, 2016. [Google Scholar] [CrossRef]
- Alshawabkeh, Y.; Haala, N. Laser Scanning and Photogrammetry: A Hybrid Approach for Heritage Documentation. In Proceedings of the Third International Conference on Science & Technology in Archaeology & Conservation, The Hashimite University, Zarqa, Jordan, 7–11 December 2004. [Google Scholar]
- Leica Cyclone REGISTER 360 PLUS (BLK Edition). Available online: https://shop.leica-geosystems.com/leica-blk/software/leica-cyclone-register-360-plus-blk-edition/buy (accessed on 15 February 2024).
- Caprioli, M.; Minchilli, M.; Scognamiglio, A. Experiences in Photogrammetric and Laser Scanner Surveying of Architectural Heritage. Geoinformatics FCE CTU 2011, 6, 55–61. [Google Scholar] [CrossRef]
- RealityCapture. Create 3D Maps and Models from Drone Images. Fast. Accurate. Simple. Available online: https://www.capturingreality.com/Surveying (accessed on 15 February 2024).
- Meschini, A.; Petrucci, E.; Rossi, D.; Sicuranza, F. Point Cloud-Based Survey for Cultural Heritage. An experience of integrated use of Range-Based and Image-Based Technology for the San Francesco Convent in Monterubbiano. In Proceedings of the ISPRS Technical Commission V Symposium, Riva del Garda, Italy, 23–25 June 2014. [Google Scholar]
- Wei, O.; Chin, C.; Majid, Z.; Setan, H. 3D documentation and preservation of historical monument using terrestrial laser scanning. Geoinf. Sci. J. 2010, 10, 73–90. [Google Scholar]
- Giagkas, F.; Georgoula, O.; Patias, P. Recording of the exterior shell of the Church of St. Georgios in Goumenissa with the use of Close-Range Photogrammetry and a UAV. In Living with GIS; Fotiou, A., Georgoula, O., Papadopoulou, M., Rossikopoulos, D., Spatalas, S., Eds.; Ziti: Thessaloniki, Greece, 2017; pp. 428–437. [Google Scholar]


| Model Name | DJI Mavic Air 2 |
|---|---|
| Weight | 570 g |
| Max Flight Time (without wind) | 34 min |
| Max Flight Distance | 18.5 km |
| Vertical Accuracy Range | ±0.1 m (with vision positioning); ±0.5 m (with GPS positioning) |
| Horizontal Accuracy Range | ±0.1 m (with vision positioning); ±1.5 m (with GPS positioning) |
| Satellite Systems | GPS + GLONASS |
| Sensor | 1/2″ CMOS; effective pixels: 12 MP and 48 MP |
| Lens | FOV: 84°; equivalent focal length: 24 mm; Aperture: f/2.8; focus range: 1 m to ∞ |
| Max Photo Resolution | 48 MP 8000 × 6000 pixels |
| Traverses | Vertices n | Length S (m) | Wβ (c) | Wβ max (c) | δs (cm) | δs max (cm) |
|---|---|---|---|---|---|---|
| Traverse 1 | 4 | 143.47 | 2.76 | 4.00 | 1.79 | 10.99 |
| Traverse 2 | 7 | 172.55 | 1.61 | 5.29 | 2.55 | 11.57 |
| Traverse 3 | 8 | 178.80 | 1.13 | 5.66 | 3.91 | 11.68 |
| Traverse 4 | 6 | 203.66 | 4.58 | 4.90 | 1.92 | 12.13 |
| Traverse 5 (interior) | 8 | 155.77 | 0.97 | 5.66 | 0.98 | 11.24 |
| Laser Scanner–Photogrammetry Orthophotos | Mean (μ) | Standard Deviation (σ) | ||
|---|---|---|---|---|
| dx (cm) | dΖ (cm) | dX (cm) | dΖ (cm) | |
| Eastern facade | 6.6 | 2.8 | 1.2 | 0.5 |
| Western facade | 2.5 | 2.7 | 0.3 | 0.4 |
| Northern facade | 3.5 | 4.8 | 0.6 | 0.9 |
| Southern facade | 2.7 | 5.8 | 0.6 | 1.3 |
| Interior—East | 1.0 | 2.3 | 0.3 | 0.6 |
| Interior—West | 3.1 | 2.7 | 0.8 | 0.7 |
| Interior—North | 1.6 | 1.2 | 0.5 | 0.3 |
| Interior—South | 5.4 | 3.4 | 1.8 | 1.1 |
| Photogrammetric Orthophotos | Mean (μ) | Standard Deviation (σ) | ||
|---|---|---|---|---|
| dX (cm) | dΖ (cm) | dX (cm) | dΖ (cm) | |
| Eastern facade | 6.2 | 3.0 | 1.2 | 0.6 |
| Western facade | 3.1 | 3.0 | 0.4 | 0.4 |
| Northern facade | 5.1 | 5.9 | 0.9 | 1.0 |
| Southern facade | 3.7 | 6.5 | 0.8 | 1.4 |
| Interior—East | 2.5 | 3.3 | 0.7 | 1.0 |
| Interior—West | 4.1 | 3.9 | 1.0 | 1.0 |
| Interior—North | 2.0 | 1.8 | 0.6 | 0.5 |
| Interior—South | 5.4 | 3.3 | 1.8 | 1.1 |
| Aerial Photogrammetry | Terrestrial Photogrammetry | Terrestrial Laser Scanning | |
|---|---|---|---|
| Equipment | DJI Mavic Air 2—drone quadcopter UAV | Canon EOS 7D DSLR camera | Leica BLK360 Imaging Laser Scanner |
| Number of images/laser scans | 255 images | 3708 images | 70 laser scans |
| Recorded surfaces | The Mehmet Bey block (184 images) and the mosque (71 images) | The mosque (3500 internal and external images); the fountain and the burial enclosure of Ismael Bey (208 images) | The mosque (24 internal and 46 external laser scans) |
| Recording height/position | Hovering height of 43m above the block and 18 m around the mosque | Rings of approx. 5 m and 10 m around the mosque, the fountain and the burial enclosure; on accessible open window frames of the mosque for the recording of the floor | Stations with point cloud overlap (approx. every 5 m); on accessible open window frames of the mosque for the recording of the upper internal zones at a height of 10 m |
| Time spent in the field | 1 h | 6 h | 10 h |
| Data size | 1 GB | 80 GB | 70 GB |
| Photogrammetric Model | TLS/Photogrammetric Model | |
|---|---|---|
| Processing software | Agisoft Metashape Professional 1.7.0 | RealityCapture 1.3 |
| Registered images/laser scans | 140 images | 3429 images; 70 laser scans |
| Control points | 280 | 7 |
| Triangles/vertices | 4.2 M/2.1 M | Initial model: 1 B/0.5 B Simplified model: 5 M/2.5 M |
| Quality level | Medium | Normal |
| Texture resolution | 4096 × 4096 | 16384 × 16384 |
| Accuracy estimation from software | 6.7 cm | 2.1 cm |
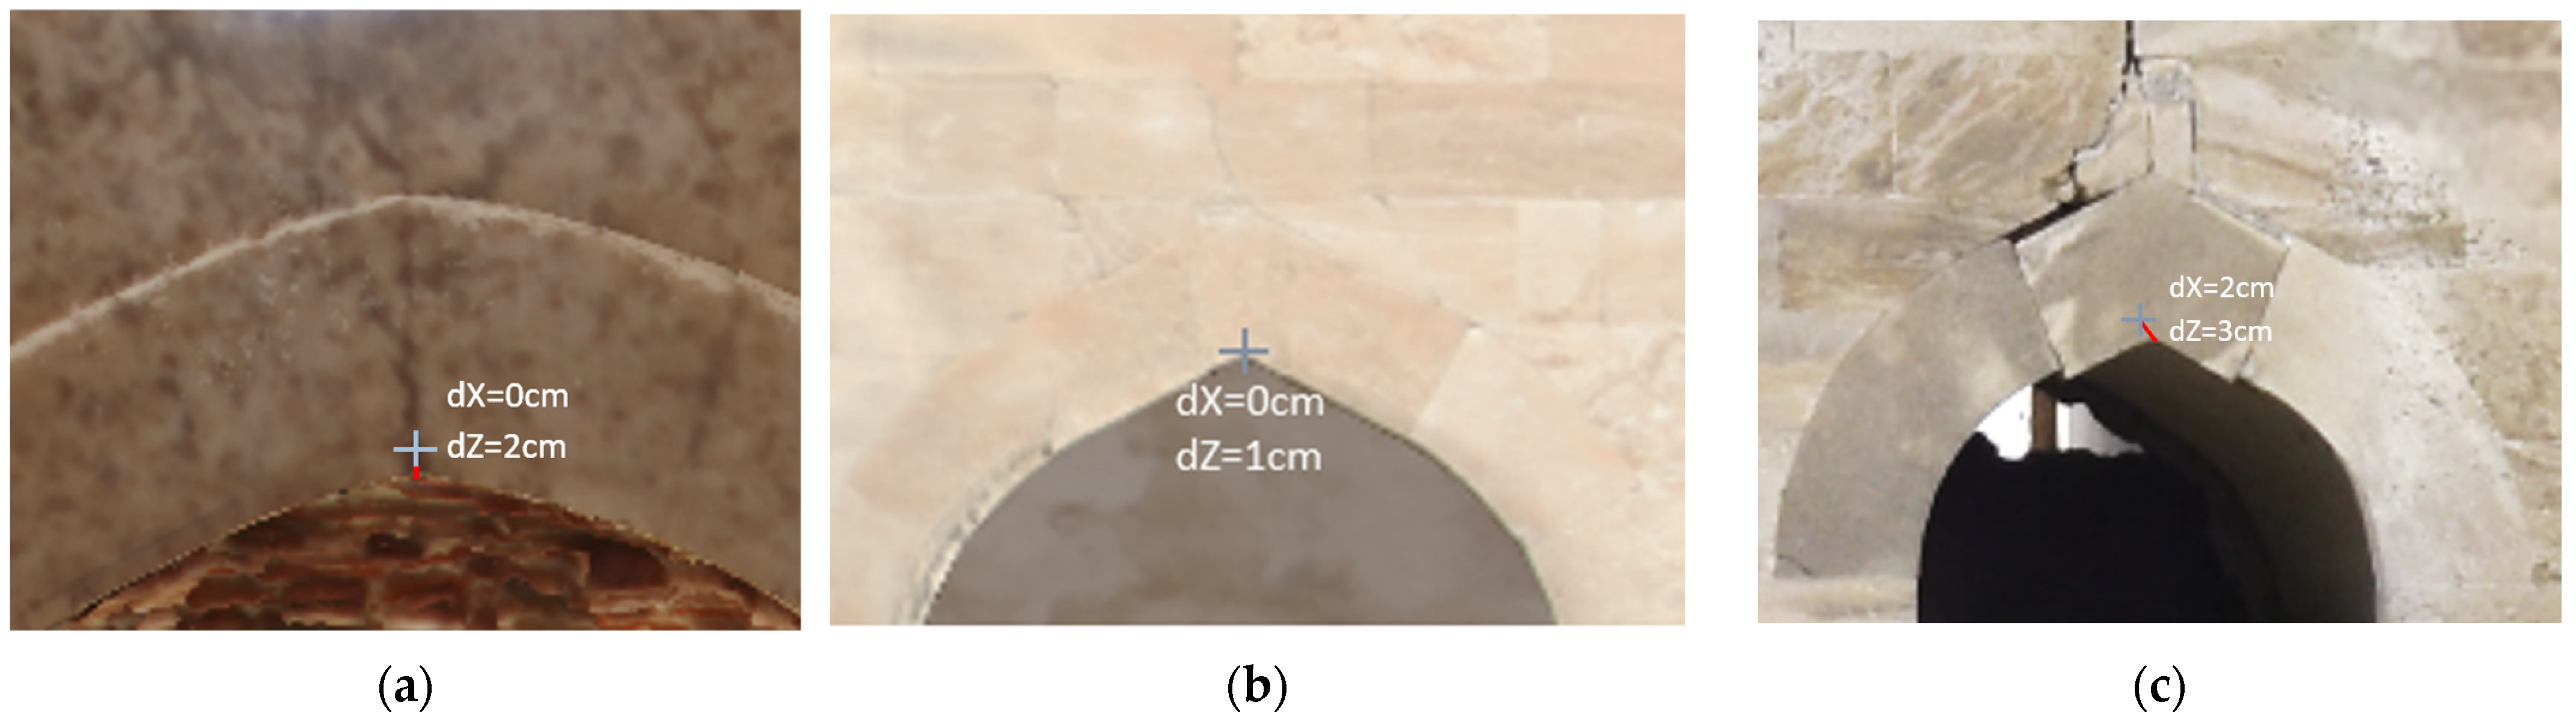
| Accuracy estimation from manual checks on orthophotos (max. errors) | 6.6 cm | 6.5 cm |
| Products | Textured and georeferenced 3D model; facade orthophotos; horizontal and vertical sections | Textured and georeferenced 3D model; facade orthophotos; horizontal and vertical sections |
Disclaimer/Publisher’s Note: The statements, opinions and data contained in all publications are solely those of the individual author(s) and contributor(s) and not of MDPI and/or the editor(s). MDPI and/or the editor(s) disclaim responsibility for any injury to people or property resulting from any ideas, methods, instructions or products referred to in the content. |
© 2024 by the authors. Licensee MDPI, Basel, Switzerland. This article is an open access article distributed under the terms and conditions of the Creative Commons Attribution (CC BY) license (https://creativecommons.org/licenses/by/4.0/).
Share and Cite
Tsiachta, A.; Argyrou, P.; Tsougas, I.; Kladou, M.; Ravanidis, P.; Kaimaris, D.; Georgiadis, C.; Georgoula, O.; Patias, P. Multi-Sensor Image and Range-Based Techniques for the Geometric Documentation and the Photorealistic 3D Modeling of Complex Architectural Monuments. Sensors 2024, 24, 2671. https://doi.org/10.3390/s24092671
Tsiachta A, Argyrou P, Tsougas I, Kladou M, Ravanidis P, Kaimaris D, Georgiadis C, Georgoula O, Patias P. Multi-Sensor Image and Range-Based Techniques for the Geometric Documentation and the Photorealistic 3D Modeling of Complex Architectural Monuments. Sensors. 2024; 24(9):2671. https://doi.org/10.3390/s24092671
Chicago/Turabian StyleTsiachta, Alexandra, Panagiotis Argyrou, Ioannis Tsougas, Maria Kladou, Panagiotis Ravanidis, Dimitris Kaimaris, Charalampos Georgiadis, Olga Georgoula, and Petros Patias. 2024. "Multi-Sensor Image and Range-Based Techniques for the Geometric Documentation and the Photorealistic 3D Modeling of Complex Architectural Monuments" Sensors 24, no. 9: 2671. https://doi.org/10.3390/s24092671