Article

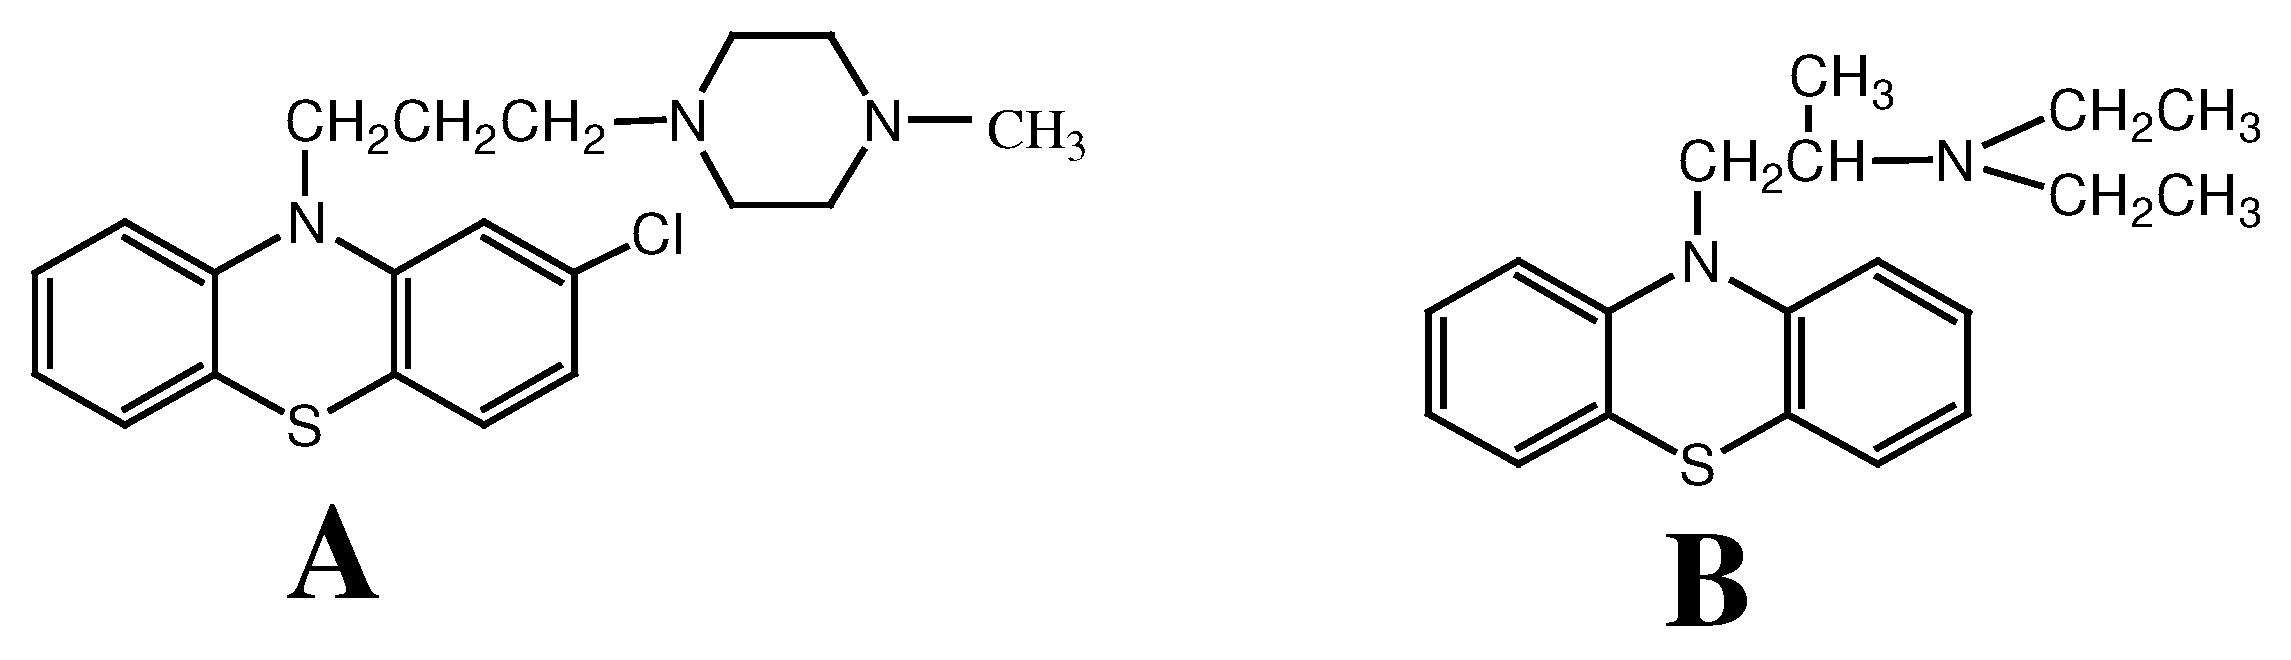
Voltammetric Determination of Prochlorperazine and Ethopropazine Using a Gold Electrode Modified with Decanethiol SAM

Department of Chemistry, Wuhan University, Wuhan 430072, P. R.China
*
Author to whom correspondence should be addressed.
Sensors 2003, 3(11), 524-533; https://doi.org/10.3390/s31100524
Submission received: 22 August 2003 / Accepted: 7 October 2003 / Published: 5 December 2003

Abstract

:
The voltammetric behavior of prochlorperazine and ethopropazine  at  a decanethiol (DEC) self-assembled monolayer (SAM) modified gold electrode (DEC/Au) has been studied. It was observed that prochlorperazine exhibited an anodic peak at about 0.60 V (vs SCE), while ethopropazine exhibited two anodic peaks at about 0.49 V and 0.58 V on DEC/Au in pH 10 sodium carbonate buffer. This was due to their different electrochemical oxidation mechanisms. In this case, the oxidation of prochlorperazine and ethopropazine included one 2e step and two 1e steps, respectively. In the presence of some reductants such as ascorbic acid, the oxidation products of them can catalyze the oxidation of the reductants and thus make the peaks grow. In addition, it was found that the SAM structure became not so compact when prochlorperazine and ethopropazine were present, resulting from their permeating in the SAM. Various conditions were optimized for their determination. Under the selected conditions (i.e. 0.080 M pH 10 sodium carbonate buffer; scan rate: 100 mV/s; accumulation potential: –0.4 V or 0 V; accumulation time: 60 s), the peak currents were linear to prochlorperazine concentration in the ranges of 0.1~2.0 µM and 5.0~50 µM, and linear with ethopropazine in the ranges of 10 nM~0.1 µM and 0.5~20 µM. The RSD was 4.28% for 8 successive measurements of 1.0 µM prochlorperazine. The influence of some coexistents was examined.

Introduction

Phenothiazines are among the most widely used drugs in the treatment of mental disease. They constitute one of the largest chemical classes in the official compendia. Because of the importance of this class of compounds, a lot of work has been reported on their characterization and determination in dosage forms and biological fluids. The methods used for their study included electroanalysis [1,2], spectrophotometry [3,4,5], chemiluminescence [6] and HPLC [7] etc. That has been reviewed by Korpinsk et al [8]. The electrochemical methods for phenothiazines mainly include potentiometry and voltammetry, based on their electroactivity or redox property [1,2,9]. For example, Golabi et al have attempted potentiometric titration for the determination of phenothiazine derivatives [9]. In their work, a chloroform solution of bromine was used as titrant. Pourmaghi-Azar and Farhadi studied the reaction between tetrabutylammonium periodate and phenothiazines in chloroform by potentiometry and applied this to the determination of them in various pharmaceutical preparations [10]. Bishop and Husein have demonstrated the electrochemical behavior of N-substituted phenothiazines (e.g. chlorpromazine, fluphenazine, perphenazine, promazine, promethazine and trimeprazine) at gold and platinum rotating disc electrodes (RDE) and their redox mechanisms [11]. Wang et al. developed a DNA-modified carbon paste electrode for the measurement of trace phenothiazine derivatives [12]. Detection limits of 5 nM promethiazine, 7 nM chlorpromazine and 12 nM phenothiazine were obtained after 10 min accumulation.
In recent years, self-assembled monolayers (SAMs) have attracted more and more attention. SAMs can be designed to introduce specific interactions between the monolayer and the analytes for molecule recognition [13,14]. The method introduced by using electrodes modified by SAMs of thiols or sulfur-containing molecules, is also expected to eliminate the interference from relatively complex matrices [15]. Because of these merits, SAMs have been widely used to modify electrode for the analysis of drugs etc [16,17]. Wang et al attempted to assay phenothiazine derivatives using alkanethiol self-assembled monolayer modified gold electrodes [18]. The interference of some hydrophilic compounds was depressed to some extent.
Prochlorperazine and ethopropazine belong to phenothiazine drug family. They can lower the activity of dopamine in the central nervous system, and have wide clinical application [3]. Their molecular structures are similar as shown in Scheme 1, so is their electrochemical property. Meanwhile, they also showed some difference. In this work, their voltammetric characteristics was investigated and compared on DEC SAM/Au.
Scheme 1. The molecular structure of prochlorperazine (A) and ethopropazine (B).
Sensors 03 00524 g008

Experimental

Apparatus

Voltammetric studies were performed with a model CHI 830 electrochemical analyzer (CH Instrumental Co., Shanghai, China) controlled by a personal computer. A three-electrode system was used, which included a gold working electrode, a platinum wire auxiliary electrode and a saturated calomel electrode (SCE) as reference electrode. Electrochemical impedance measurement was carried out on a Model-273A bipotentiostat in conjunction with a lock-in amplifier (EG&G PAR Co., U.S.A.). The pH values were measured with a pHS-3C pH meter (Shanghai, China).

Reagents

Prochlorperazine and ethopropazine were purchased from Sigma and used as received. The stock solution of prochlorperazine (0.010 M) was prepared with N, N’-dimethylformamide, and ethopropazine (0.010 M) stock solution was prepared with dry ethanol. Decanethiol (DEC) was supplied by Aldrich. Other reagents were analytical or reagent grade. All working solutions were prepared with double-distilled water. The supporting electrolyte solution was a 0.080 M sodium carbonate buffer (pH 10).

Electrode preparation

To get a clear and smooth electrode surface, the gold electrode (purity: 99.99%, 2.0 mm diameter, sealed in a Teflon tube) was polished with 1.0 µm and 0.3 µm alumina slurry on polishing pads respectively, then rinsed with distilled water, ultrasonicated in water bath for 2 min and dried in air. Following this, the gold electrode was immersed in an ethanol solution containing 1.0 mM DEC for certain time, then taken out and washed carefully with double-distilled water to remove the non-chemisorbed materials. Thus a DEC SAM modified gold electrode (DEC SAM/Au) was obtained.

Procedure

Proper amount of the stock solutions together with 2.0 ml (0.40 M) pH 10 sodium carbonate buffer was transferred to an electrochemical cell and diluted to 10.0 ml with distilled water. For cyclic voltammetry, the potential was scanned between 0.2 V and 0.9 V (vs SCE) with a scan rate of 100 mV/s. Because the current responses of them decreased with repetitive cycling times increasing, the voltammograms corresponding to the first scan were recorded and the anodic peak was measured. All experiments were performed at room temperature.

Results and Discussion

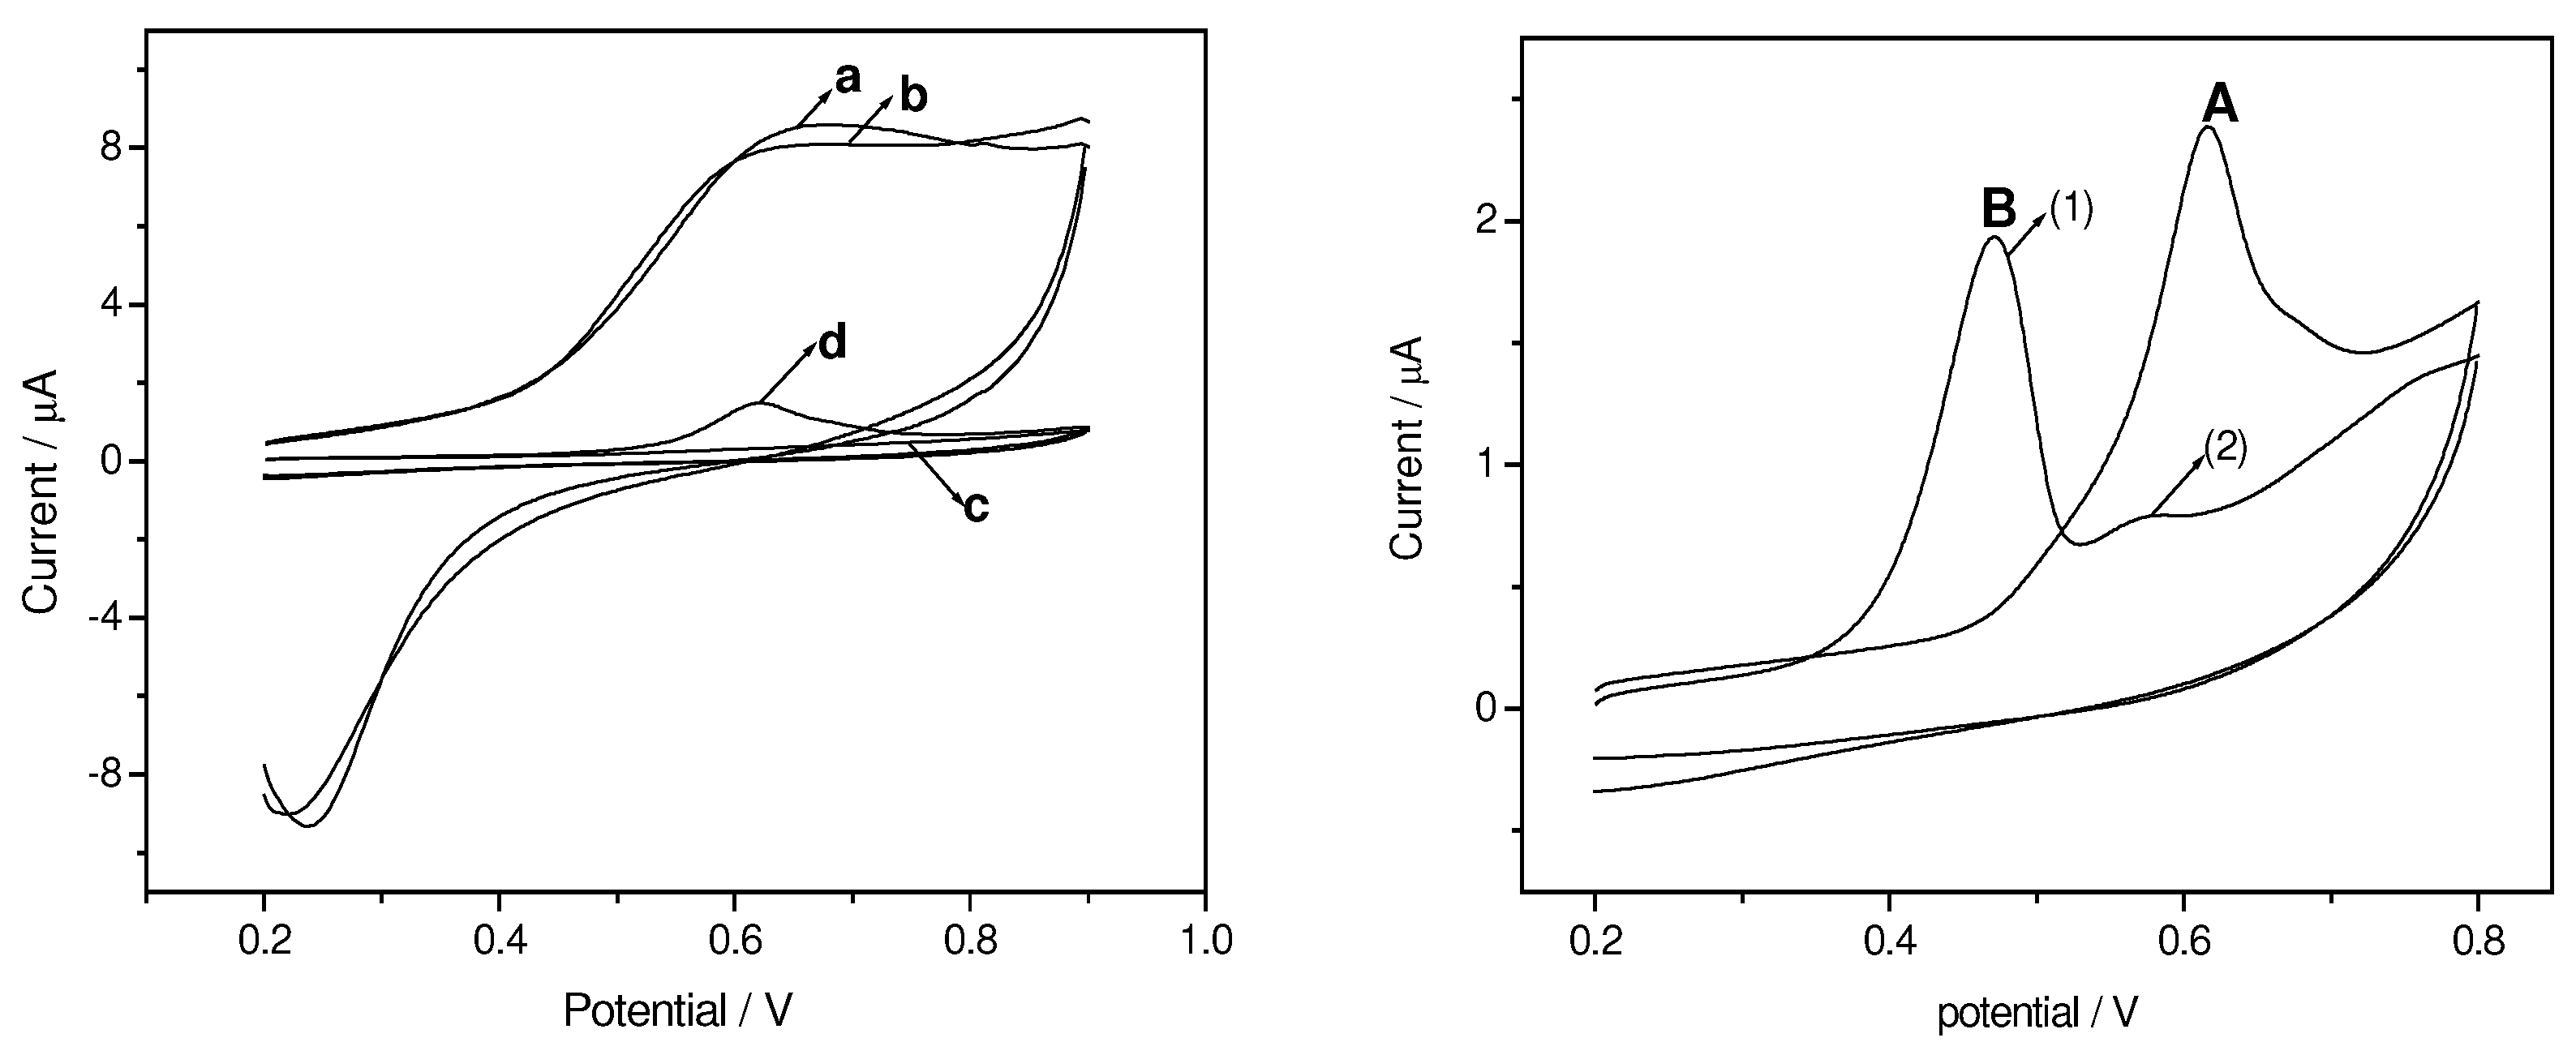
Cyclic Voltammograms

As shown in Fig.1, the response of prochlorperazine on bare gold electrodes is poor and no discernible peaks are observed. To improve the response of prochlorperazine, several modifiers were used to modify the electrode, such as 3-mercaptopropionic acid (3MPA), mercaptoethanol (ME), 11-mercapto-undecyl alcohol (MUA) and DEC. It was found that prochlorperazine almost couldn’t exhibit observable peaks on 3MPA/Au, ME/Au and MUA/Au. This is due to the blocking action of the SAM of them to prochlorperazine and the repellence between hydrophobic prochlorperazine and the hydrophilic monolayers. On the contrary, prochlorperazine exhibited an anodic peak at about 0.60 V at DEC/Au (Fig.1). This was ascribed to the oxidation of prochlorperazine and the accumulative action of DEC SAM. Meanwhile, the background current decreased due to the hindrance of DEC SAM to the oxidation of gold. As comparison, ethopropazine was also investigated. Under the same conditions, ethopropazine exhibited two anodic peaks at about 0.49 V and 0.58 V, which was different from that of prochlorperazine (Fig.2). The difference was thought to stem from the different electrochemical oxidation mechanisms of them. In general, the electrochemical oxidation of phenothiazine derivatives involves 2e-transfer. The two electrons are lost either simultaneously or in two steps, generating one or two anodic peaks [11]. Accordingly, in this case prochlorperazine was thought to experience a 2e-step oxidation, and ethopropazine two 1e-steps. As no corresponding cathodic peaks were observed, their electrochemical reactions must have been irreversible.
Figure 1. (left) Cyclic voltammograms (CVs) of bare Au electrode (a, b) and DEC SAM/Au (c, d) in a blank solution (a, c) and in a 10 µM prochlorperazine solution (b, d). Scan rate: 100 mV/s, accumulation time: 60 s, supporting electrolyte: 0.080 M sodium carbonate buffer (pH 10).
Sensors 03 00524 g001
Figure 2. (right) CVs of 10 µM prochlorperazine (A) and ethopropazine (B) on DEC SAM/Au. Other conditions as in Figure 1.

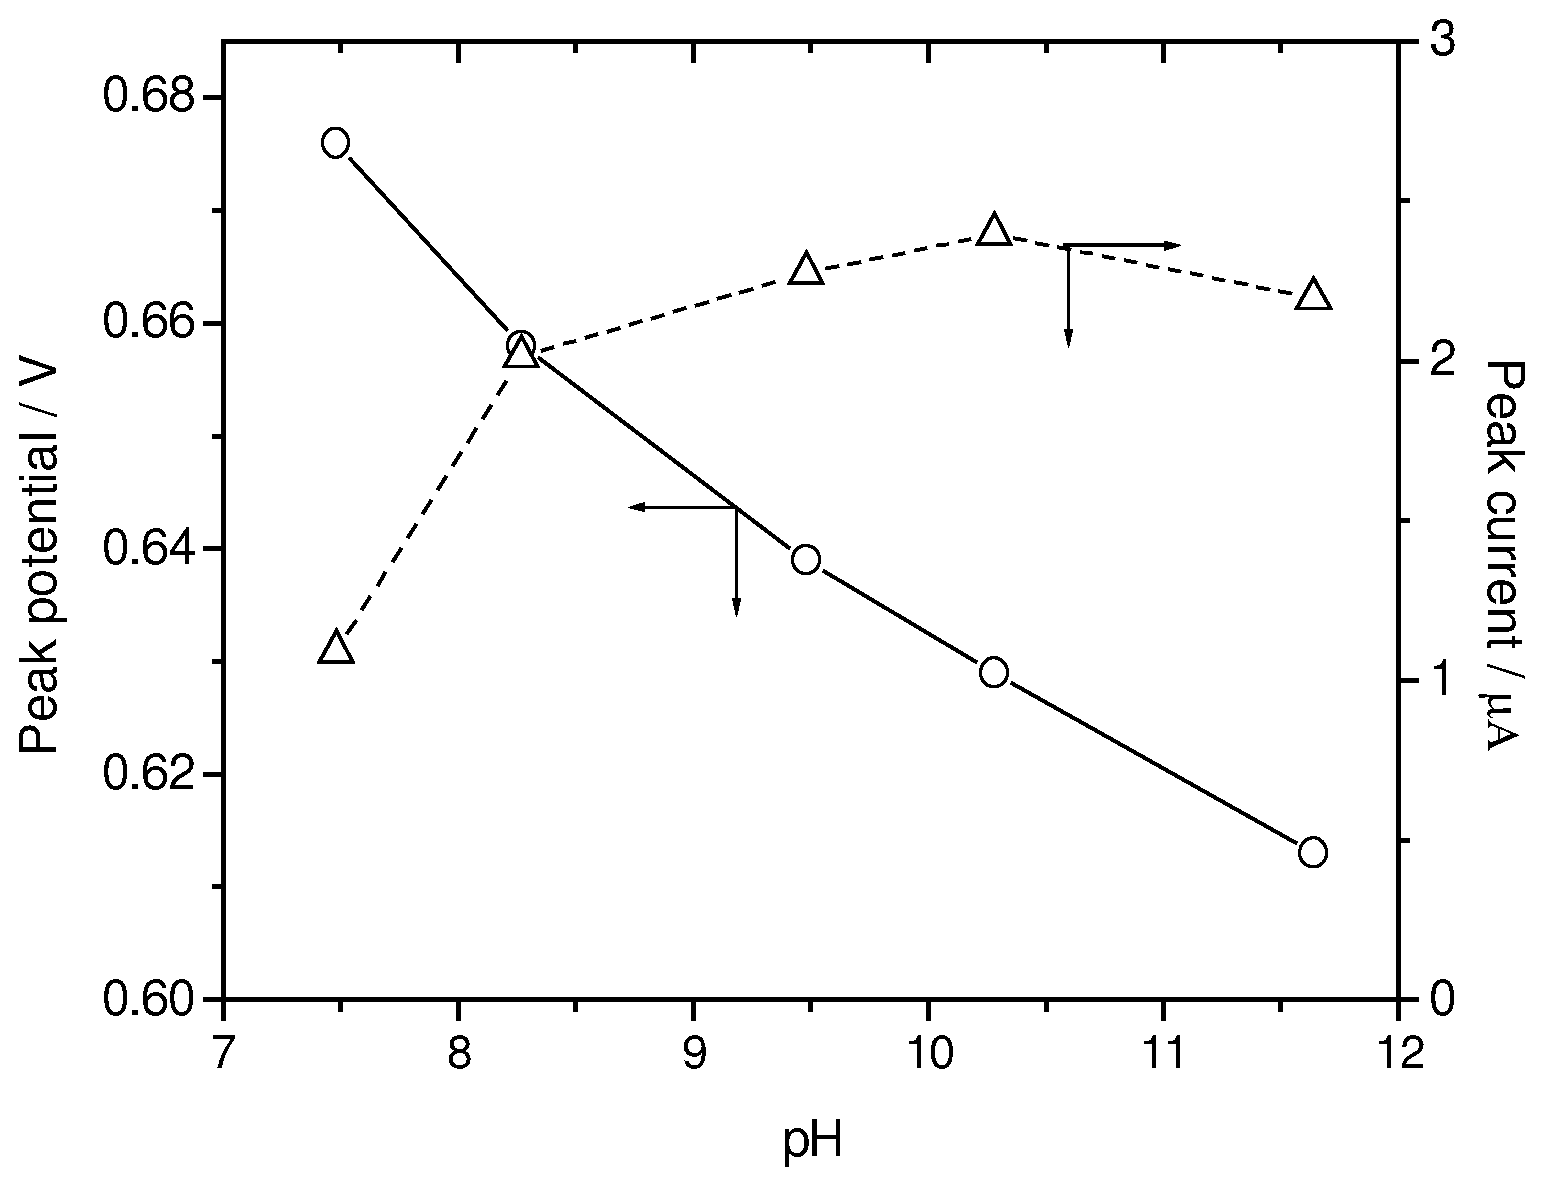
Influence of solution pH

Solution pH is one of the variables that strongly influence the shape of voltammograms and hence was investigated. It was observed that ethopropazine exhibited two peaks in basic media. The peak at about 0.49 V shifted to more positive potential with solution pH decreasing. So did another peak. Both peaks grew first and then lowered with pH changing. They reached maximum values at about pH 10. When solution pH was lower than 7, ethopropazine exhibited only one anodic peak, probably resulting from the mergence of the two peaks. Prochlorperazine exhibited one peak over the pH range of 4.5~11. The peak shifted negatively and its height increased with pH increasing. At about pH 10 the peak height achieved maximum. Further increase in pH made the peak current decrease (Fig.3). Therefore, a pH 10 sodium carbonate buffer was chosen as the analytical medium in this work. The buffer concentration was changed from 0.010 M to 0.20 M to examine its influence on peak current of them. As a result, for both of them the peak current reached maximum values when buffer concentration was 0.080 M.
Figure 3. Variation of peak current and peak potential with solution pH (with DEC SAM/Au). Prochloperazine concentration: 10 µM, other conditions as in Figure 1.
Sensors 03 00524 g003

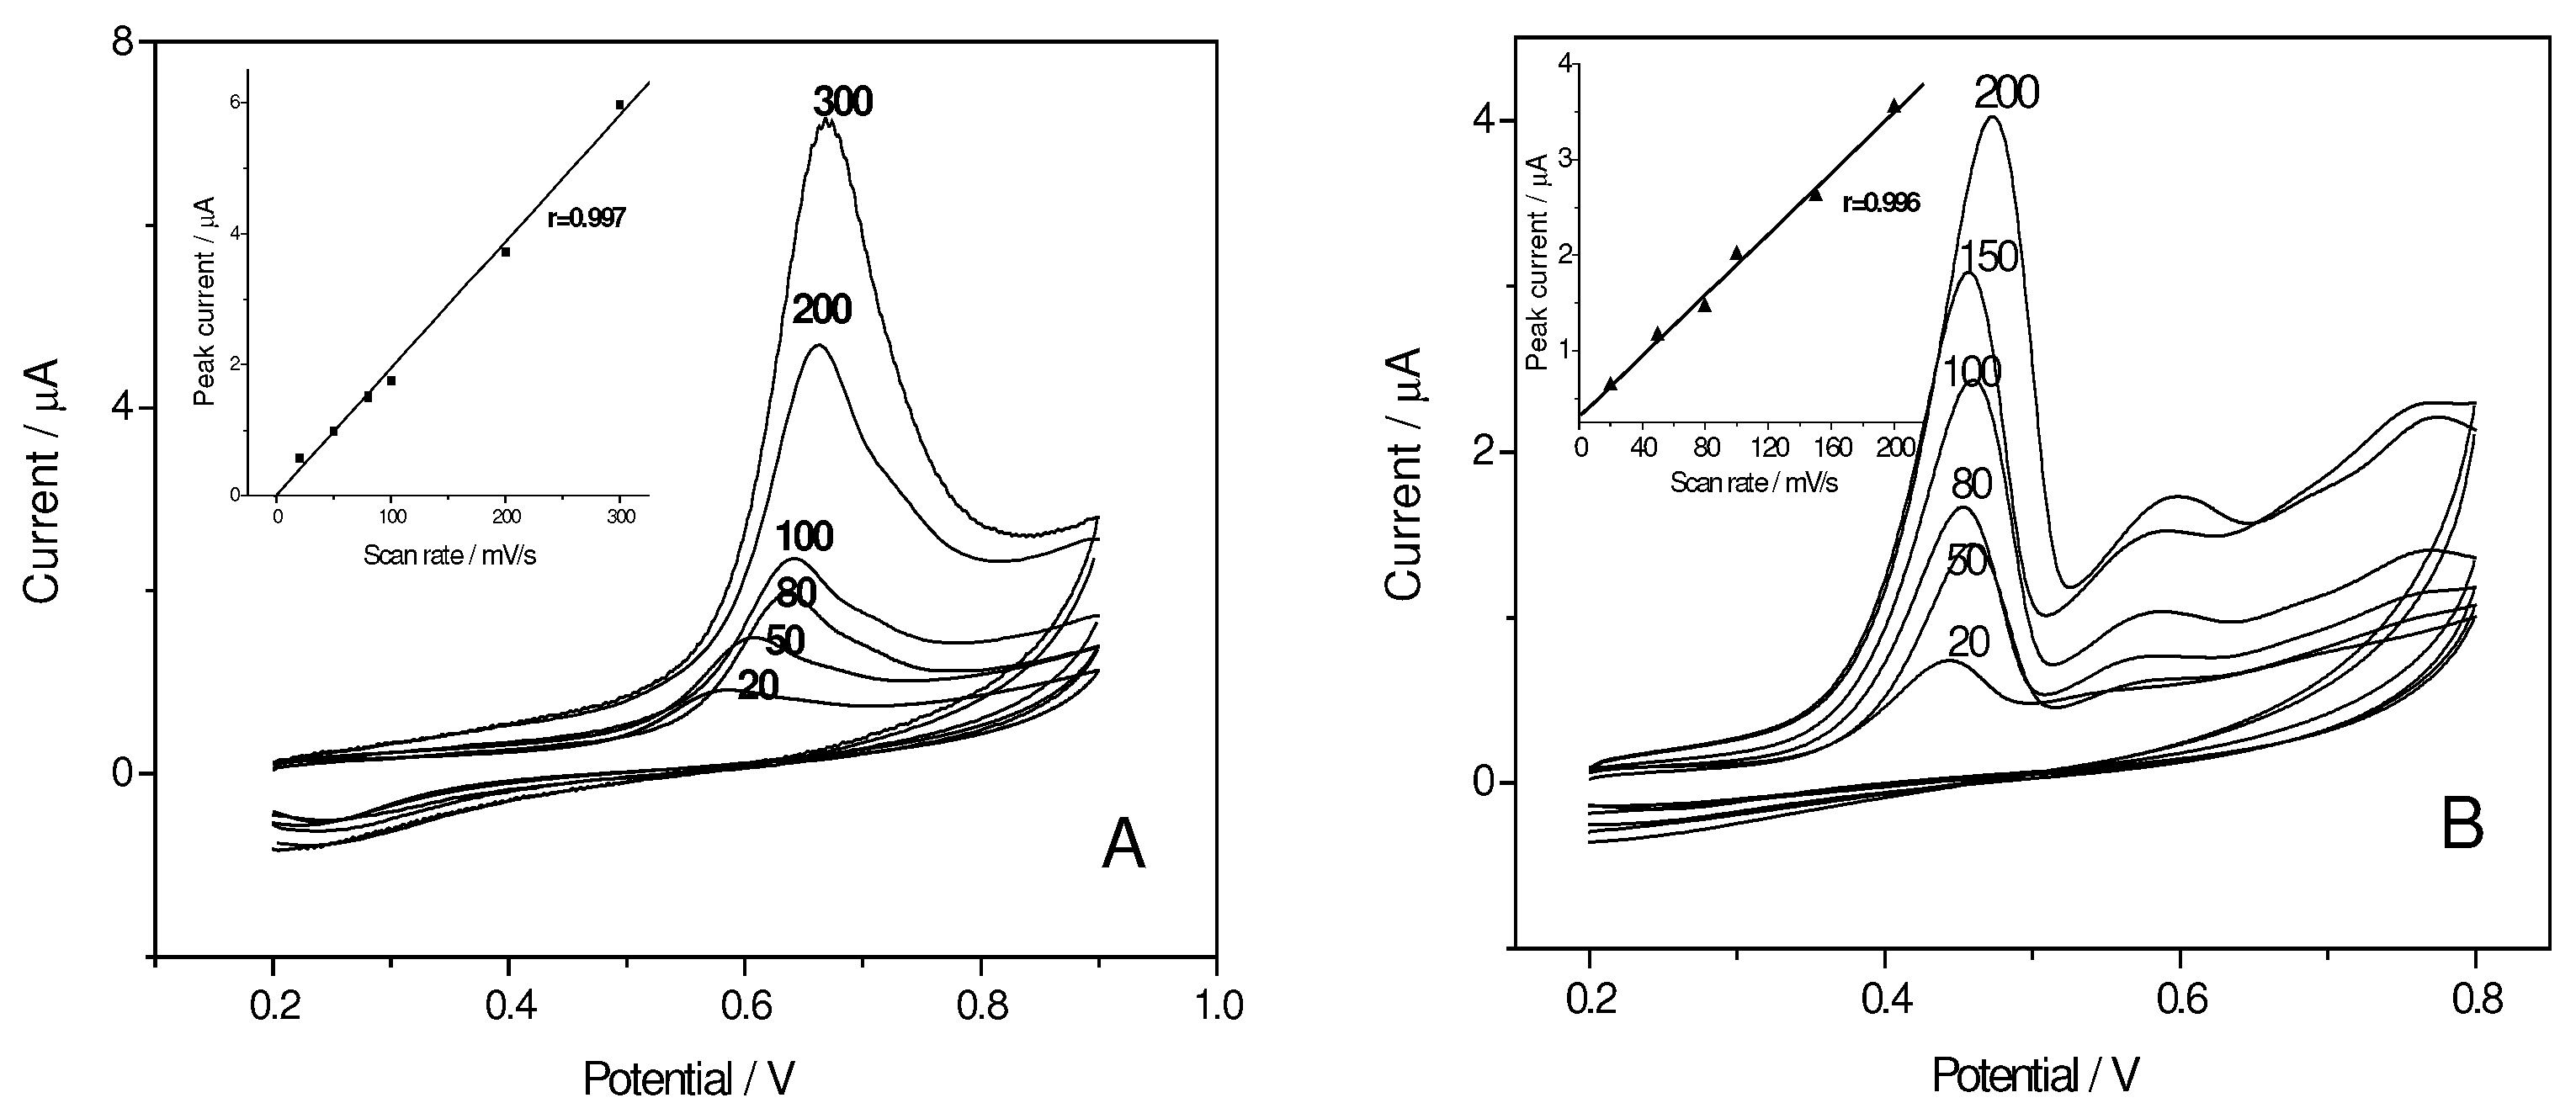
Variation of peak current and potential with scan rate

The influence of scan rate on the peak current and peak potential was examined. It was observed that the peak currents of prochlorperazine and ethopropazine were proportional to scan rate in the investigated range (Fig.4), indicating that their electrochemical processes were controlled by adsorption rather than by diffusion. The peak potential shifted positively with scan rate rising. What’s more, the Ep and lnv showed a linear relationship. According to the following equation:
Ep = E0’ + (RT/αnF) ln(RT/αnF)KS + (RT/αnF) lnv
The electron transfer coefficient (α) could be calculated. In this case, for prochlorpazine, the equation was Ep = 0.7225 +0.0278 lnv, therefore, α equaled to 0.422 (n = 2); for ethopropazine, Ep1 = 0.4906 + 0.01714 lnv (for peak 1) and Ep2 = 0.6206 + 0.1213 lnv (for peak 2), therefore, α1 = 0.729 (n = 1) and α2 = 0.516 (n = 1).

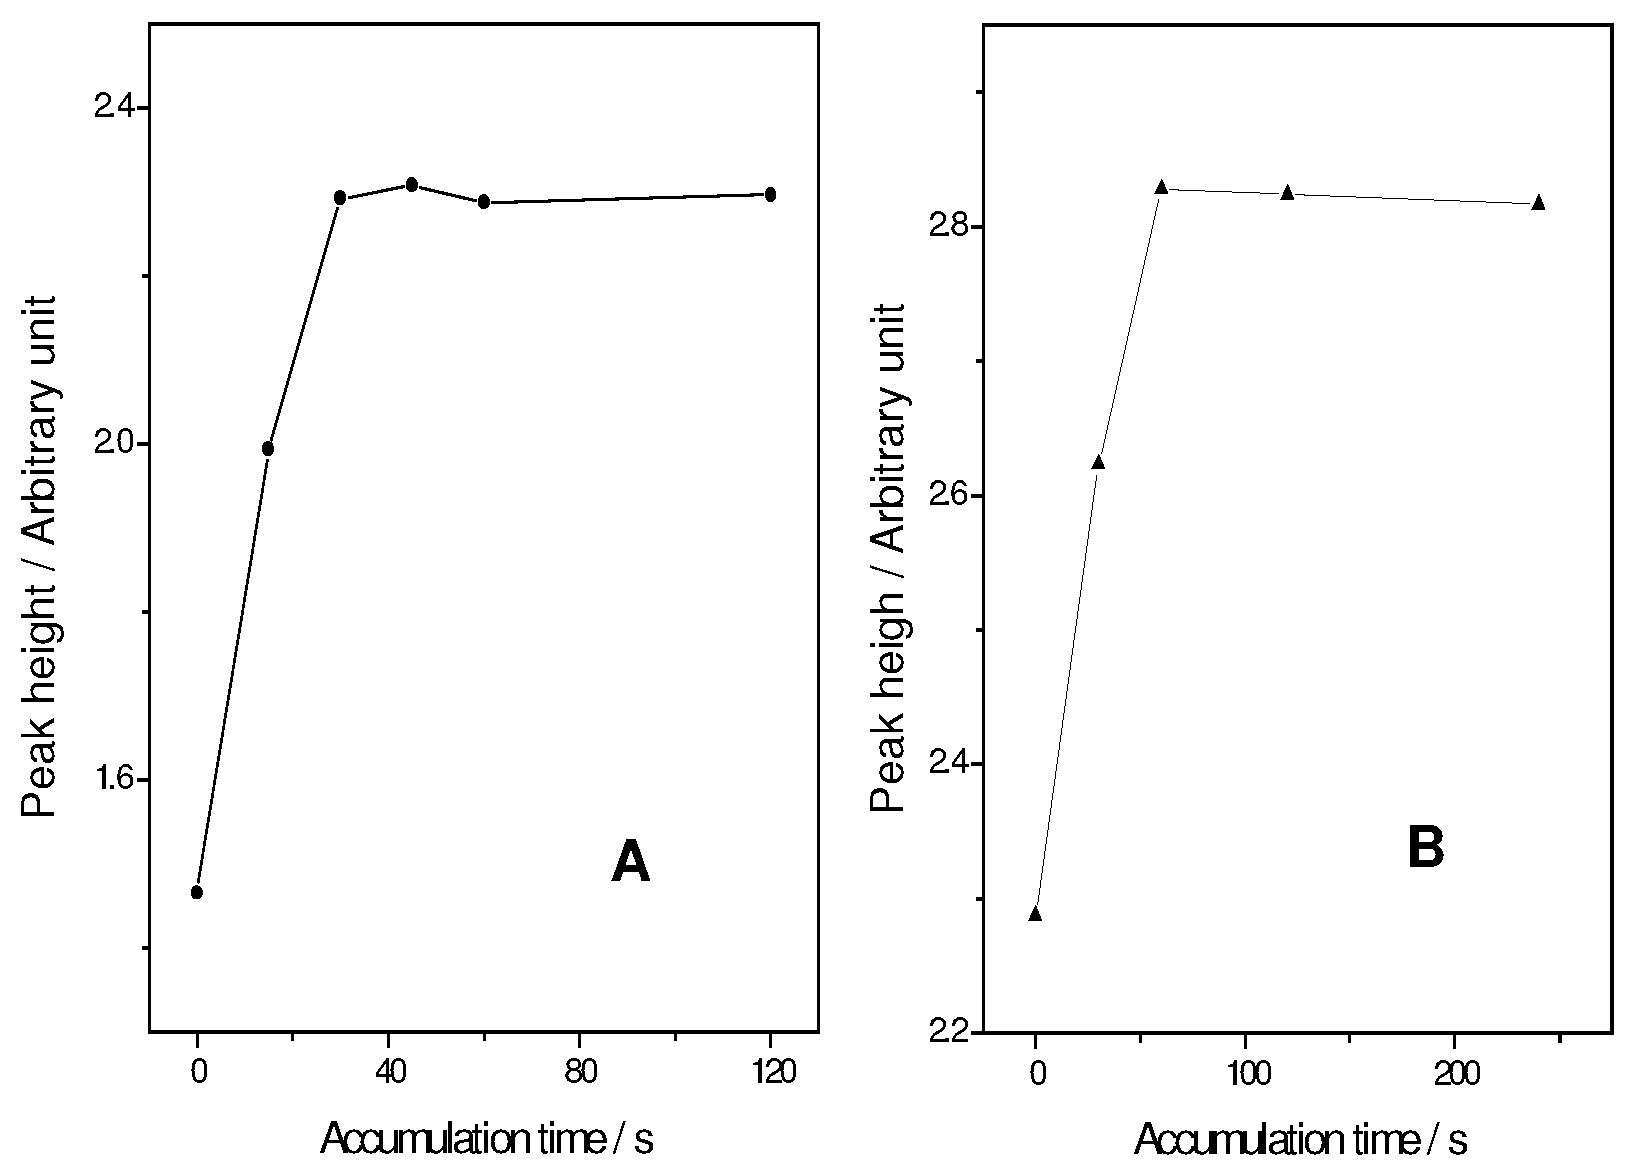
Influence of accumulation potential and time

Because the potential applied to the electrodes affects the accumulative efficiency during the adsorption step, the accumulation potential (Ed) was changed from –0.6 V to 0.4 V to explore its influence. For prochlorperazine, the peak current became higher when the accumulation potential shifted negatively. However, when the accumulation potential was lower than –0.4 V, the peak current decreased. For ethopropazine, the optimized accumulation potential was 0 V. Therefore, –0.4 V for prochlorperazine and 0 V for ethopropazine were chosen as accumulation potential, respectively.
Figure 4. CVs of 10 µM prochlorperazine (A) and ethopropazine (B) on DEC SAM/Au in a sodium carbonate buffer (pH 10). Scan rates are as marked on the curves, accumulation time: 60 s. Insert: variation of peak current with scan rate.
Sensors 03 00524 g004
Figure 5. Variation of peak current with accumulation time (td). (A) 10 µM prochlorperazine, Ed: -0.4 V; (B) 10 µM ethopropazine, Ed: 0 V. Other conditions as in Figure 1.
Sensors 03 00524 g005
The peak current of prochlorperazine was found to gradually increase with increasing accumulation time (td). When the accumulation time was beyond 30 s for 10 µM prochlorperazine, the peak current almost kept unchanged (Fig.5). The influence of accumulation time on ethopropazine’s peak current was similar to that of prochlorperazine and the peak current kept unchanged when accumulation time was more than 60 s (Fig.5). When their concentrations were at lower levels, more accumulation time was needed for their peak currents to reach maximum values. In general, an accumulation time of 60 s was used in experiments.

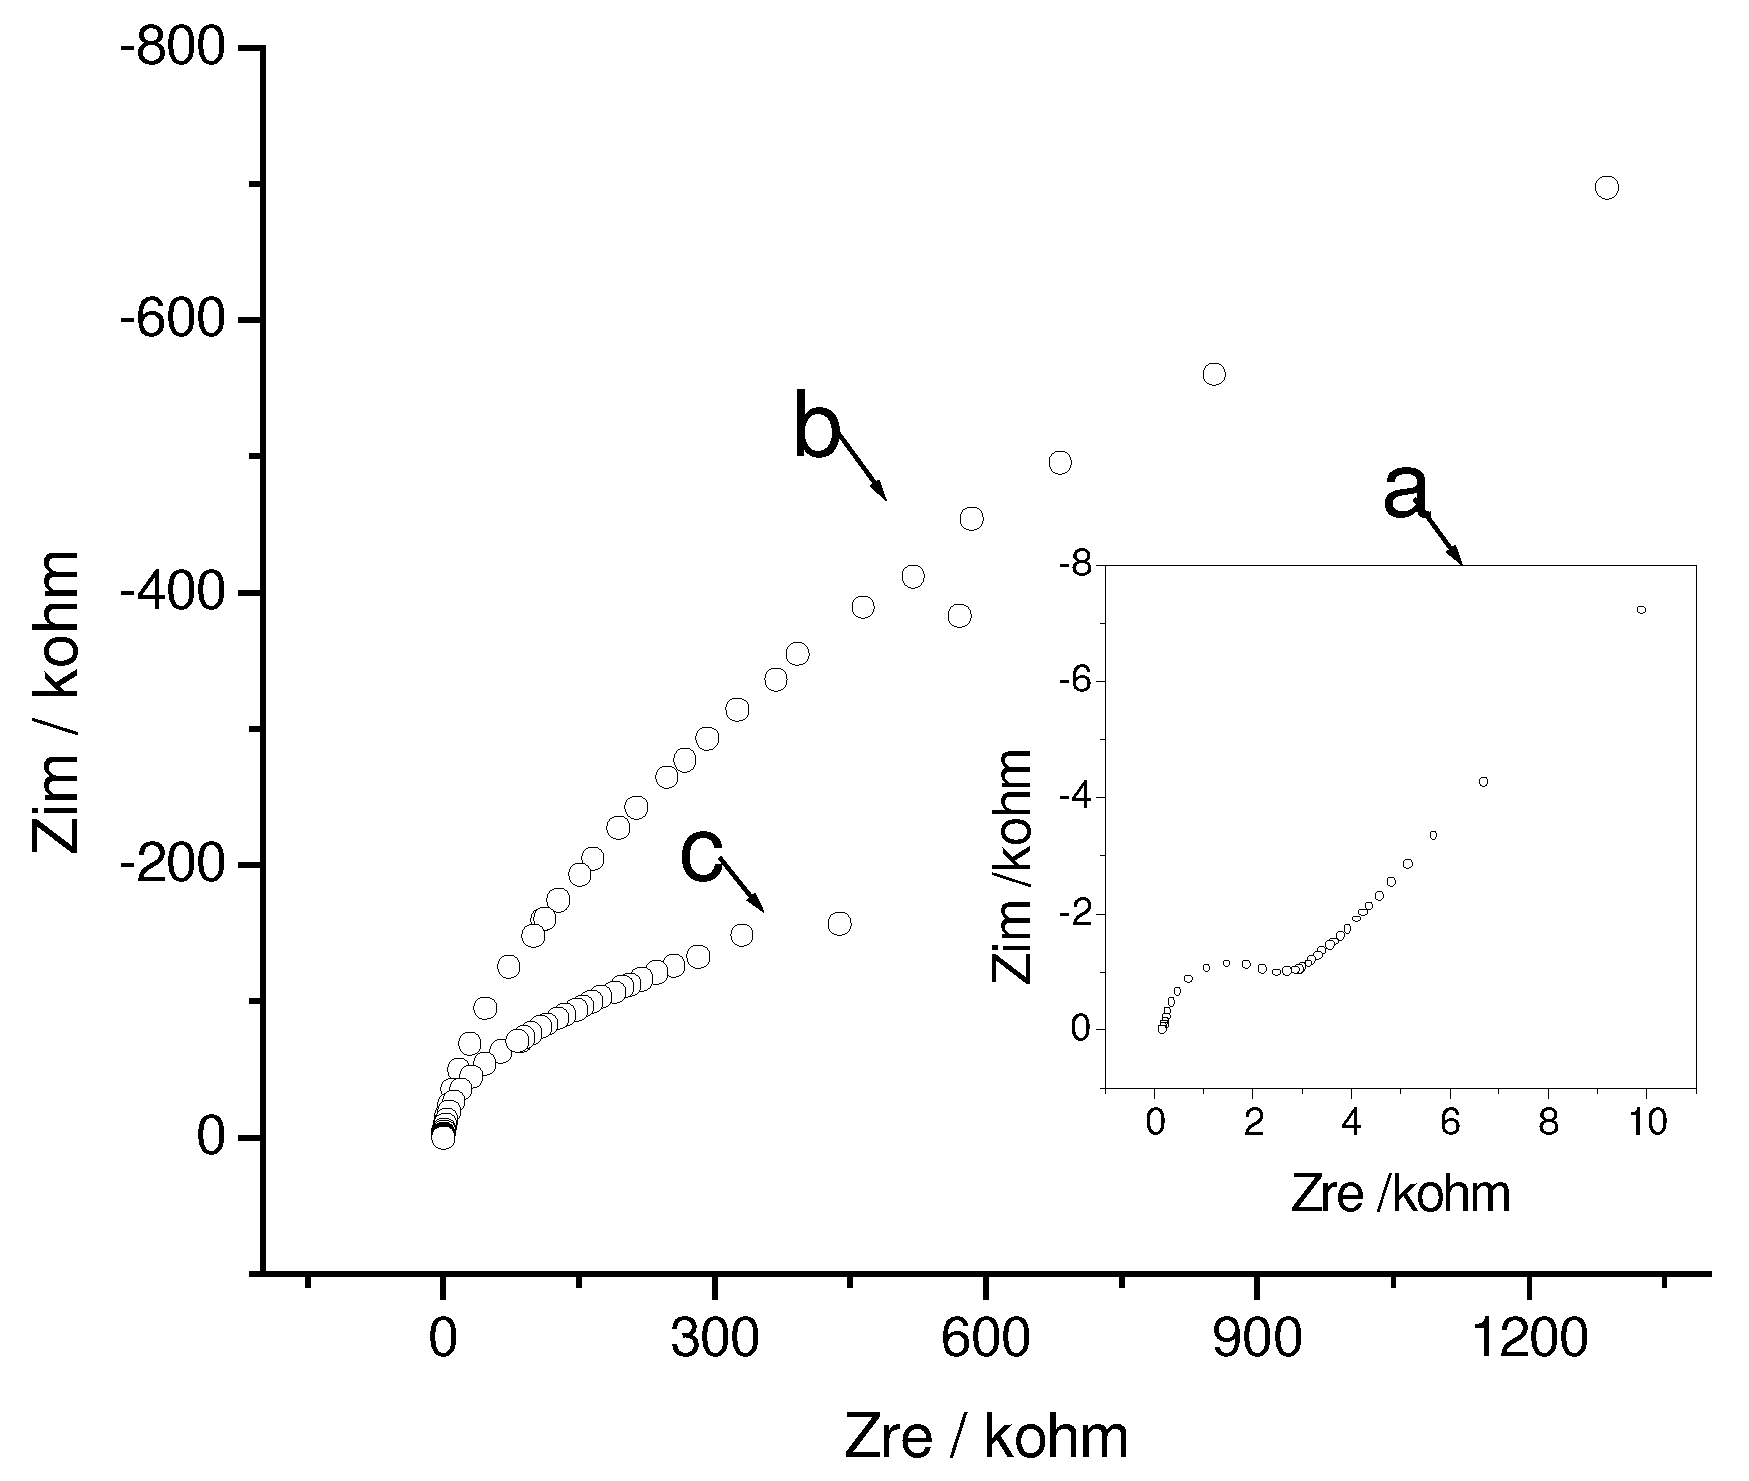
Influence of accumulated phenothiazines on the SAM structure

Fig. 6 shows the electrochemical impedance spectra (EIS) of a gold electrode under different conditions. As can be seen, for bare gold electrode the EIS curve had a small diameter, meaning the electrochemical probe potassium ferrocyanide could easily get the electrode surface. However, when the gold electrode was coated by DEC SAM, the EIS curve’s diameter increased greatly, meaning the transference of potassium ferrocyanide was seriously inhibited. When EIS was measured after the DEC/Au electrode was cycled or immersed in a prochlorperazine or ethopropazine solution (the EIS curve for ethopropazine was ignored), the EIS curve’s diameter (curve c) was far bigger than that of the bare gold electrode, but smaller than that of fresh prepared DEC/Au, indicating potassium ferrocyanide could transit the monolayer partially. This was attributed to the permeating of the phenothiazines in the SAM, which made the SAM become not so compact as that without phenothiazines and more needle holes appeared. Thus part ferrocyanide can transit the monolayer. Reflecting IR spectra of the electrode surface showed that there was phenothiazines in the monolayer.
Figure 6. Electrochemical impedance spectra. (a) a bare gold electrode, (b) DEC SAM/Au, (c) (b) after accumulating prochlorperazine or ethopropazine. Bias: 0.2 V; probe concentration: 1 mM Fe(CN)63−/Fe(CN)64−.
Sensors 03 00524 g006

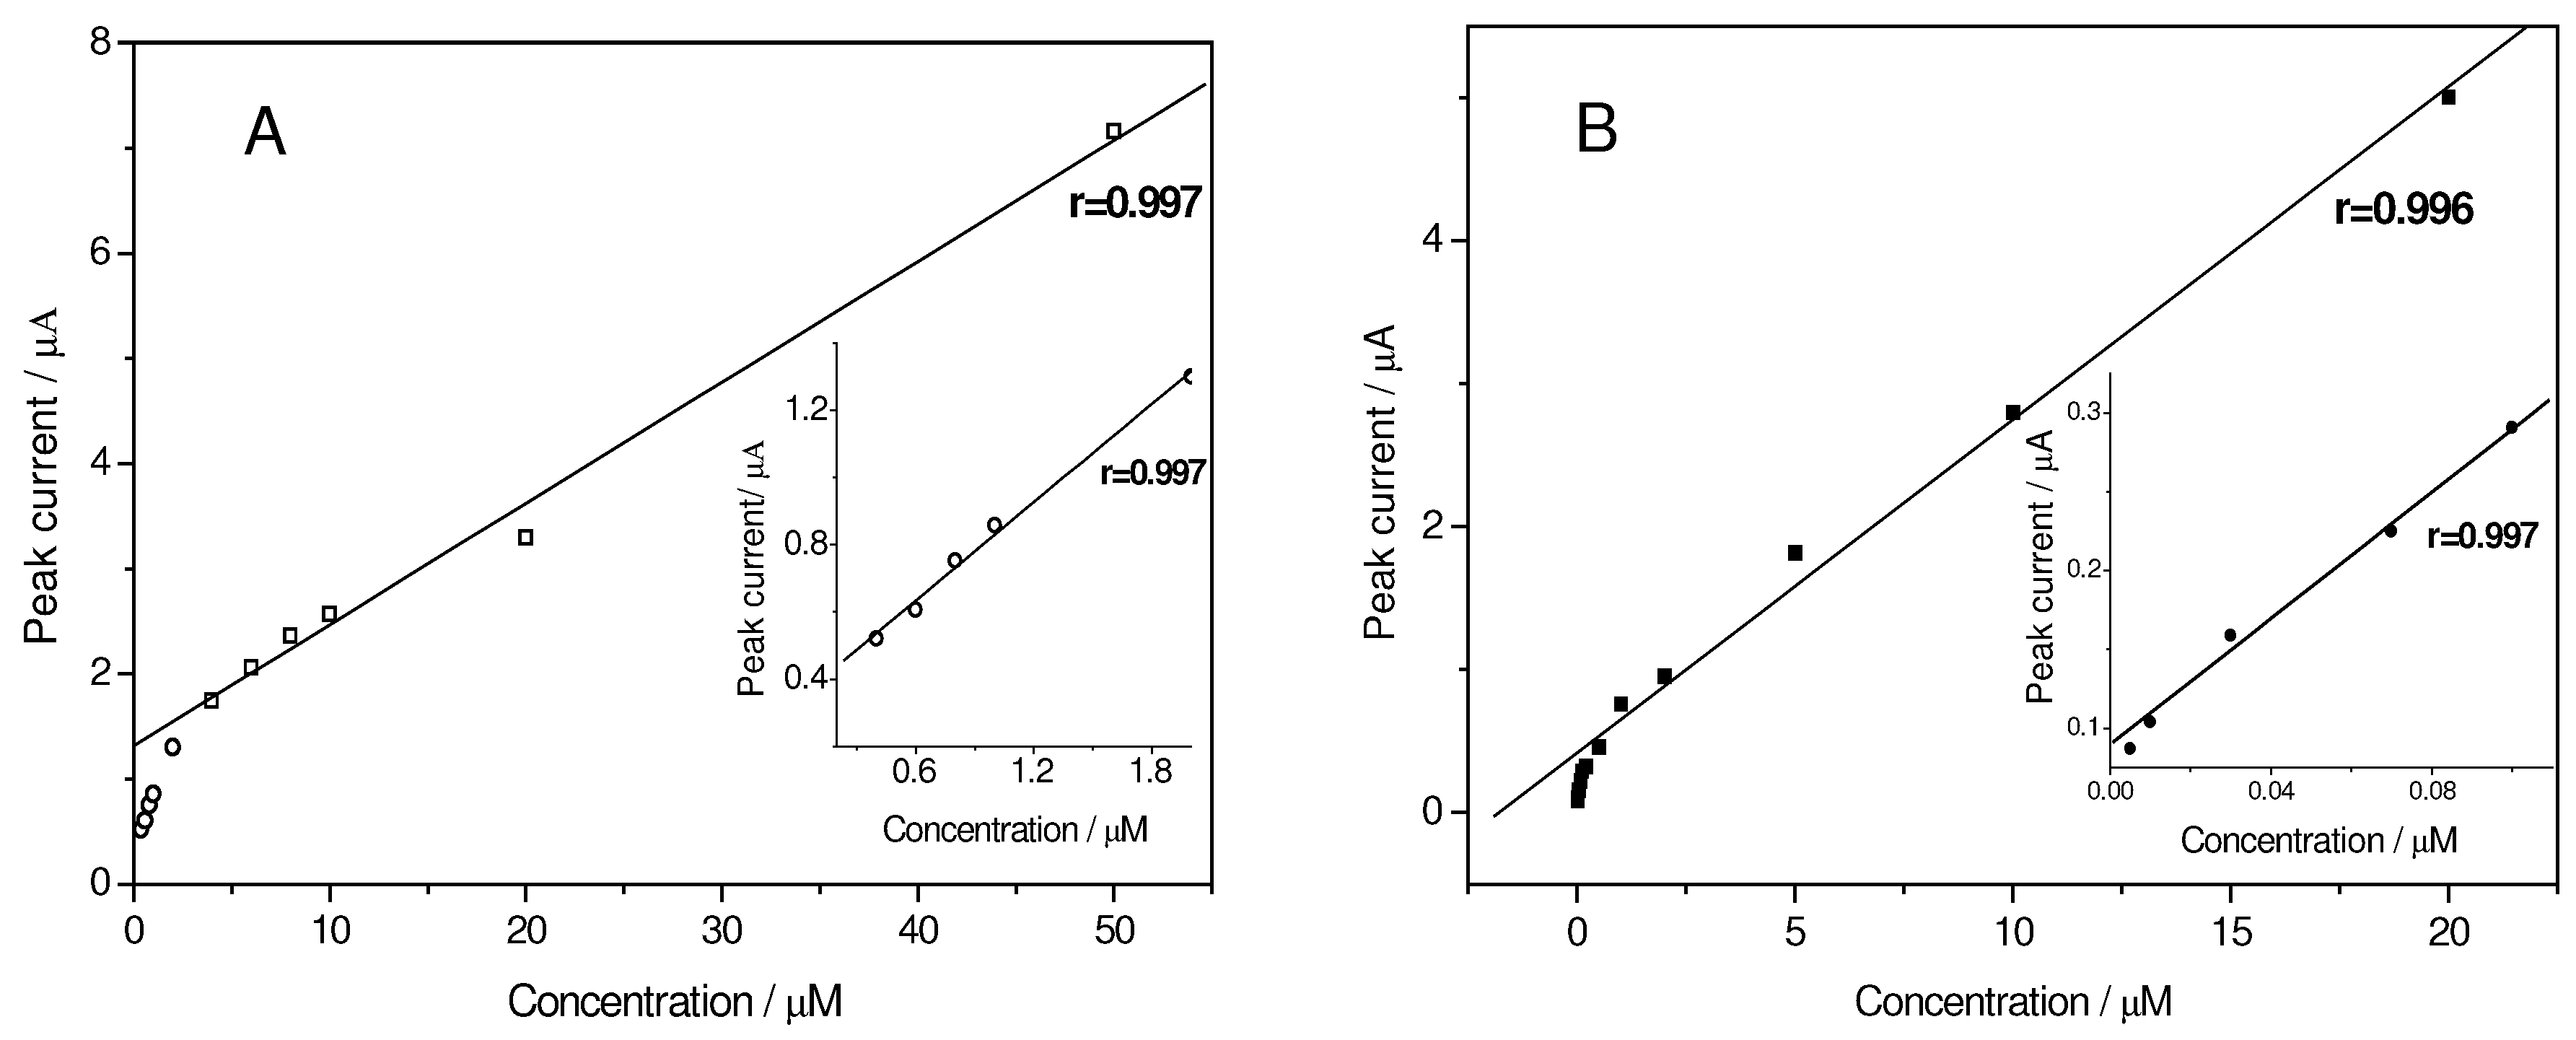
Linear calibration plot

The relationship between the peak current and their concentrations was studied. Under the selected conditions (i.e. for prochlorperazine, Ed=-0.4 V, td=60 s, 0.08 M pH 10.0 sodium carbonate buffer; for ethopropazine, Ed=0 V, td=60 s, 0.08 M pH 10.0 sodium carbonate buffer), the peak current was linear to prochlorperazine concentration over the ranges of 0.10 ~2.0 µM and 5.0 ~50 µM (Fig.7A). The linear regression equations were ip(µA)=0.384+0.2896c (µM) (r=0.9967) and ip(µA)=1.379+0.1078c (µM) (r=0.9965) respectively. The peak current changed slowly and at last almost kept unchanged when prochlorperazine concentration exceeded 50 µM. For ethopropazine the ip~c plots showed linear relationship over the concentration ranges of 10.0 nM ~ 0.10 µM and 0.5 µM ~ 20 µM (Fig.7B). The determination limit of ethopropazine was about 5.0 nM when preconcentration time was 60 s. Eight successive determinations of 1.0 µM prochlorperazine gave a precision (in terms of the relative standard derivation) of 4.28%.
Figure 7. Dependence of peak current on porchlorperazine (A) or ethopropazine (B) concentration. (A) td: 60 s, Ed: –0.4 V; (B) td: 60 s, Ed: 0 V. Other conditions as in Figure 1. Insert: the linear calibration plot of prochlorperazine/ ethopropazine at lower concentration level.
Sensors 03 00524 g007

Interference of coexistent matrix

The interference of several metal ions such as Zn2+, Cd2+, Pb2+, Cu2+, Fe3+, Ca2+ and Mg2+ were investigated. It was found that their interference under the experimental conditions could be negligible for quantitative analysis when their concentrations were 100-fold of prochlorperazine or more. Anions such as SO4 2−, NO3 , Cl, PO4 3−, Ac, BrO3 , ClO4 and NO2 did not interfere the determination of prochlorperazine when their concentrations were 500-fold of its. Cationic and non-ionic surfactants, e.g. dodecyltrimethylammonium chloride, cetyltrimethylamonium bromide, TritonX-100 and Tween 20 can make the peak decrease and even disappear. This was ascribed to the interaction between them and prochlorperazine and their adsorption at the SAM, which hindered the accumulation of prochlorperazine at the SAM. Anionic surfactant sodium dodecyl sulfate and sodium dodecylbenzenesulfonate made the peak current increase when their concentrations were at micro molar level, but at higher concentration they can make the peak height reduce.
Interference from compounds with electrochemical activity or/and reductive activity, including chloramphenicol, epinephrine, sodium sulfite and ascorbic acid (AA) also was examined. It was observed that the peak current (ip) of prochlorperazine increased with the addition of them. Therefore, their existence would affect the exact determination of prochlorperazine. This was attributed to their oxidation catalyzed by the oxidation product of prochlorperazine, which caused catalytic current. Therefore, in the presence of the reductants a catalytic cycle occurred and the peak current increased (e.g. Table 1). The influence of coexistents on the peak height of ethopropazine was similar to that of prochlorperazine (e.g. Table 1). The interference of some coexistent can be reduced or eliminated by adding proper reagents such as EDTA (for metal ion interference). On the other hand, adsorption-transfer stripping voltammetry can be used for such purpose since prochlorperazine and ethopropazine were entrapped in the SAM strongly.
Table 1. Variation of peak current with ascorbic acid (AA) concentration. Concentration of prochlorperazine and ethopropazine: 10 µM, other conditions as in Figure 7.
AA concentration / µM0.01.05.010
ip (prochlorperazine) / µA2.0242.2593.7026.384
ip (ethopropazine) / µ A1.85762.8056.9399.919

Conclusions

Prochlorperazine and ethopropazine can be entrapped at DEC SAM/Au, which makes the SAM structure change and more pin-hole appear. When the potential was made move positively, the accumulated prochlorperazine exhibited an anodic peak at about 0.6 V and the ethopropazine caused two anodic peaks at about 0.4 V and 0.5 V in pH 10 sodium carbonate buffer. The peak currents of them were linear to their concentration over certain ranges, thus the peaks can be used for the determination of them. In the presence of some reductants the peaks would grow due to the catalytic oxidation of the reductants.

Acknowledgement

This work was supported by the National Nature Science Foundation of China (Grant No. 20173040) and the Electroanalytical Open Lab of Application Chemistry Institute of Changchun, China.

References

  1. Belal, F.; El-Ashry, S. M.; Shehata, I, M.; El-Sherbeny, A.; El-Sherbeny, D. T. Differential pulse polarographic determination of some N-substituted phenothiazine derivatives in dosage forms and urine through treatment with nitrous acid. Microchem. Acta 2000, 135, 147–154. [Google Scholar] [CrossRef]
  2. Ni, Y.; Wang, L.; Kokot, S. Voltammetric determination of chlorpromazine hydrochloride with the use of multivariate calibration. Anal. Chim. Acta 2001, 439, 159–168. [Google Scholar] [CrossRef]
  3. Tarasiewicz, M.; Kwymicka, L. Extractive spectrophotometric determination of some phenothiazines with picric and flavianic acids. Anal. Lett. 1996, 31, 929–936. [Google Scholar] [CrossRef]
  4. Basabaiah, K.; Krishmurthy, G. Spectrophotometric assay of some antipsychotropic and anticholinergic phenothiazine drugs using ammonium molybdate. Anal. Lett. 1998, 31, 1037–1046. [Google Scholar] [CrossRef]
  5. Revanasiddappa, M.; Ramappa, P. G. Spectrophotometric determination of some phenothiazine drugs. Talanta 1996, 43, 1291–1296. [Google Scholar] [CrossRef]
  6. Lopezpaz, J. L.; Townshend, A. Flow injection chemiluminescence determination of imipramine and chlorpromazine. Anal. Commun. 1996, 33, 31–33. [Google Scholar]
  7. Stevenson, D.; Reid, E. Determination of chlorpromazine and its sulfoxide and 7-hydroxy metabolites by ion-pair high pressure liquid chromatography. Anal. Lett. 1981, 14, 1785–1805. [Google Scholar] [CrossRef]
  8. Korpinsk, J.; Starczewska, B.; Puzahowska-Tarasiewicz, H. Analytical properties of 2- and 10-disubstituted phenothiazine derivatives. Anal. Sci. 1996, 12, 161–170. [Google Scholar] [CrossRef]
  9. Golabi, S. M.; Showkati-Shishvan, M. Potentiometric titration of phenothiazine compounds in chloroform and its use in pharmaceutical analysis. Talanta 1991, 38, 1253–1256. [Google Scholar] [CrossRef]
  10. Pournaghi-Azar, M. H.; Farhadi, K. Potentiometric study of reaction between tetrabutylammonium periodate and phenothiazines in chloroform: application to the analysis of phenothiazine derivatives. Talanta 1997, 44, 1773–1781. [Google Scholar] [CrossRef]
  11. Bishop, E.; Hussein, W. Electroanalytical studies of phenothiazine neuroleptics at gold and platinum electrodes. Analyst 1984, 109, 229–234. [Google Scholar] [CrossRef]
  12. Wang, J.; Rivas, G.; Cai, X.; Shiraishi, H.; Farias, P. A. M.; Dontha, N.; Luo, D. Accumulation and trace measurements of phenothiazine drugs at DNA modified electrodes. Anal. Chim. Acta 1996, 332, 139–144. [Google Scholar] [CrossRef]
  13. Gooding, J. J.; Mearns, F.; Yang, W.; Liu, J. Self-assembled monolayers into the 21st century: recent advances and applications. Electroanalysis 2003, 15, 81–96. [Google Scholar] [CrossRef]
  14. Zeng, B.; Ding, X.; Zhao, F. Accumulative and stripping behavior of silver ion at 1,4-dithiothereitol SAM modified gold electrode. Talanta 2003, 59, 510–515. [Google Scholar] [CrossRef]
  15. Jung, S. K.; Wilson, G. S. Polymeric mercaptosilane-modified platinum electrodes for elimination of interferants in glucose biosensors. Anal. Chem. 1996, 68, 591–596. [Google Scholar] [CrossRef] [PubMed]
  16. Zeng, B.; Yang, Y.; Zhao, F. Voltammetric determination of epinephrine with a 3-mercaptopropionic acid self-assembled monolayer modified gold electrode. Electroanalysis 2003, 15, 1054–1059. [Google Scholar] [CrossRef]
  17. Duan, C.; Meyerhoff, M. E. Separation-free sandwich enzyme immunoassays using microporous gold electrode and self-assembled monolayer/immobilized capture antibodies. Anal. Chem. 1994, 66, 1369–1377. [Google Scholar] [CrossRef] [PubMed]
  18. Wang, J.; Wu, H.; Angnes, L. On –line monitoring of hydrophobic compounds at self-assembled monolayer modified amperometric flow detectors. Anal. Chem. 1993, 65, 1893–1896. [Google Scholar] [CrossRef]
  • Sample Availability: Available from the authors.

