Electrochemical oxidation of thiourea at bare Pt-electrode
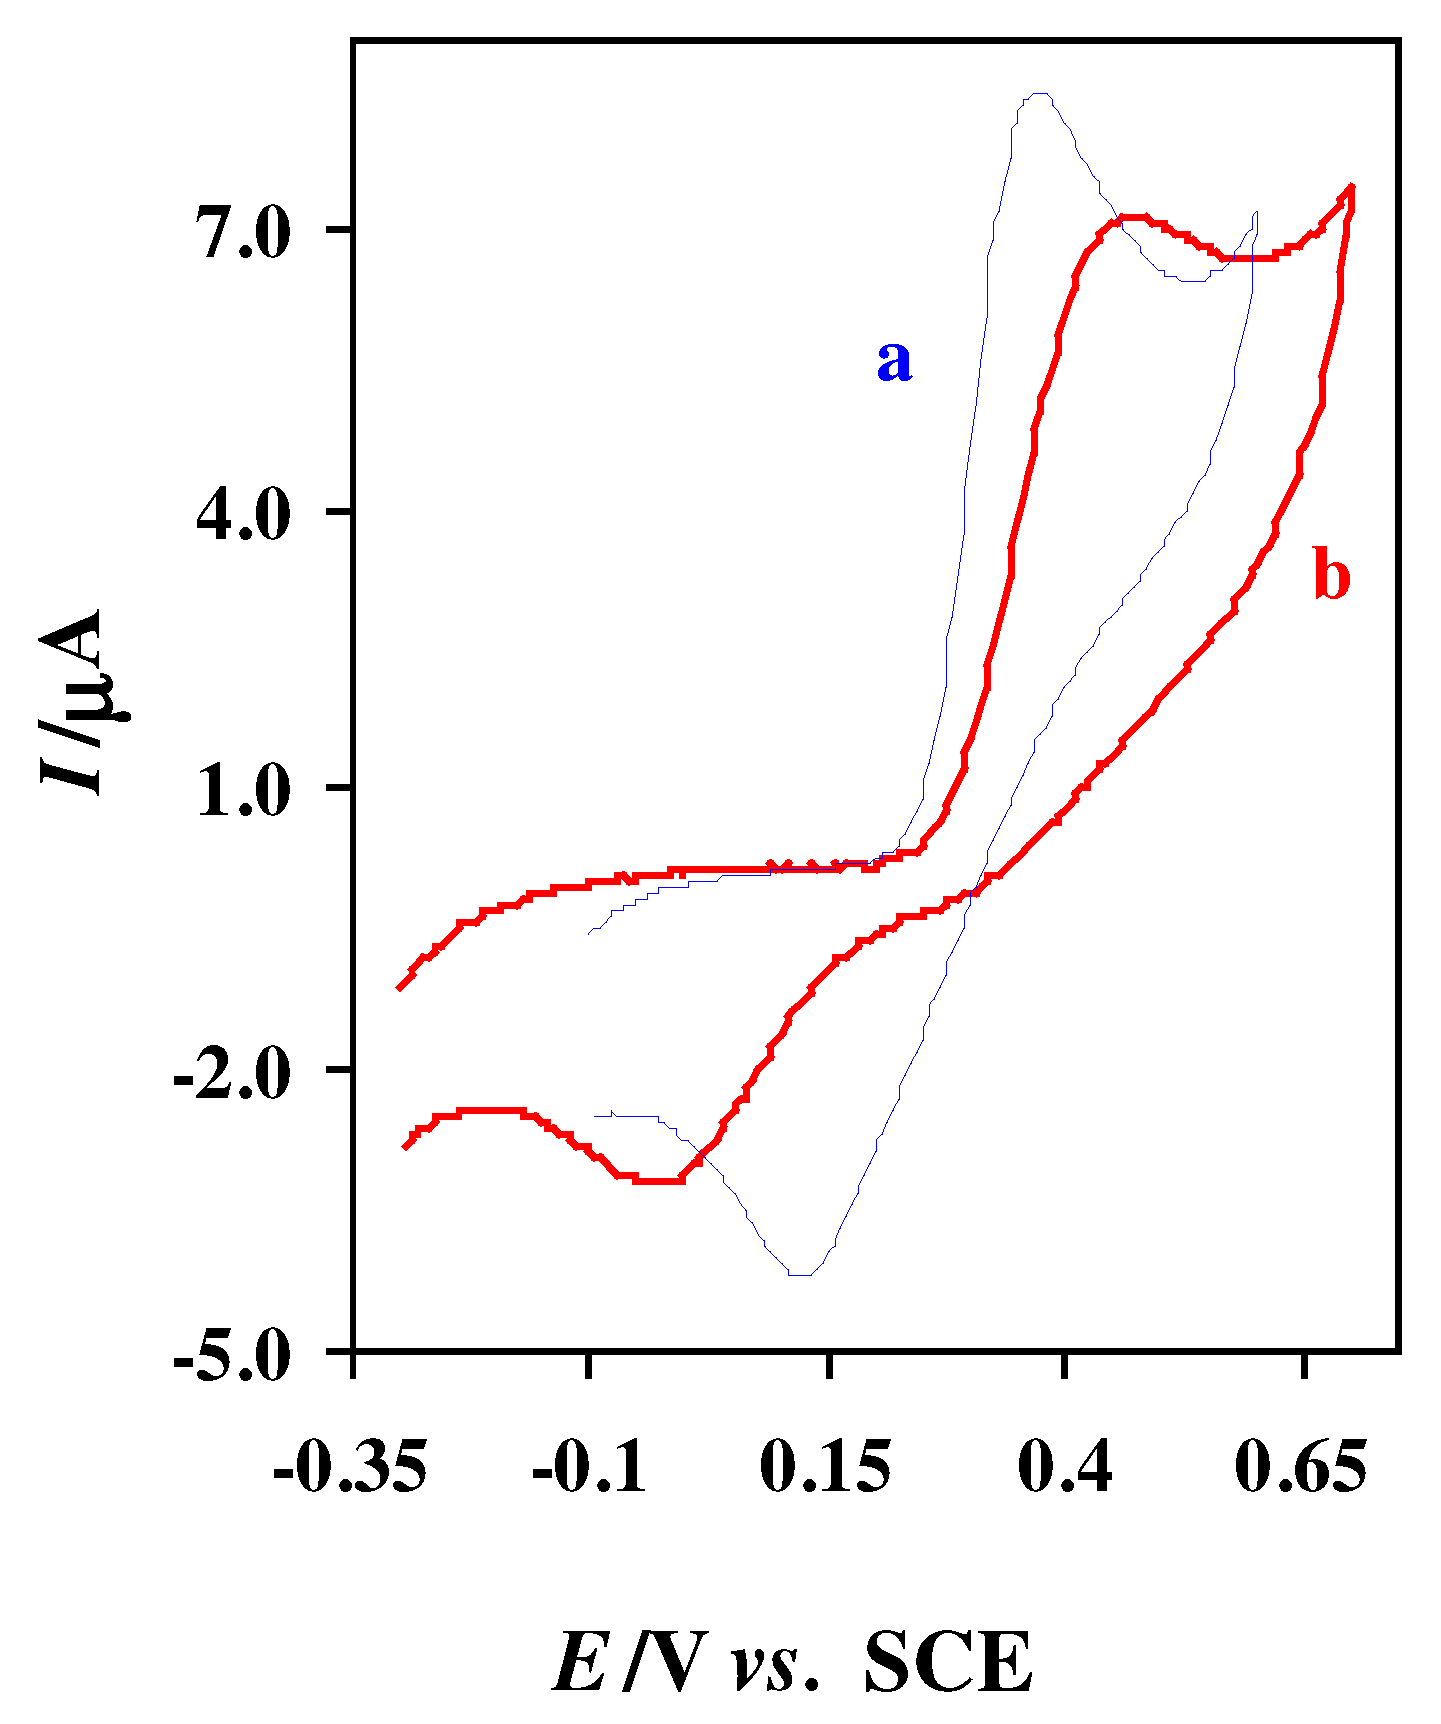
Electrochemical study of 0.75 mM thiourea in acetate buffer solution (C = 0.15 M, pH = 4.5) at bare Pt electrode has been studied using cyclic voltammetry (
Fig. 1, curve a). The voltammogram shows one anodic (A
1) and corresponding cathodic peak (C
1), at 0.47 V and –0.03 V, respectively, which correspond to the transformation of thiourea to c,c’-dithiodiformamidinium ion and vice versa within a quasi-reversible (
Scheme 1) [
24].
Figure 1.
Experimental (curve a) and simulated (curve b) cyclic voltammograms of thiourea at bare Pt electrode in acetate buffer solution (C = 0.15 M, pH = 4.5). Scan rate, 50 mV/s. Thiourea concentration, 0.75 mM.
Figure 1.
Experimental (curve a) and simulated (curve b) cyclic voltammograms of thiourea at bare Pt electrode in acetate buffer solution (C = 0.15 M, pH = 4.5). Scan rate, 50 mV/s. Thiourea concentration, 0.75 mM.
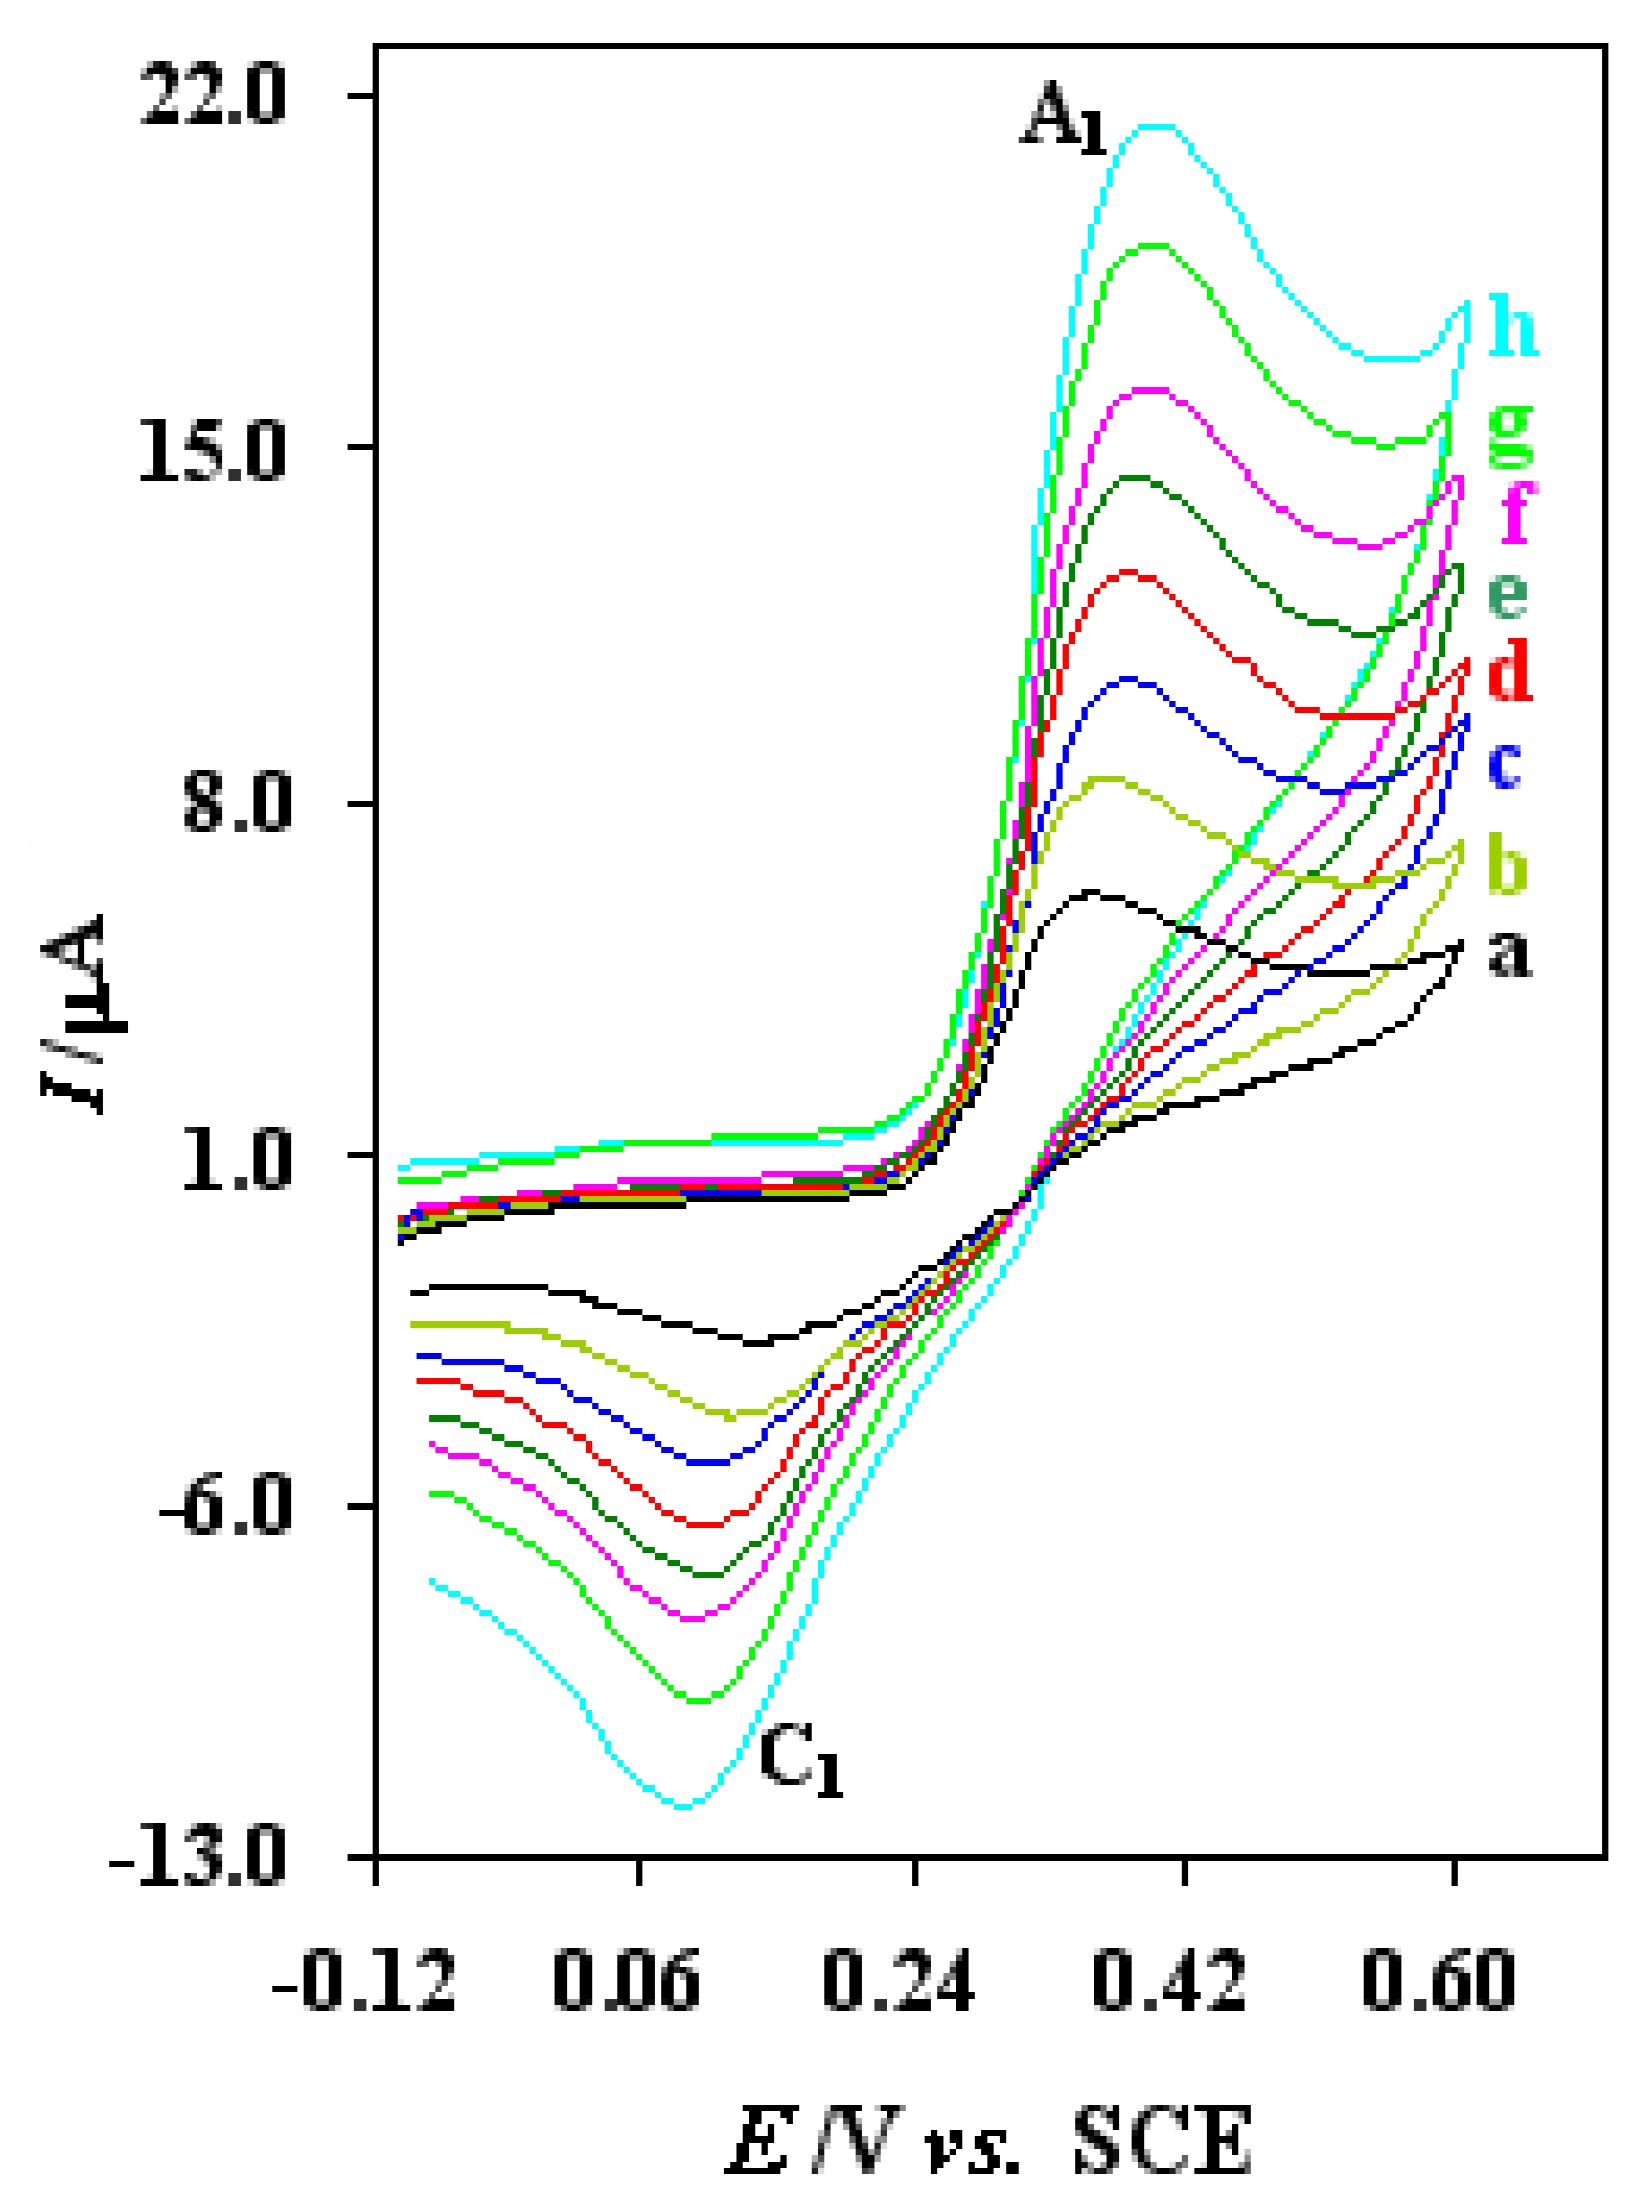
In this case, the peak separation is about 500 mV and increase with increasing the potential scan rate (
Fig. 2). In addition, anodic peak current (I
pa) increased linearly with the square root of scan rate in the range of 25-400 mV/s, as expected for diffusion-controlled process, with the regression equation of I
p=0.869 + 0.799
v1/2 (I
p: μA,
v: mV/s, r = 0.999) (
Fig. 2, inset). The electrochemical oxidation of thiourea at unmodified Pt electrode tested by digital simulation, and the heterogeneous electron transfer rate constant has been estimated by comparison of the simulation result with experimental cyclic voltamogram (
Fig. 1, curve b). The transfer coefficient (α) was assumed to be 0.6, and the formal potentials were obtained experimentally as the average of the two peak potentials observed in cyclic voltammetry. The calculated heterogeneous electron transfer rate constant is 7.5 × 10
−5 cm/s.
Figure 2.
Typical voltammograms of 0.75 mM of thiourea at bare Pt electrode (2 mm diameter) in acetate buffer solution (C = 0.15 M, pH = 4.5) at various scan rates. Scan rates from (a) to (h) are: 25, 50, 80, 120, 170, 225, 306 and 400 mV/s, respectively. Inset: variation of anodic peak current (Ipa) versus square root of scan rate; (I) at bare Pt electrode, (II) at alumina Pt modified electrode. T= 25 ± 1 °C.
Electrochemical oxidation of thiourea at alumina modified Pt electrode
Electrochemical study of 0.75 mM thiourea in acetate buffer solution (C = 0.15 M, pH = 4.5) at alumina modified Pt electrode has been studied using cyclic voltammetry (
Fig. 3, curve a). A pair of redox peaks of thiourea was observed comparing with small peaks on bare Pt electrode. The oxidation potential shifted to the negative direction and the peak current increased compared with the cyclic voltammograms at the unmodified electrode (
Fig. 3, curve b), because the modified electrode accelerated the rate of electron transfer of thiourea. Moreover, the peak separation (ΔE
p) decreased about 250 mV (E
pa= 0.37, E
pc=0.12 V
vs. SCE).
Figure 3.
Cyclic voltammograms of thiourea at modified (curve a) and unmodified (curve b) Pt electrode in acetate buffer solution (C = 0.15 M, pH = 4.5). Scan rate, 50 mV/s. Thiourea concentration, 0.75 mM.
Figure 3.
Cyclic voltammograms of thiourea at modified (curve a) and unmodified (curve b) Pt electrode in acetate buffer solution (C = 0.15 M, pH = 4.5). Scan rate, 50 mV/s. Thiourea concentration, 0.75 mM.
In addition, the scan rate dependence of modified electrode in 0.75 mM thiourea was also studied (
Fig. 5). As the scan rate increased, the anodic peak current (I
pa) increased linearly with the square root of scan rate in the range from 25 to 400 mV/s, with the regression equation of I
p=1.597 + 0.911
v1/2 (I
p: μA,
v: mV/s, r = 0.999) (Fig. 2, inset). It demonstrates that this electrode reaction is concerned with the diffusion process. The slope is proportional to the standard rate constant and indicates the significant improvements in oxidation of thiourea at alumina modified Pt electrode surface. The electrochemical oxidation of thiourea at modified Pt electrode tested by digital simulation, and the heterogeneous electron transfer rate constant has been estimated by comparison of the simulation result with experimental cyclic voltamogram (
Fig. 4). The transfer coefficient (α) was assumed to be 0.6, and the formal potentials were obtained experimentally as the average of the two peak potentials observed in cyclic voltammetry. In this case, the calculated heterogeneous electron transfer rate constant is 6.0 × 10
−4 cm/s.
Fig. 4, curve d, is simulated cyclic voltamogram according to transfer coefficient, 0.6 and heterogeneous rate constant is 6.0 × 10
−4 cm/s at 120 mV/s. The heterogeneous rate constant increased compared with the rate constant obtained at unmodified electrode, because of the acceleration of the rate of electron transfer at the surface of modified electrode.
Figure 4.
Experimental and simulated cyclic voltammograms of thiourea at alumina modified Pt electrode in acetate buffer solution (C = 0.15 M, pH = 4.5). (a) and (c): experimental, (b) and (d): simulated cyclic voltammograms. (a) and (b) scan rate 50 mV/s, (c) and (d) scan rate 120 mV/s. Thiourea concentration, 0.75 mM.
Figure 5.
Typical voltammograms of 0.75 mM of thiourea at alumina modified Pt electrode (2 mm diameter) in acetate buffer solution (C = 0.15 M, pH = 4.5) at various scan rates. Scan rates from (a) to (h) are: 25, 50, 80, 120, 170, 225, 306 and 400 mV/s, respectively T= 25 ± 1 °C.
Figure 5.
Typical voltammograms of 0.75 mM of thiourea at alumina modified Pt electrode (2 mm diameter) in acetate buffer solution (C = 0.15 M, pH = 4.5) at various scan rates. Scan rates from (a) to (h) are: 25, 50, 80, 120, 170, 225, 306 and 400 mV/s, respectively T= 25 ± 1 °C.
Interference study
In order to assess the possible analytical application of the described method, the effect of concomitant species on the determination of thiourea was studied by analyzing synthetic sample solutions containing 5.0 × 10
−4 of thiourea and various excess amounts of some organic and inorganic substances. The results are shown in
Table 1. As
Table 1 shows, most of the ions did not interfere, even present in 400-fold excess over thiourea.
Figure 6.
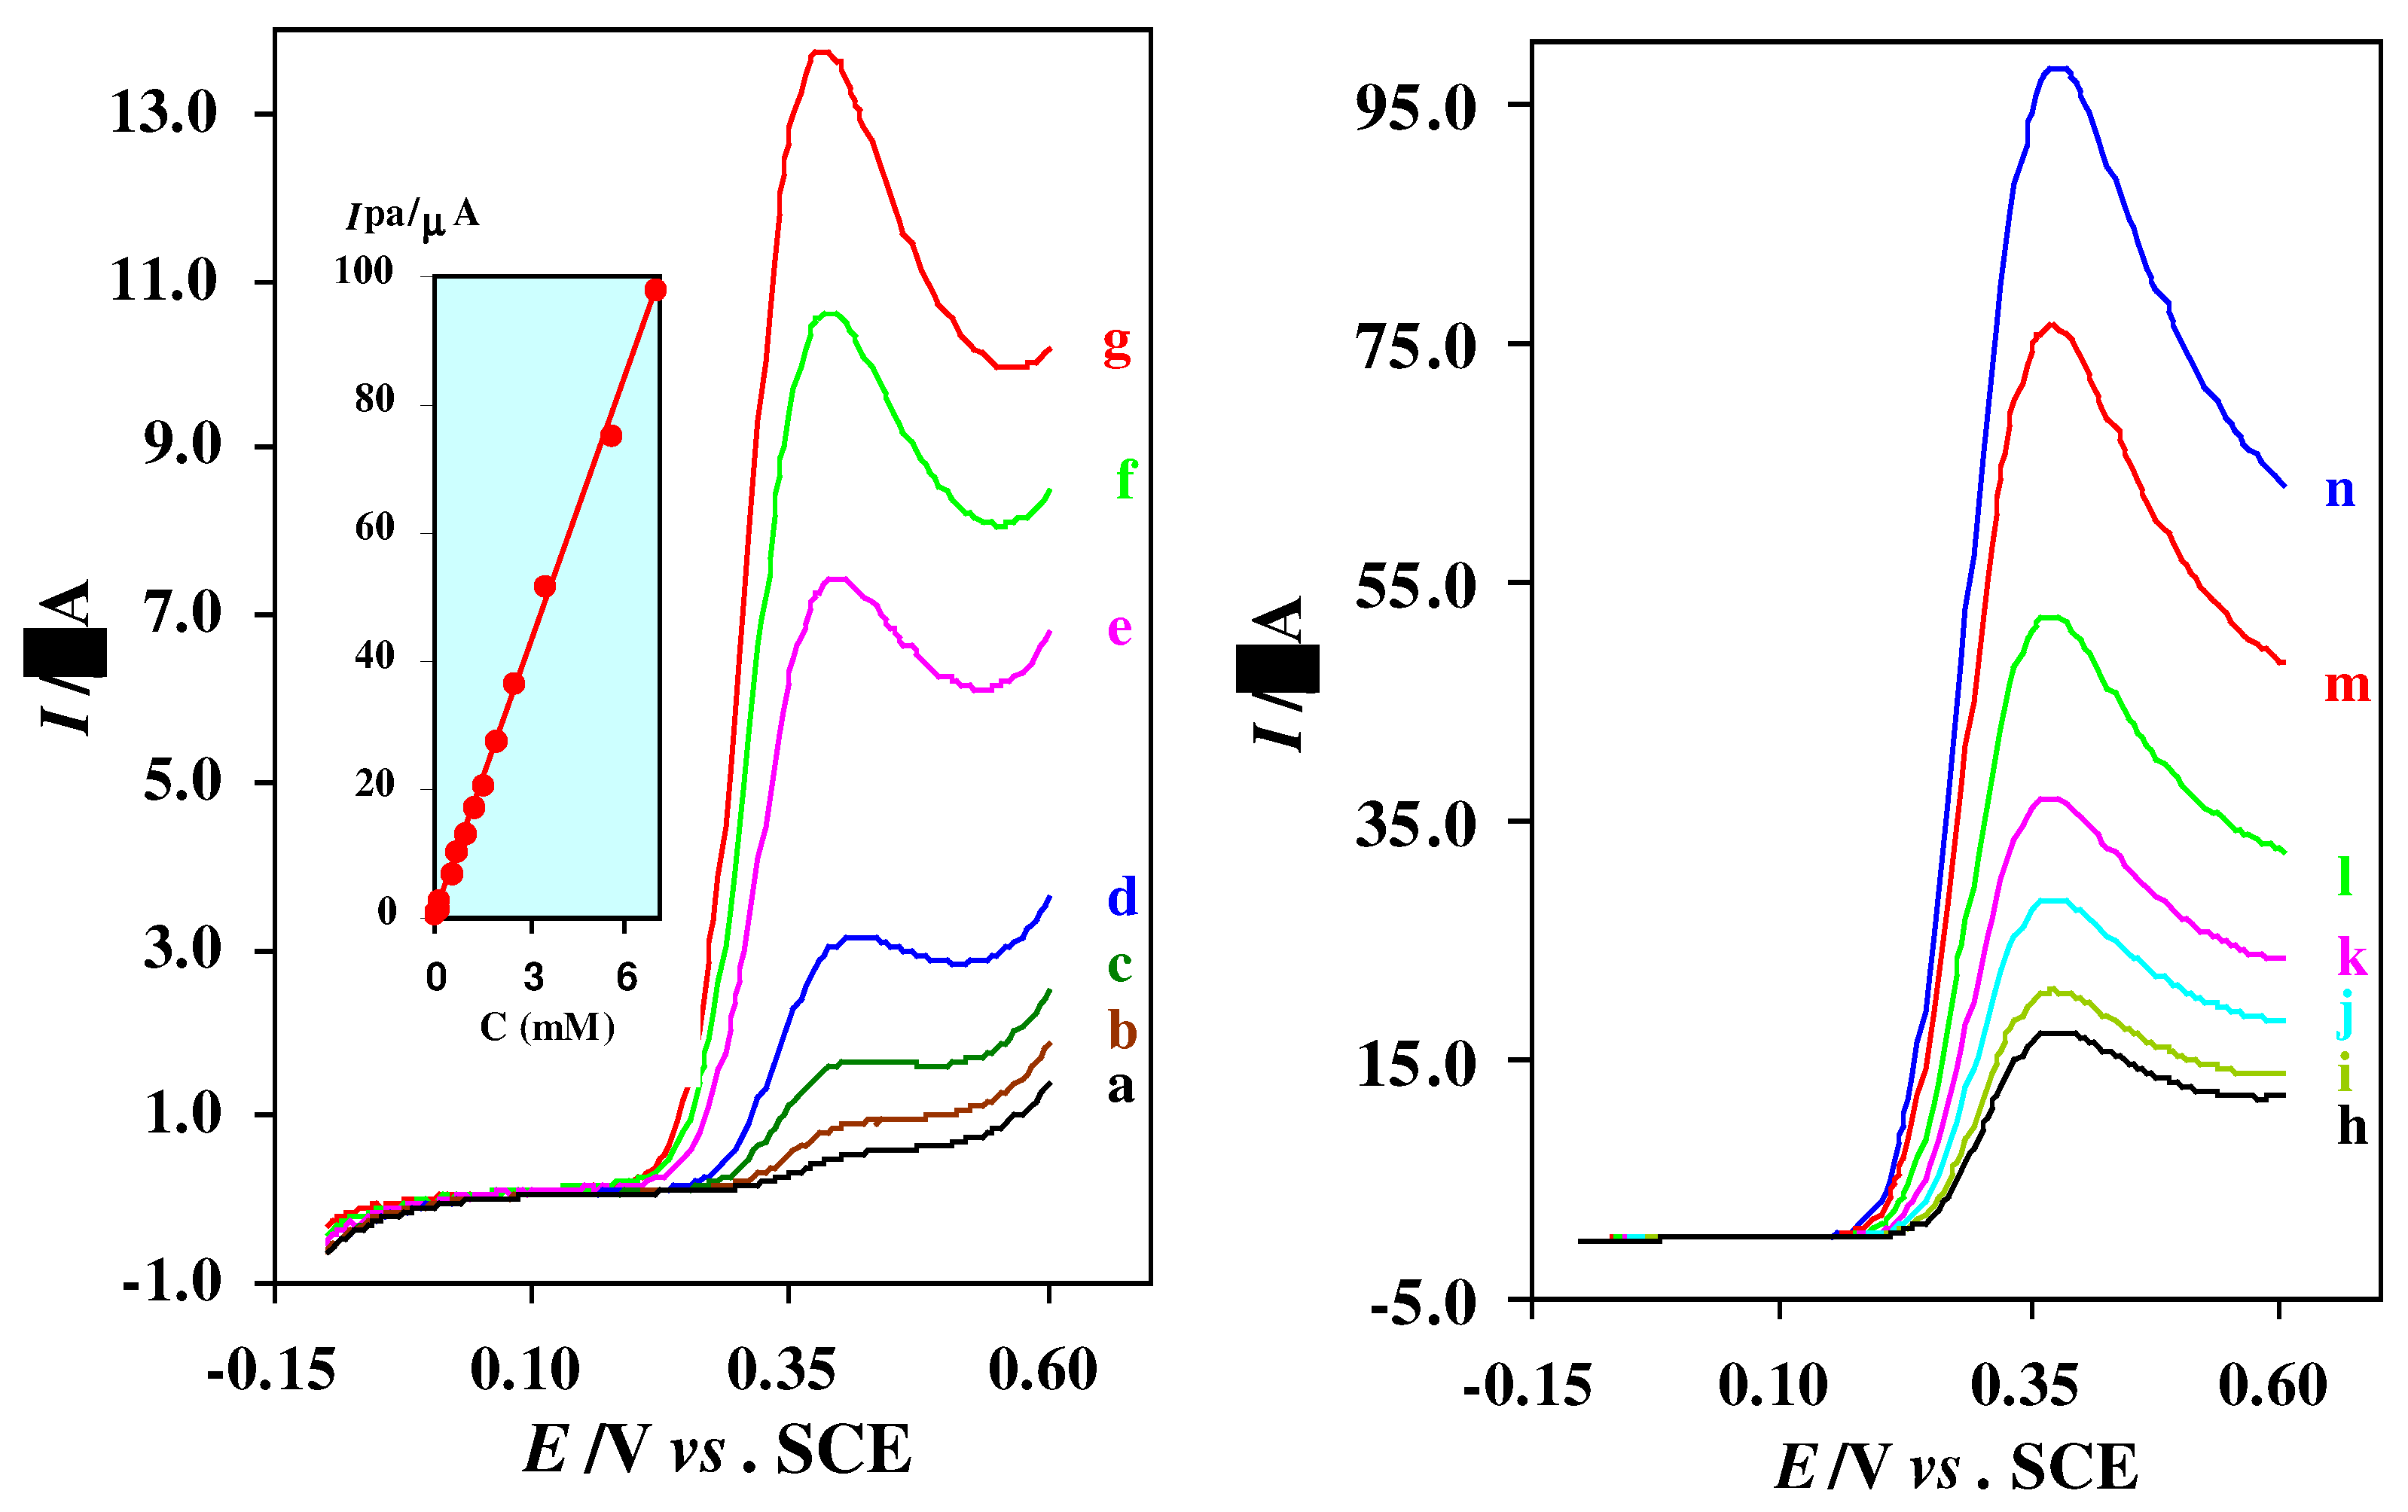
Linear sweep voltammograms of thiourea at alumina modified Pt electrode (2 mm diameter) in acetate buffer solution (C = 0.15 M, pH = 4.5). Thiourea concentrations from (a) to (n) are: 2.5 × 10⁻⁵, 5.0 × 10⁻⁵, 1.0 × 10⁻⁴, 2.0 × 10⁻⁴, 5.0 × 10⁻⁴, 7.5 × 10⁻⁴, 1.0 × 10⁻³, 1.25 × 10⁻³, 1.5 × 10⁻³, 2.0 × 10⁻³, 2.5 × 10⁻³, 3.5 × 10⁻³, 5.5 × 10⁻³ and 7.0 × 10⁻³ M. Scan rate: 50 mV/s. Inset, calibration curve for the determination of thiourea.
Table 1.
Tolerance of different species in the determination of thiourea*
Table 1.
Tolerance of different species in the determination of thiourea*
| Species added | Maximum tolerable Molar ratio |
|---|
| Na+, K+, Cl−, Br−, F−, Mg2+, Ca2+, Al3+ NO3− SO4 2-, ClO4 −, Co2+, Ni2+, Zn2+, Cr3+ | 400† |
| MoO4 2-, Mn2+, Fe2+ | 20 |
| I−, Hydroquinone, Catechol, Ag+ | 4 |
| S2O3 2-, Hg2+, Cu2+ | 0.2 |


