Digital Simulation
Definite problems arise when solving analytically the non-linear partial differential equations with complex boundary conditions [
12,
16]. To obtain an approximate analytical solution, approximation and classification of each different condition are usually needed. On the other hand, the digital simulation to obtain a numerical solution can be applied almost to any case. Consequently, the problem (2)-(7) was solved numerically.
The finite difference technique was applied for discretization of the mathematical model [
15]. We introduced an uniform discrete grid in both:
x and
t directions [
21]. An implicit linear finite difference scheme has been built as a result of the difference approximation of Eqs. (2)-(7). The resulting system of linear algebraic equations was solved efficiently because of the tridiagonality of the matrices of the systems. Having a numerical solution of the problem (2)-(7), the density of the biosensor current
i(
t) can be calculated easily.
The mathematical model as well as the numerical solution of the problem was evaluated for different values of the maximal enzymatic rate
Vmax, substrate concentration
S0, as well as the membrane thickness
d. The following values of the parameters were constant in the numerical simulation of all the experiments:
The evolution of the biosensor current at the maximal enzymatic rate
Vmax of 10
-7 mol/cm
3s is presented in
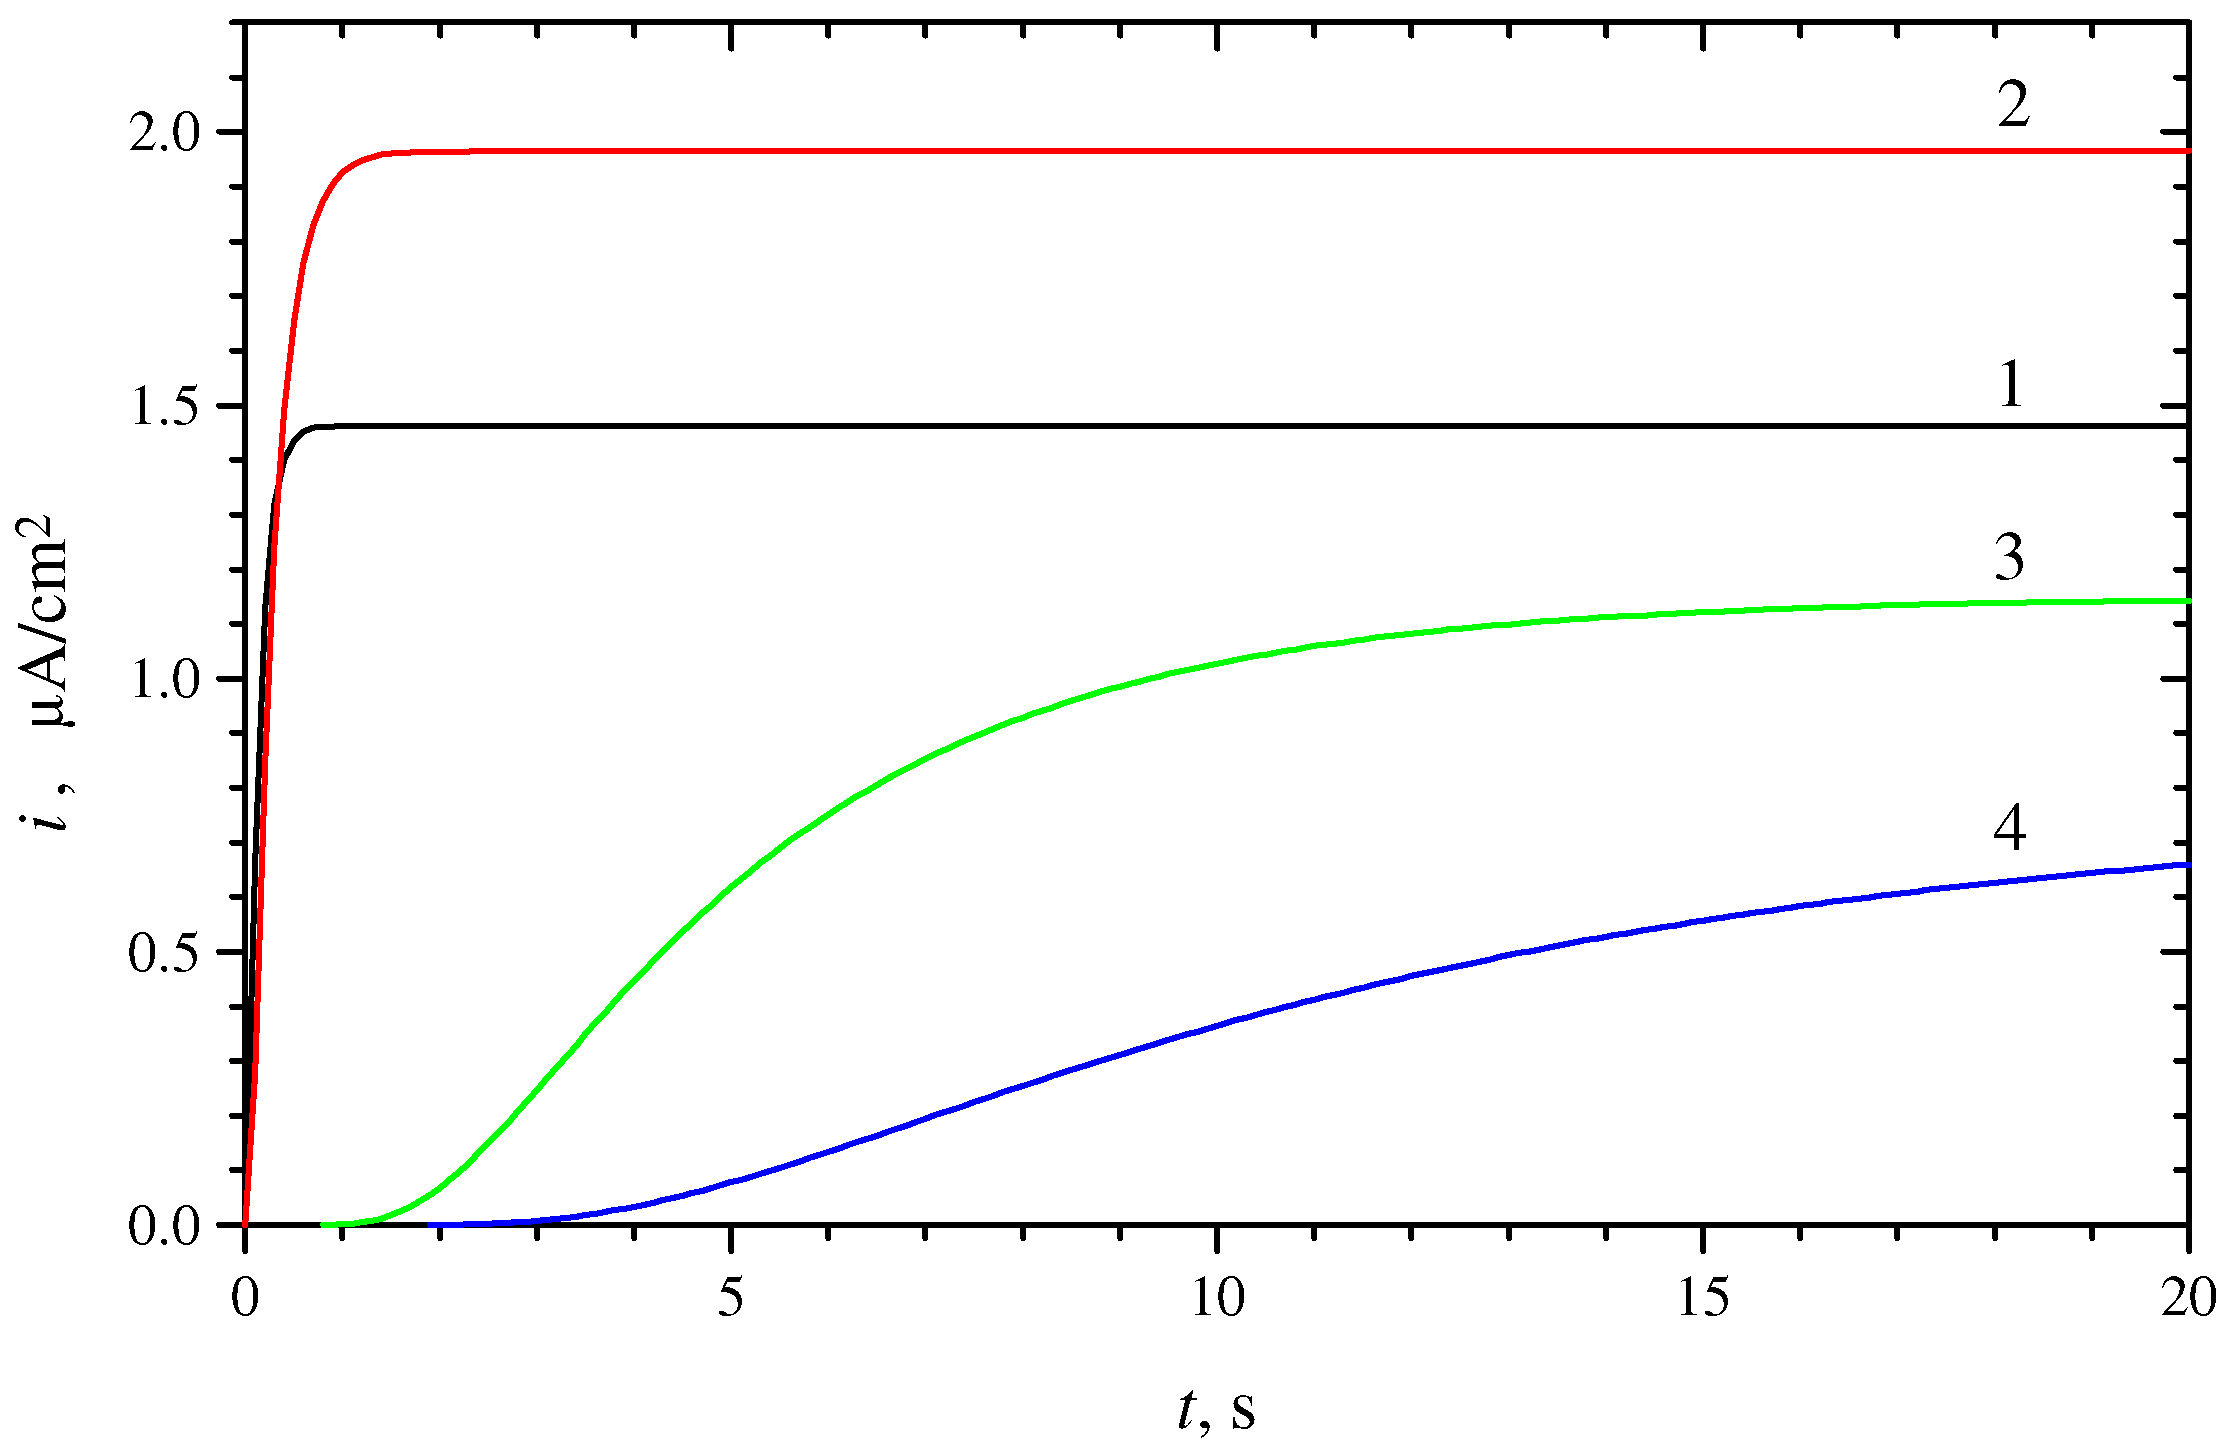
Fig. 1. The biosensor response was modelled for biosensors having four different membrane thickness
d: 0.001, 0.0015, 0.01, 0.015 cm. One can see in
Fig. 1 the biosensor current appears with some delay at relatively thick enzyme layers. This delay increases with the increase of the enzyme membrane thickness. Comparing the evolution of the biosensor current (
Fig. 1) in two cases of relatively thin (
d = 0.001 and 0.0015 cm) membrane, one can see that the biosensor response is notable higher at thicker membrane (
d = 0.0015 cm) than at thinner one (
d = 0.001 cm). However, comparing the biosensor responses in other two cases of ten times thicker (
d = 0.01 and 0.015 cm) membranes, we see the opposite tendency: the biosensor of thicker (
d = 0.015 cm) membrane generates lower response than thinner one (
d = 0.01 cm). We discuss the effect of the membrane thickness on the biosensor response in details.
The maximal biosensor current imax (the biosensor response) as well as the time moment of occurrence of the maximal current (response time) were assumed and analyzed as ones of the most important characteristics of a biosensor.
Figure 1.
The dynamics of the biosensor current i at the maximal enzymatic rate Vmax = 10-7 mol/cm3s and four membrane thickness d: 0.001 (1), 0.0015 (2), 0.01 (3), 0.015 (4) cm, S0 = 2×10⁻⁸ mol/cm3.
Figure 1.
The dynamics of the biosensor current i at the maximal enzymatic rate Vmax = 10-7 mol/cm3s and four membrane thickness d: 0.001 (1), 0.0015 (2), 0.01 (3), 0.015 (4) cm, S0 = 2×10⁻⁸ mol/cm3.
In digital simulation, the biosensor response time was assumed as the time when the absolute current slope value falls below a given small value normalised with the current value. In other words, the time needed to achieve a given dimensionless decay rate
ε is used
Consequently, the maximal biosensor current
imax was assumed as the current at the biosensor response time
TR. We employed
ε = 10
-6. However, the response time
TR as an approximate steady-state time is very sensitive to the decay rate
ε, i.e.
TR → ∞, when
ε → 0. Because of this we investigate the change of a half of steady-state time [
12]. The resultant relative output signal function
i*(
t) can be expressed as:
where
i(
t) is the output current density at time
t as defined in (8),
iR is assumed as the steady-state current. Let us notice, that 0 ≤
i*(
t) ≤ 1 at all
t ≥ 0,
i*(0) = 1 and
i*(
TR) = 0. Let
T0.5 be the time at which the reaction-diffusion process reaches the medium, called half time of steady-state or, particularly, half of the time moment of occurrence of the maximal current, i.e.
i*(
T0.5) = 0.5.
Results and Discussion
Using computer simulation we have investigated the dependence of the maximal biosensor current on the thickness of the enzyme membrane. The maximal biosensor current
imax was assumed as steady-state current
i∞, calculated at the response
TR time defined by formula (10),
imax =
i∞ =
iR. The investigation was carried out at the following values of
Vmax: 10
-9, 10
-8, 10
-7 and 10
-6 mol/cm
3s to get results for a wide range of values of the maximal enzymatic rate.
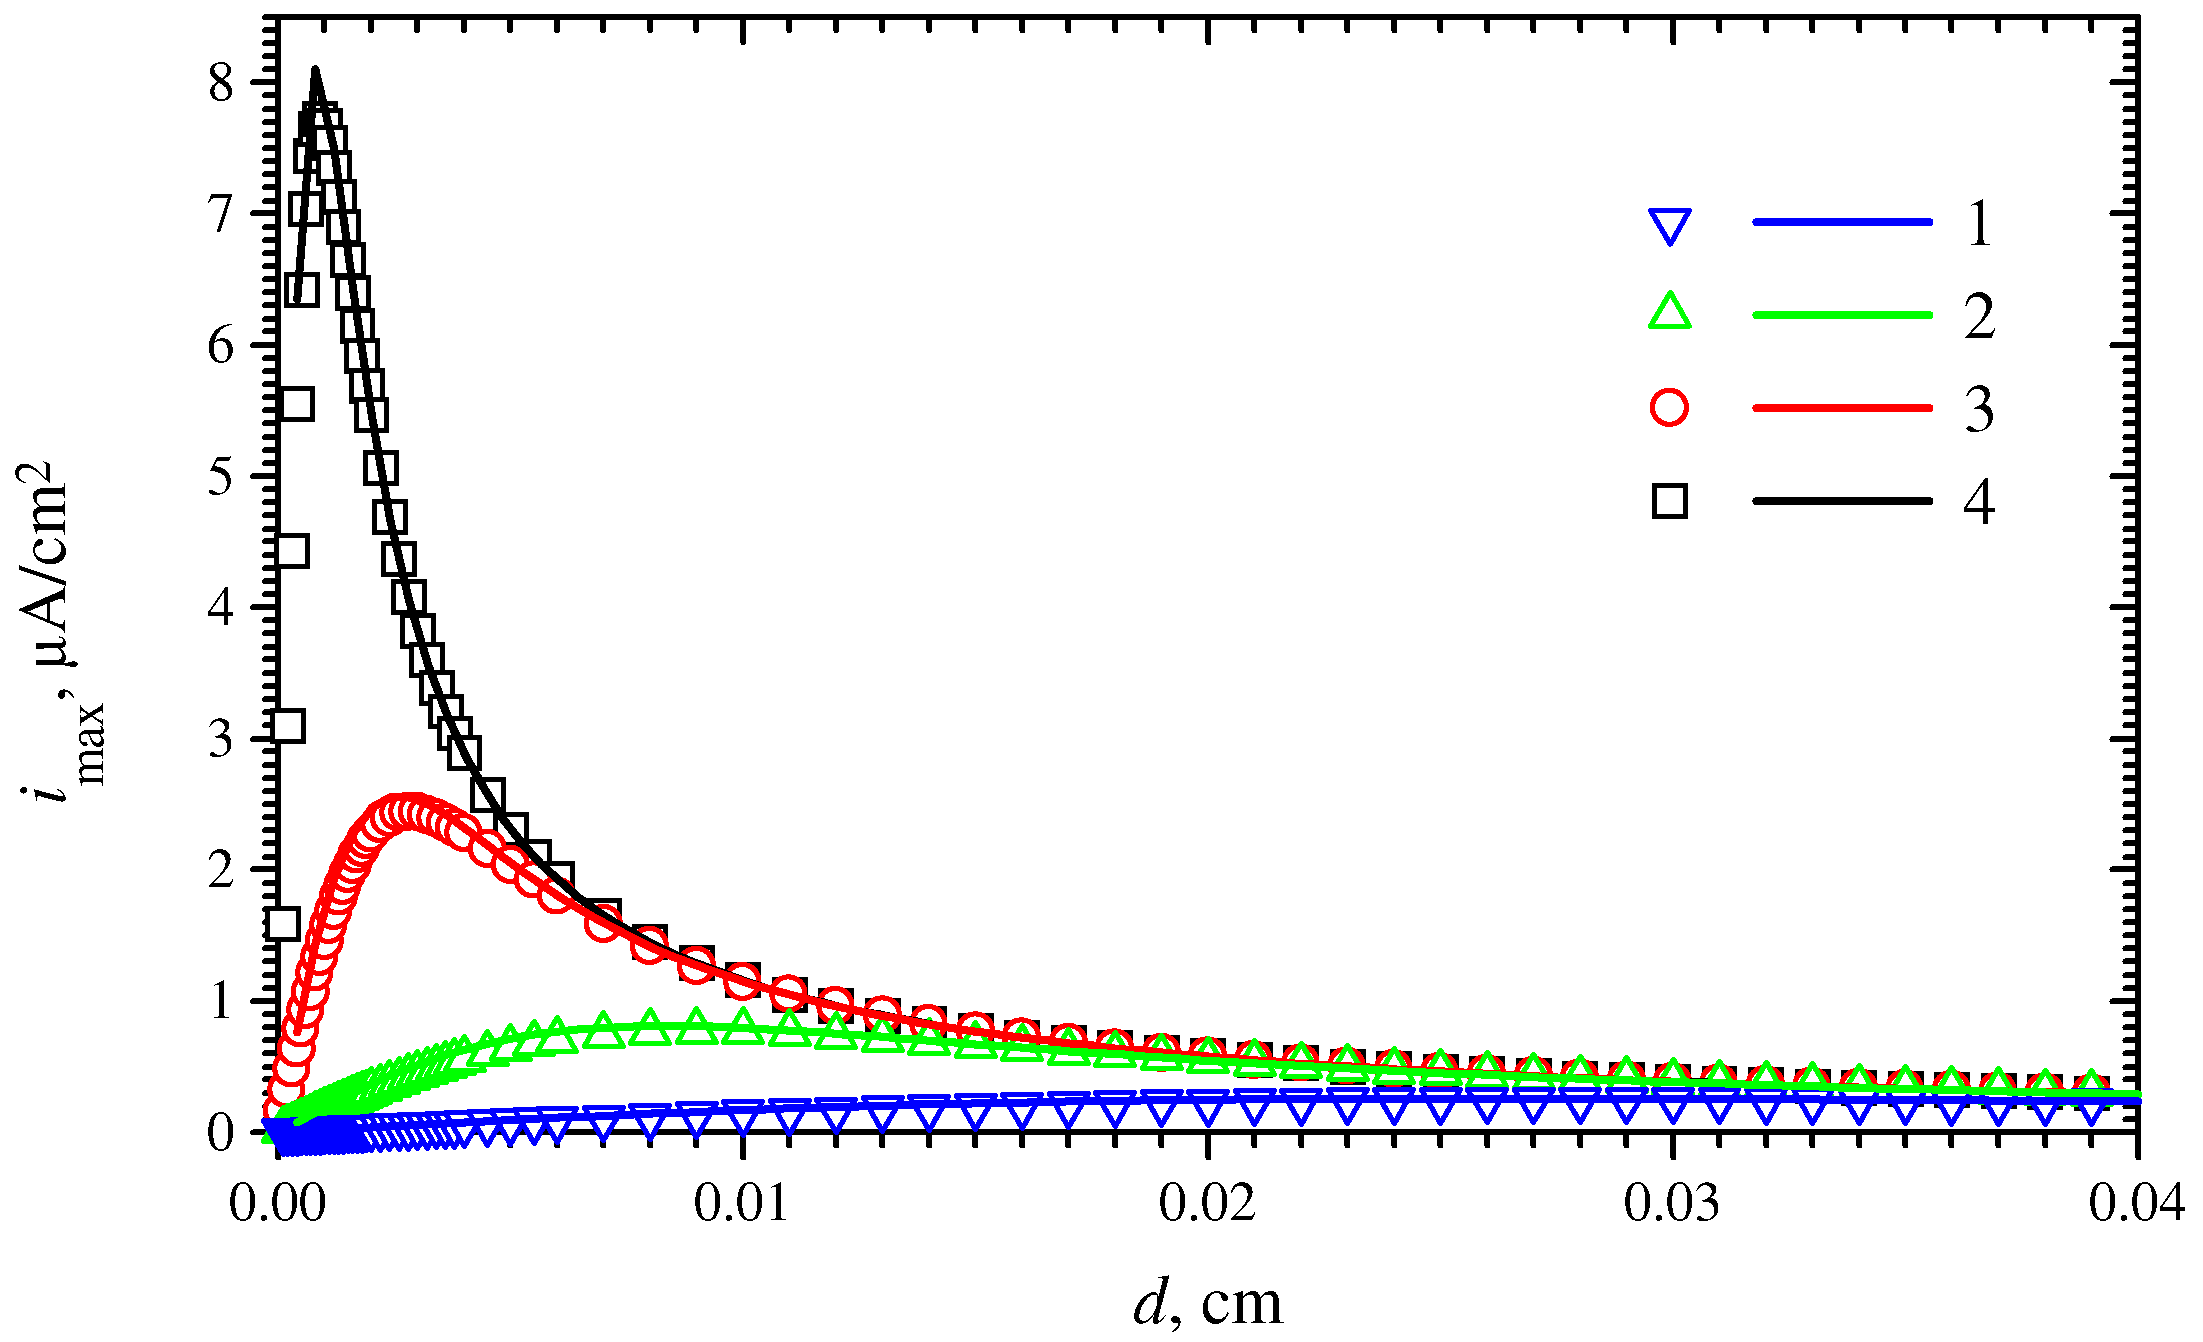
Fig. 2 shows the maximal current while
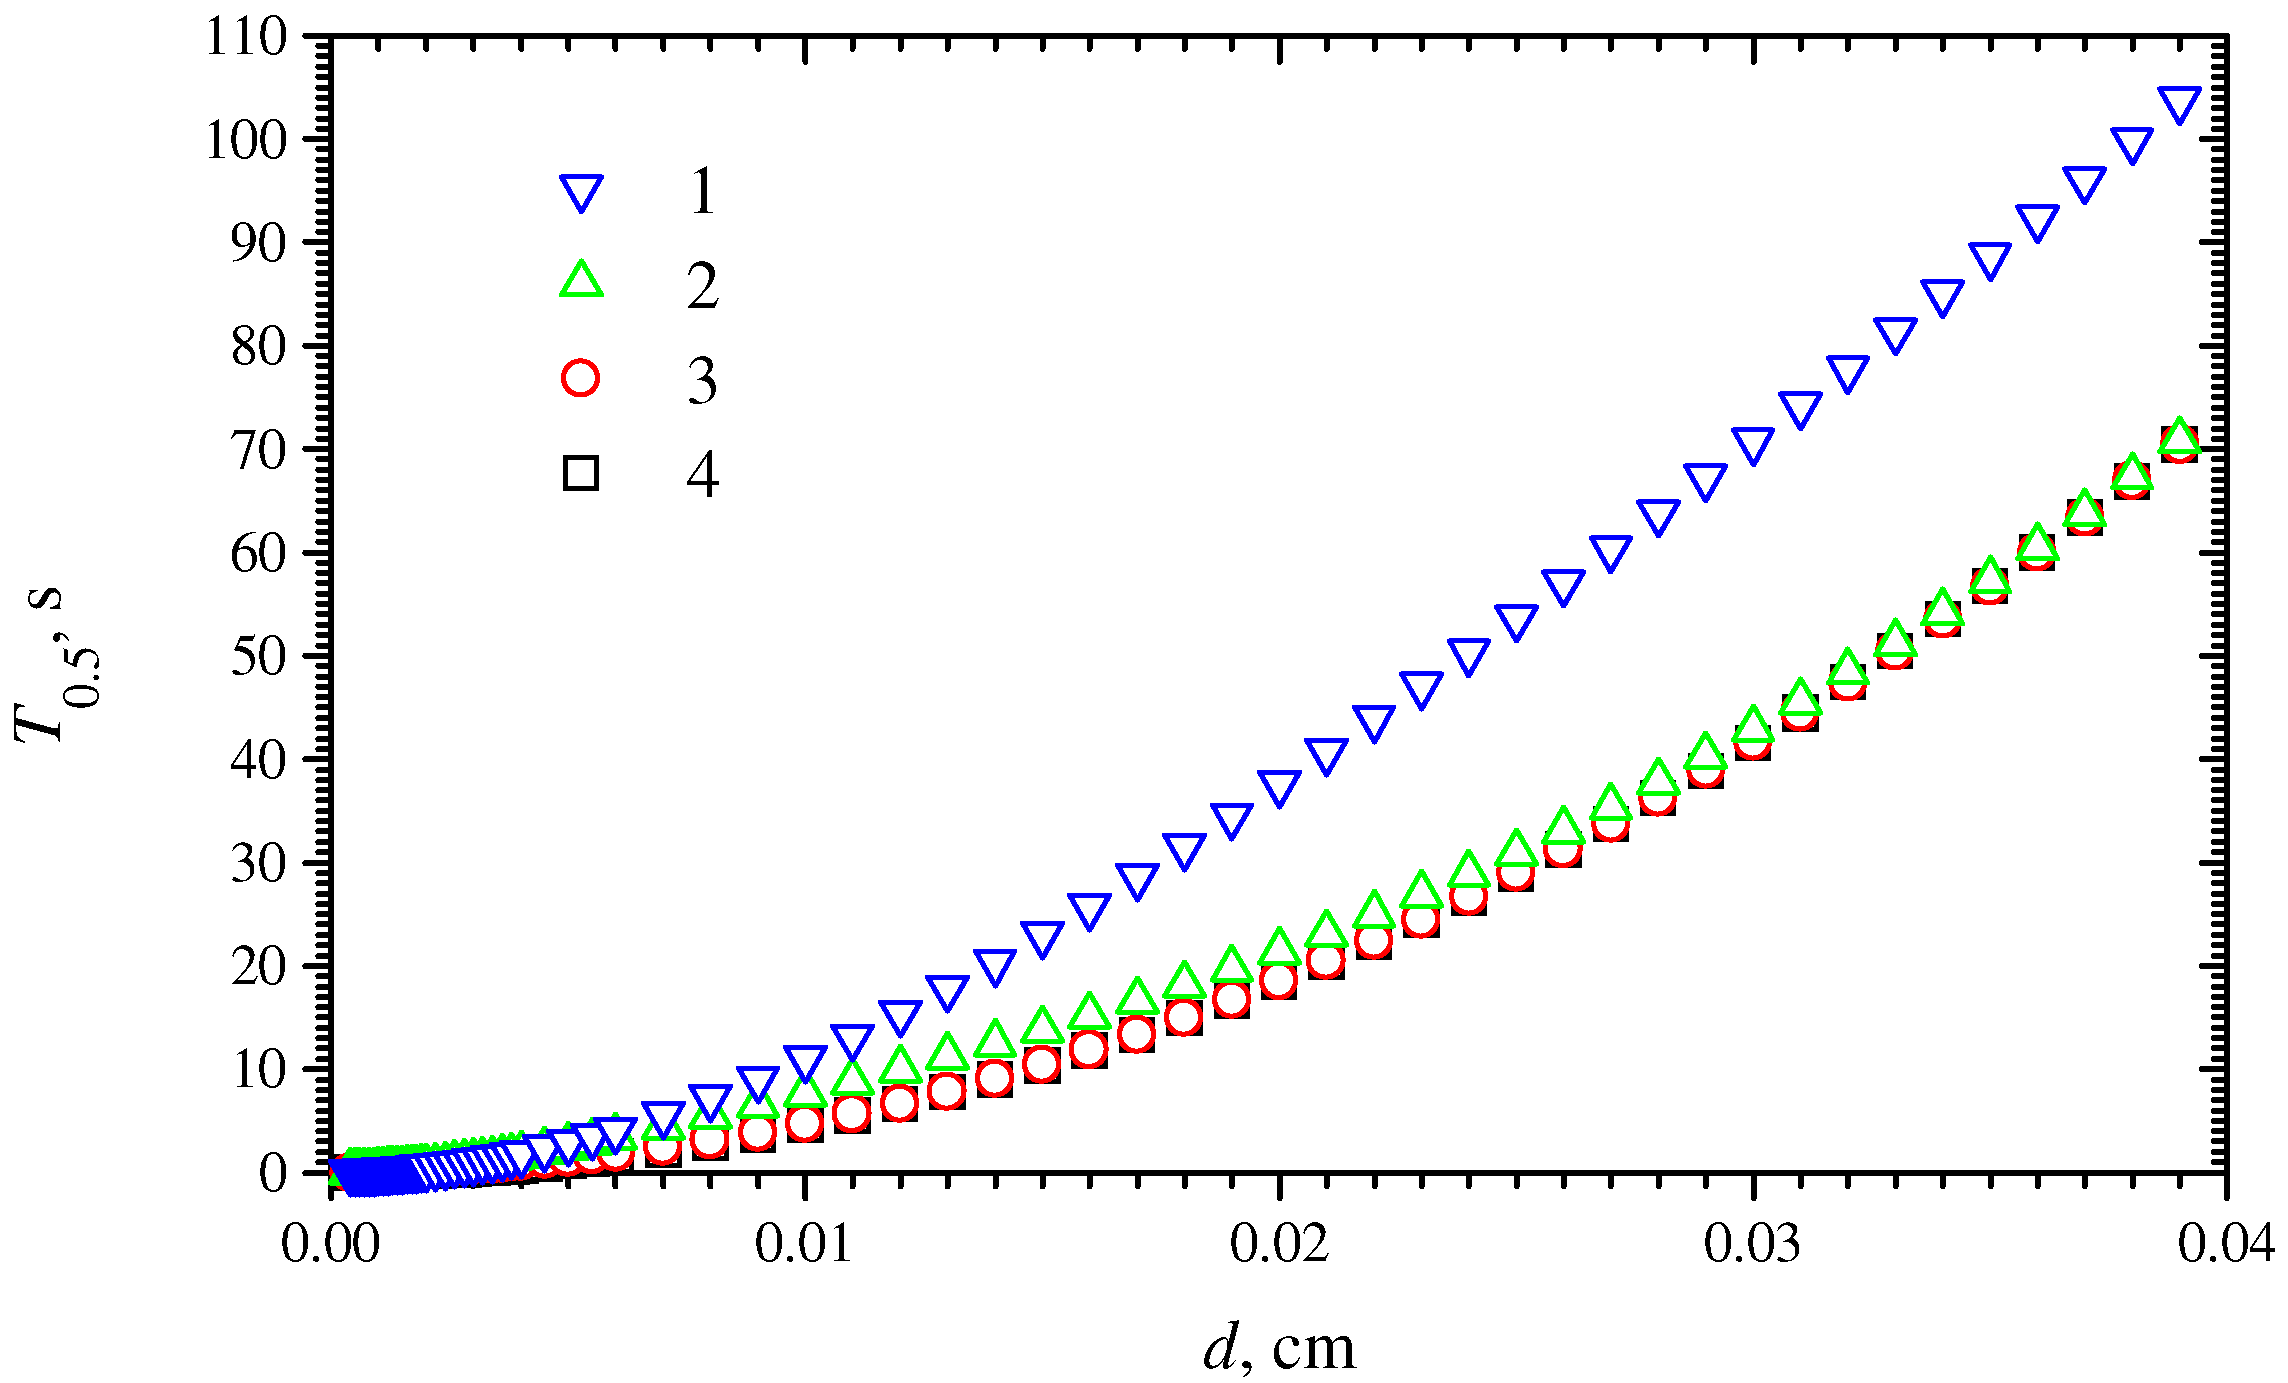
Fig. 3 presents the half time
T0.5 of the maximal current versus the thickness
d of the enzyme membrane.
Fig. 2 presents also values of the stationary current
i∞ [
22],
where
σ dimensionless diffusion modulus, Damkoehler number,
Formula (12) is valid at substrate concentrations significantly lower than Michaelis constant,
S0 <<
KM. In
Fig. 2, values of
i∞ obtained by (12) are depicted as a function of the membrane thickness
d. Due to the assumption of
imax =
i∞ =
iR and substrate concentration
S0 = 0.2
KM <
KM, employed in the calculations above, the analytical solution (12) compares sufficiently well with the numerical solution of the model (2)-(7) at different enzymatic rates
Vmax and membrane thickness
d.
Figure 2.
The dependence of the maximal biosensor current imax on the thickness d of the enzyme membrane at four maximal enzymatic rates Vmax: 10-9 (1), 10-8 (2), 10-7 (3) and 10-6 (4) mol/cm3s, S0 = 2×10⁻⁸ mol/cm3. Symbols are numerical solutions, while lines are analytical ones (formula 12).
Figure 2.
The dependence of the maximal biosensor current imax on the thickness d of the enzyme membrane at four maximal enzymatic rates Vmax: 10-9 (1), 10-8 (2), 10-7 (3) and 10-6 (4) mol/cm3s, S0 = 2×10⁻⁸ mol/cm3. Symbols are numerical solutions, while lines are analytical ones (formula 12).
One can see (
Fig. 2) that the maximal biosensor current
imax is a non-monotonous function of
d at all values of the maximal enzymatic rate
Vmax. The higher maximal enzymatic rate
Vmax corresponds to the greater maximal value of
imax.
From the results, obtained by digital simulation, we determine, that the maximum of imax equals to about 7.72 μA/cm2 at Vmax = 10-6 mol/cm3s, while imax ≈ 2.45 μA/cm2 at Vmax = 10-7 mol/cm3s. The higher maximum of imax corresponds to thinner enzyme membrane. In the case of Vmax = 10-6 mol/cm3s, the maximum of imax(d) is gained at d ≈ 0.0009 cm, while in the case of Vmax = 10-7 mol/cm3s, the maximum of imax is gained at d ≈ 0.0028 cm.
Using (12) we find analytically the membrane thickness
d, at which the state-state current
i∞ gains the maximum at given
ne,
DS,
S0,
Vmax,
KM and
S0 <<
KM. At first, we calculate a derivative of
i∞(
d) with the respect to the thickness
dThen we look for
σ at which that derivative gets zero
Eq. (15) was solved numerically. A single solution
σ =
σmax ≈ 1.5055 was obtained. Consequentially,
i∞ gains the maximum at the membrane thickness
dmax, where
Accepting (9), we find, that dmax ≈ 0.000825, imax ≈ 8.1 at Vmax = 10-6; dmax ≈ 0.00261 cm, imax ≈ 2.56 μA/cm2 at Vmax = 10-7 mol/cm3s etc. These values compare sufficiently well with the corresponding values obtained by the numerical simulation of the biosensor operation. Corresponding values of the maximal current imax as well as thickness d varies by about 5%. That variation in values appears because of substrate concentration S0 = 0.2KM. The analytical solution (12) is valid at S0 << KM only, while the numerical one does not have such kind of restrictions at all. Because of this, values of dmax, calculated using the model (2)-(7) are more accurate than analytical ones at S0 = 20 nmol/cm3 and (9).
Using formula (12) we find that the maximal biosensor current as a function of the membrane thickness d gains the maximum when the diffusion modulus σ equals to σmax = 1.5055. According to (13) and (15) σmax does not depend on the substrate concentration S0. Nevertheless, using the numerical simulation we have calculated values of σmax at some more values of S0. We obtained the following values: σmax ≈ 1.51 at S0 = 2×10-11, σmax ≈ 1.55 at S0 = 2×10⁻⁹ mol/cm3 and σmax ≈ 2.5 at S0 = 2×10⁻⁷ mol/cm3. The modulus σmax is approximately constant at S0 << KM, so that it is about coincident with the value obtained from the analytical solution (12). σmax increases with increase of substrate concentration S0. The increase is especially notable at substrate concentrations S0 > KM. The dependence of σmax on Vmax is practically insignificant: σmax varies by less than 3.5% while Vmax changes from 10-9 to 10-6 mol/cm3s at any concrete S0.
The stability of the response is one of the most critical characteristics of biosensors [
14]. It is very important to have biosensors keeping their analytical capability for a long period. Usually the maximal enzymatic rate
Vmax decreases permanently due to enzyme inactivation. In general, the biosensor response is sensitive to changes of
Vmax.
Fig. 2 shows, that the maximal biosensor current can differ by some dozens, changing
Vmax. The variation is especially notable in cases of relatively thin enzyme membranes. In case of relatively thick enzyme membrane,
imax practically does not vary by changing
Vmax. Consequently, a biosensor containing thicker enzyme layer gives more stable response than a biosensor with thinner layer. However, the thick membrane-based biosensors have very durable response time (
Fig. 3). It is possible to notice (
Fig. 3), that the half time
T0.5 of the maximal biosensor current is about 18.5 s when the membrane thickness
d equals to 0.02 cm and
Vmax = 10
-6 mol/cm
3s. The half time is even more durable at thicker enzyme membrane as well as lower enzymatic rate, so that biosensors of such thickness is of limited applicability in flow injection systems, which are widely used for determination of various compounds [
23].
Thus, a problem of the membrane thickness optimisation arises. The task is to find the thickness of membrane so small as possible, ensuring the stability of the biosensor response at a range of
Vmax as wide as possible. Let
V1 and
V2 be two values of the maximal enzymatic rate (
V1 <
V2) such as we need to have stable biosensor response to substrate of concentration of
S0. Then we describe the minimal membrane thickness
dδ(
V1,
V2,
S0), at which the relative difference
R(
d,
V1,
V2,
S0) between the biosensor response (the maximal biosensor current
imax) at
d =
dδ,
Vmax =
V1 and another one response at
d =
dδ,
Vmax =
V2 is less than dimensionless decay rate
δwhere imax(d, Vmax, S0) is the maximal biosensor current at the membrane thickness of d, maximal enzymatic rate Vmax and substrate concentration S0.
Figure 3.
The dependence of the half time T0.5 of the maximal biosensor current on the membrane thickness d at four maximal enzymatic rates Vmax: 10-9 (1), 10-8 (2), 10-7 (3) and 10-6 (4) mol/cm3s, S0 = 2×10⁻⁸ mol/cm3.
Figure 3.
The dependence of the half time T0.5 of the maximal biosensor current on the membrane thickness d at four maximal enzymatic rates Vmax: 10-9 (1), 10-8 (2), 10-7 (3) and 10-6 (4) mol/cm3s, S0 = 2×10⁻⁸ mol/cm3.
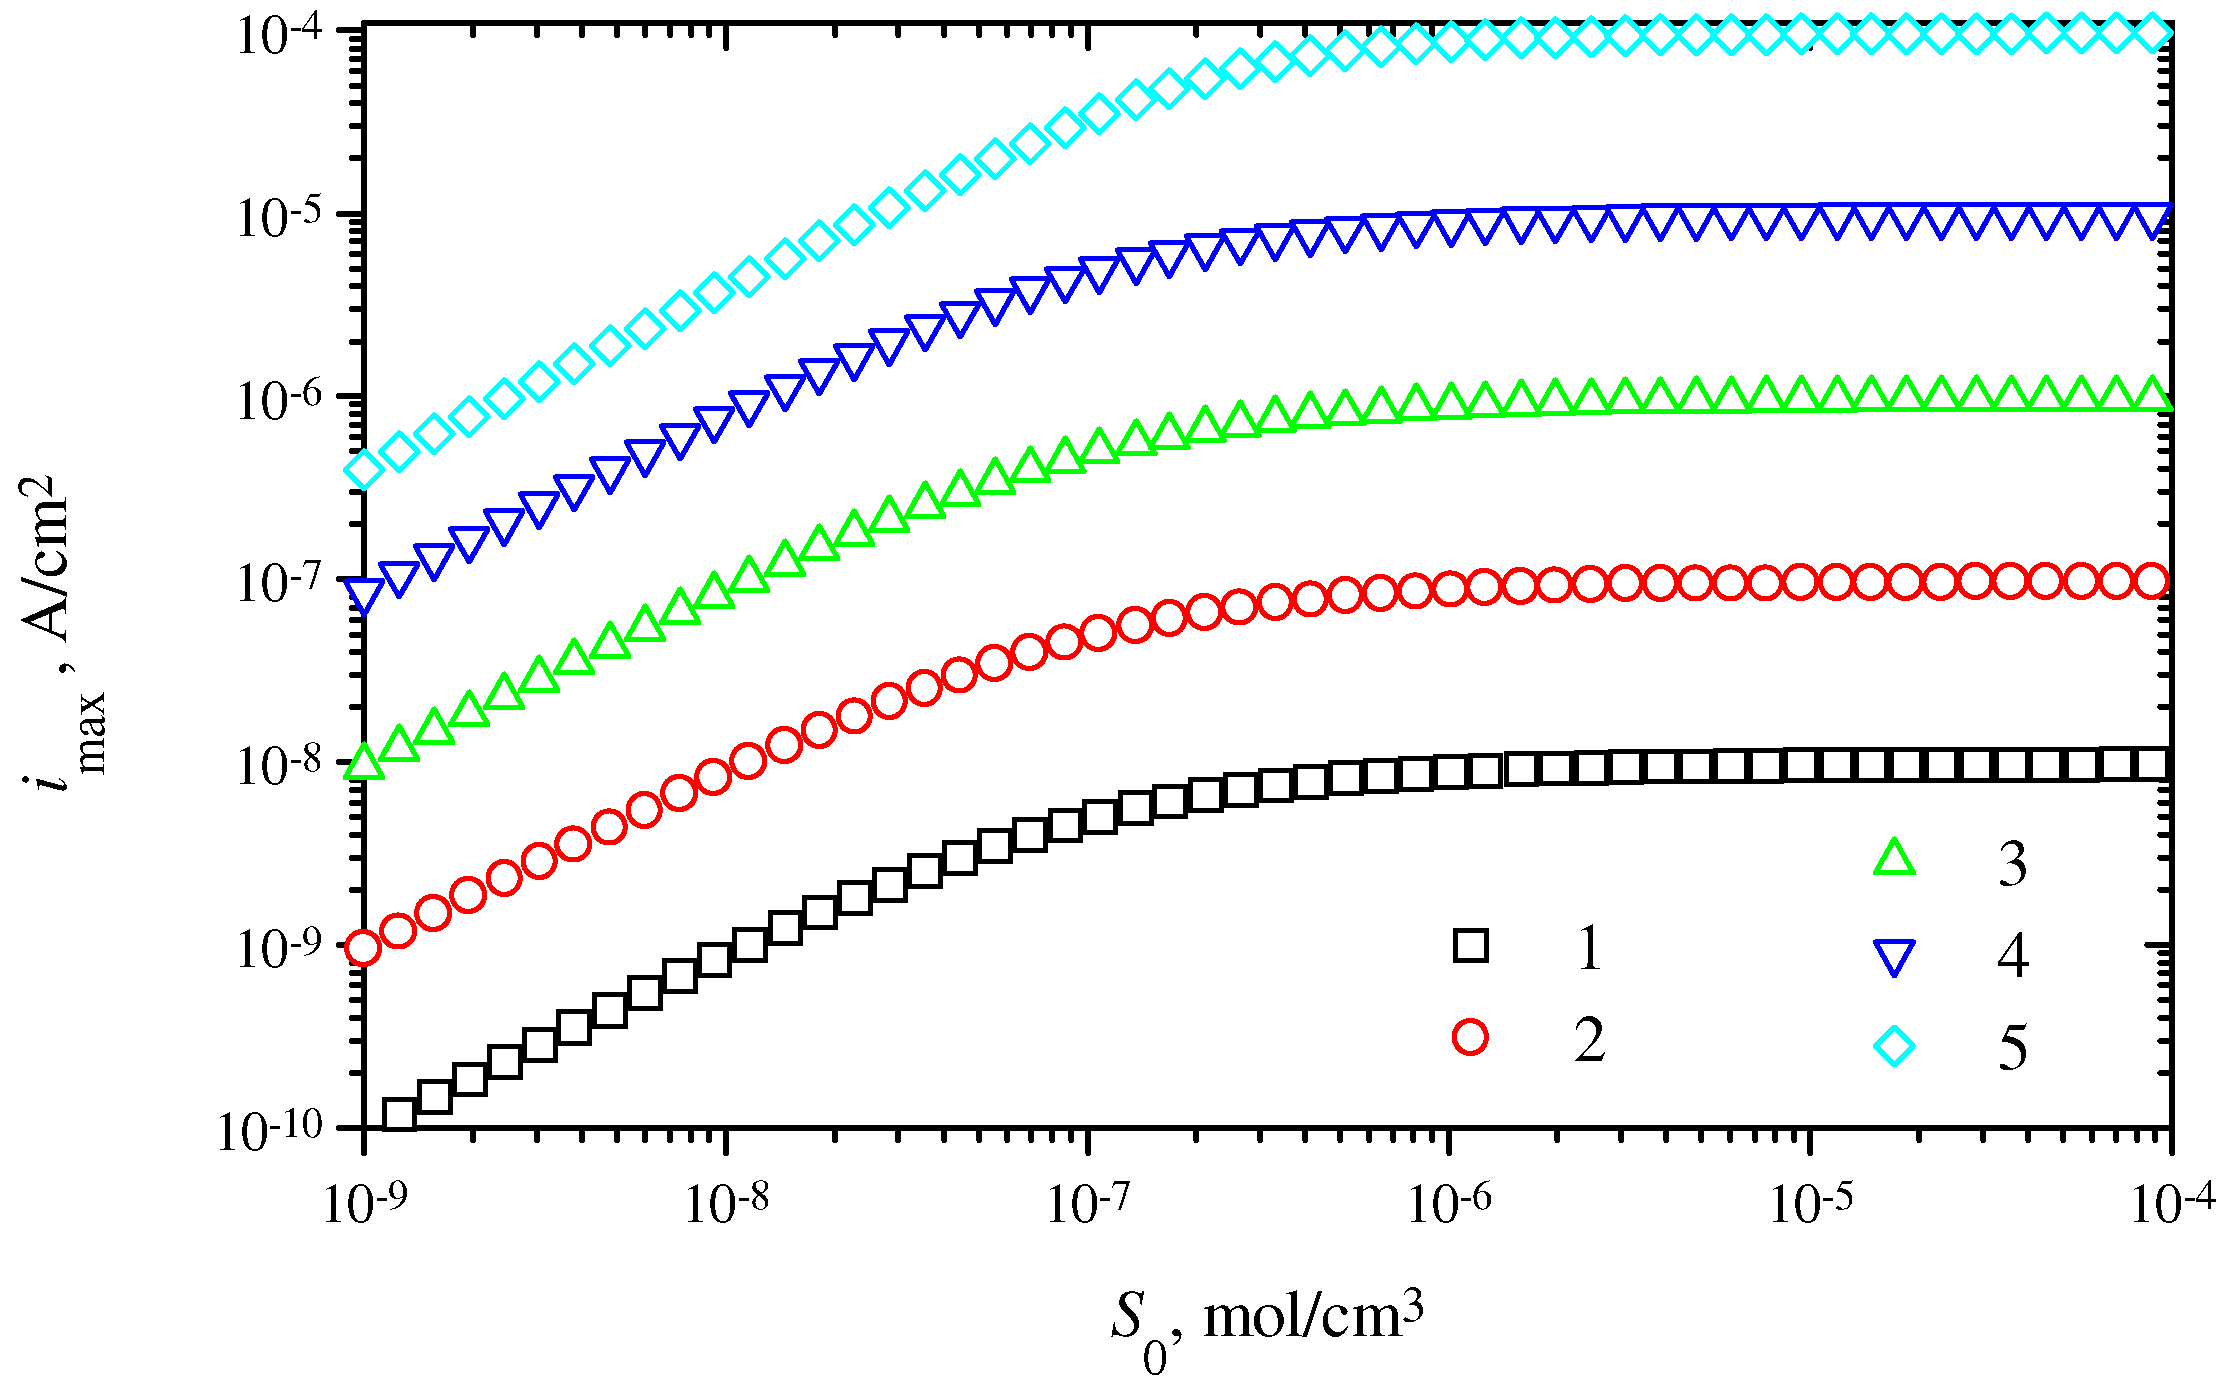
Figure 4.
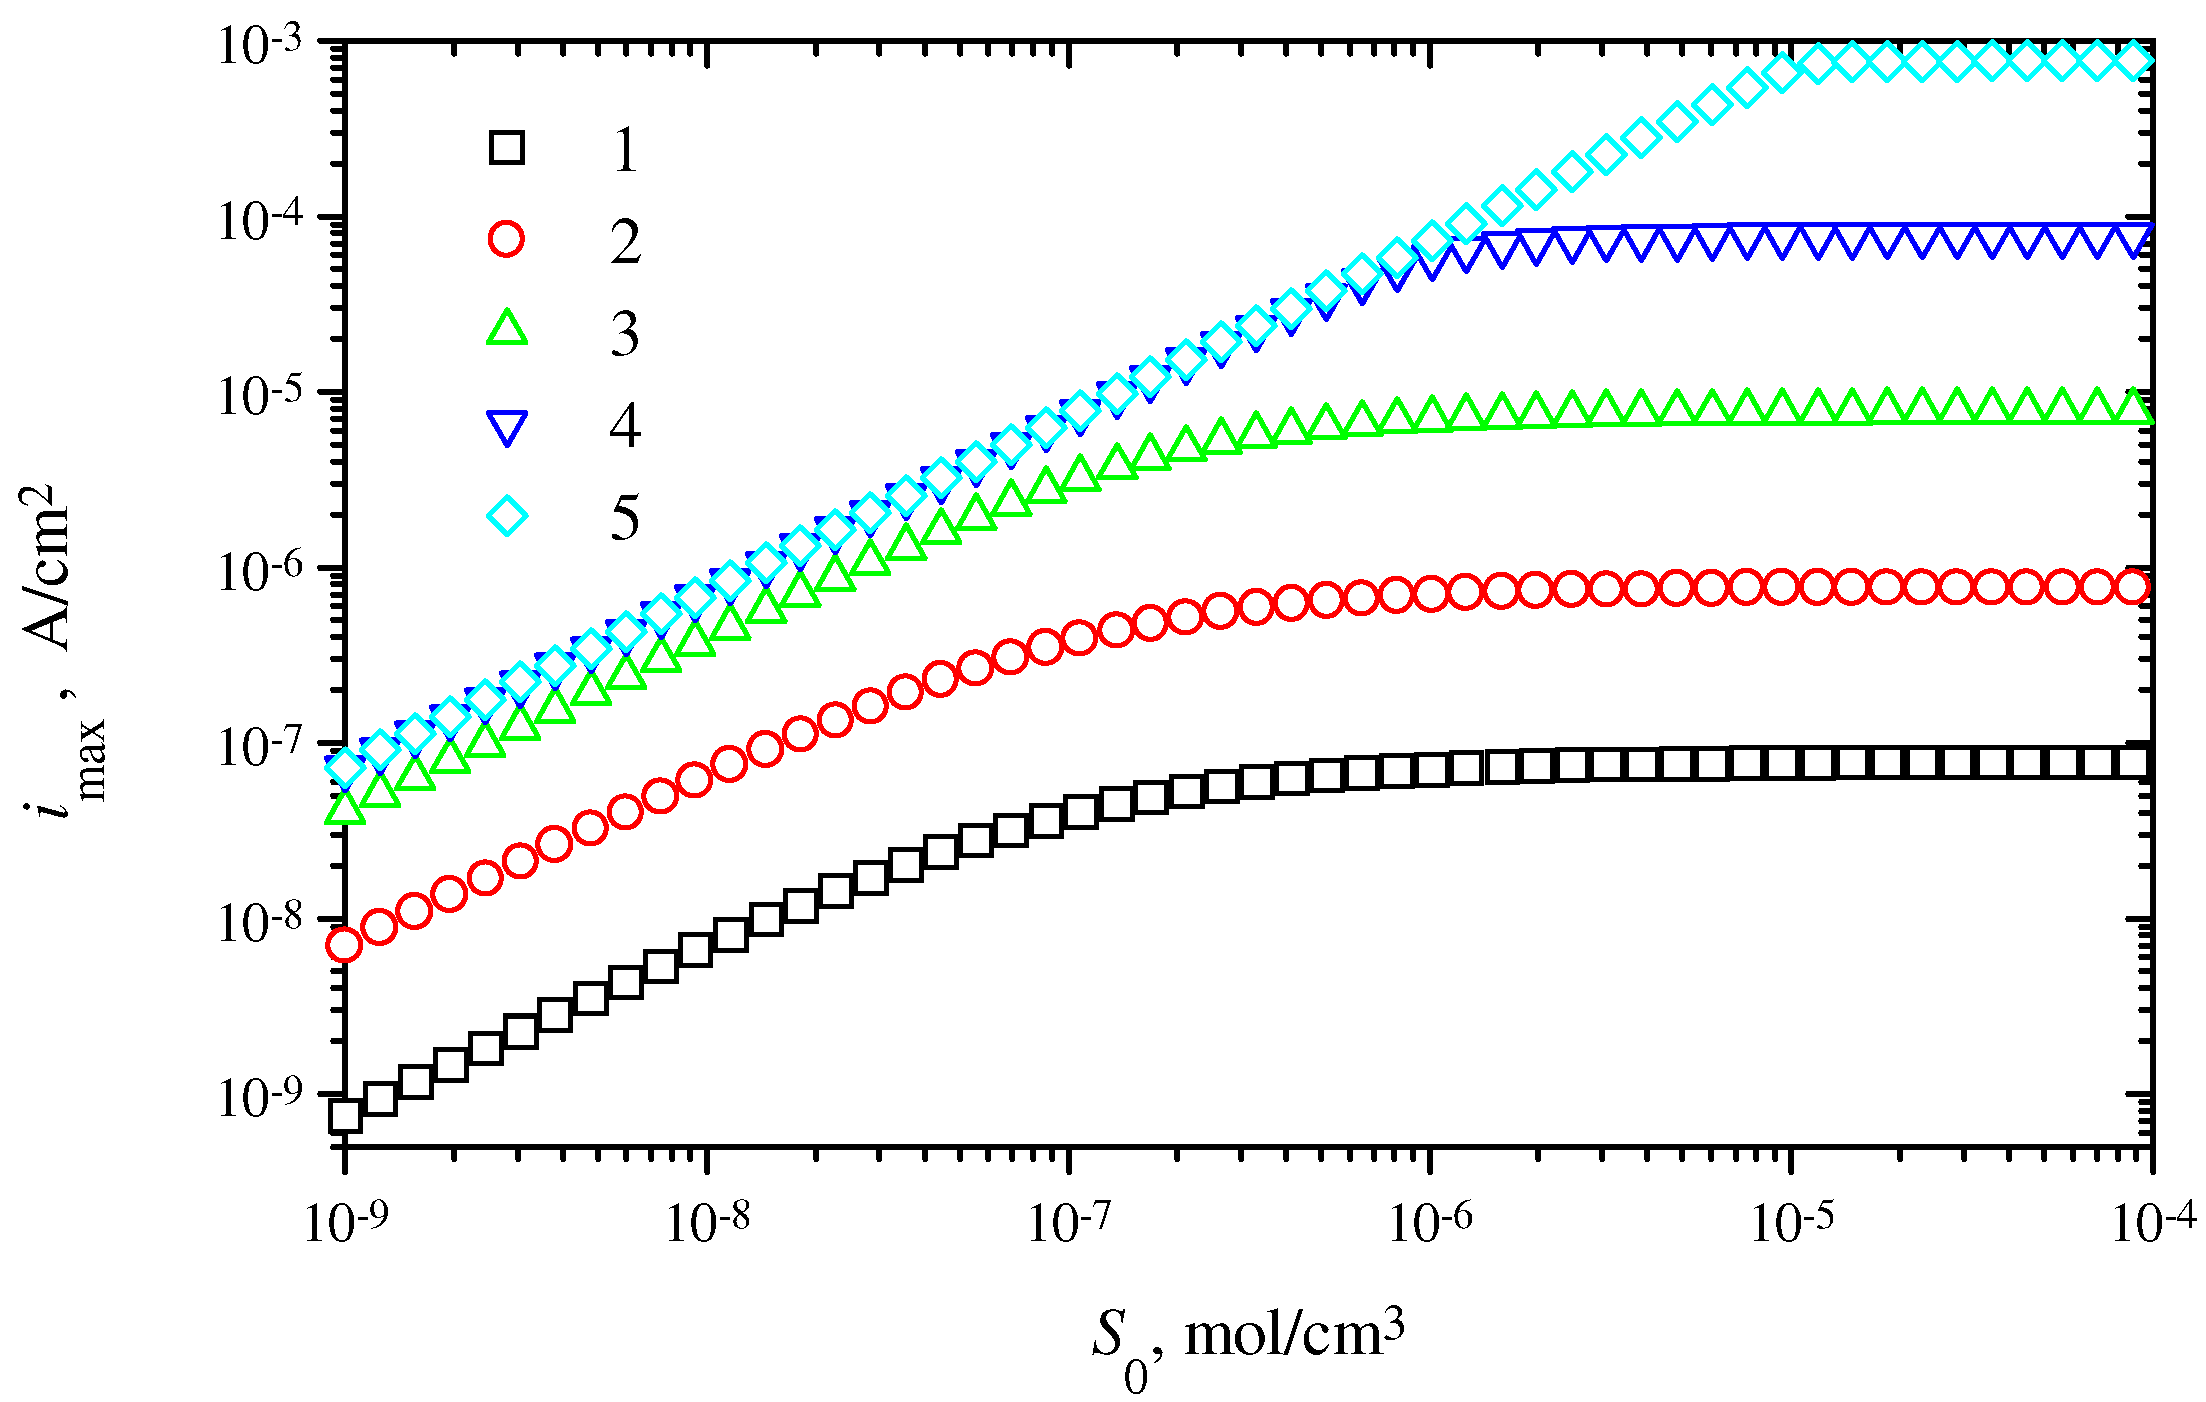
The dependence of the maximal biosensor current imax on the substrate concentration S0 at five maximal enzymatic rates Vmax: 10-10 (1), 10-9 (2), 10-8 (3), 10-7 (4) and 10-6 (5) mol/cm3s, d = dδ(10-7, 10-6, 2 × 10⁻⁸) = 0.008 cm, calculated by formula (18) assuming δ = 0.02.
Figure 4.
The dependence of the maximal biosensor current imax on the substrate concentration S0 at five maximal enzymatic rates Vmax: 10-10 (1), 10-9 (2), 10-8 (3), 10-7 (4) and 10-6 (5) mol/cm3s, d = dδ(10-7, 10-6, 2 × 10⁻⁸) = 0.008 cm, calculated by formula (18) assuming δ = 0.02.
Let us assume
S0 = 20 nmol/cm
3s,
V1 = 10
-7,
V2 = 10
-6 mol/cm
3s and
δ = 0.02. From the numerical results, presented in
Fig. 2, we found
dδ ≈ 0.008 cm. We have calculated the response of a biosensor, based on the membrane of thickness
d =
dδ(
V1,
V2,
S0) = 0.008 cm, at wide range of the substrate concentration
S0 to evaluate the biosensor stability at that range.
Fig. 4 shows
imax versus
S0 at five values of
Vmax: 10
-10, 10
-9, 10
-8, 10
-7 and 10
-6 mol/cm
3s. No notable difference (
Fig. 4) is observed between values of
imax, calculated at two values of
Vmax: 10
-7 and 10
-6 mol/cm
3s, when the substrate concentration
S0 is less than about 10
-6 mol/cm
3.
Fig. 4 expressively shows the stable response of the biosensor, based on the enzyme membrane of thickness
d = 0.008 cm, when the maximal enzymatic rate reduces ten times: from 10
-6 to 10
-7 mol/cm
3s. Although the membrane thickness
dδ was calculated at the substrate concentration
S0 = 2×10
-8 mol/cm
3, the biosensor response is sufficiently stable to the substrate of concentration being up to about 10
-6 mol/cm
3. The dependence of
dδ on the substrate concentration was noticed before. The biosensor response is very sensitive to changes of
Vmax at high concentration of substrate.
Fig. 4 shows that the response of the biosensor of thickness of 0.008 cm is approximately constant at the concentration higher than about 10
-5 mol/cm
3. Because of this, such biosensor is practically unuseful to determinate larger substrate concentration.
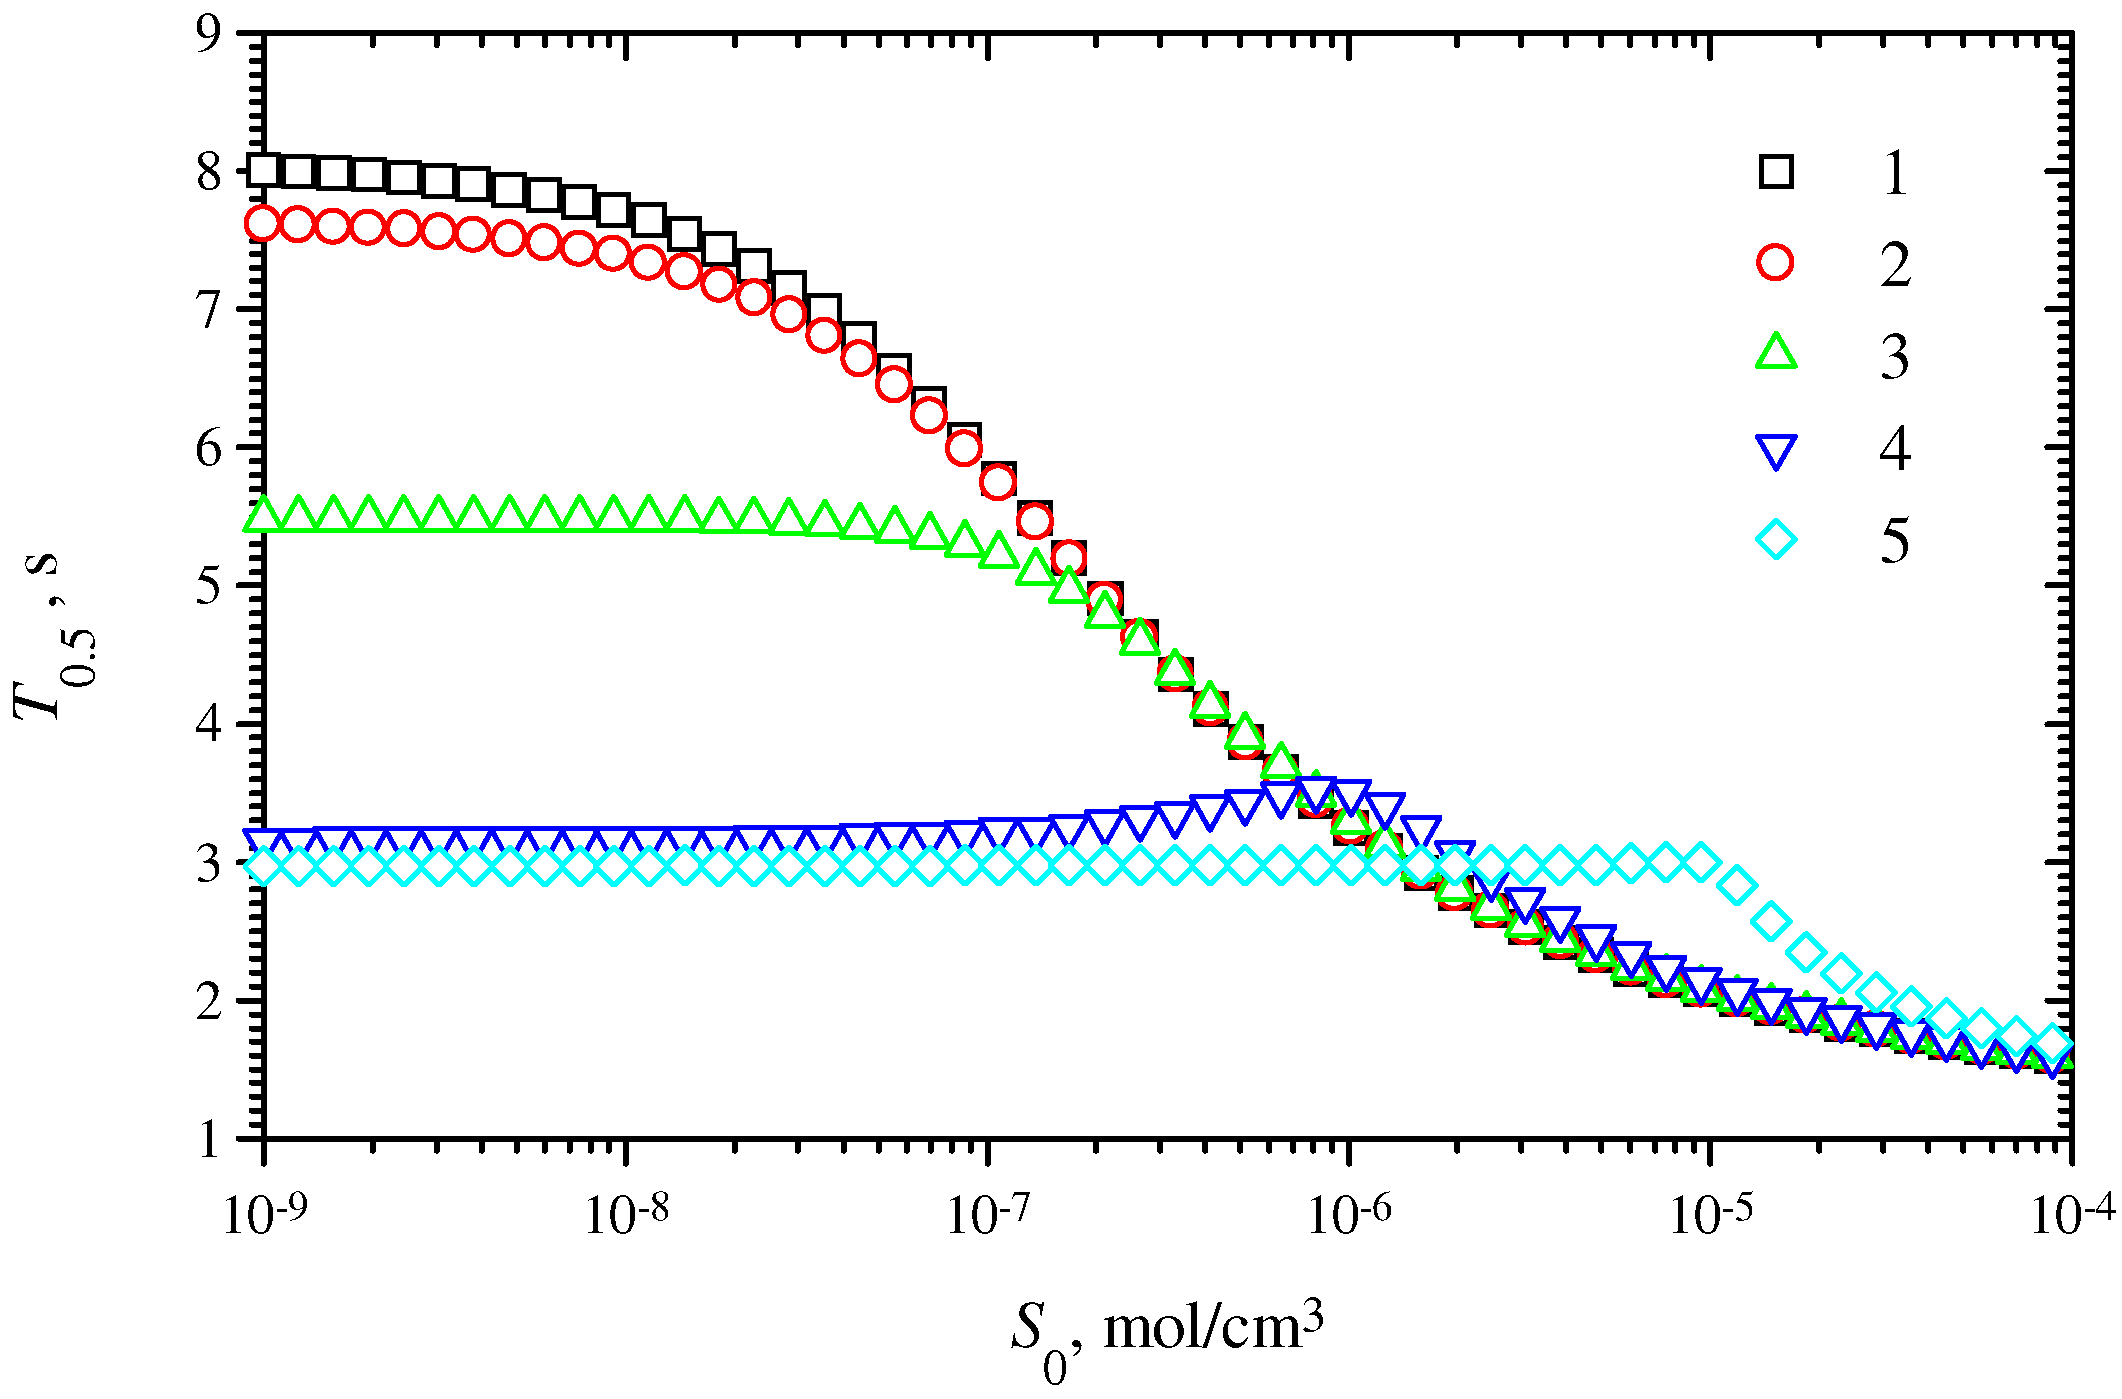
Fig. 5 presents an effect of substrate concentration
S0 on the half time
T0.5 of the maximal biosensor current. The thickness
d of the enzyme membrane is the same as above, i.e.
d =
dδ = 0.008 cm. One can see in
Fig. 5,
T0.5 is a monotonous decreasing function of
S0 at
Vmax = 10
-10, 10
-9 and 10
-8 mol/cm
3s, and
T0.5 is a non-monotonic function of
S0 at
Vmax = 10
-7 and 10
-6 mol/cm
3s. The effect of non-monotonous behaviour of the half time of maximal biosensor current versus substrate concentration has been discussed recently for the cases when the biosensor response is under diffusion control [
21]. However, the most important feature for this investigation is the sufficiently short time of the biosensor response. One can see,
T0.5 does not exceed 8 s. The biosensor, based on enzyme membrane of thickness of 0.008, gives very stable response in a sufficiently short time when
Vmax is between 10
-7 and 10
-6 mol/cm
3s as well as the substrate concentration
S0 is less than about 10
-6 mol/cm
3.
Figure 5.
The dependence of halftime
T0.5 of the maximal biosensor current on the substrate concentration
S0 at five maximal enzymatic rates
Vmax: 10
-10 (1), 10
-9 (2), 10
-8 (3), 10
-7 (4) and 10
-6 (5) mol/cm
3s, other parameters are the same as in
Fig. 4.
Figure 5.
The dependence of halftime
T0.5 of the maximal biosensor current on the substrate concentration
S0 at five maximal enzymatic rates
Vmax: 10
-10 (1), 10
-9 (2), 10
-8 (3), 10
-7 (4) and 10
-6 (5) mol/cm
3s, other parameters are the same as in
Fig. 4.
The concept of the minimal membrane thickness
dδ(
V1,
V2,
S0), at which the relative difference
R(
d,
V1,
V2,
S0) of the biosensor response is less than the decay rate
δ, can be considered as a framework to be used for determination of the membrane thickness in a design of biosensors producing highly stable response to the substrate of concentration
S0 while the enzymatic rate changes from
V1 to
V2. In this case the minimal thickness
dδ needs to be calculated at the concrete characteristics of biosensor operation: the diffusion coefficients
DS,
DP, number of electrons
ne, Michaelis constant
KM and the substrate concentration
S0 approximate to expected one. Rather often the concentration of analyte to be analysed varies within a known interval. Since the biosensor response is usually more stable at lower concentrations of the substrate (
Fig. 4) than at higher concentrations, a larger value of the range of expected concentrations should be employed in calculation of
dδ to ensure the stable response in the entire interval of the expected concentrations. In cases when
S0 <<
KM, the
imax may be calculated analytically from (12), otherwise the model (2)-(7) is preferable for calculation of
imax(
d,
Vmax,
S0), used in the framework, expressed by formulas (17), (18).
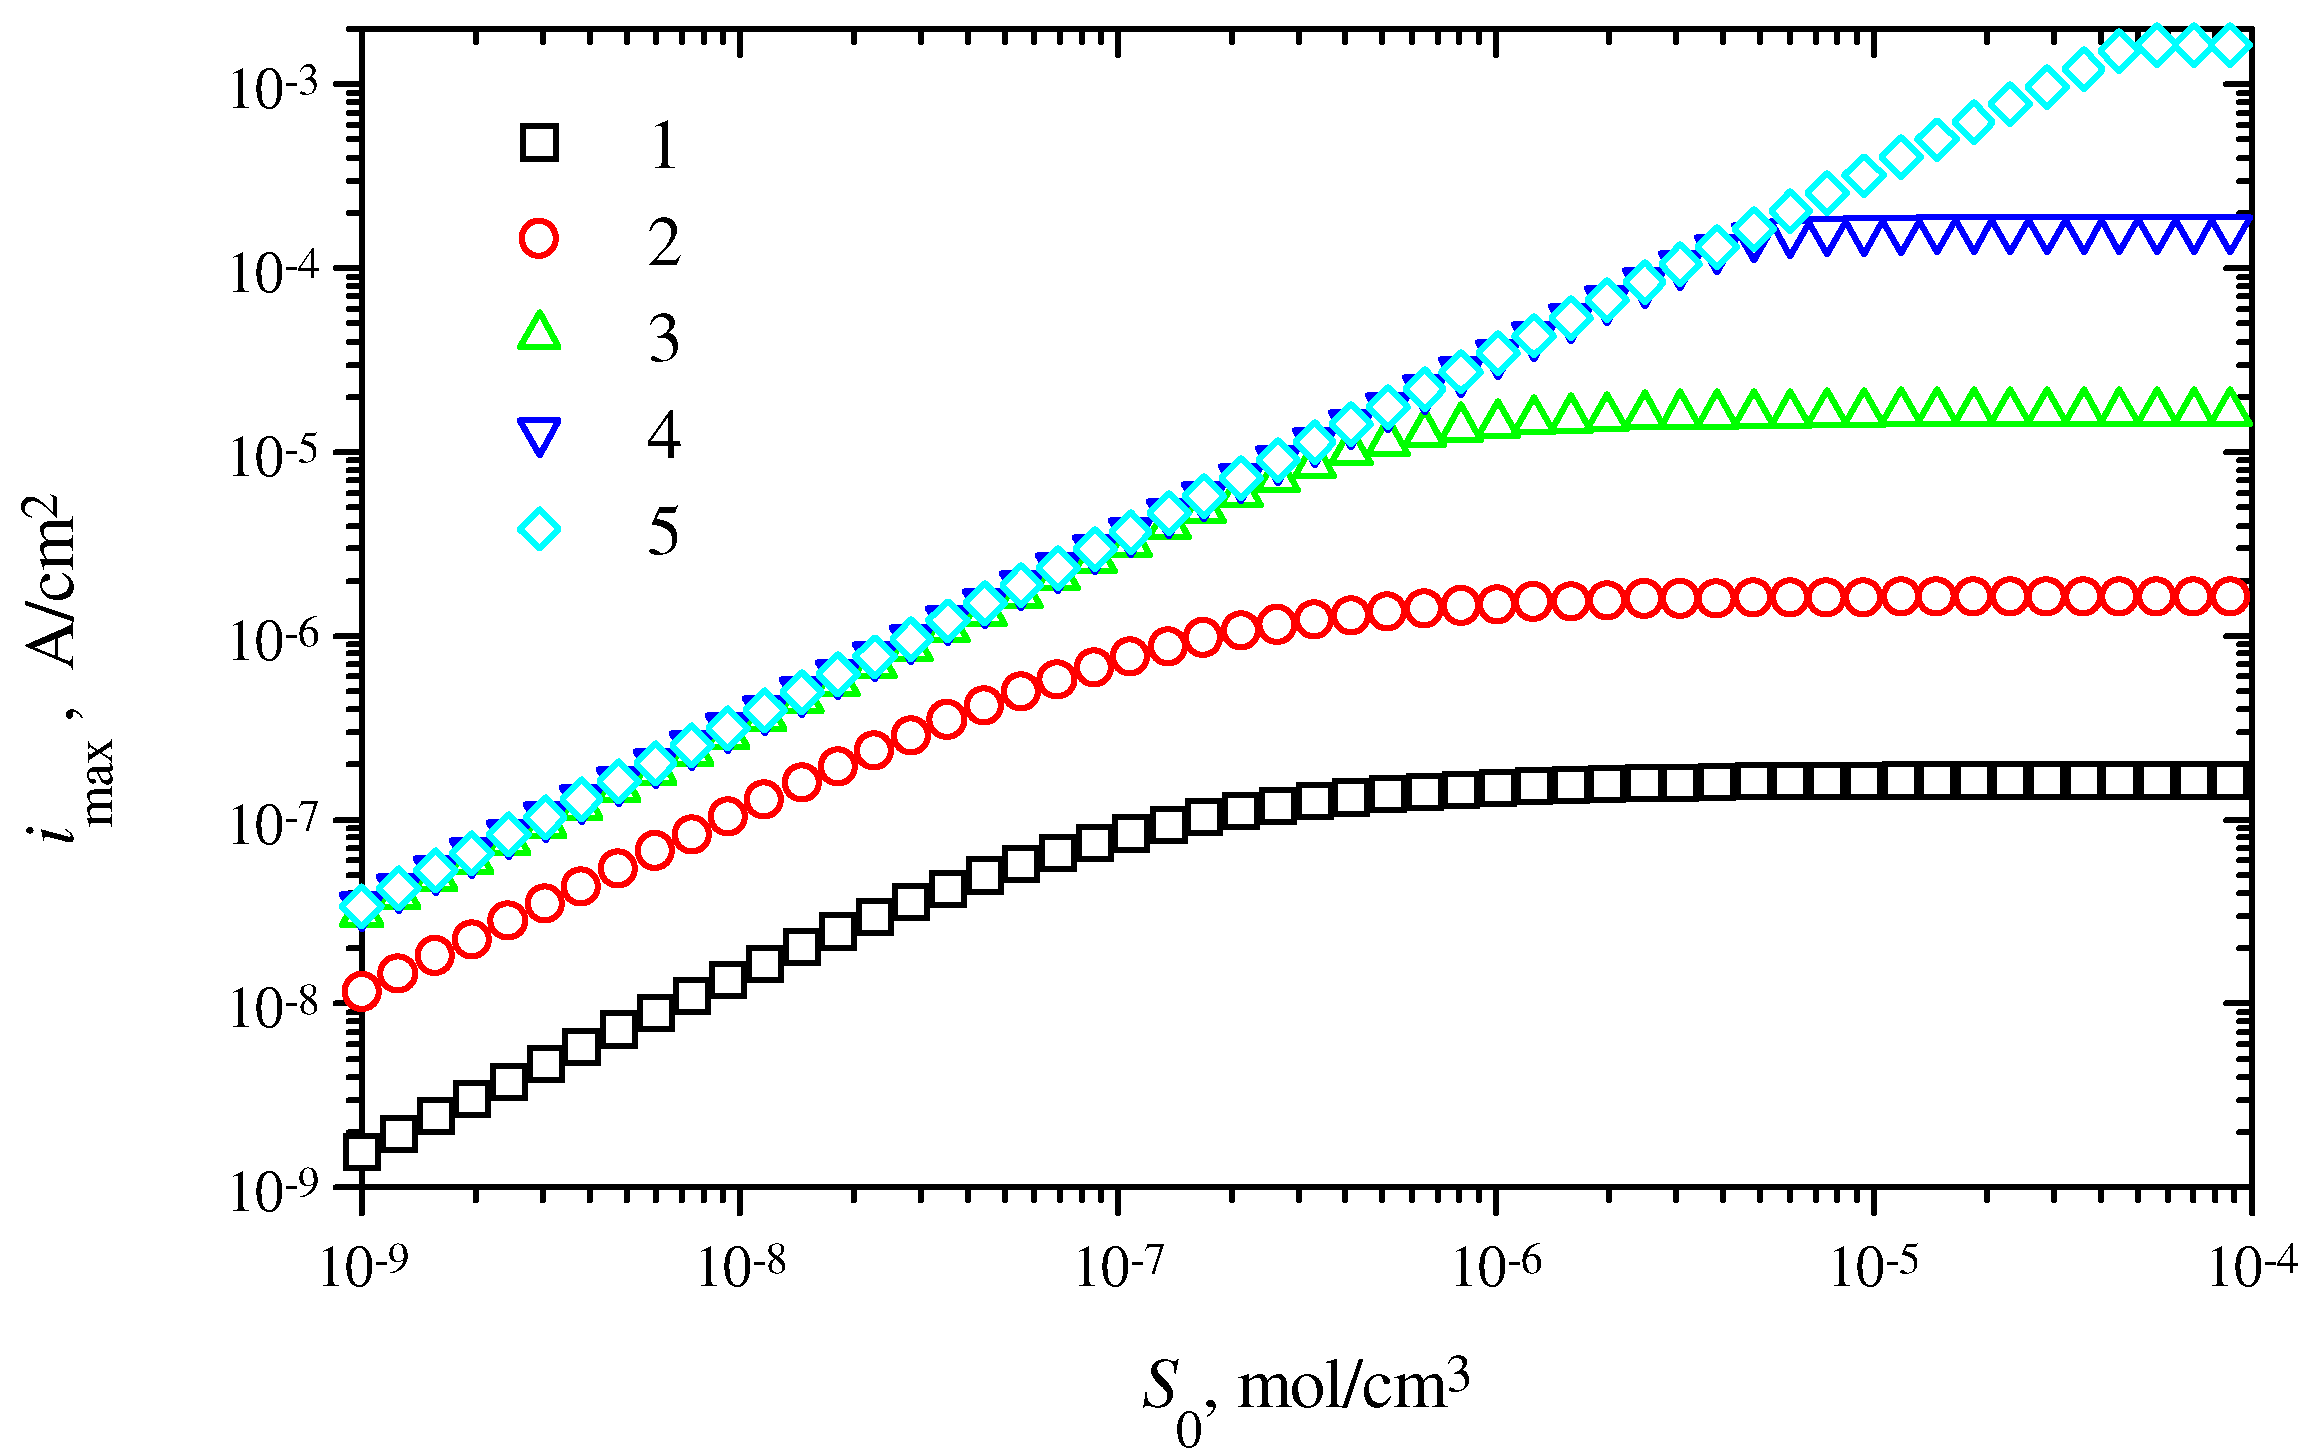
To be sure, that the framework, based on definition (17) and (18), really helps to find the membrane thickness at which the biosensor gives relatively stable response, we calculate the biosensor response also in a case of significantly thinner membrane.
Fig. 6 shows
imax versus
S0 at the same values of
Vmax as in
Fig. 4, however the enzyme membrane is eight times thinner,
d = 0.001cm. One can see in
Fig. 6, the biosensor response is very sensitive to changes of
Vmax. For example, in a case of
S0 = 10
-9 mol/cm
3, the maximal current
imax at
Vmax = 10
-6 mol/cm
3s is about 4.7 times higher than
imax at
Vmax = 10
-7 mol/cm
3s (
Fig. 6), while the corresponding values of
imax are approximately the same in the case when the membrane is of thickness
dδ(10
-7, 10
-6, 2×10
-8) = 0.008 cm (
Fig. 4).
Figure 6.
The dependence of the maximal biosensor current imax on the substrate concentration S0 at five maximal enzymatic rates Vmax: 10-10 (1), 10-9 (2), 10-8 (3), 10-7 (4) and 10-6 (5) mol/cm3s, d = 0.001cm.
Figure 6.
The dependence of the maximal biosensor current imax on the substrate concentration S0 at five maximal enzymatic rates Vmax: 10-10 (1), 10-9 (2), 10-8 (3), 10-7 (4) and 10-6 (5) mol/cm3s, d = 0.001cm.
Let us notice (
Fig. 4), that at
d = 0.008 cm, the relative difference
R (formula 17) between
imax at
Vmax = 10
-8 and another one
imax at
Vmax = 10
-7 mol/cm
3s is about 0.86 when
S0 = 2×10
-8 mol/cm
3. This difference keeps approximately unchanged at all
S0 less than about 10
-7 mol/cm
3. Let us reduce that difference. Using definition (18) and results, presented in
Fig. 4, we find
dδ(
V1,
V2, 2×10
-8) to be equal to about 0.017 cm when
V1 = 10
-8,
V2 = 10
-6 mol/cm
3s, assuming
δ = 0.1.
Fig. 7 plots
imax versus
S0 at
d = 0.017 and the same values of
Vmax as above. No notable difference is observed between values of
imax, calculated at three values of
Vmax: 10
-8, 10
-7 and 10
-6 mol/cm
3s, when the substrate concentration
S0 is less than about 5×10
-7 mol/cm
3.
Fig. 7 presents the stable response of the biosensor, based on the enzyme membrane of thickness
d = 0.017 cm, when the maximal enzymatic rate reduces 100 times: from 10
-6 to 10
-8 mol/cm
3s while analysing substrate of concentration less than 5×10
-7 mol/cm
3.
Figure 7.
The dependence of the maximal biosensor current imax on the substrate concentration S0 at five maximal enzymatic rates Vmax: 10-10 (1), 10-9 (2), 10-8 (3), 10-7 (4) and 10-6 (5) mol/cm3s, d = dδ(10-8, 10-6, 2 × 10⁻⁸) = 0.017 cm, calculated by formula (18) accepting δ = 0.1.
Figure 7.
The dependence of the maximal biosensor current imax on the substrate concentration S0 at five maximal enzymatic rates Vmax: 10-10 (1), 10-9 (2), 10-8 (3), 10-7 (4) and 10-6 (5) mol/cm3s, d = dδ(10-8, 10-6, 2 × 10⁻⁸) = 0.017 cm, calculated by formula (18) accepting δ = 0.1.
In the high substrate concentration case,
S0 >>
KM, the stationary current can be expressed as follows [25],
In the all cases of the investigation of the effect of the substrate concentration on the biosensor response, values of
imax, obtained by digital simulation at
S0 =10
-4 mol/cm
3, were compared with the corresponding values, calculated by formula (19). The difference between two corresponding values varies less than 0.1%. Consequentially, in the high substrate concentration case,
S0 >>
KM, the maximal biosensor current can be successfully calculated from formula (19), while (12) may be used in the low substrate concentration case,
S0 <<
KM. However, the digital simulation, based on the model (2)-(7), may be successfully applied in the entire domain of substrate concentration, and the simulation is especially reasonable in the middle substrate concentration case,
S0 ≈
KM.
The sensitivity is one of the most important characteristic of biosensors. The sensitivity
BS (Acm/mol) of a biosensor can be expressed as a gradient of the maximal biosensor current density
imax (A/cm
2) with respect to the substrate concentration
S0 (mol/cm
3)
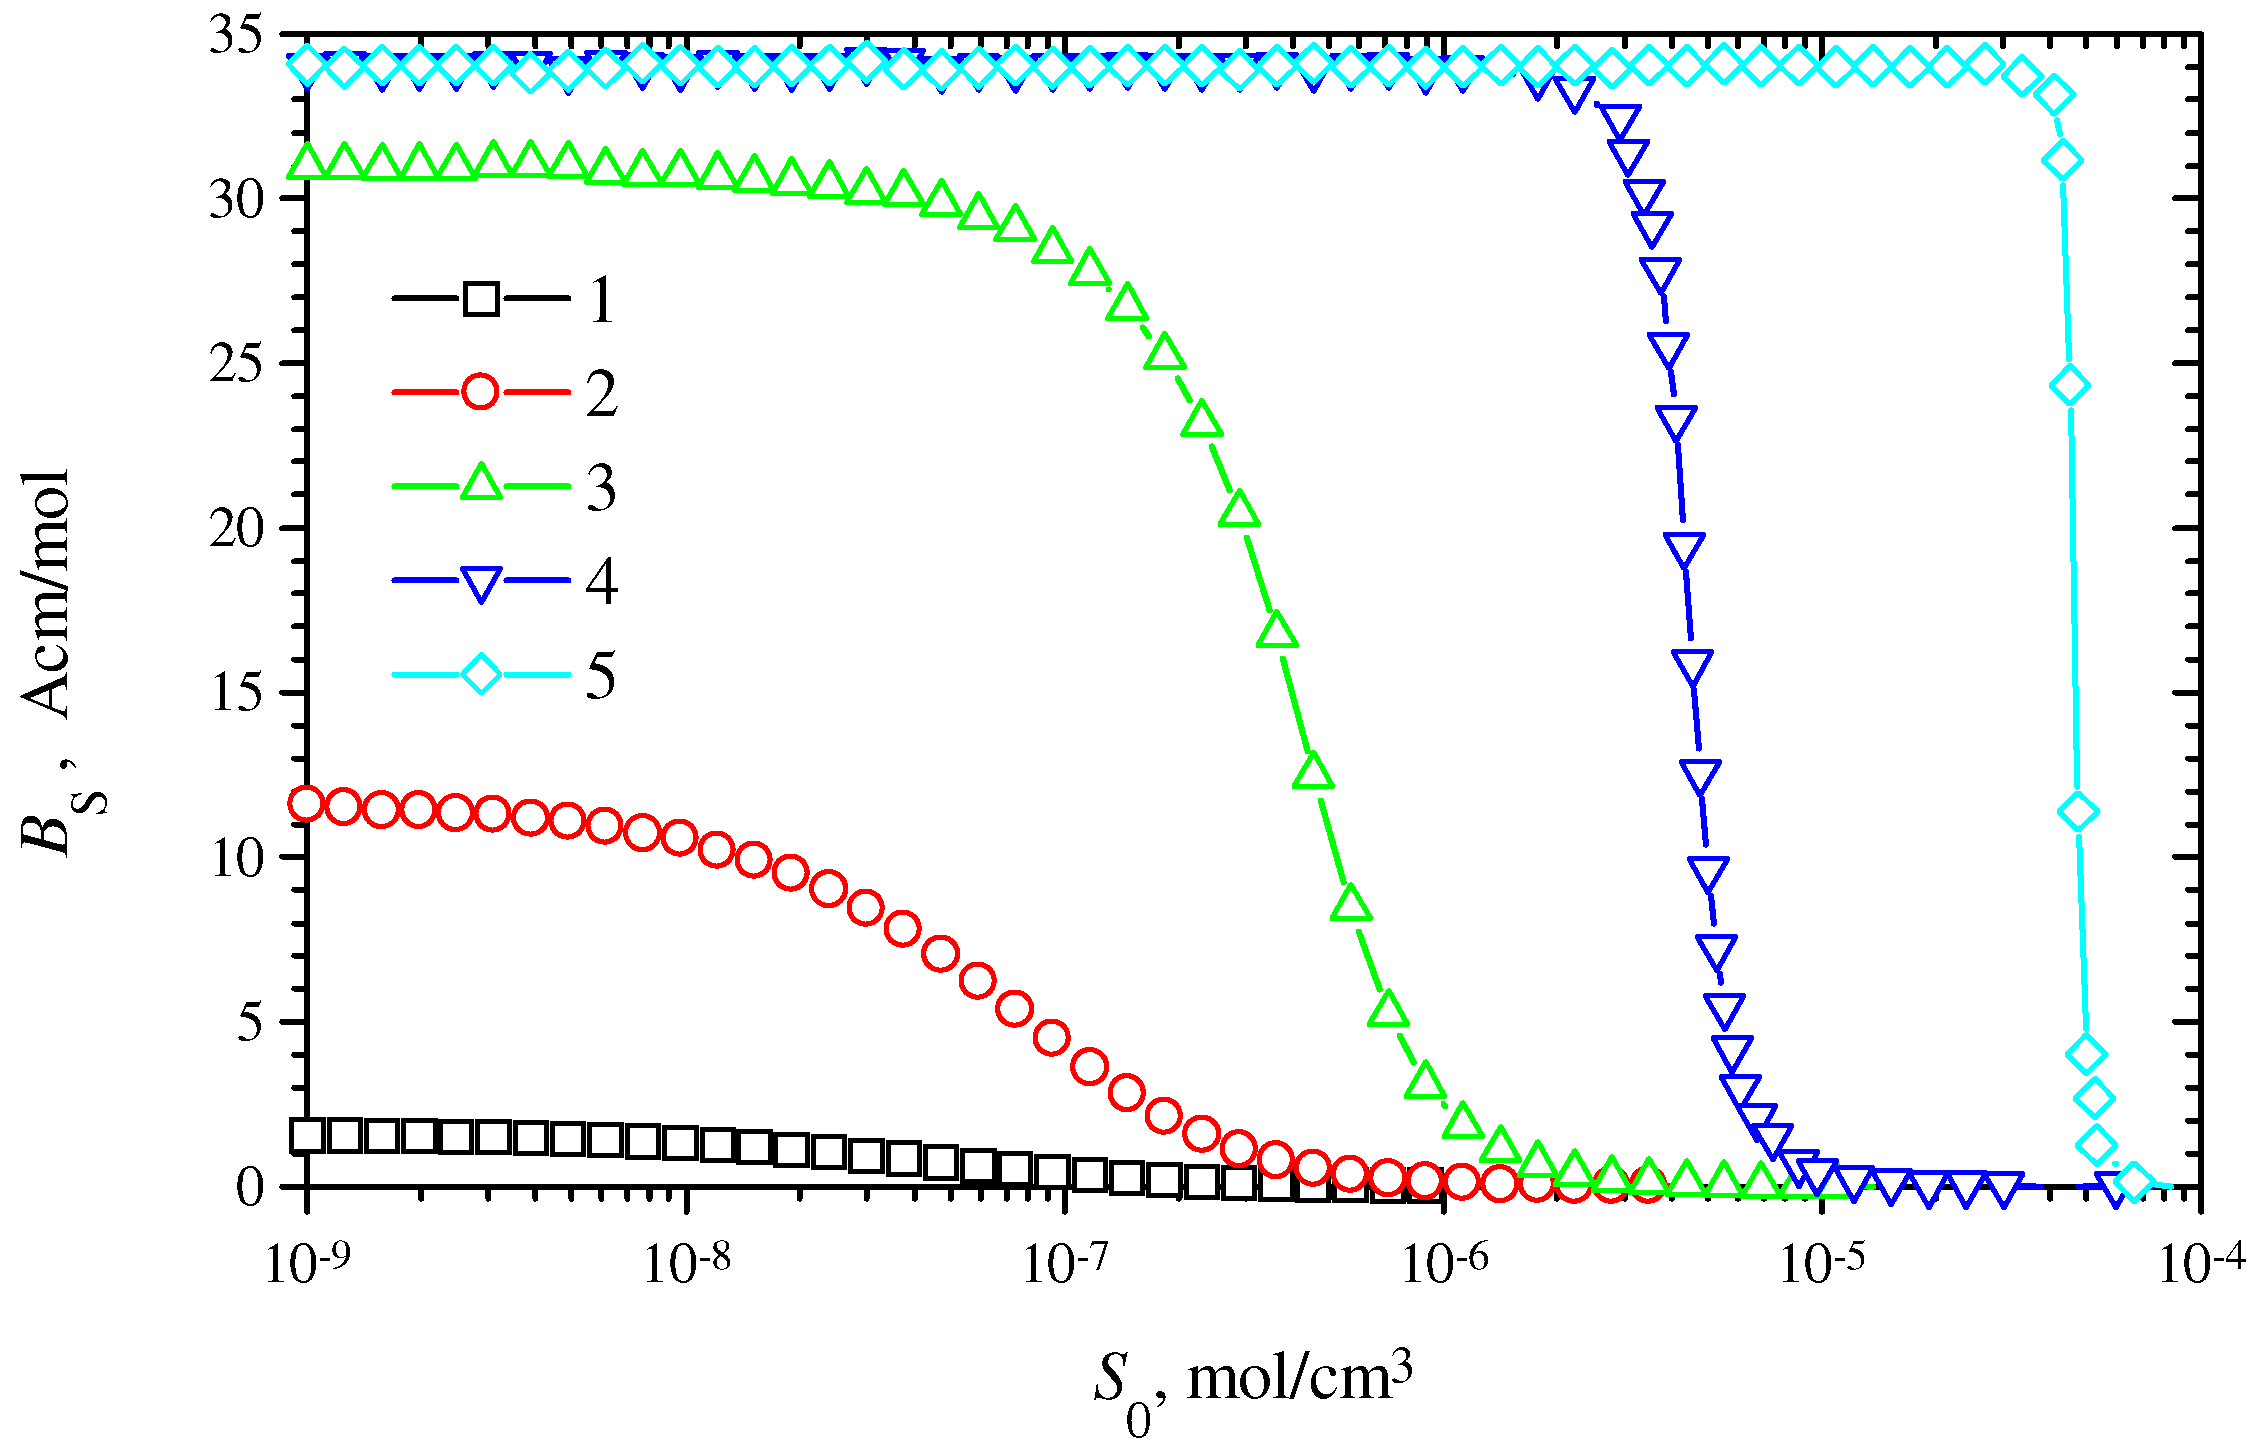
Fig. 8 shows the biosensor sensitivity
BS versus the substrate concentration
S0 at the same five maximal enzymatic rates as above in the case of membrane thickness
d of 0.017 cm. No notable difference is observed between the sensitivity
BS, calculated at two values of
Vmax: 10
-7 and 10
-6 mol/cm
3s, when the substrate concentration is less than about 2×10
-6 mol/cm
3. The biosensor sensitivity at
Vmax = 10
-8 mol/cm
3 is about 10% less than in two cases of higher
Vmax: 10
-7 and 10
-6 mol/cm
3s. Let us remind, that the membrane thickness of 0.017 cm has been calculated requiring the relative difference
R(
d, 10
-8, 10
-6, 2×10
-8) be less than
δ = 0.1, i.e. 10%. Because of a large scale that minimal difference (0.1) is not practically notable in
Fig. 7. However, this easy seems in
Fig. 8, which represents the biosensor sensitivity. Comparing
Fig. 7 and
Fig. 8 we see direct relation between the maximal biosensor current
imax as a function of
S0 and the function
BS of
S0.
Figure 8.
The dependence of the biosensor sensitivity
BS (formula 20) on the substrate concentration
S0 at five maximal enzymatic rates
Vmax: 10
-10 (1), 10
-9 (2), 10
-8 (3), 10
-7 (4) and 10
-6 (5) mol/cm
3s. Other parameters are the same as in
Fig. 7.
Figure 8.
The dependence of the biosensor sensitivity
BS (formula 20) on the substrate concentration
S0 at five maximal enzymatic rates
Vmax: 10
-10 (1), 10
-9 (2), 10
-8 (3), 10
-7 (4) and 10
-6 (5) mol/cm
3s. Other parameters are the same as in
Fig. 7.
Using formula (12) we can calculate also the derivative of the stationary current
i∞ with respect to
S0. In that way we obtain a constant biosensor sensitivity
BS for
S0 <<
KM. This stagnancy of
BS can be also noticed in
Fig. 8. One can see in
Fig. 8, at high enzymatic rates, e.g.
Vmax = 10
-7 and 10
-6 mol/cm
3s, the biosensor sensitivity remains approximately constant even at
S0 greater than
KM. However at low enzymatic rates (
Vmax = 10
-10 and 10
-9 mol/cm
3s), the sensitivity starts to decrease notable already at
S0 <
KM.
In the high substrate concentration case,
S0 >>
KM, value of
BS can be obtained also from the formula (19) as
BS = 0, which compares favourably with the results of digital simulation (
Fig. 8).
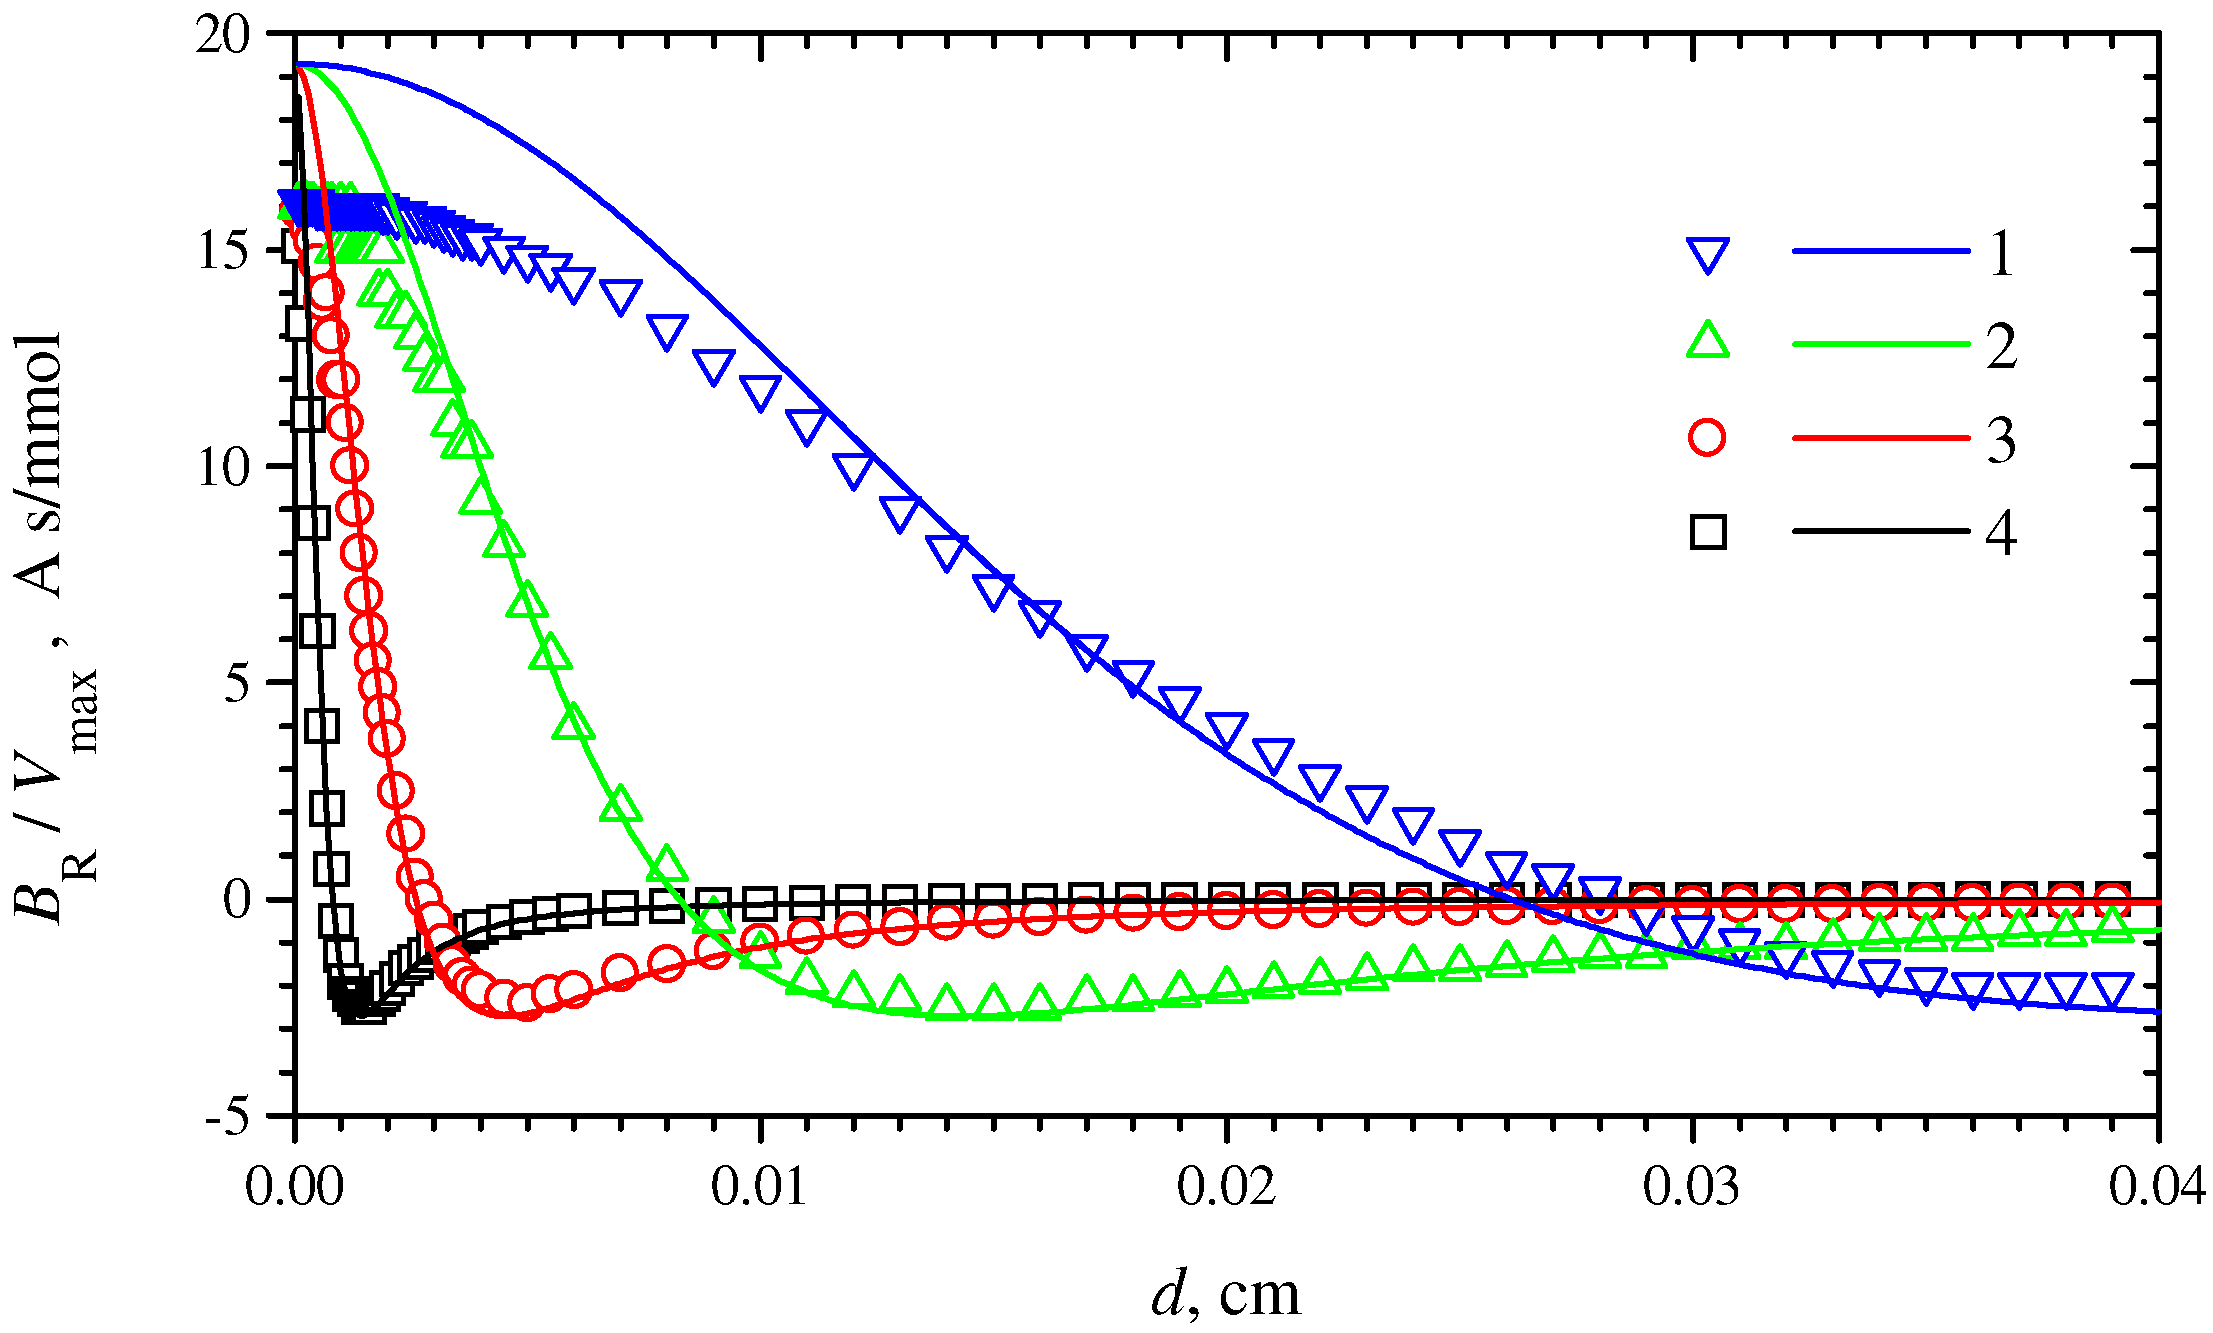
Fig. 2 shows the significant influence of the membrane thickness on the biosensor response. However, the significance of the influence is different at the different membrane thickness. We introduce a resistance
BR of the membrane-based biosensors to changes of membrane thickness. The resistance
BR (A/cm
3) of a biosensor is expressed as a gradient of the maximal biosensor current density
imax (A/cm
2) with respect to the membrane thickness
d (cm)
Fig. 9 plots the biosensor resistance
BR versus the membrane thickness
d. The substrate concentration
S0 as well as other parameters are the same as in
Fig. 2. Since the resistance
BR varies in orders of magnitude,
BR was normalised with
Vmax. So,
Fig. 9 shows the resistance
BR divided by
Vmax. versus the membrane thickness
d. In
Fig. 9, symbols are numerical solutions of the model (2)-(7), while lines are analytical ones (formula 14). One can see (
Fig. 9) the interval (from –2.5 to 19.2 mAs/mol) of variation of
BR/
Vmax is approximately the same at all four values of the maximal enzymatic rate
Vmax. It means that the maximal as well as minimal biosensor resistance
BR is directly proportional to
Vmax. Since the shape of curves of the normalised resistance considerably differs (
Fig. 9), the dependence of
BR on
Vmax is non-linear in entire domain of
d. The relative difference between numerical solutions and analytical ones reaches about 20%. The largest difference is notable at thinnest enzyme membranes.
Figure 9.
The biosensor resistance
BR (formula 21), normalised with the maximal enzymatic rate
Vmax, versus the membrane thickness
d. Symbols are numerical solutions, while lines are analytical ones (formula 14). All parameters are the same as in
Fig. 2.
Figure 9.
The biosensor resistance
BR (formula 21), normalised with the maximal enzymatic rate
Vmax, versus the membrane thickness
d. Symbols are numerical solutions, while lines are analytical ones (formula 14). All parameters are the same as in
Fig. 2.


