Introduction
The kinetics of reticulation with the two-component polyurethane systems can be observed through the conversion degree of the functional groups over a certain time period. The physical and chemical methods are applied to quantify the kinetic parameters of the reaction, as well as the structural modifications in the analyzed system. The physical methods of the analysis are usually more suitable than the chemical ones and are based on measuring some physical property of the reaction mixture that is altered during the reaction.
The calorimetry gives the quantitative data on the development of the chemical reaction, but without the possibility to make the difference between the main reactions from the side ones.
The thermogravimetric method [
1] is based on measuring the mass loss in the form of volatile products, at the controlled temperature regime or isothermally. If the volatile products occur during the chemical reaction, the thermogravimetric method can be applied to perform the kinetic analysis of the chemical reaction and to determine the kinetic parameters.
The differential scanning calorimetry (DSC) is one of the thermoanalytical methods used to measure the difference of the inlet heat into the analyzed sample and the referent substance in the temperature function, when the sample and the referent substance are exposed to the controlled temperature program. This thermoanalytical method has been developed as a better quantitative modification of the differential thermal analysis (DTA). In the last twenty or so years the DSC has put out of use the DTA, because with the DSC the calibrating factors do not change along with the temperature, so that the surface of the thermogram below the maximum and the minimum is directly proportional to the temperature change.
The following methods for determining the kinetic parameters of the simple chemical reactions are in use: Freeman-Carroll [
2,
3] method, Crane-Ellerstein [
4] method and Kissinger [
5] method.
The situation is very much complicated if it is not the case of the simple chemical reaction. As long as the physical transformation advances, the other physical changes cannot start. The sample of the material stays at the constant temperature until the physical transformation ends completely. However, the chemical reactions can go on simultaneously at different rates and at different reaction temperatures. This will complicate the DSC curve very much and require considerably complex mathematics.
Sandu and Sing [
6] have studied this problem and formulated the equations considering which pseudo kinetic parameters for the complex reactions can be obtained, but only if the orders of the simple chemical reactions are units. The most significant assumption they have made in this matter is that the system consists of two homogenous reactions of the first order, and that the entire DSC signal is the result of the both processes.
Another possibility, that Sandu and Sing [
6] have anticipated, to obtain the pseudo kinetic parameters from the complex DSC curve, makes it possible to divide the complex curve into two simple ones, and then to analyse each “simple” curve using some of the previous methods that have been worked out for such simple reactions.
The main aspect in the development of the aqueous PUR is, in the first place, to find methods for preventing the undesired secondary reactions with water and achieving the best crosslinking. One novel approach to control the water side reaction is the use of catalysts which selectively catalyze the isocyanate-polyol reaction but not the isocyanate-water reaction. This reaction is reduced to a minimum by use of the non-tin catalysts [
7]. The relative selectivity (S), was measured as the urethane IR peak area (P
urethan)/ urea IR peak area (P
urea) ratio, by the method of Werner Blank [
7].
The complex of Mn(III)-diacetylacetonatomaleate with various ligands based on the acetylacetonate and maleic acid that was used in the experiment in our researches showed the high selectivity for the isocyanate-hydroxyl reaction [
8,
9].
The DSC method has been employed to monitor the kinetics of reticulation of the two representative samples of aqPUR1 and aqPUR2, without the catalysts and with the commercial catalyst of zirconium (CAT®XC-6212) and the highly selective manganic catalyst, the complex Mn (III)- diacetylacetonemaleinate (MAM).
Experimental
The polyols and polyisocyanates used during the study were the commercial materials and were used without further purification.
The two polyol components with the hydroxyl number above 130 used in this experiment were: acrylic dispersion in the mixture of water/butyl alcohol, (Macrynal VSM 2521 w/42 WAB, Solutia Austria GmbH) and also the acrylic resin as water dispersion (Macrynal VSM 6299 w/42 WA, Solutia Austria GmbH). The contents of dry matter in these dispersions were 42%.
As the suitable hardeners for these dispersions, the aliphatic polyfunctional isocyanates based on hexamethylen diisocyanates have been employed and they are as follows: Bayhydur VP LS 2319 (18.2% NCO), Bayhydur VP LS 2336 (16.2% NCO), Bayhydur VP LS 2150 (13.4% NCO) as well as Desmodur 3600 (23% NCO), purchased from Bayer AG Germany. All the used reticulation agents are 100% without the organic solvents except for Bayhydur VP LS 2150 that is 70% in butylacetate.
The zirconium catalyst (ZrCAT) is a zirconium tetra-dionato complex [
10] in a reactive diluent with a metal content of 0.4%.
The manganese catalyst (complex of Mn(III)-diacetylacetonatomaleate) has shown the unusually high selectivity for the isocyanate-polyol reaction in comparison with the commercially available zirconium catalyst. MnCAT is in the reactive diluent with a metal content of 0.4%.
The catalyst concentrated 2% relating to the coating hardness has been added to the component B.
The
Table 1 and
Table 2 present the two-component aqueous polyurethane compositions, aqPUR1 and aqPUR2, based on the polyols Macrynal VSM 6299 w/42 WA and Maccrynal VSM 2521 w/42 WAB.
The samples were prepared with the organic solvents and water, and so the laced up aluminium ampules with the opening on the lid to release the gases were used. The referent vessel was made of aluminium.
The temperature of the analyses ranged from 50-450°C. In order to record adequately the modifications in the samples, in the examined temperature range, the heating rate of 0.5°C/min was employed. The sample weight was 360 mg.
The instrument had the autocalibration and the linear program package for the realization of the programed temperature gradient.
Results and Discussion
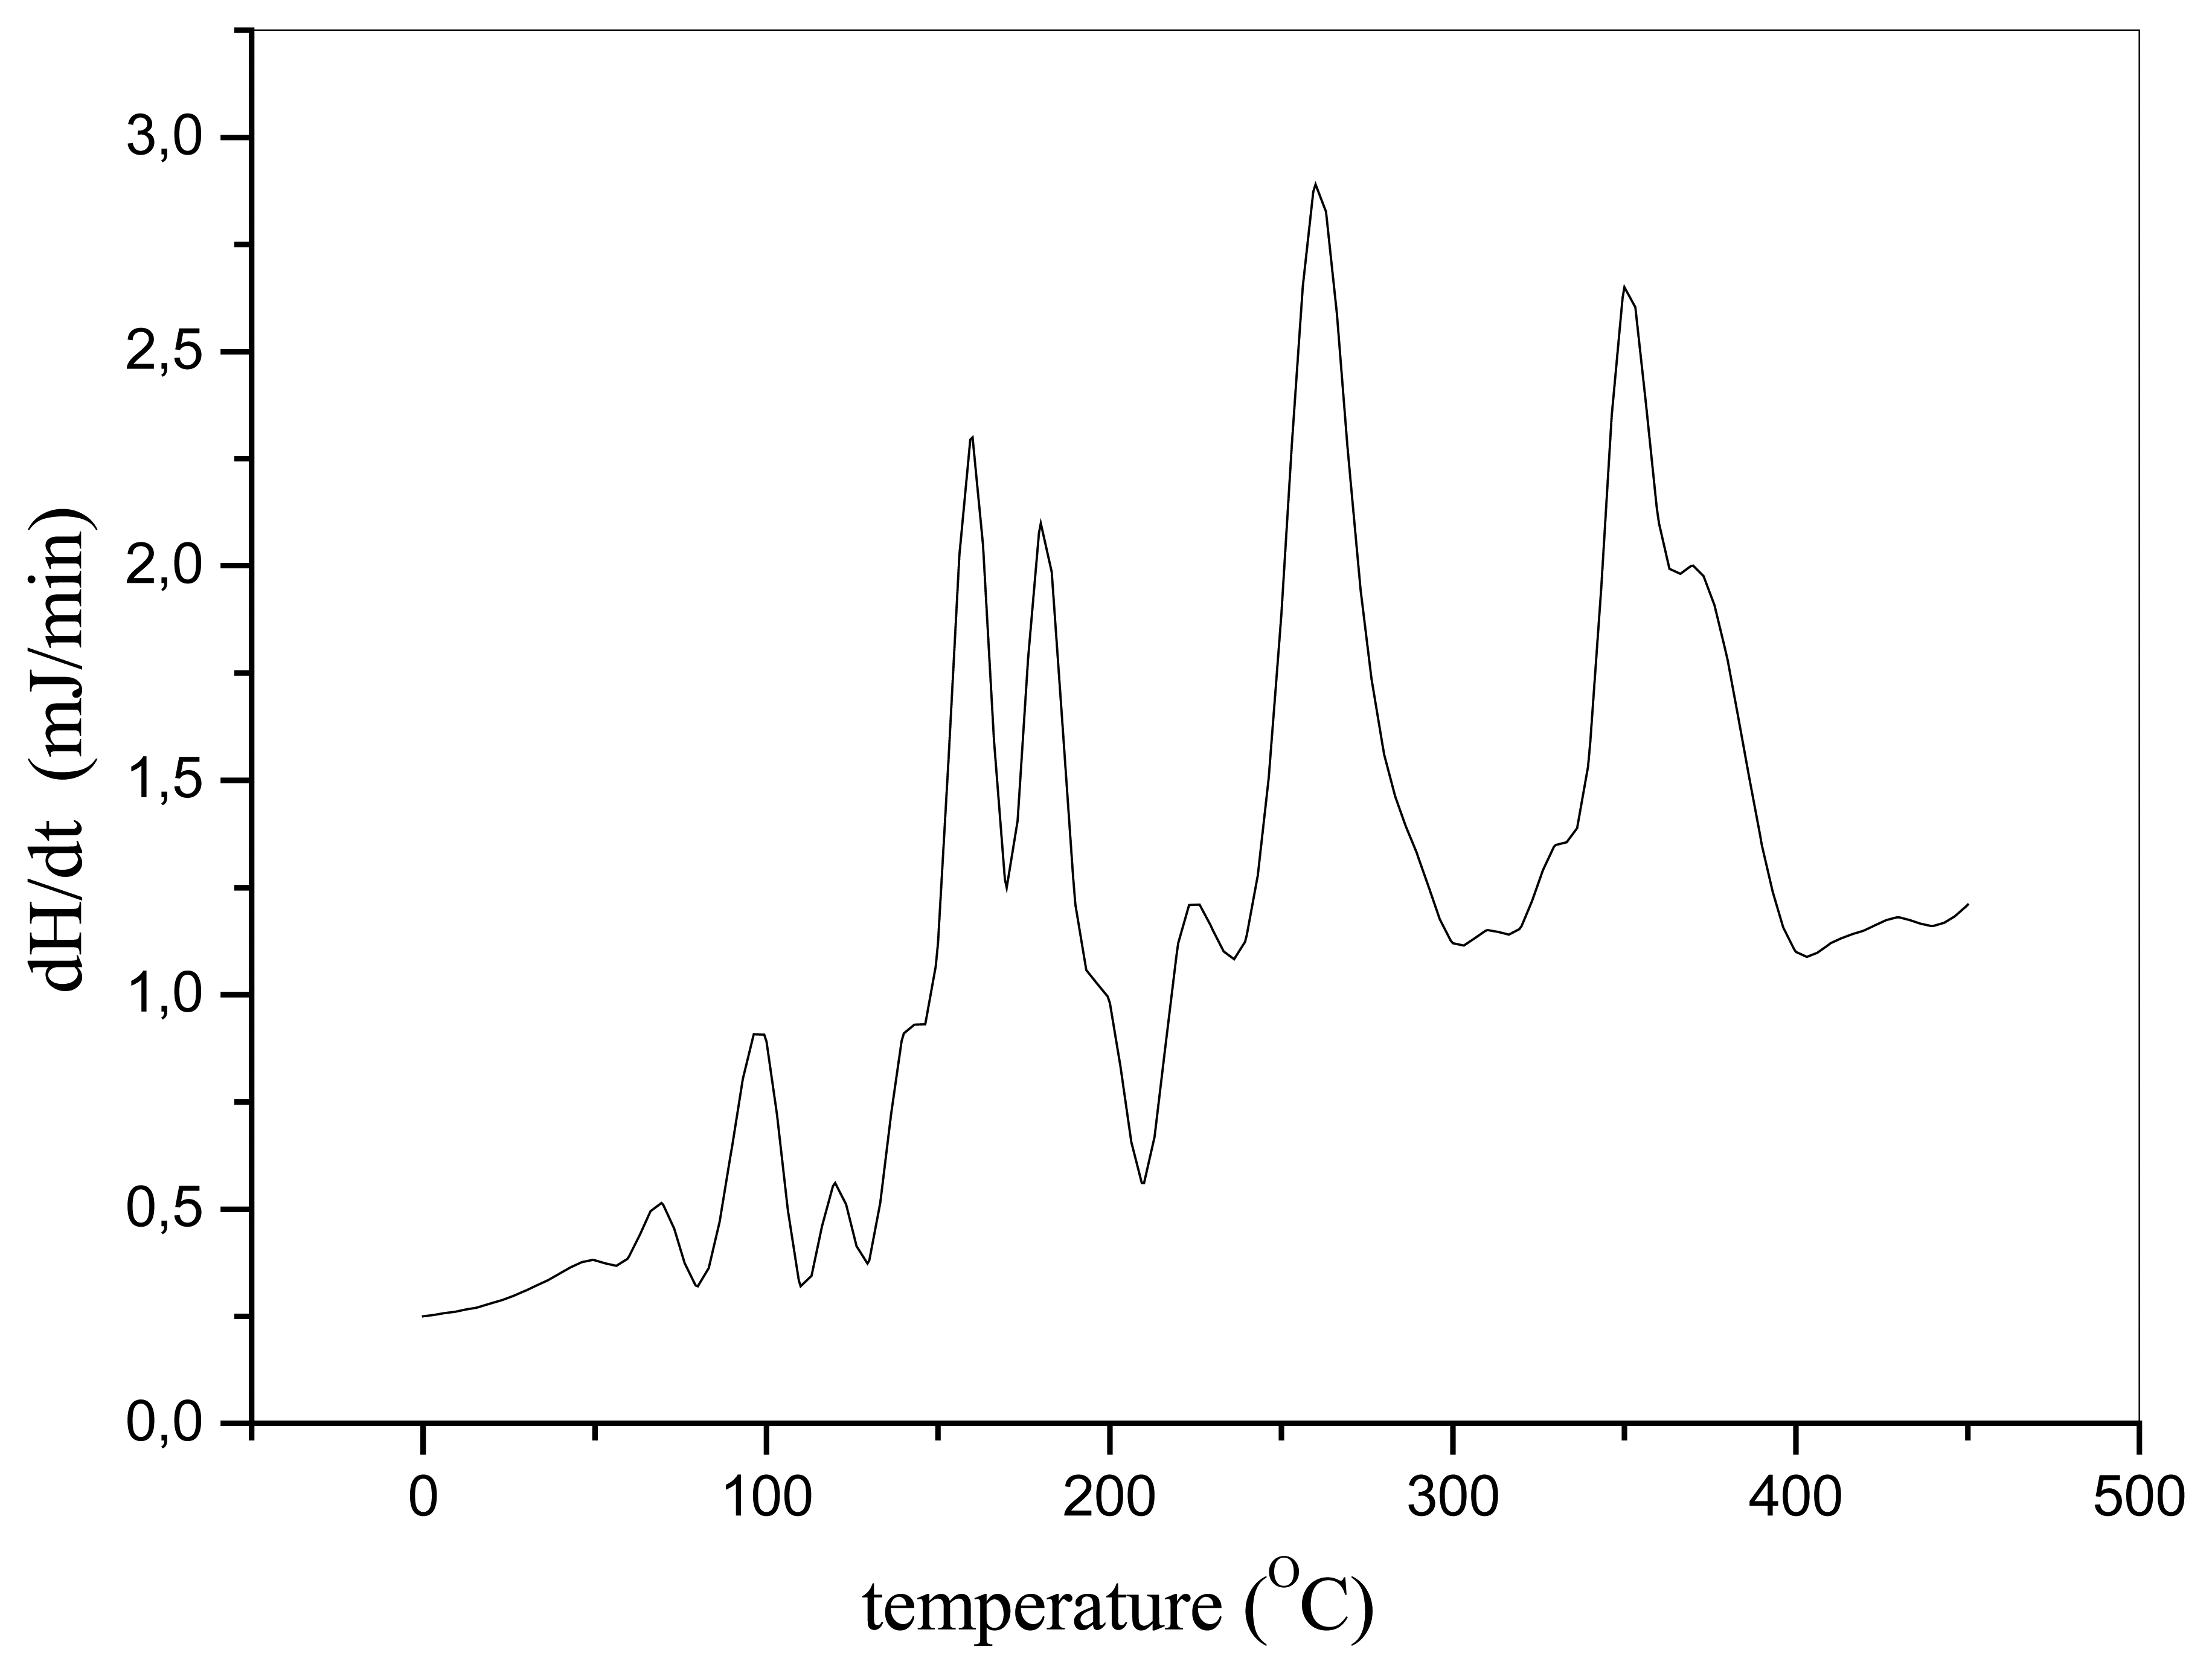
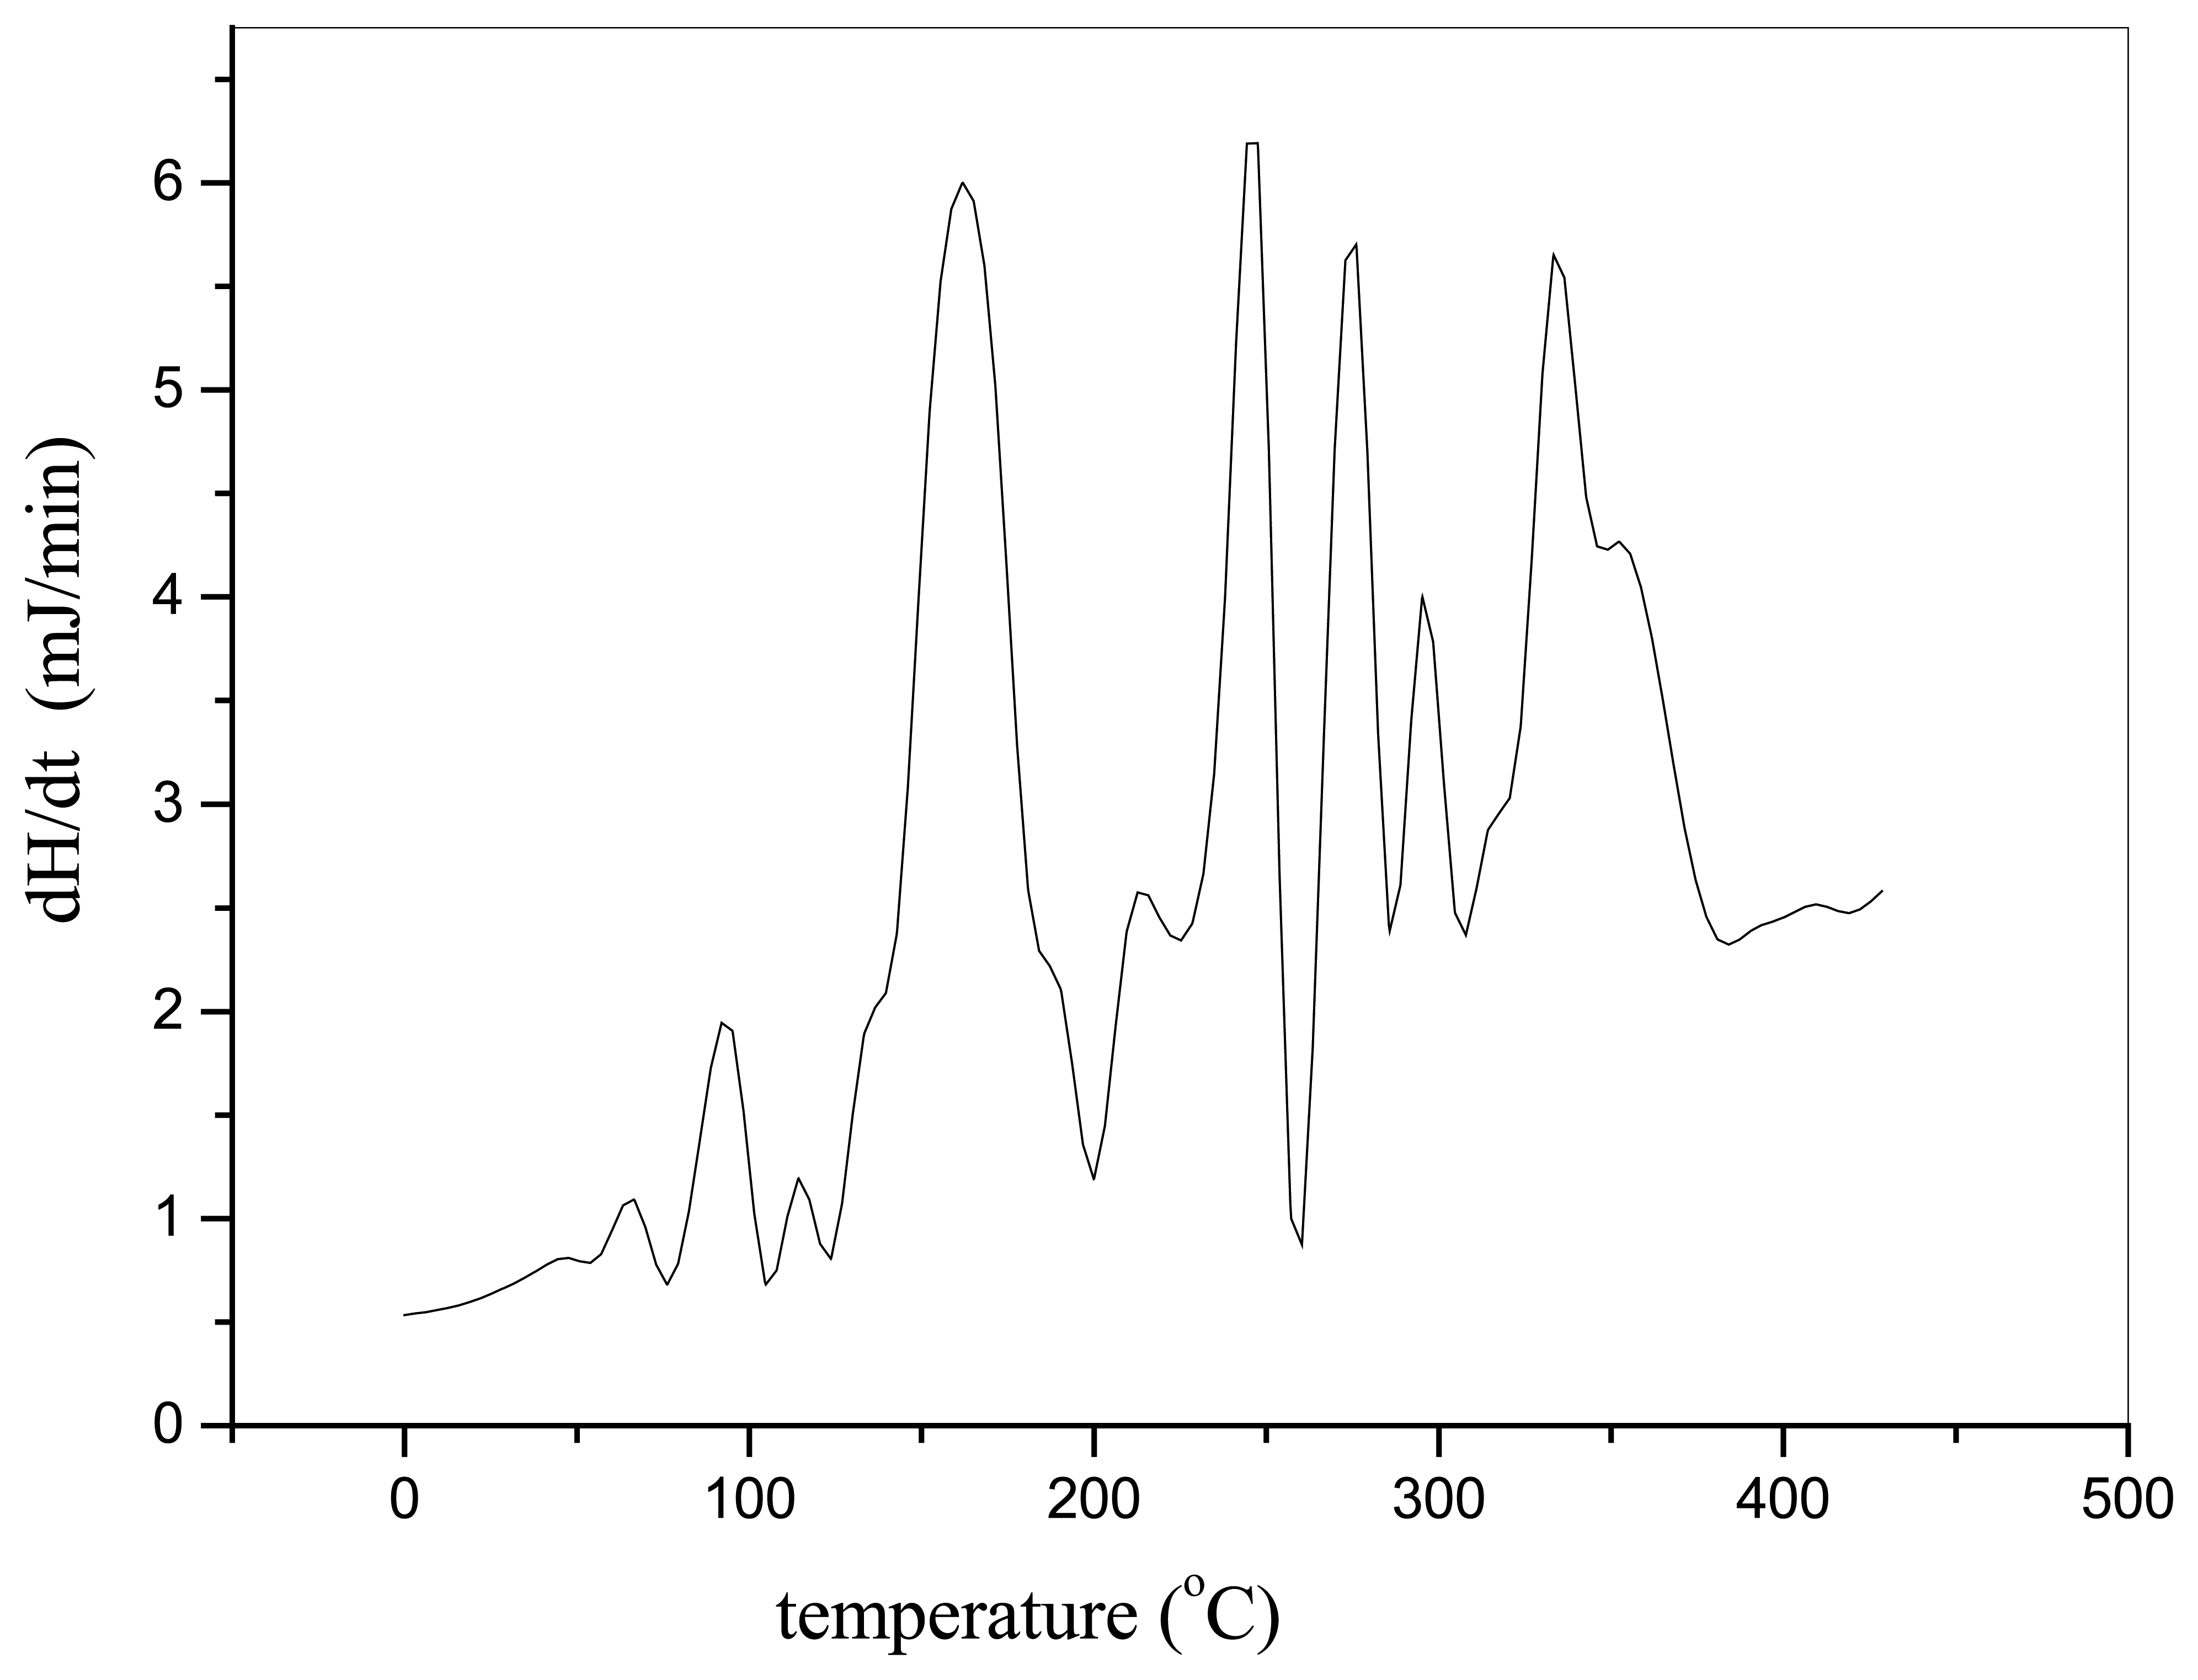
The analysis of the DSC curve of the aqueous two-component polyurethane systems (
Figure 1) shows that the systems (aqPUR 1) have the characteristic reactions of transformation at about 100°C that suits the evaporation of the solvent from the system [
11].
The second clue moment, occurring in the system, is the full reaction of the polyisocyanates, the beginning of forming the side bonds or final formation of films structure. The transformation that happens at the temperature of 120-300°C suits the reticulation reaction and the formation of polyurethane films, that is, the disappearance of the NCO- groups.
The third clue moment in the system is the degradation of the polymer film with the peaks above 300°C.
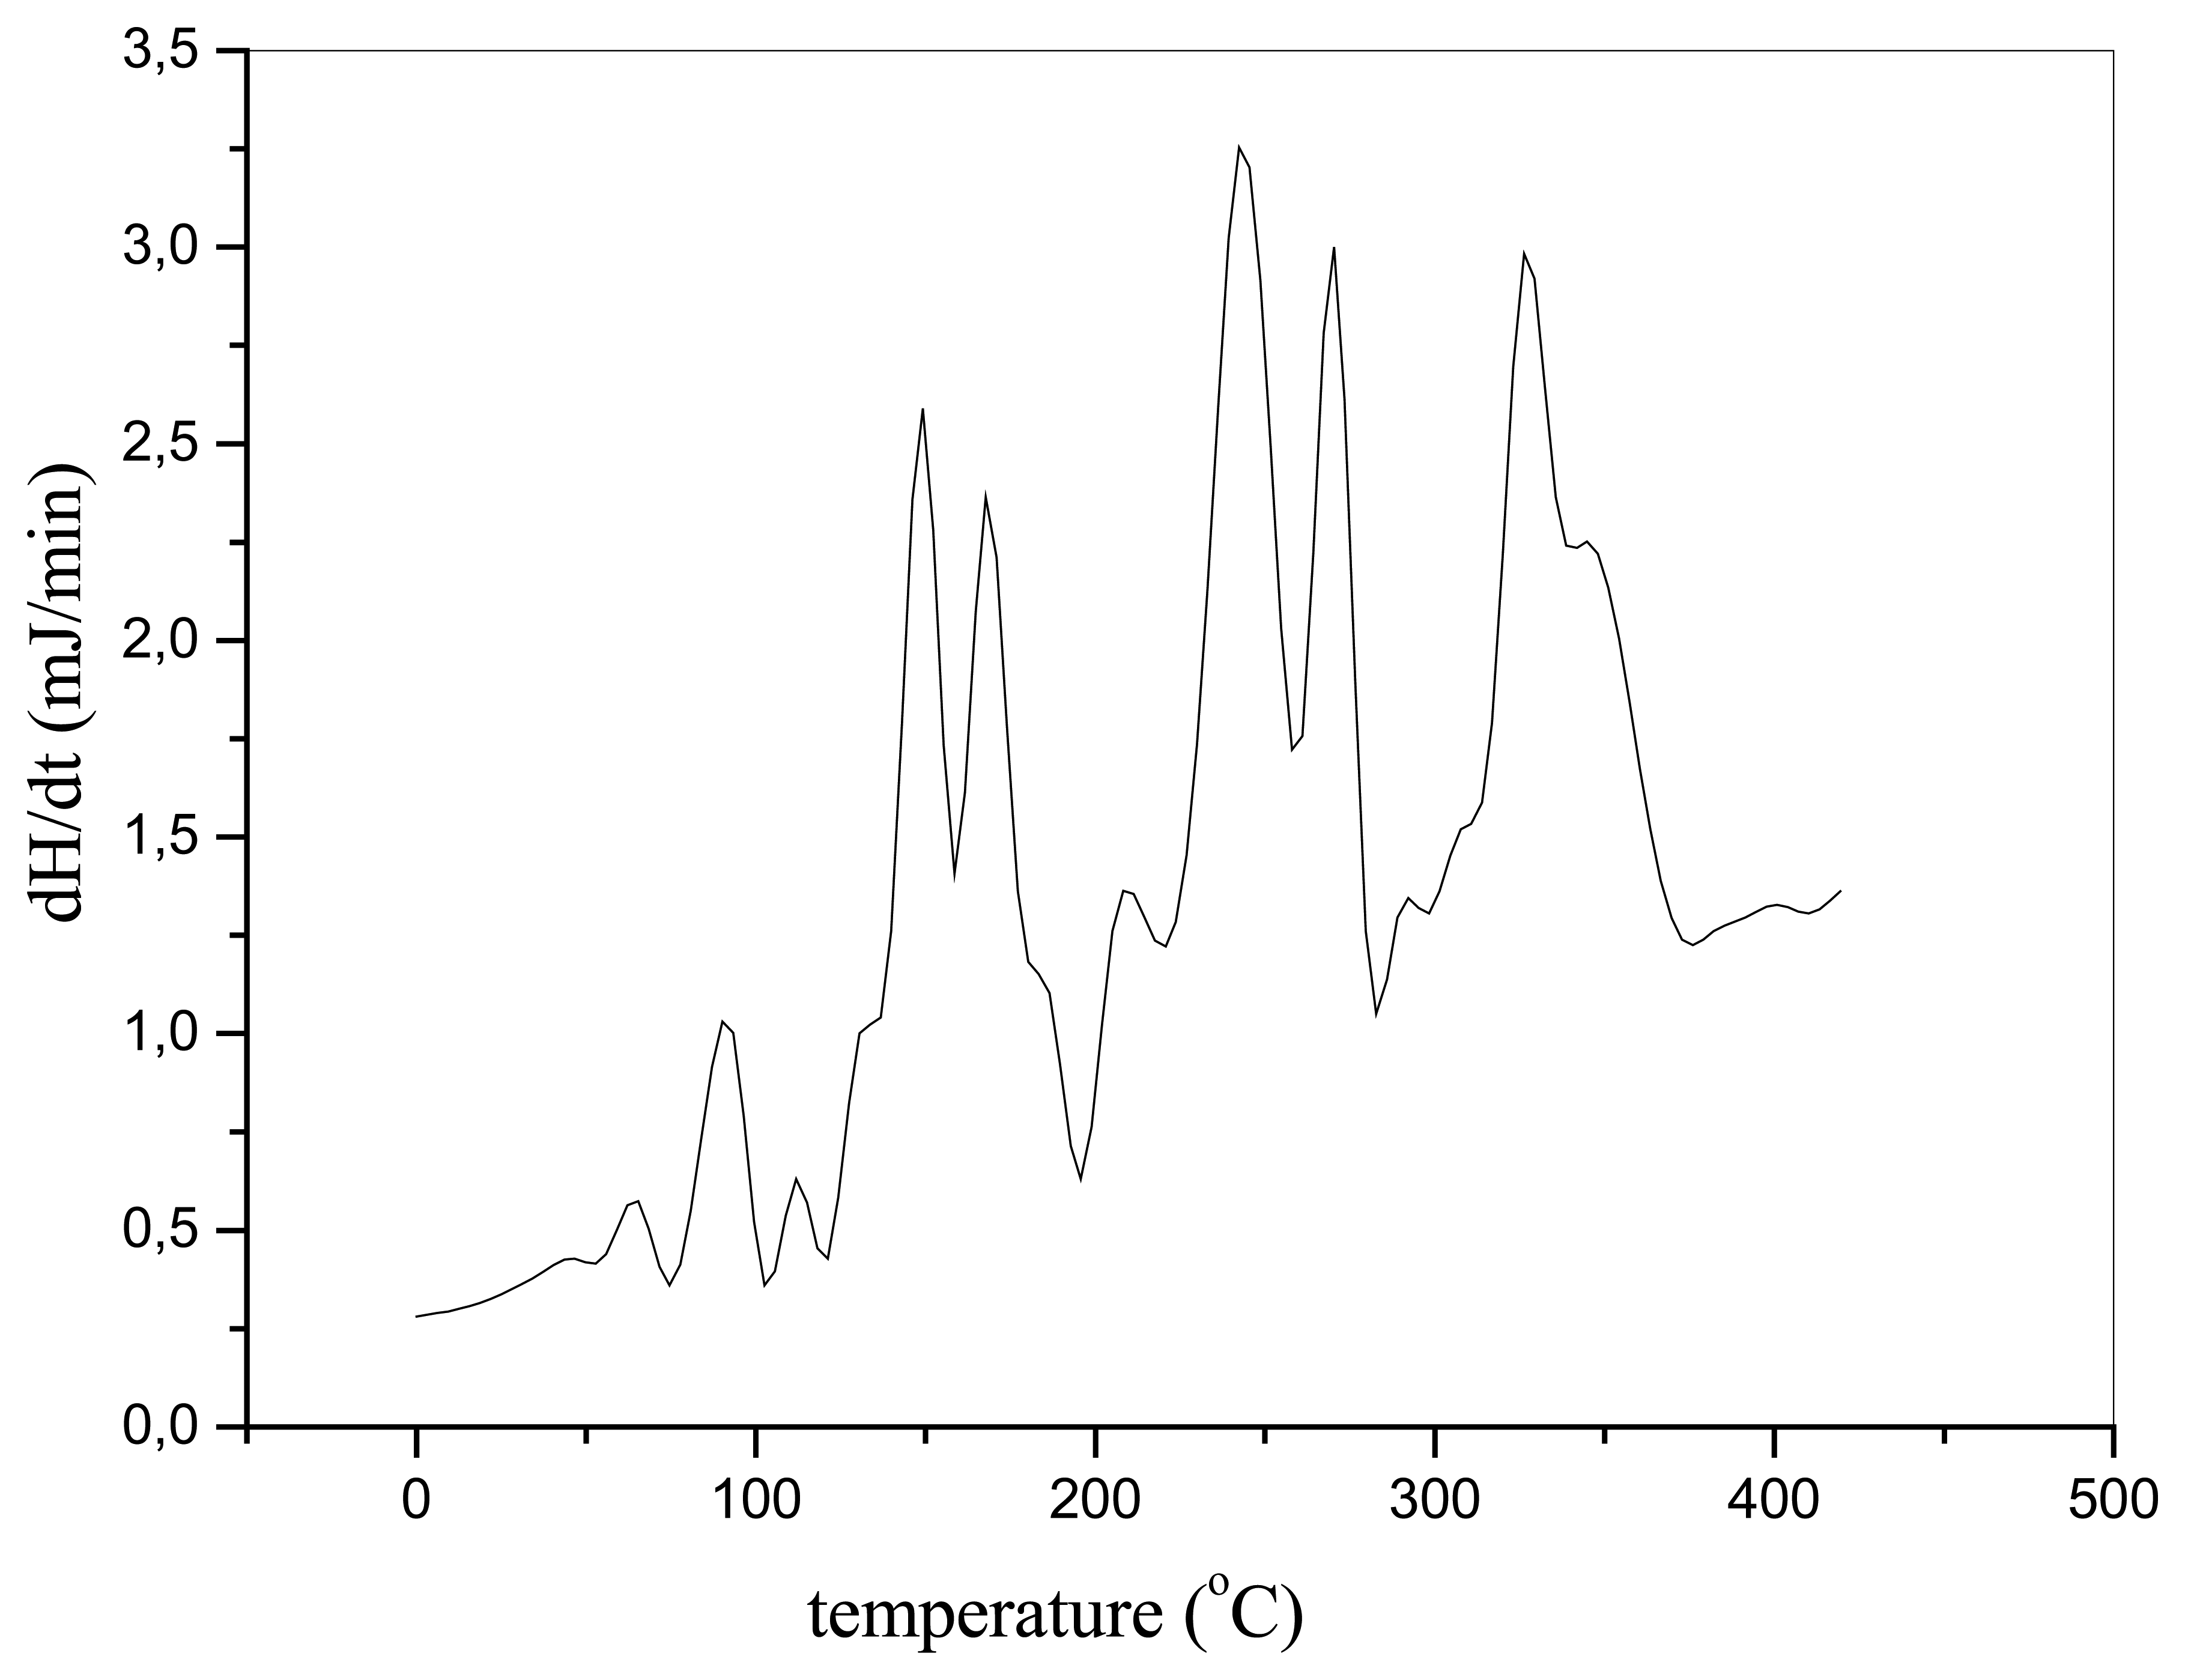
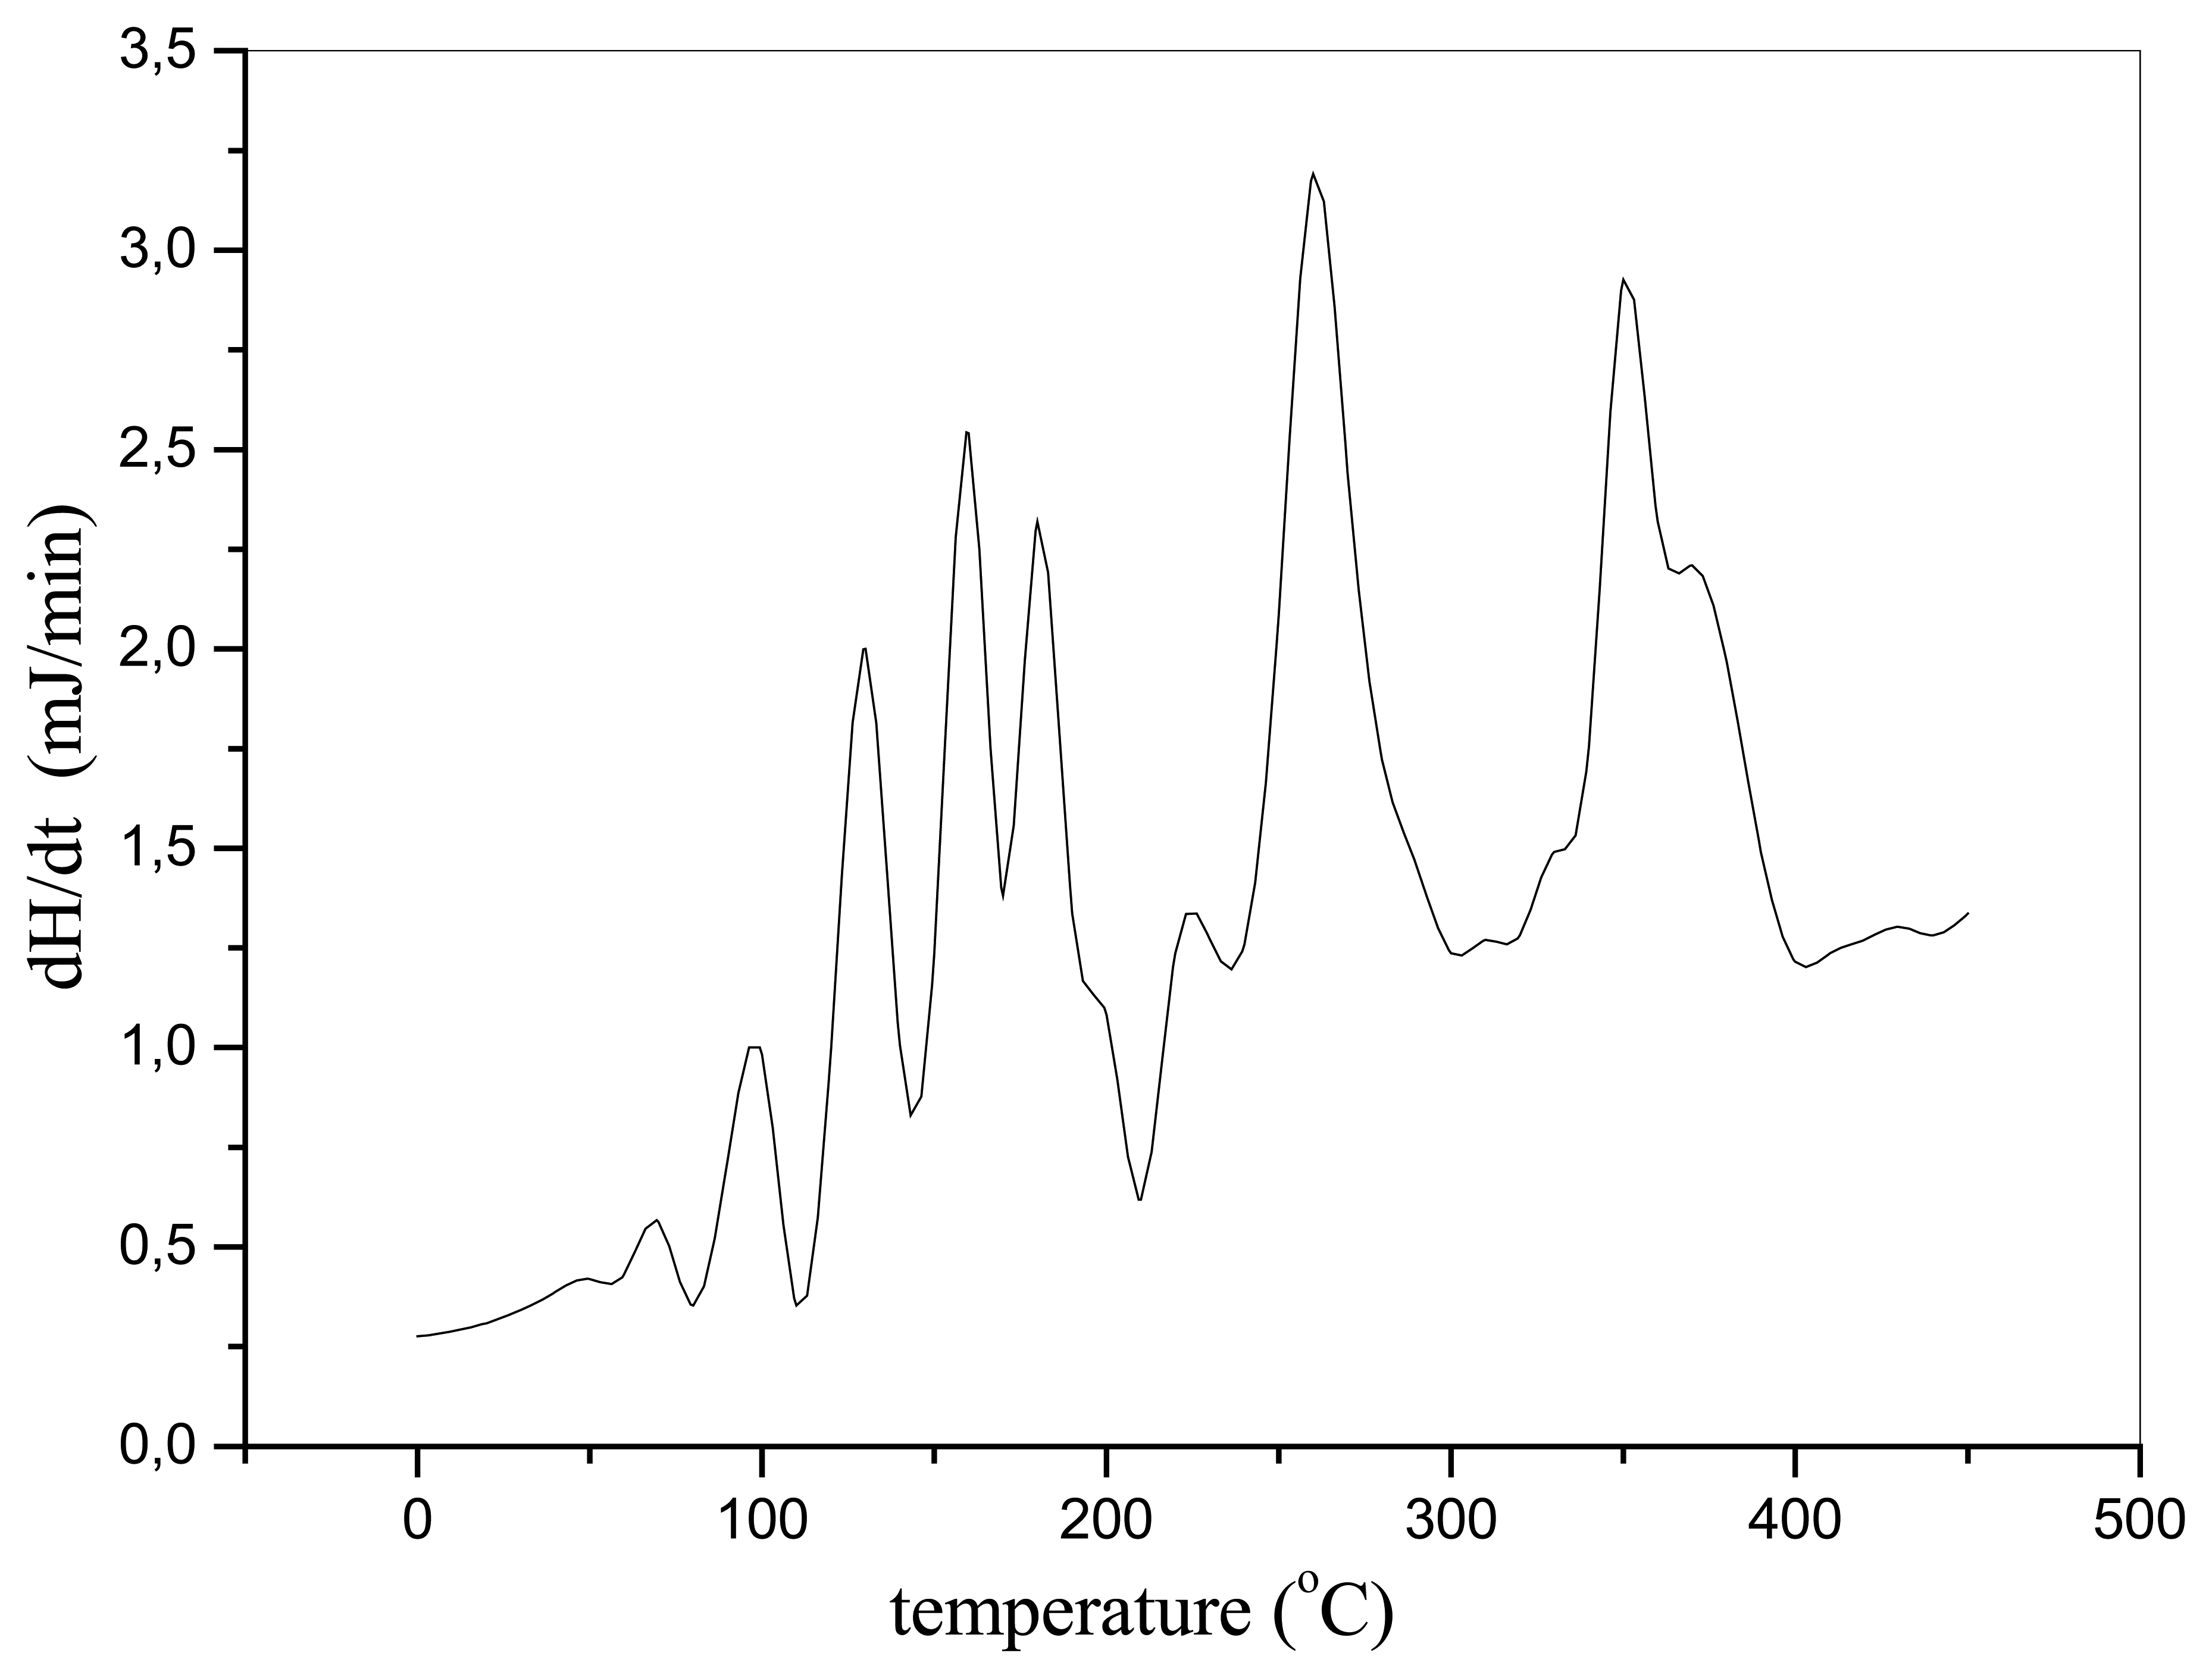
The effect of the catalyst, with the sample aqPUR1, reflects in moving the DSC peaks toward the lower temperature values (
Figure 2 and
Figure 3).
The additional peak at about 260°C points to the reaction of the catalyst with the polyol component. The catalytic action of manganese takes place in the same temperature range, and it is indicated by the same peak values with the catalyst CAT®XC-6212 and the catalyst Mn(III) – diacetylacetonemaleinate.
The union of the two peaks at about 150°C, with the manganese catalyst (
Figure 3), point to the different mechanism of the catalyst effect.
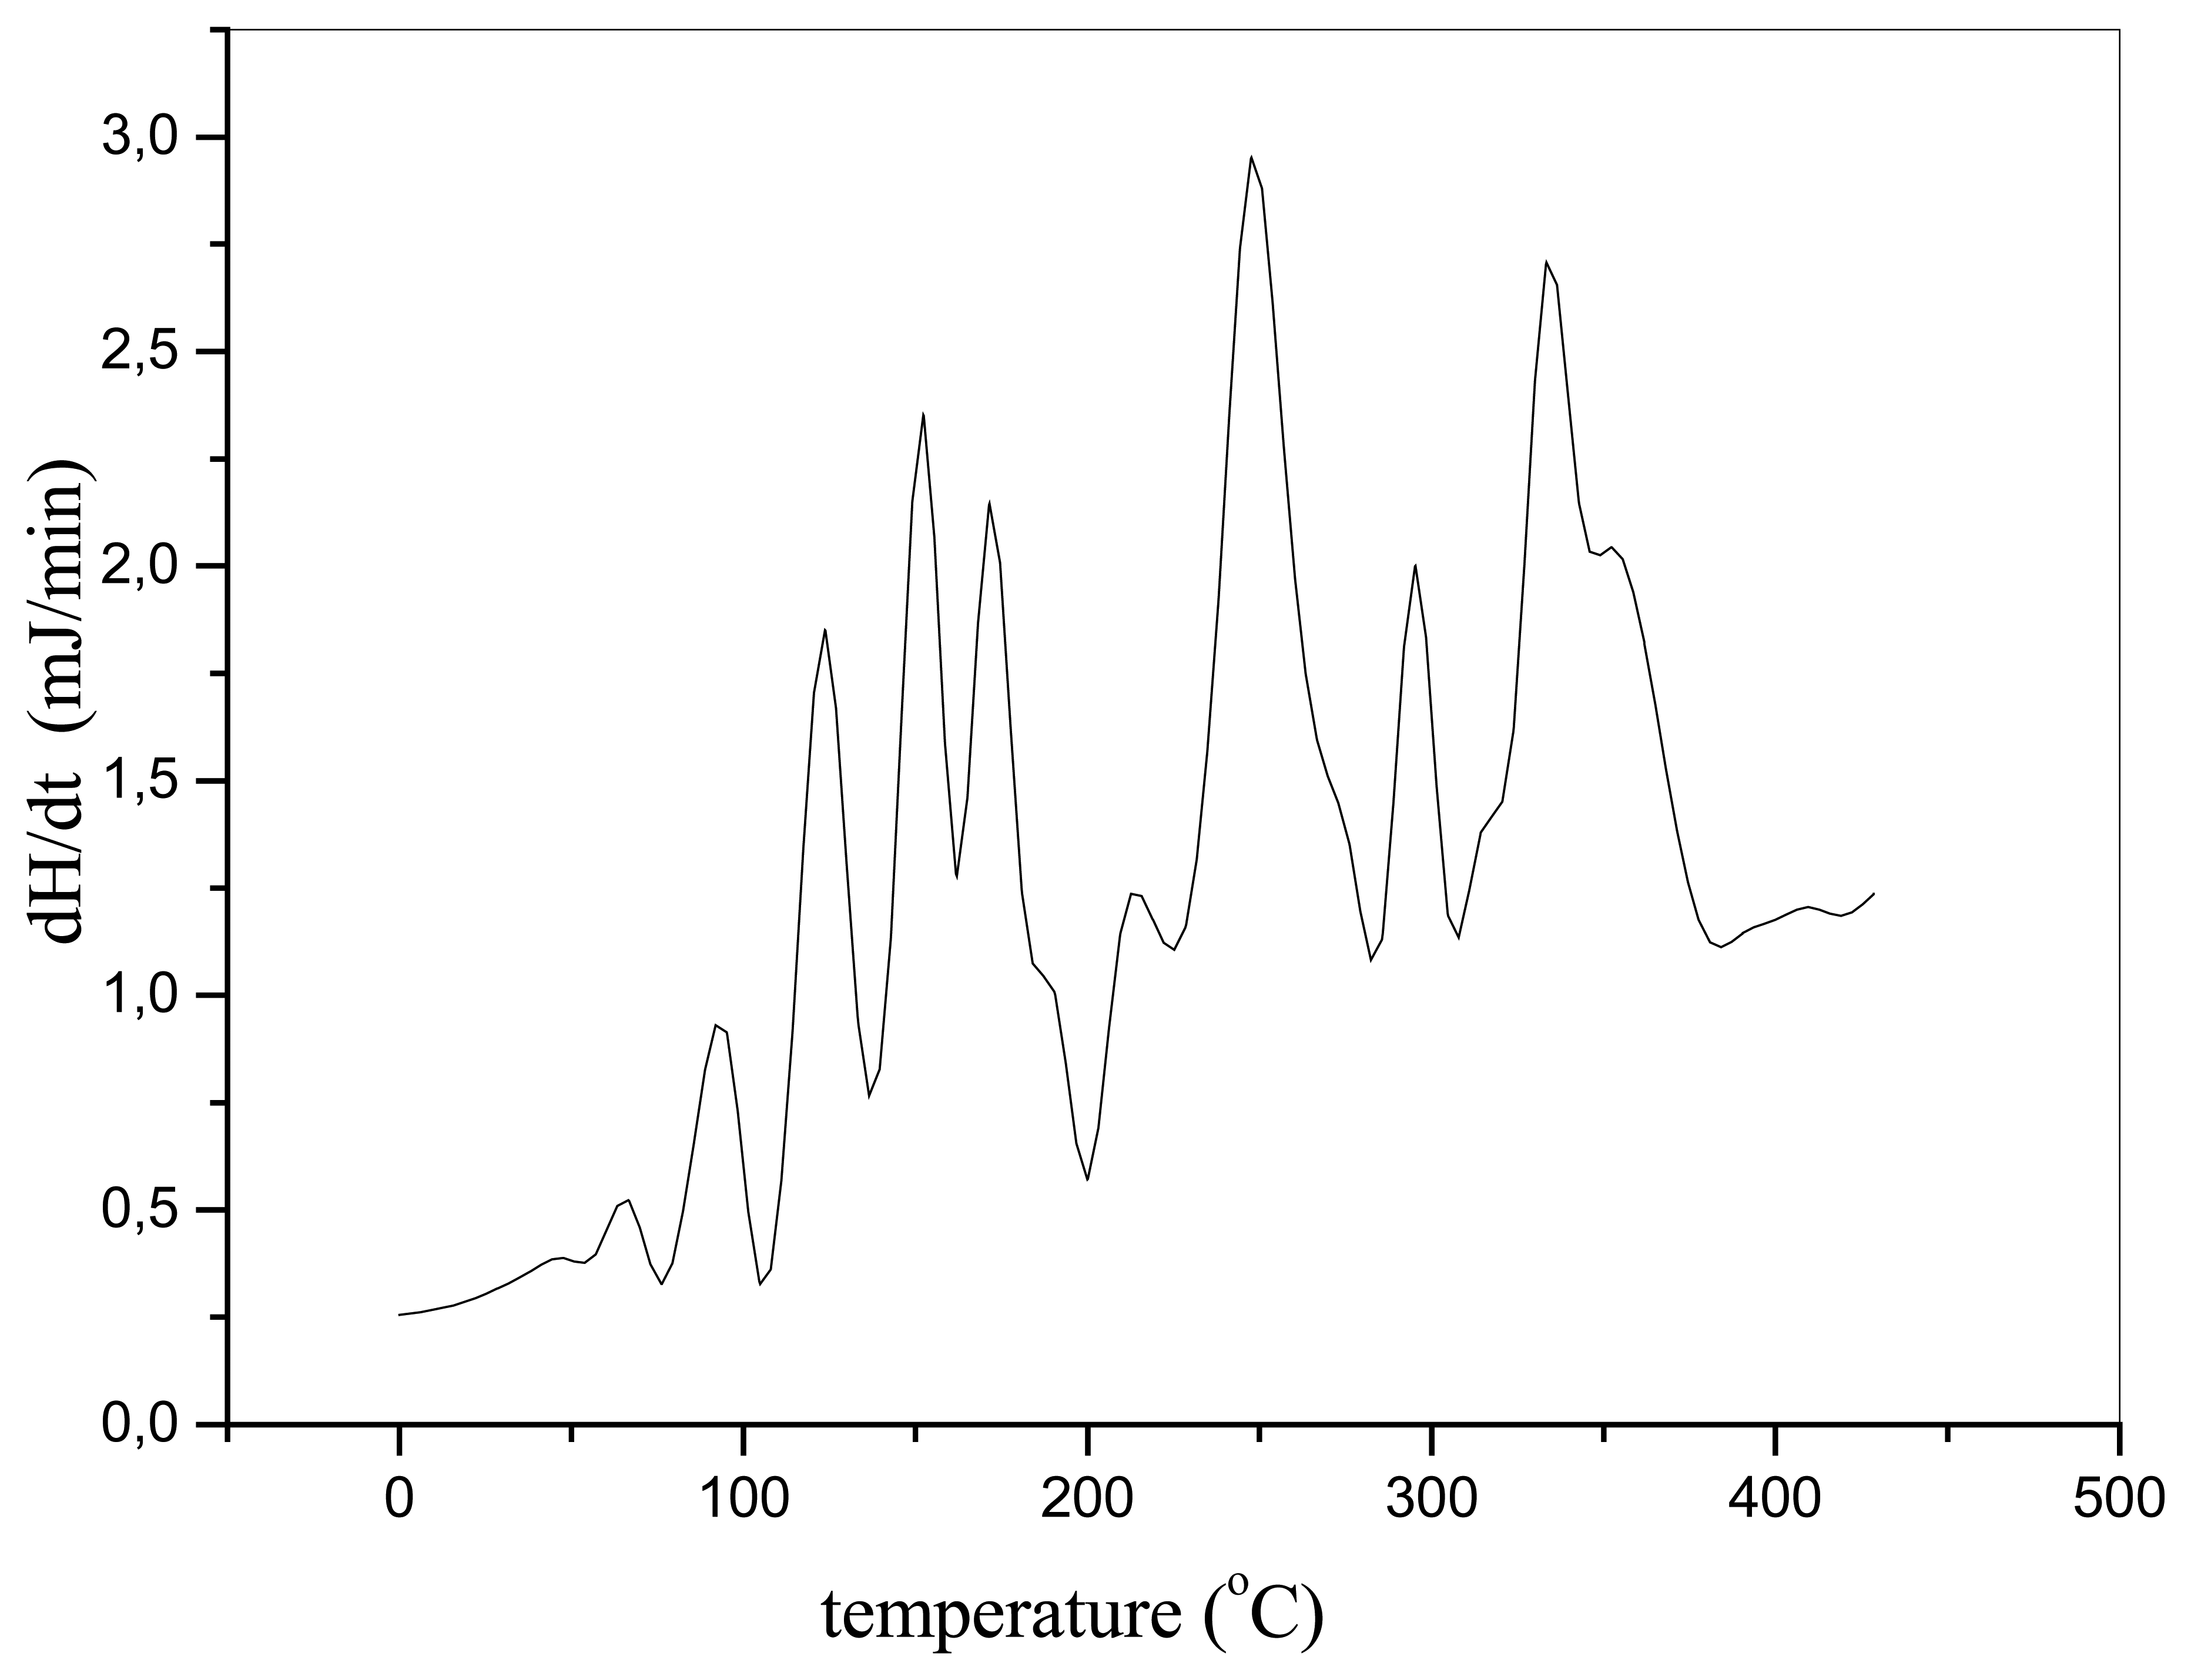
With the sample aqPUR2, the reaction of reticulation has a somewhat more pronounced maximum at 120°C that indicates a different reticulation mechanism, which is attributed to the structure of the polyol component that presents the acrylic copolymer modified by the fatty acids (
Figure 4).
The use of the catalyst with this sample, too, leads to the movement of the DSC peaks toward the lower temperatures (
Figure 5 and
Figure 6).
On the basis of the DSC measurings, and according to the models of Kissinger [
5], Freeman-Carroll [
2,
3] and Crane-Ellerstein [
4], the activation energy values of the reticulation reaction and the standard deviations of the samples aqPUR1 and aqPUR2 (
Table 3 and
Table 4) have been calculated.
The greatest reduction of the activation energy has been achieved by the use of the manganese catalyst, as it has turned out in all cases of calculation, applying different methods.
The reduction of the activation energy and the increase of the standard deviation indicate the catalytic action of zirconium and manganese. The higher values of the standard deviation in relation to the non-catalyzed system of the samples aqPUR1 and aqPUR2, using the more selective catalysts, point to the occurrence of the secondary reactions in the system and thereby, also, to the greater aberrations from the mean value of the calculated activation energy.
The action of the catalyst in the reduction of the activation energy with the sample aqPUR1 is the most intensive when the manganese catalyst is used (
Table 5),
According to all the applied methods (7%, 6.4%, 6.7%), it has been noted that the use of the zirconium catalyst leads to greater reduction only if the Crane-Ellerstein method is employed (8.5%).
The action of the catalyst in the reduction of the activation energy with the sample aqPUR2, as well, is the greatest when using the manganese catalyst (
Table 5), according to all the applied methods (8.2%, 9.8%, 5.0%). When the zirconium catalyst is used, the greatest reduction of the activation energy of the reticulation reaction, with all the three methods, does not surpass 5.4%.
Conclusions
On the basis of the DSC analysis, applying the methods of Kissinger [
5], Freeman-Carroll [
2,
3] and Crane-Ellerstein [
4], the pseudo kinetic parameters of the reticulation reaction of the analyzed aqueous two-component polyurethane systems, without the catalysts, and with the highly selective catalysts of zirconium and manganese, have been determined.
The reduction of the activation energy and the increase of the standard deviation indicate the catalytic action of the selective catalysts of zirconium and manganese.
The action of the catalyst in the reduction of the activation energy is the most intensive with the catalyst of manganese in relation to the zirconium catalyst, when all the three methods of calculating the analyzed samples are applied. The least aberrations, among the above-mentioned methods in determining the kinetic parameters, have been obtained with the manganese catalyst.


