Article

Near-Field Thermometry Sensor Based on the Thermal Resonance of a Microcantilever in Aqueous Medium

by
Seonghwan Kim
1,
Kyung Chun Kim
2 and
Kenneth David Kihm
1,*
1
Department of Mechanical, Aerospace, and Biomedical Engineering, University of Tennessee, Knoxville, Tennessee, USA 37996
2
School of Mechanical Engineering, MEMS/Nano Fabrication Center, Pusan National University, Busan 609-735, Korea
*
Author to whom correspondence should be addressed.
Sensors 2007, 7(12), 3156-3165; https://doi.org/10.3390/s7123156
Submission received: 1 November 2007 / Accepted: 4 December 2007 / Published: 6 December 2007

Abstract

:
A new concept using a near-field thermometry sensor is presented, employing a tipless microcantilever experimentally validated for an aqueous medium within approximately one cantilever width from the solid interface. By correlating the thermal Brownian vibrating motion of the microcantilever with the surrounding liquid temperature, the near-field microscale temperature distributions at the probing site are determined at separation distances of z = 5, 10, 20, and 40 μm while the microheater temperature is maintained at 50°C, 70°C, or 90°C. In addition, the near-field correction of the correlation is discussed to account for the quenched cantilever vibration frequencies, which are quenched due to the no-slip solid-wall interference. Higher thermal sensitivity and spatial resolution is expected when the vibration frequencies increase with a relatively short and thick cantilever and the dimensions of the microcantilever are reduced. Use of the microcantilever thermometry sensor can also reduce the complexity and mitigate the high cost associated with existing microfabricated thermocouples or thermoresistive sensors.

1. Introduction

Various approaches to micro- and nano-scale thermometry techniques have been tried for over a decade as researchers have attempted to explore the limits of spatial and temporal measurement resolution. Among them, scanning thermal microscopy (SThM) using a microfabricated thermocouple probe tip seems to be the best for achieving submicron spatial measurement resolutions for the case of solid surfaces exposed in ambient air environments [1-5]. In the case of aqueous media, however, the SThM probe has not been reported to be successful to date. Only recently, one research group demonstrated the potential of SThM as a thermometry tool in an aqueous medium but was not able to show any real temperature measurement data, which would be necessary to validate the probe's accuracy and resolutions capability [6]. Another group tried to measure cellular thermal responses in a culture medium with micro-thermocouple probe built on a glass micropipette, but no meaningful temperature signal was obtained [7].
On the other hand, several nonintrusive optical techniques have been developed to measure microscale temperature distribution in aqueous medium. The ratiometric laser-induced fluorescence (LIF) technique using fluorescent dye molecules achieved microscale spatial measurement resolution, but the measurement uncertainties were excessive particularly in the near-wall or near-meniscus region because of the interfacial interference of the fluorescent emission light [8]. Similarly, the optical serial sectioning microscopy (OSSM) technique showed good potential as a microscale thermometry system for nanoparticle suspension fluids, but suffered from large measurement uncertainty [9]. In addition to the excessive measurement uncertainties of these optical thermometry techniques, the presence of dye molecules or dye-coated nanospheres may alter the thermal characteristics of an aqueous medium. To lessen these shortcomings that are associated with the foreign trace particles, a label-free, real-time, full-field surface plasmon resonance (SPR) reflectance sensing technique has been exploited to map microscale temperature distribution in the aqueous medium [10]. However, the detection range of this technique is confined in the near-wall region to less than 1-μm from the solid surface, thus it is hard to extend the measurement field out of the near-wall region.
Here we describe a near-field microscale thermometry sensor in an aqueous medium using a tipless microcantilever. The peak resonance response frequency and the quality factor of a microcantilever are two important dynamic characteristics that are extremely sensitive to the density and viscosity of the surrounding fluid and to the proximity of the cantilever to the solid surface [11]. Thus, these dynamic characteristics of microcantilever vibration can be calibrated to yield quantitative measurements for the fluid properties at a certain separation distance between a solid surface and a microcantilever [12]. We have verified that the dissipative effect due to liquid viscosity is the dominating factor for the resonance frequency shifts of a microcantilever. In our previous publication, we successfully correlated temperature effects on liquid properties with the thermal resonance of a microcantilever in aqueous medium in the region away from a solid surface where the no-slip wall effect is negligible [13]. Then we investigated the temperature dependence of the near-wall vibration of microcantilevers that suffer interference from the presence of the nearby solid wall. We successfully demonstrated the concept of near-wall corrected scanning thermal microscopy working in aqueous medium [14]. However, for the concept to be more valuable as a working thermometry sensor, it will be necessary to validate the concept by experimental measurements of specified temperature fields and comparison of the data with known predictions.
This paper presents well-controlled thermal experiments that validate the concept of scanning thermal microscopy working as a near-field microscale thermometry sensor in an aqueous medium by measuring microscale temperature distributions.

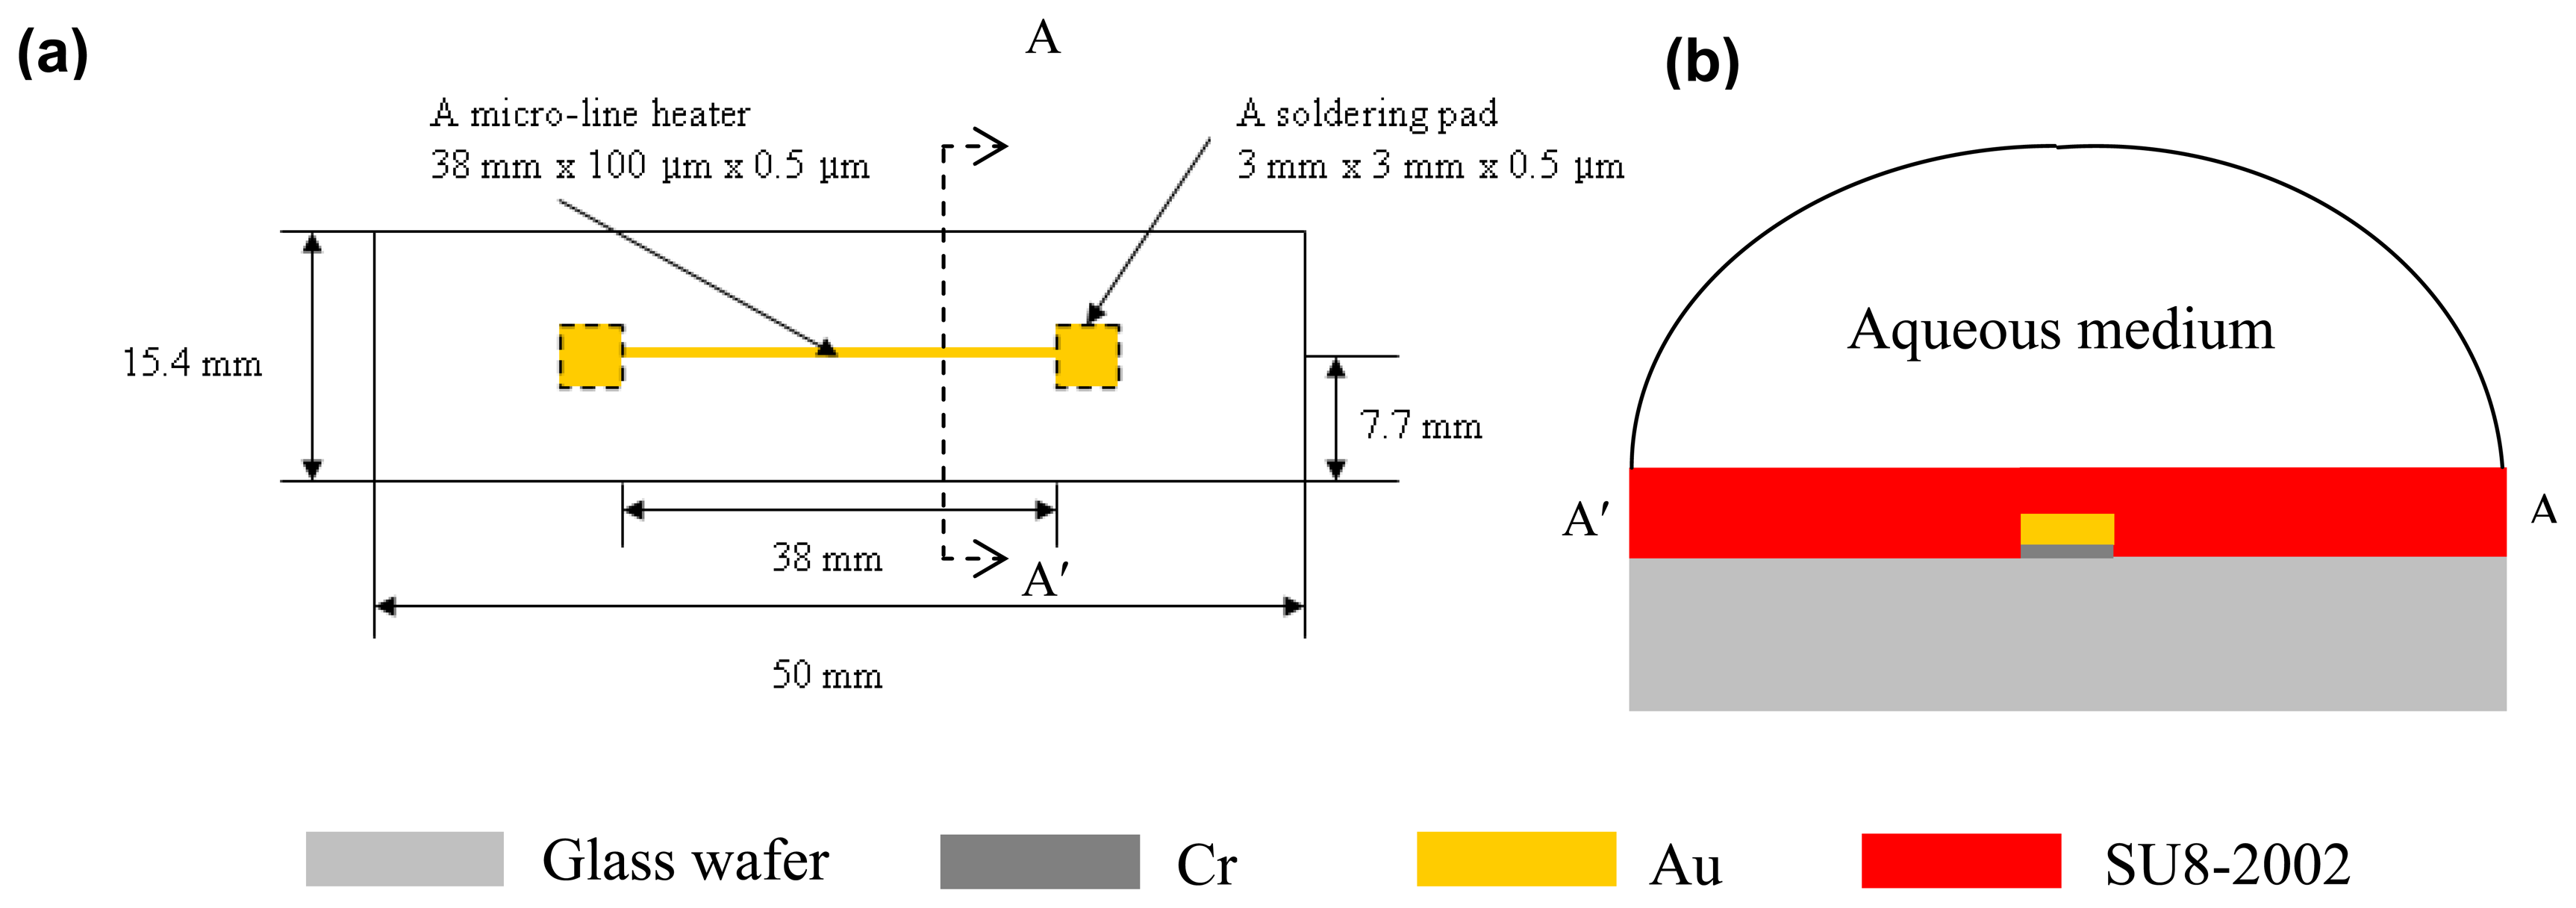
2. Materials and Methods

In our previous study [14], we tested the near-wall thermal sensitivities of various cantilever geometries and found that the TL-NCH cantilever (length L = 135 μm, width b = 39 μm, and thickness h = 4.5 μm, Nanosensors Inc.) showed the highest near-wall thermal sensitivities among those tested. The selected microcantilever is mounted on a solution-compatible cantilever holder attached to the head unit of the MFP-3D-BIO AFM (Asylum Research Inc.) and calibrated at four specified separation distances z = 5, 10, 20, and 40 μm, which are measured between the lower end of the cantilever and the glass substrate surface. The experiments were carried out with the BioHeater™ system (Asylum Research Inc.) providing a uniform fluid temperature environment within ±0.1 °C in a steady state. Figure 1 shows the first peak resonance response frequencies of the TL-NCH cantilever immersed in deionized water as functions of specified temperatures at different separation distances. The inset schematic illustrates the experiment setup using the BioHeater™ system. Each symbol represents the averaged resonance frequencies from ten measurements with the error bar of a 95% confidence interval. The cantilever vibration frequencies, quenched due to the nearby no-slip solid wall interference, should be taken into consideration in order to correlate the measured resonance frequency to the aqueous medium temperature. The corresponding power-fitting curves fairly well correlate with the measured data.
To validate the accuracy of the thermometry, a carefully designed experiment was performed to measure steady-state temperature fields in a controlled microscale thermal environment. Figure 2 shows the schematic of a microscale line heater working also as a temperature sensor based on the resistance-temperature relation of a thin gold film [15]. The micro-line heater consists of a vapor-deposited gold line which is 38 mm long, 100 μm wide, and 0.5 μm thick and two 3-mm-square and 0.5 μm-thick soldering pads (Fig. 2-a). A 500-nm-thick gold layer is deposited with a 10-nm-thick chromium adhesion layer by e-beam evaporation on the Borofloat glass substrate. The microheater patterns are deposited on the glass substrate by a lift-off technique. To physically protect and electrically insulate the micro-line heater, the top layer is coated with SU8-2002 (MicroChem Inc.) except for the soldering pads. The coating thickness is uniform at 2 μm; a 1.5 μm coating on top of the 0.5 μm heater line (Fig. 2-b). A feedback circuit based on the constant-temperature hot wire anemometer [16-18] is connected to provide a control for the microheater power for a constant temperature environment.
Figure 3 illustrates the near-field micro-thermometry sensor working for both the near-field and far-field regions in the aqueous medium. The near–field corresponds to the region that is one cantilever width from the solid interface, where the no-slip hydrodynamic boundary conditions effectively quench the thermal vibration frequencies of the microcantilever. Far-field thermometry has been extensively examined by means of the experimental validation in our previous publication [13], and thus the present study focuses only on the near-field thermometry. The inset photograph shows the TL-NCH cantilever aligned parallel to the 100-μm wide gold line heater shown as a thick horizontal white line. The separation distance z is controlled with 100-nm resolution by the piezoelectric actuator attached to the AFM head. The peak resonance response frequencies are measured and the data are reduced by the use of a thermal frequency fitting function, available from the MFP-3D-BIO AFM data acquisition software.
It is essential that a microcantilever of AFM be aligned at a small angle of inclination to the horizon for efficient and effective surface imaging and detection purposes. The present cantilever has an inclination angle θ of 11° and the probing site is widened to Lsinθ. Assuming a linear temperature variation along the probing site, the modified separation distance z′ = z + 0.5Lsinθ is taken to the midpoint of the cantilever. Note that the modified distance z′ is used to calculate the temperature distributions while the nominal separation distance z is measured from the lower end of the cantilever.
Figure 4 presents a calculated temperature field for the two-dimensional computational domain that is consistent with the cross-section of the test medium. A room temperature (20°C) is imposed for all outer boundary conditions, and a constant temperature condition (50°C) is specified for the gold heater surface. The computational domain to solve for the heat conduction equation consists of the microcantilever holder (k = 1.38 W/m-K), the silicon cantilever chip (k = 124 W/m-K), the aqueous medium (k = 0.613 W/m-K), SU8-2002 (k = 0.17 W/m-K), and the glass substrate (k = 1.2 W/m-K). All other thermophysical properties are assumed constant at 27°C whereas the thermophysical properties (viscosity, density, thermal conductivity, and specific heat) of water are formulated using polynomial functions of the temperature.
The temperature field shown in false color in Figure 4 represents the steady thermal field established in the aqueous medium over the micro-line heater when the microcantilever is separated by 40 μm from the glass substrate. The presence of the silicon microcantilever chip acts as a nontrivial heat sink because of the high thermal conductivity of silicon. Therefore, the medium temperature decreases rapidly with increasing z from the heater surface to the chip surface.

3. Results and Discussion

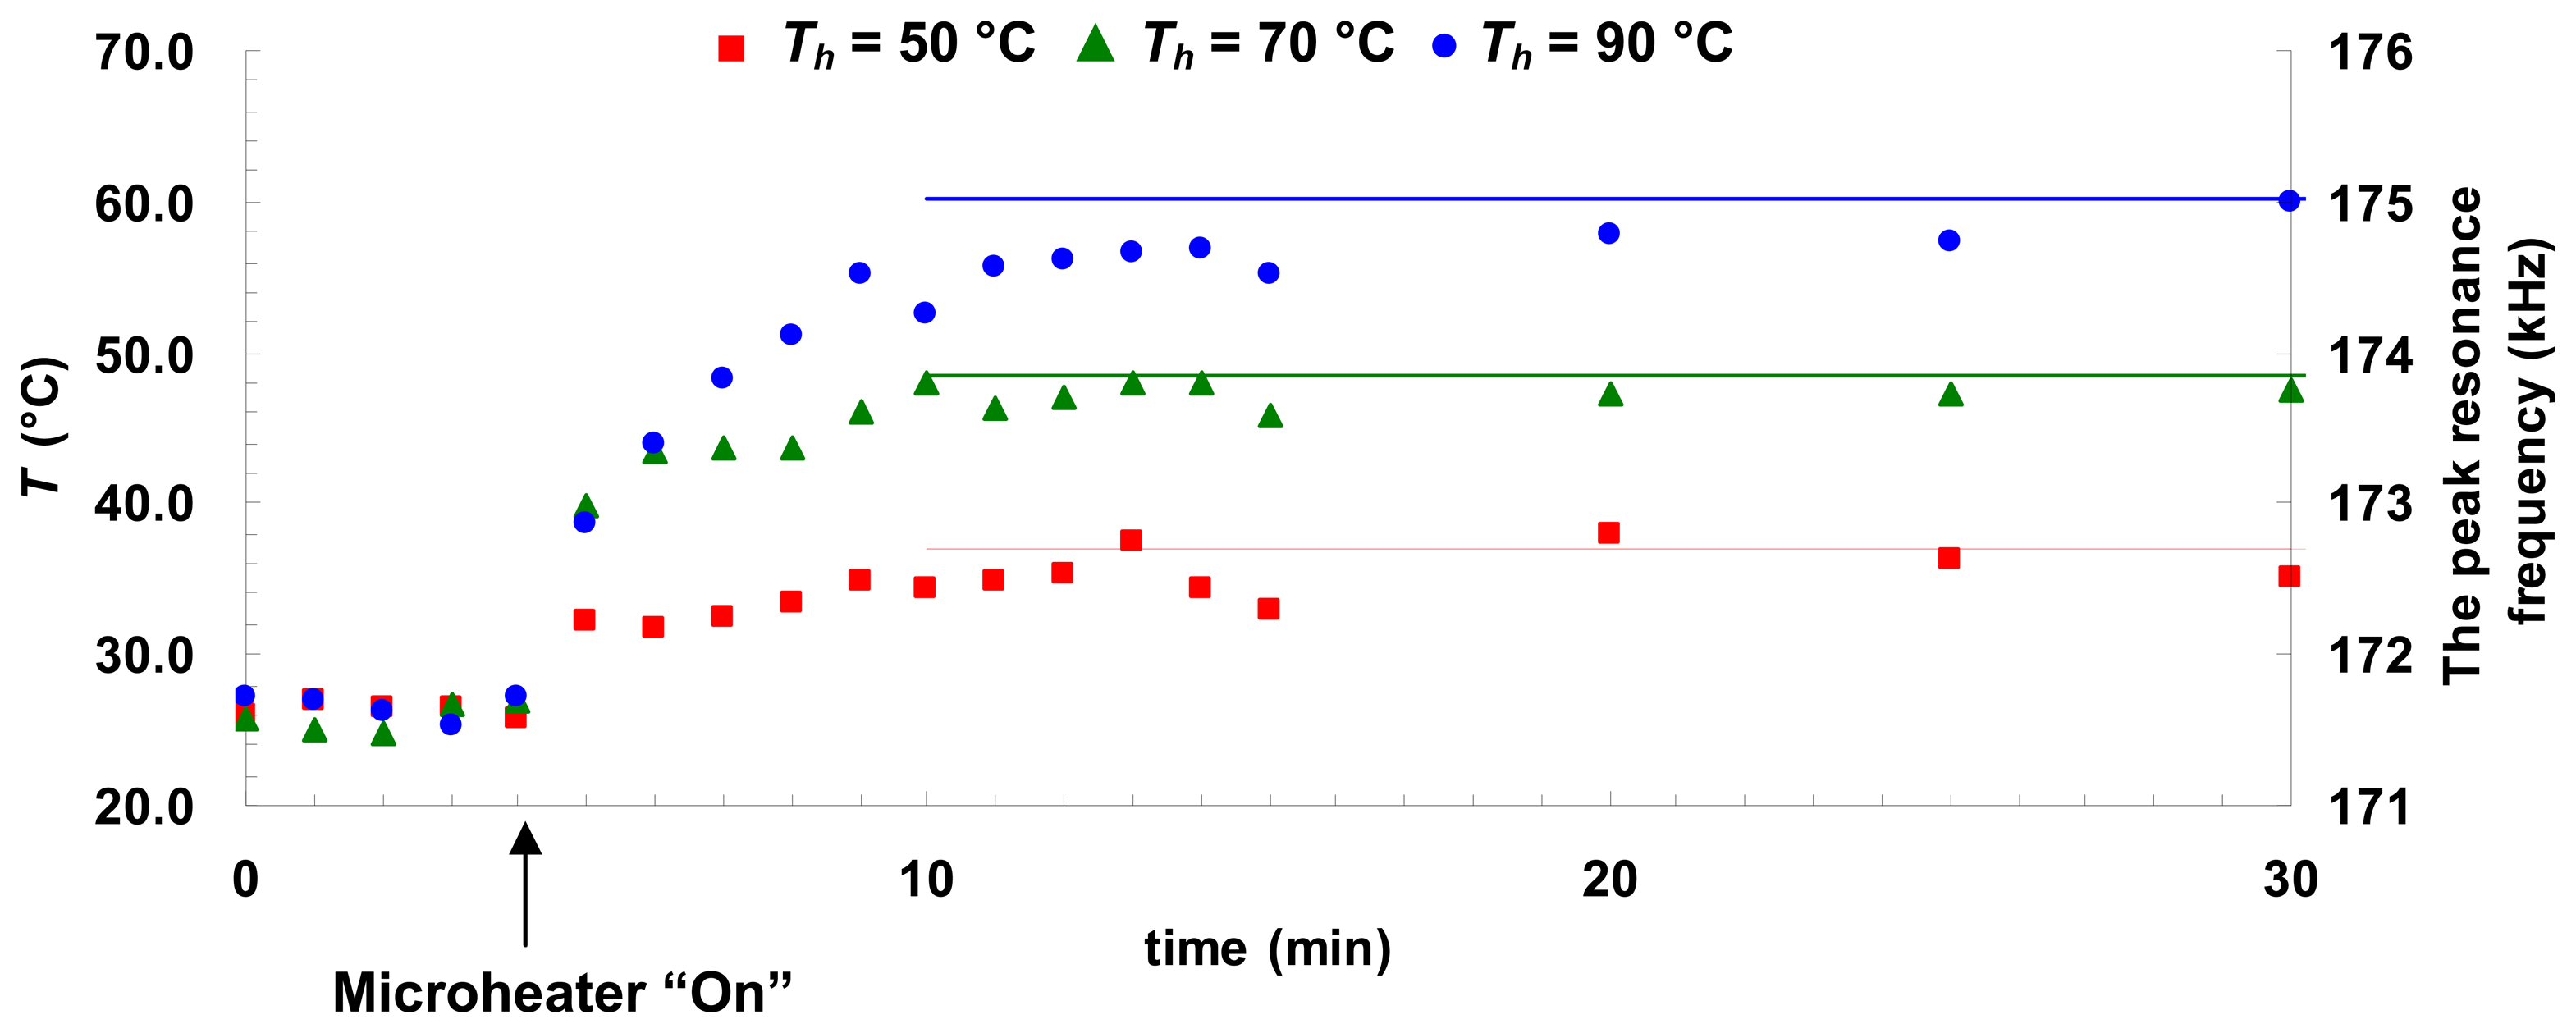
3.1. Transient temperature measurements

Figure 5 shows transient temperature measurements at z = 40 μm when the microheater temperature Th is maintained at 50 °C, 70 °C, or 90 °C, respectively. In approximately 10 minutes after the heater is turned on, the test field temperature reaches the steady state for each of the three cases and agrees well with the corresponding calculated steady-state temperature shown by the three horizontal lines. The measured steady-state temperature remains constant for a sufficiently long period under the feedback circuit control to ensure steady thermal conditions.

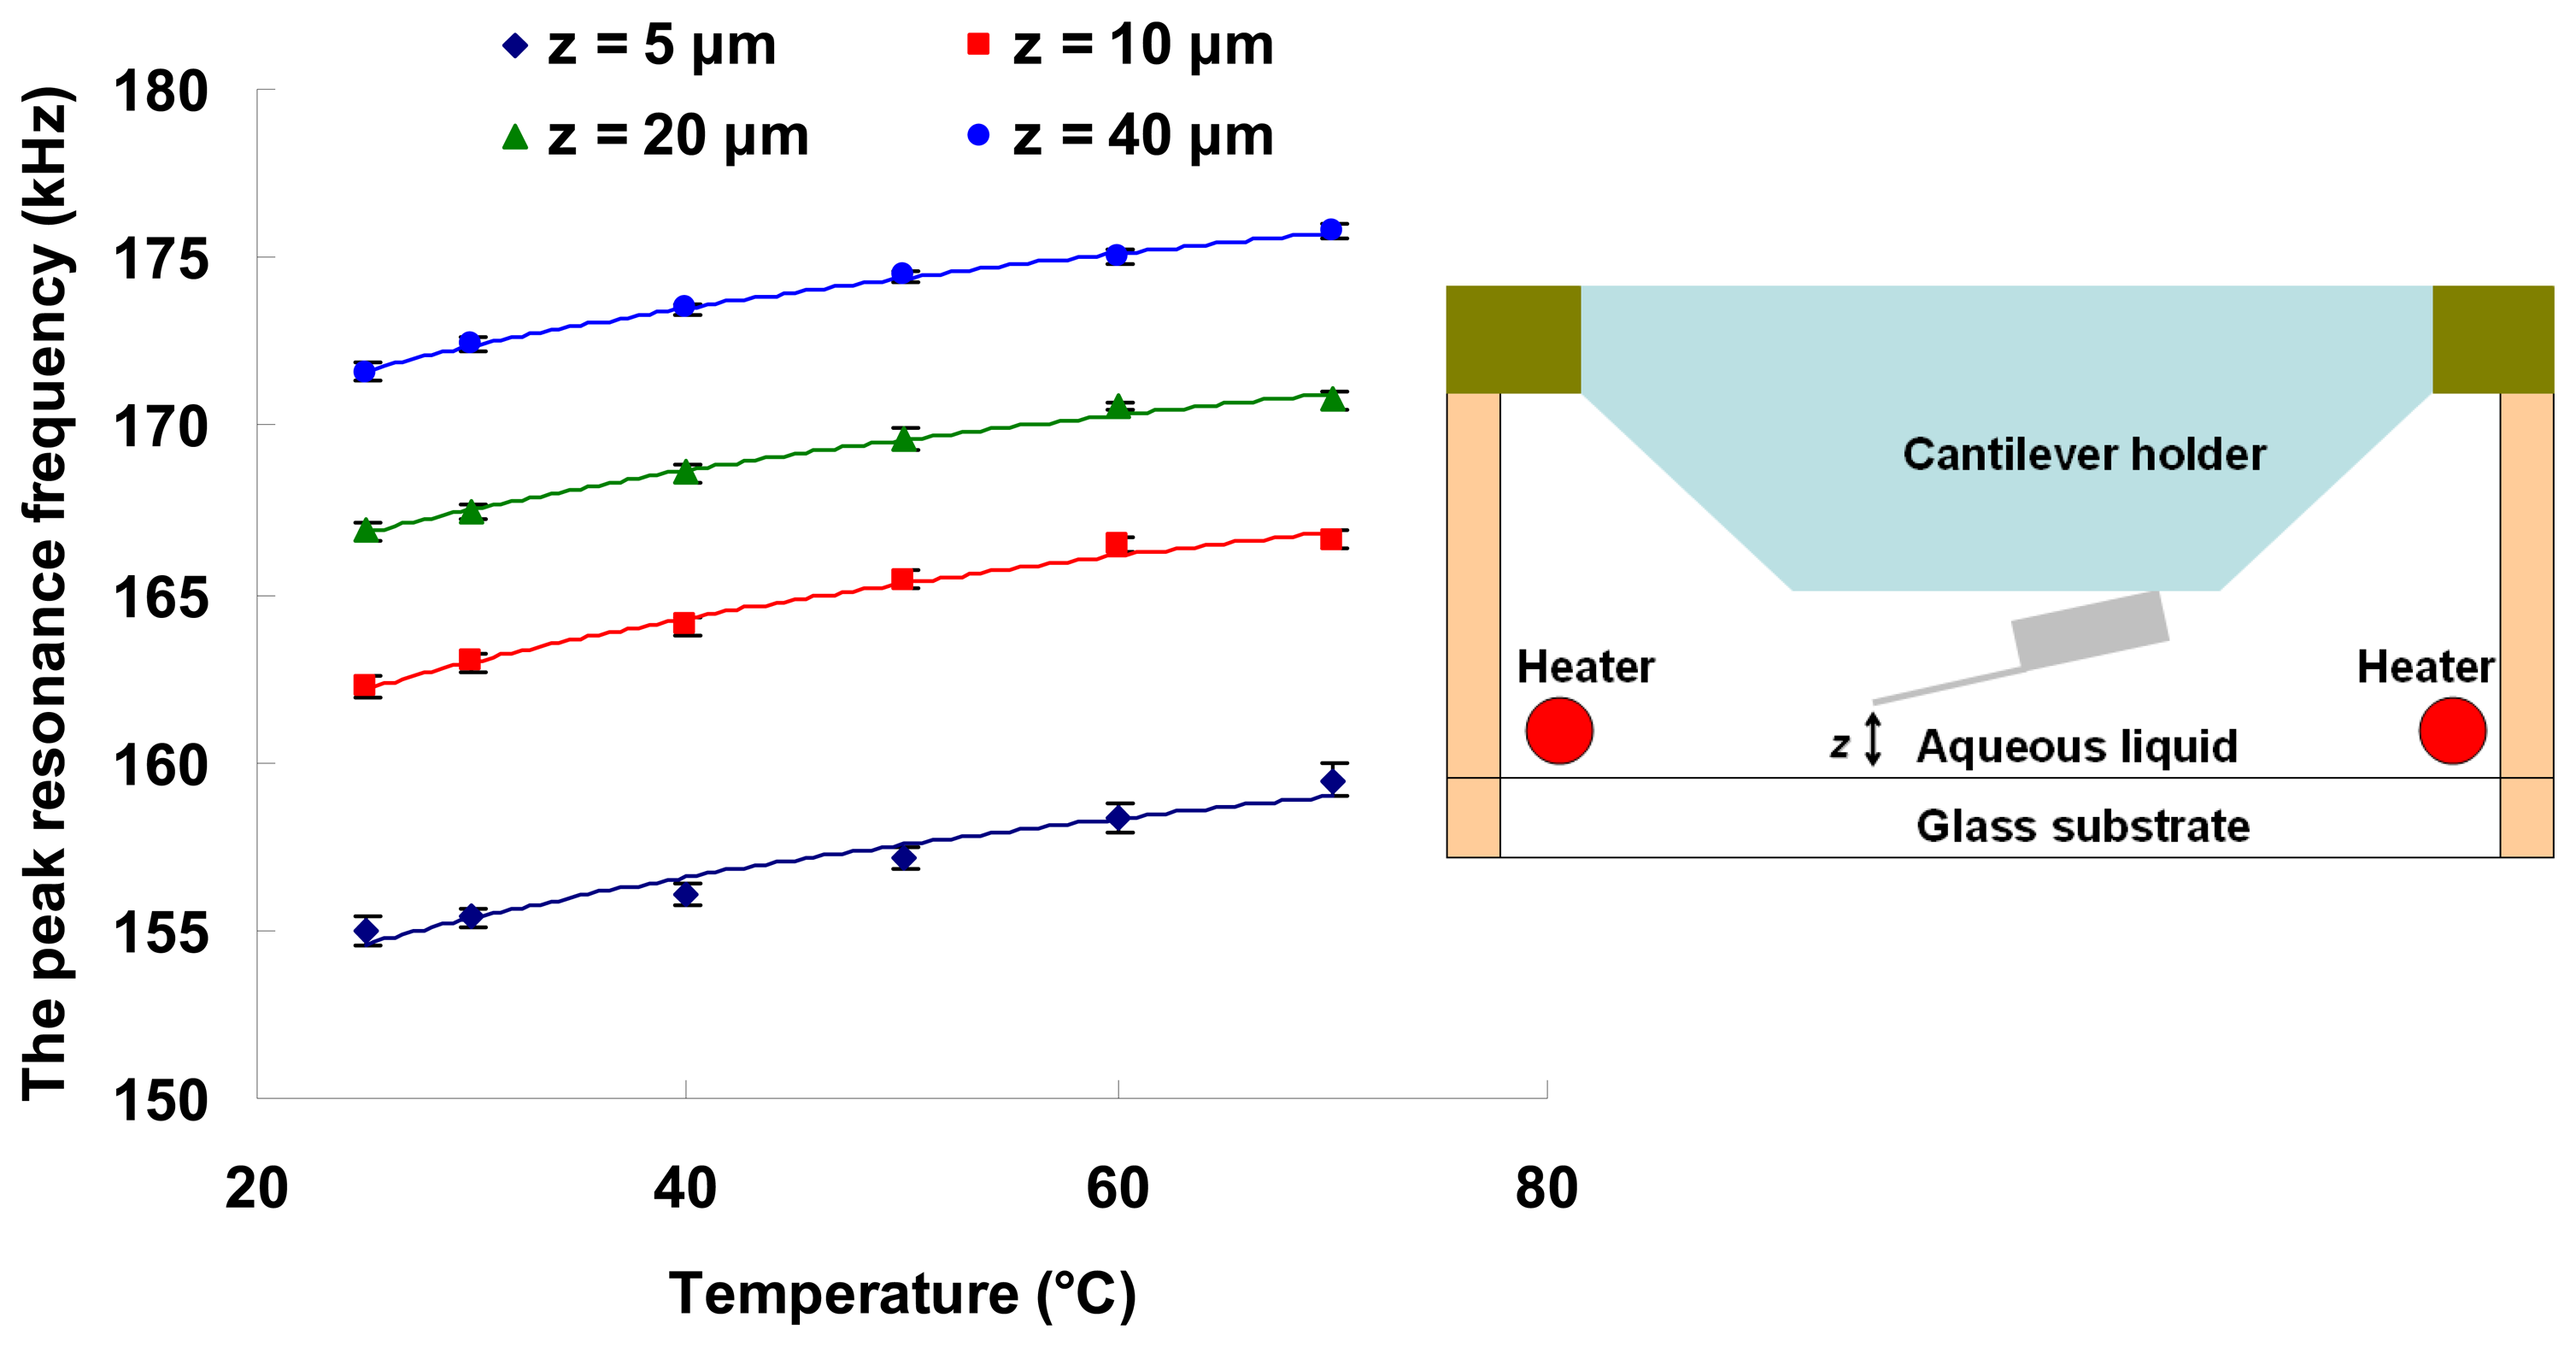
3.2. Steady-state temperature measurements

Figure 6 shows the measured and predicted temperature profiles in the vicinity of the microheater surface at four different z-locations (5, 10, 20, and 40 μm) for each of three different heater temperatures (50, 70, or 90°C). Each symbol represents the average of ten data realization measurements, and the three curves show the calculated temperature profiles based on the two-dimensional calculations, accounting for the modified separation distance (z′). The measurements correlate well with the predictions, implying that the modification of the separation distance is acceptable for the cantilever midpoint.
The spatial resolution of the sensor depends on the dimensions and the inclination angle of the microcantilever. By sufficiently reducing the dimensions and the inclination angle, we expect to enhance the spatial resolution by up to one or two orders of magnitude. The measurement uncertainties can be dramatically reduced by employing the so-called quality factor enhancement scheme [19]. In addition, our theoretical predictions, based on an extended Sader's model [13, 14], suggest higher thermal sensitivity when the cantilever material has a positive thermal dependence of Young's modulus dE/dT and its dimensions are reduced. Both silicon and silicon nitride have a negative thermal dependence of Young's modulus in our temperature range, however, silicon dioxide has a positive thermal dependence of Young's modulus. Figure 7 shows calculated near-field thermal sensitivity Δf/ΔT for the case of silicon cantilevers as functions of h/L2 for three different widths of 20, 30, and 40 μm [14]. The temperature differential is set to 40°C and the normalized cantilever separation distance H (z/b) is set to 0.5. The thermal sensitivity increases with increasing h/L2, which is consistent with the finding that the fundamental resonance frequency increases with h/L2. Furthermore, once h/L2 is fixed, the sensitivity increases with a narrower cantilever (smaller b) with a lower spring constant k, which is more susceptible to the thermal property changes of the surrounding liquid. Therefore, from the theoretical point of view, the cantilever's thermal sensitivity, in its role as a near-field thermometry sensor, increases with increasing thickness, decreasing length, and decreasing width when the cantilever material is specified.

Conclusions

A new concept of a near-field thermometry sensor using a tipless microcantilever in aqueous medium is experimentally validated by conducting careful thermal field measurements. The experimental calibration, accounting for the near-wall hydrodynamic interference effect, is utilized to correlate the resonance frequency of a microcantilever with the aqueous medium's temperature. The microscale temperature measurements using this sensor agree well with the calculated predictions. To improve spatial resolution and thermal sensitivity of this sensor, use of a shorter, thicker, and narrower microcantilever is recommended based on our theoretical predictions. The microcantilever sensor can also lessen the complexity and mitigate the high cost associated with existing microfabricated thermocouples or thermoresistive sensors. It is noted that this microcantilever sensor requires relatively slow temporal resolution of an order of one second to determine the resonance frequency of a microcantilever with thermal frequency scanning, averaging, and fitting. It is expected that successful implementation of self-excitation detection schemes to provide quasi-real time and highly accurate detection of the microcantilever resonance frequency will be essential to further develop microcantilever thermometry for real-time response to highly transient thermal fields.

Acknowledgments

This work was partly supported by the U.S. Department of Energy, Office of Basic Energy Science under Contract No. DE-FG02-05ER46182 and partly by the Research Initiation Grant No. E01137-0020 from the University of Tennessee (SK & KDK), and partly supported by Korean Science and Engineering Foundation Grant R01-2006-000-10742-0 (KCK).

References and Notes

  1. Shi, L.; Majumdar, A. Recent developments in micro and nanoscale thermometry. Microscale Thermophys. Eng. 2001, 5, 251–265. [Google Scholar]
  2. Cahill, D. G.; Goodson, K.; Majumdar, A. Thermometry and thermal transport in micro/nanoscale solid-state devices and structures. J. Heat Transfer 2002, 124, 223–241. [Google Scholar]
  3. Shi, L.; Majumdar, A. Thermal transport mechanisms at nanoscale point contacts. J. Heat Transfer 2002, 124, 329–337. [Google Scholar]
  4. Roh, H. H.; Lee, J. S.; Kim, D. L.; Park, J.; Kim, K.; Kwon, O.; Park, S. H.; Choi, Y. K.; Majumdar, A. Novel nanoscale thermal property imaging technique: the 2ω method. I. principle and the 2ω signal measurement. J. Vac. Sci. Technol. B. 2006, 24, 2398–2404. [Google Scholar]
  5. Roh, H. H.; Lee, J. S.; Kim, D. L.; Park, J.; Kim, K.; Kwon, O.; Park, S. H.; Choi, Y. K.; Majumdar, A. Novel nanoscale thermal property imaging technique: the 2ω method. II. demonstration and comparison. J. Vac. Sci. Technol. B. 2006, 24, 2405–2411. [Google Scholar]
  6. Li, M. H.; Gianchandani, Y. B. Applications of a low contact force polyimide shank bolometer probe for chemical and biological diagnostics. Sens. Actuators A-Phys. 2003, 104, 236–245. [Google Scholar]
  7. Watanabe, M. S.; Kakuta, N.; Mabuchi, K.; Yamada, Y. Micro-thermocouple probe for measurement of cellular thermal responses, Proc. 27th Ann. Conf. 2005 IEEE EMB. 2005; pp. 4858–4861.
  8. Kim, H. J.; Kihm, K. D.; Allen, J. S. Examination of ratiometric laser induced fluorescence thermometry for microscale spatial measurement resolution. Int. J. Heat Mass Transfer. 2003, 46, 3967–3974. [Google Scholar]
  9. Park, J. S.; Choi, C. K.; Kihm, K. D. Temperature measurement for a nanoparticle suspension by detecting the Brownian motion using optical serial sectioning microscopy (OSSM). Meas. Sci. Technol. 2005, 16, 1418–1429. [Google Scholar]
  10. Kim, I. T.; Kihm, K. D. Full-field and real-time SPR imaging thermometry. Opt. Letters. 2007, 32, 3456–3458. [Google Scholar]
  11. Roters, A.; Johannsmann, D. Distance-dependent noise measurements in scanning force microscopy. J. Phys. Condens. Matter. 1996, 8, 7561–7577. [Google Scholar]
  12. Naik, T.; Longmire, E. K.; Mantell, S. C. Dynamic response of a cantilever in liquid near a solid wall. Sens. Actuators A-Phys. 2003, 102, 240–254. [Google Scholar]
  13. Kim, S.; Kihm, K. D. Experimental verification of the temperature effects on Sader's model for multilayered cantilevers immersed in an aqueous medium. Appl. Phys. Lett. 2006, 89, 061918. [Google Scholar]
  14. Kim, S.; Kihm, K. D. Temperature dependence of the near-wall oscillation of microcantilevers submerged in liquid environment. Appl. Phys. Lett. 2007, 90, 081908. [Google Scholar]
  15. Paik, S. W.; Kihm, K. D.; Lee, S. P.; Pratt, D. M. Spatially and temporally resolved temperature measurements for slow evaporating sessile drops heated by a microfabricated heater array. J. Heat Transfer 2007, 129, 966–976. [Google Scholar]
  16. Bruun, H. H. Hot-wire Anemometry; Oxford University Press: London, 1995; pp. 19–70. [Google Scholar]
  17. Goldstein, R. J. Fluid Mechanics Measurements; Hemisphere Publishing Co.: Washington D.C., 1983; pp. 99–144. [Google Scholar]
  18. Lee, S. P.; Kauh, S. K. A new approach to enhance the sensitivity of a hot-wire anemometer and static response analysis of a variable temperature anemometer. Exp. Fluids. 1997, 22, 212–219. [Google Scholar]
  19. Tamayo, J. Study of the noise of micromechanical oscillators under quality factor enhancement via driving force control. J. Appl. Phys. 2005, 97, 044903. [Google Scholar]
Figure 1. Experimental near-wall correlation of the microcantilever peak resonance response frequency with aqueous medium temperature at four different separation distances (z = 5, 10, 20, and 40 μm) between the lower end of the cantilever and the glass substrate surface
Sensors 07 03156f1
Figure 2. (a) A micro-line heater design. (b) Schematic illustration of the microscale thermal environment with a microheater.
Sensors 07 03156f2
Figure 3. A schematic drawing of the near-field microscale thermometry in aqueous liquid using a tipless microcantilever and a microphotograph of the micro-line heater and cantilever.
Sensors 07 03156f3
Figure 4. Two-dimensional computational simulation domain of the microscale thermal environment and the detailed prediction of the temperature distribution.
Sensors 07 03156f4
Figure 5. Transient temperature measurements at z = 40 μm while the microheater temperature Th was maintained at 50 °C, 70 °C, or 90 °C.
Sensors 07 03156f5
Figure 6. Measured and calculated steady-state temperature profiles in the vicinity of the microheater surface.
Sensors 07 03156f6
Figure 7. Calculated near-field thermal sensitivity of silicon microcantilevers as functions of h/L2 for three different widths b = 20, 30, and 40 μm [14].
Sensors 07 03156f7

